
Abstract
Surveys have been used as main tool of data collection in many areas of research and for many years. However, the environment is changing increasingly quickly, creating new challenges and opportunities. This article argues that, in this new context, human memory limitations lead to inaccurate results when using surveys in order to study objective online behavior: People cannot recall everything they did. It therefore investigates the possibility of using, in addition to survey data, passive data from a tracking application (called a “meter”) installed on participants’ devices to register their online behavior. After evaluating the extent of some of the main drawbacks linked to passive data collection with a case study (Netquest metered panel in Spain), this article shows that the data from the web survey and the meter lead to very different results about the online behavior of the same sample of respondents, showing the need to combine several sources of data collection in the future.
Introduction
A Changing Environment
Participation in surveys has been declining. Many surveys do not manage to achieve high response rates or are not probability based (e.g., there are many opt-in web panels). This can threaten data representativeness. In addition, even the use of weighting “does not always guarantee that the sample is representative on a behavioral basis” (Fulgoni, 2014, p. 133). Besides, even if a highly representative sample can be achieved, and if all the best practices for survey research are implemented to maximize data quality, one key issue remains for collecting data about objective variables, such as behaviors, facts, or past events: the limitations of human memory. People cannot remember everything they did. As underlined by Kahneman and Riis (2005, p. 285), “an individual’s life could be described [ …] as a string of moments. A common estimate is that each of these moments of psychological present may last up to three seconds, suggesting that people experience some 20,000 moments in a waking day [ …] What happens to these moments? The answer is straightforward: with very few exceptions, they simply disappear.” In addition, when survey questions focus on past behavior, “it is not an experiencing self that answers, but a remembering and evaluating self, the self that keeps score and maintains records.”
However, what might not have been such a serious issue in the past becomes a much bigger problem nowadays because of the increasingly rapid changes in the environment. Indeed, some years ago, the number of events relevant for researchers or market companies was much smaller. There were fewer products, channels of communication, ways to participate politically, and so on. Moreover, each event lasted longer and the events were embedded in a broader context. For instance, when people wanted to buy a CD, they went to the store, maybe they met someone, looked at several CDs, and asked for help before finding what they wanted. Now, people can simply go on the Internet and download a song in a few clicks.
The changes are similar for social and political events. For example, in the past, people had to go to a specific place to vote. Nowadays, some elections allow voting online. What used to be an important ceremony, often shared with other family members, becomes a simple series of clicks. If a few months later, the person is asked the typical survey question “Did you vote in the last elections?” it seems more probable that the person would remember it if she or he went to vote in person than if she or he did it online.
In addition, the need to recall has changed. A few decades ago, people used to know their relatives’ telephone numbers because they had to key them each time they wanted to call. Now, the contacts are saved in their phones. A few decades ago, people used to know the birthday dates of their friends and family. Now, Facebook is taking care of that. A few decades ago, people tried to remember if they saw a product they liked in a shop. Now, they take a picture with their smartphones and look at it if they need to see the price or product characteristics again.
In this new environment, there are reasonable doubts about the accuracy of traditional survey data regarding objective variables. Memory is overwhelmed. There is a need for using other data sources, in particular for online behavior, which is the focus of this article.
Passive Data Collection
Passive data have already been used, for instance, to study news exposure in TV (Prior, 2009). But, with the expansion of the Internet and mobile devices, a lot of new data are already there, without having to ask people for anything except their consent to share this information with the researchers. Several companies (e.g., comScore) already maintain large behavior panels of computers and mobile devices across many countries in which the online behavior of individuals is passively and continuously measured.
The use of panels, instead of single surveys, makes it easier to build a relationship of trust with the respondents. This increases the probability of respondents agreeing to participate in passive data collection projects, which are often considered quite intrusive and generate various privacy issues. Besides, using panels allows respondents to be followed over time, providing more information on the participants, more complete demographics, and so on.
Passive data collection can take different forms, such as tracking credit card use or GPS information from mobile devices. For instance, Giannotti and Rinzivillo (2014) study the patterns of collective movement behavior and identify specific subgroups of travelers using mobility data from mobile phones and GPS tracking.
We are interested in one specific form: the use of a tracking application (called a “meter”) installed on the participants’ device to register their online behavior. The meter makes it possible to obtain information about all the URLs of the web pages visited by the participants, as well as the time and length of the visit, and ad exposure. For mobile devices, it also gives information about the use of apps. This allows mass data collection of users’ online activity.
Some research has been done already using a meter. For instance, Ochoa, Bretcha, Fusco, and Tomàs (2015) tracked the devices that pregnant women and recent mothers used to access the Internet, and defined different web surfing and app use patterns on mobile devices. Another example is Fulgoni’s study (2014), who uses the comScore behavioral panel to compare the online activity of members of ongoing survey panels with that of nonmembers and found that the online panel members are substantially heavier online users than the average Internet user.
Comparing Self-Reported Data and Other Sources
Several studies have investigated the extent to which using survey-based data rather than other data sources can affect the results of a research. Many of these studies come from business or medical sciences and compare self-reported data with administrative data (de Nicola & Giné, 2014) or data measured directly on participants. For example, Pursey, Burrows, Stanwell, and Collins (2014) compared height and weight as reported in an online survey and as measured by trained researchers and found a relatively high level of agreement between both.
Also, in other areas, previous research showed that even if the self-reported data differ significantly from the one of other sources, big errors were rare (see, for instance, the results of Otten, Littenberg, & Harvey-Berino, 2010, on television watching). Meanwhile, the correlation between data from different sources was strong, positive, and significant (see, for instance, Junco’s results, 2013, on the correlation between self-reported and actual time spent on Facebook). Nevertheless, there are also studies finding a low level of agreement between self-reported and other data sources (e.g., Boase & Ling’s study, 2013, about mobile phone use).
Overall, most of these studies use small sample sizes. Besides, the results are mixed. Depending on the specific variable of interest and on the nature of the source to which we compare it, different levels of agreement are found. So far, little is known about the differences in results on online behavior when using active data (survey answers) and passive data (collected through a meter), which is the focus of this article.
Research Question and Outline
The goal of this article is to investigate the use of metered data to complement survey data in order to study online behavior.
The next section presents the data and the method used to examine this question. The next section provides evidence on the extent of the main drawbacks of passive data collection at the moment. The next section then shows the potential of passive data, if the drawbacks are dealt with. Finally, the final section summarizes the results and discusses how the two sources of information could be combined in future.
Method and Data
The Netquest Declarative Panel
Netquest (www.netquest.com) is an online fieldwork company present in Spain, Portugal, and Latin America. Netquest recruits panelists by asking them, at the end of a short satisfaction survey proposed by different websites, whether they are willing to participate in market research projects. If the participants agree, Netquest makes use of this list of e-mail addresses to create an “invitation only” panel. The company is the first online panel provider accredited with the International Organization for Standardization 26362 quality standard for access panels in the region.
The Netquest Metered Panel
From 2005 to 2014, the Netquest online panel was purely declarative: All the information came from the questionnaires answered by the panelists. In 2014, Netquest started a metered panel, using a tracking application provided by Wakoopa (www.wakoopa.com). For this purpose, existing panel members were offered the installation of the meter in their devices. They received an incentive for the installation process as well as for each device for which they were sharing their online activity of each month (up to three devices; for more devices, the incentive remains the same).
At the start of 2015, Netquest metered panels had 13,500 members. The largest share was from Spain, with 5,700 panelists.
Comparing Passive and Active Data for a Given Sample
This study focuses on Spain. A sample of Netquest panelists who installed the meter for 2 months or more on at least one device were invited to participate in a survey carried out between May 27, 2015, and June 4, 2015. Age, gender, and education quotas were used in order to have similar distributions for these variables as in the metered panel. The objective was to obtain 600 complete surveys.
The survey consisted of two main parts. The first part, asking for information about the devices used by the panelists to go online (e.g., how many PCs, tablets, smartphones they use and how often; whether these devices are shared with others, and, if so, with whom, etc.), was used to study the extent of some of the limits of passive data collection. The second part, focused on the panelists’ online activity using a specific device on which the meter is installed (e.g., last five visited websites, five websites visited most often, five websites on which most time is spent, or visits to specific, listed websites), making it possible to compare what people do with what people state that they to do, using panelists involved both in answering surveys and equipped with a meter.
This represents a rare opportunity to compare passive (URLs registered by the meter) and active data (answers from the survey) for the same sample of panelists. In particular, Netquest is the only panel so far in the region that systematically collects data by means of both questionnaires and a meter installed in the same panelists’ devices.
Passive Data Collection Still Shows Considerable Limitations
Selection Bias in Who Agrees to Participate
A first key limitation consists of selection bias: First, in the Netquest metered panel, only panelists who have participated in at least 10 surveys are invited to install the meter. In addition, depending on the country and sociodemographics, only 30–50% of the invited panelists agree to install the meter, and we expect nonparticipants to have different characteristics to participants. Filtering and weighting procedures do not usually make it possible to get rid of all bias (van Dam, van Ossenbruggen, & Voorend, 2012).
In particular, privacy aspects are often mentioned as a barrier to tracking people’s activities (Barris, 2014; Federal Trade Commission, 2014; Sableman, 2014). Although nonparticipation also exists when collecting data through surveys, in particular web surveys, selection bias can be even stronger in the case of metered panels, because more people are concerned about their privacy.
Table 1 shows the distributions of several background variables in the general population, the population of Internet users, and the sample of 600 panelists used for this study. For age, gender, and education (our quotas), this sample has a similar distribution to the overall Netquest metered panel.
Distributions in the General Population, for the Population of Internet Users, and in the Sample of 600 Metered Panelists (in %).
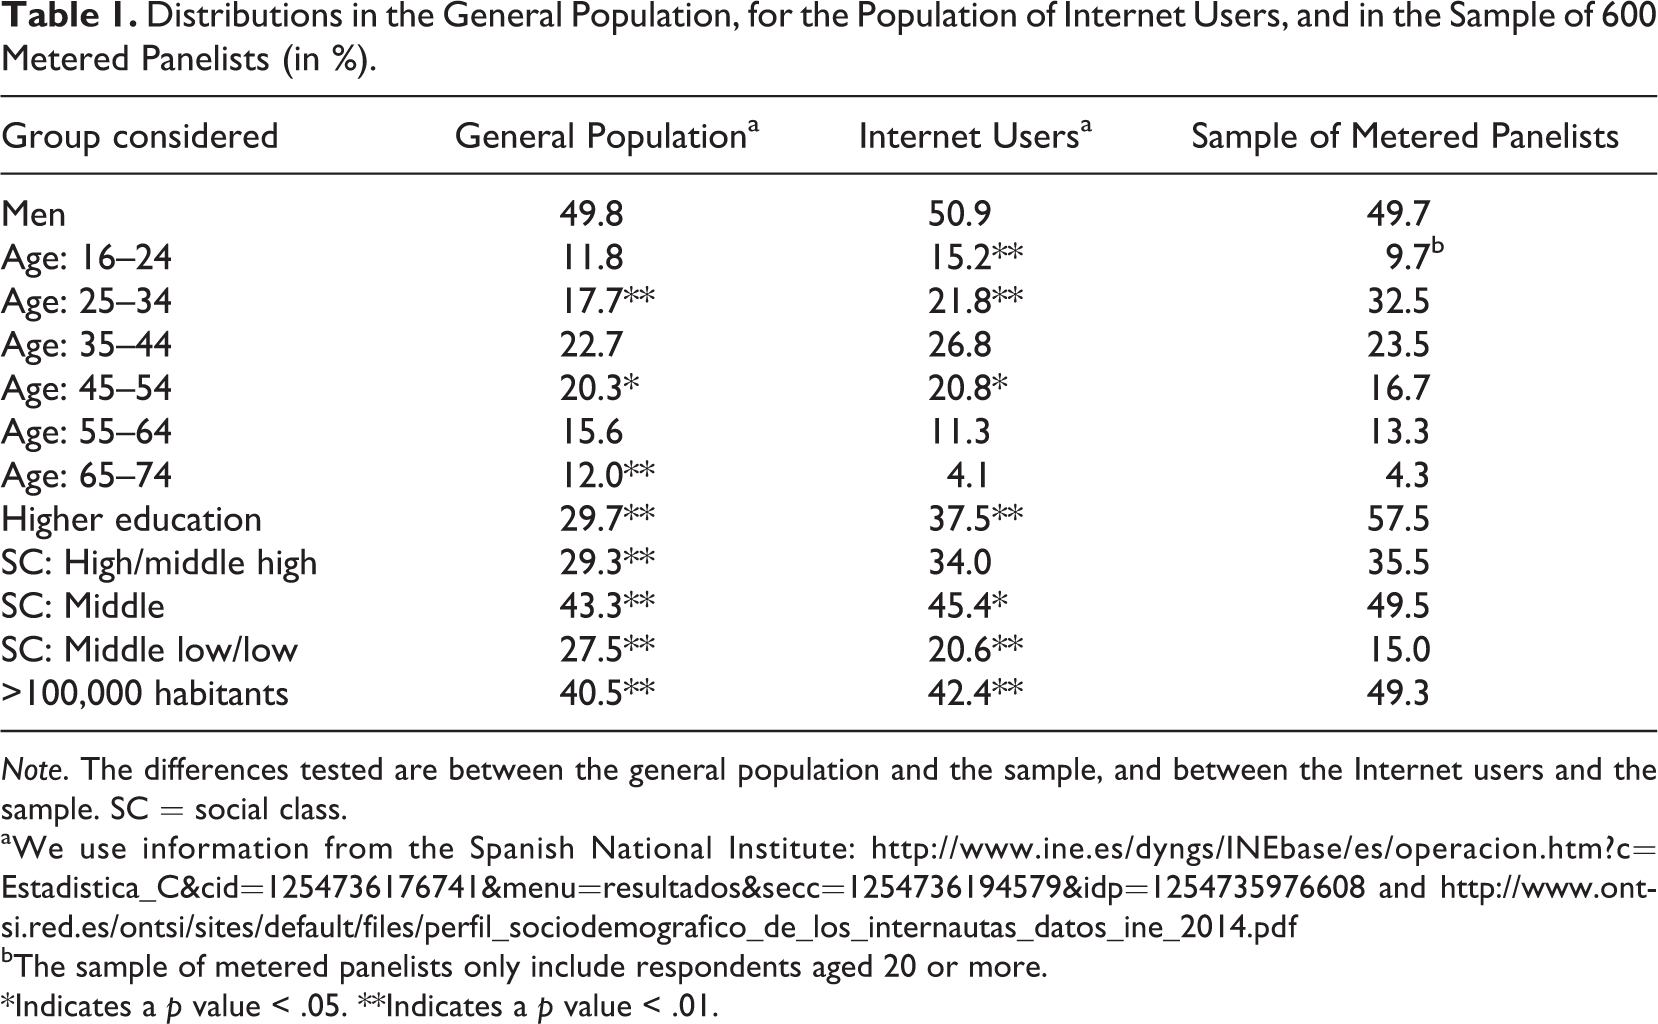
Note. The differences tested are between the general population and the sample, and between the Internet users and the sample. SC = social class.
aWe use information from the Spanish National Institute: http://www.ine.es/dyngs/INEbase/es/operacion.htm?c=Estadistica_C&cid=1254736176741&menu=resultados&secc=1254736194579&idp=1254735976608 and http://www.ontsi.red.es/ontsi/sites/default/files/perfil_sociodemografico_de_los_internautas_datos_ine_2014.pdf
bThe sample of metered panelists only include respondents aged 20 or more.
*Indicates a p value < .05. **Indicates a p value < .01.
Compared to the general population, in the sample of metered panelists, the oldest age-group and “middle low/low” social class groups are underrepresented, while 25- to 34-year-olds, people living in city of 100,000 habitants or more, the more highly educated and the upper and middle social classes are overrepresented. Compared to the Internet users, there are fewer differences, but some groups are still overrepresented, particularly 25- to 34-year-olds, the more highly educated, and the residents of large cities.
It is therefore dangerous to make inferences from the results found for the sample of metered panelists to all the Internet population, and even more so to the general population. However, for many market research projects, the population of interest is not the general population, but, for instance, a subpopulation of consumers of a given product.
Observation of Only Part of the Activity
Number of devices used and devices with a meter installed
A second important limitation is that only part of the panelists’ online activity might be observed if they install the meter on some devices, but not on all the ones they use to go online. In order to evaluate how important this issue is in practice, we asked in the survey for an indication of all the devices panelists use to go online at least once a month and whether the meter is installed for each of them.
Table 2 reports the proportions of panelists who use a number x of desktops, laptops, tablets, and smartphones at least once a month to go online (“all” columns) and the proportions of panelists who have installed the meter in x of the devices of each kind (“with meter” columns).
Percentages of Panelists (N = 600) Who Use x Devices of Each Kind to go Online at Least Once a Month (“All” Columns) and Percentages of Panelists Who Have Installed the Meter in x Devices of Each Kind (“With Meter” Columns).
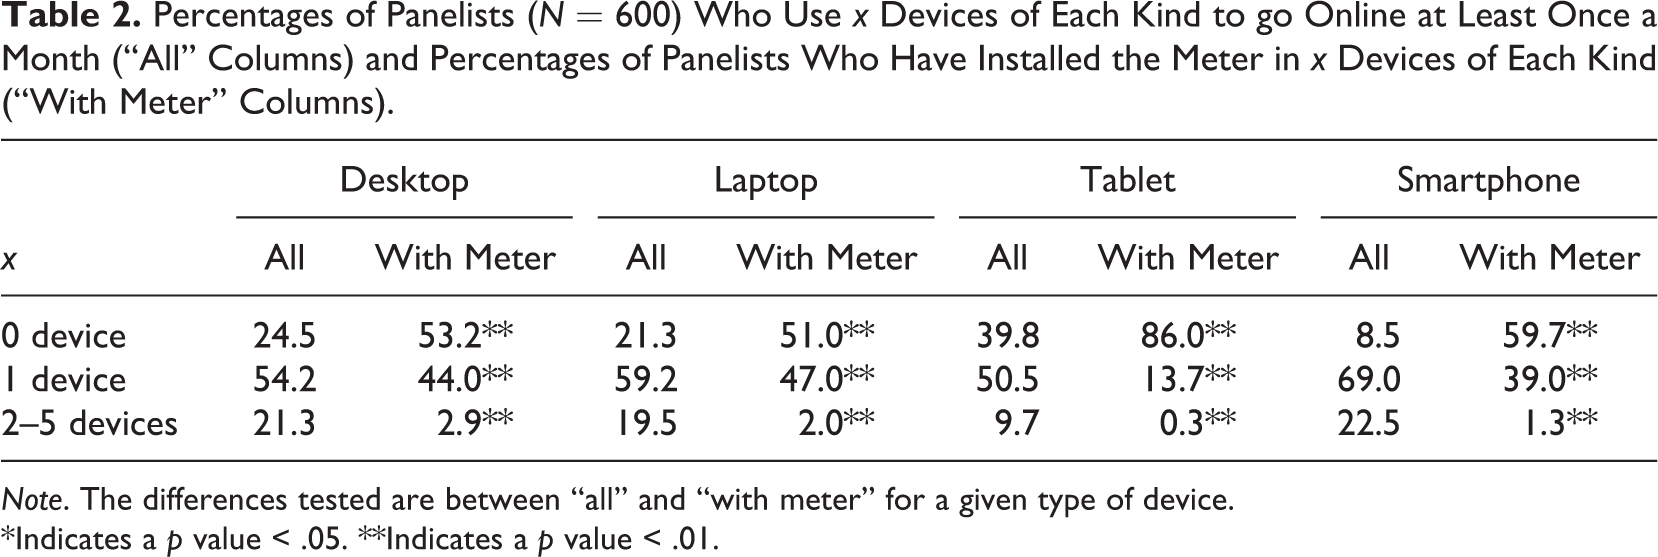
Note. The differences tested are between “all” and “with meter” for a given type of device.
*Indicates a p value < .05. **Indicates a p value < .01.
Most panelists use multiple devices: 21.3% use at least two desktops, 19.5% at least two laptops, 9.7% at least two tablets, and 22.5% at least two smartphones.
Nevertheless, panelists do not install the meter in all the devices they use. For instance, 53.2% of the panelists did not install the meter on any desktop, whereas only 24.5% have no desktop. For tablets, and most of all smartphones, the differences are even greater. For example, 59.7% of the panelists did not install the meter on any smartphone, whereas only 8.5% really do not go online through a smartphone. Thus, slightly more than half of the panelists use one (or more) smartphone(s) to go online, but their smartphone activity cannot be tracked at all (as they did not install the meter in any smartphone).
For each panelist, we also compute the total number of devices used and the total number of devices on which she or he has installed the meter. Figure 1 presents the results.
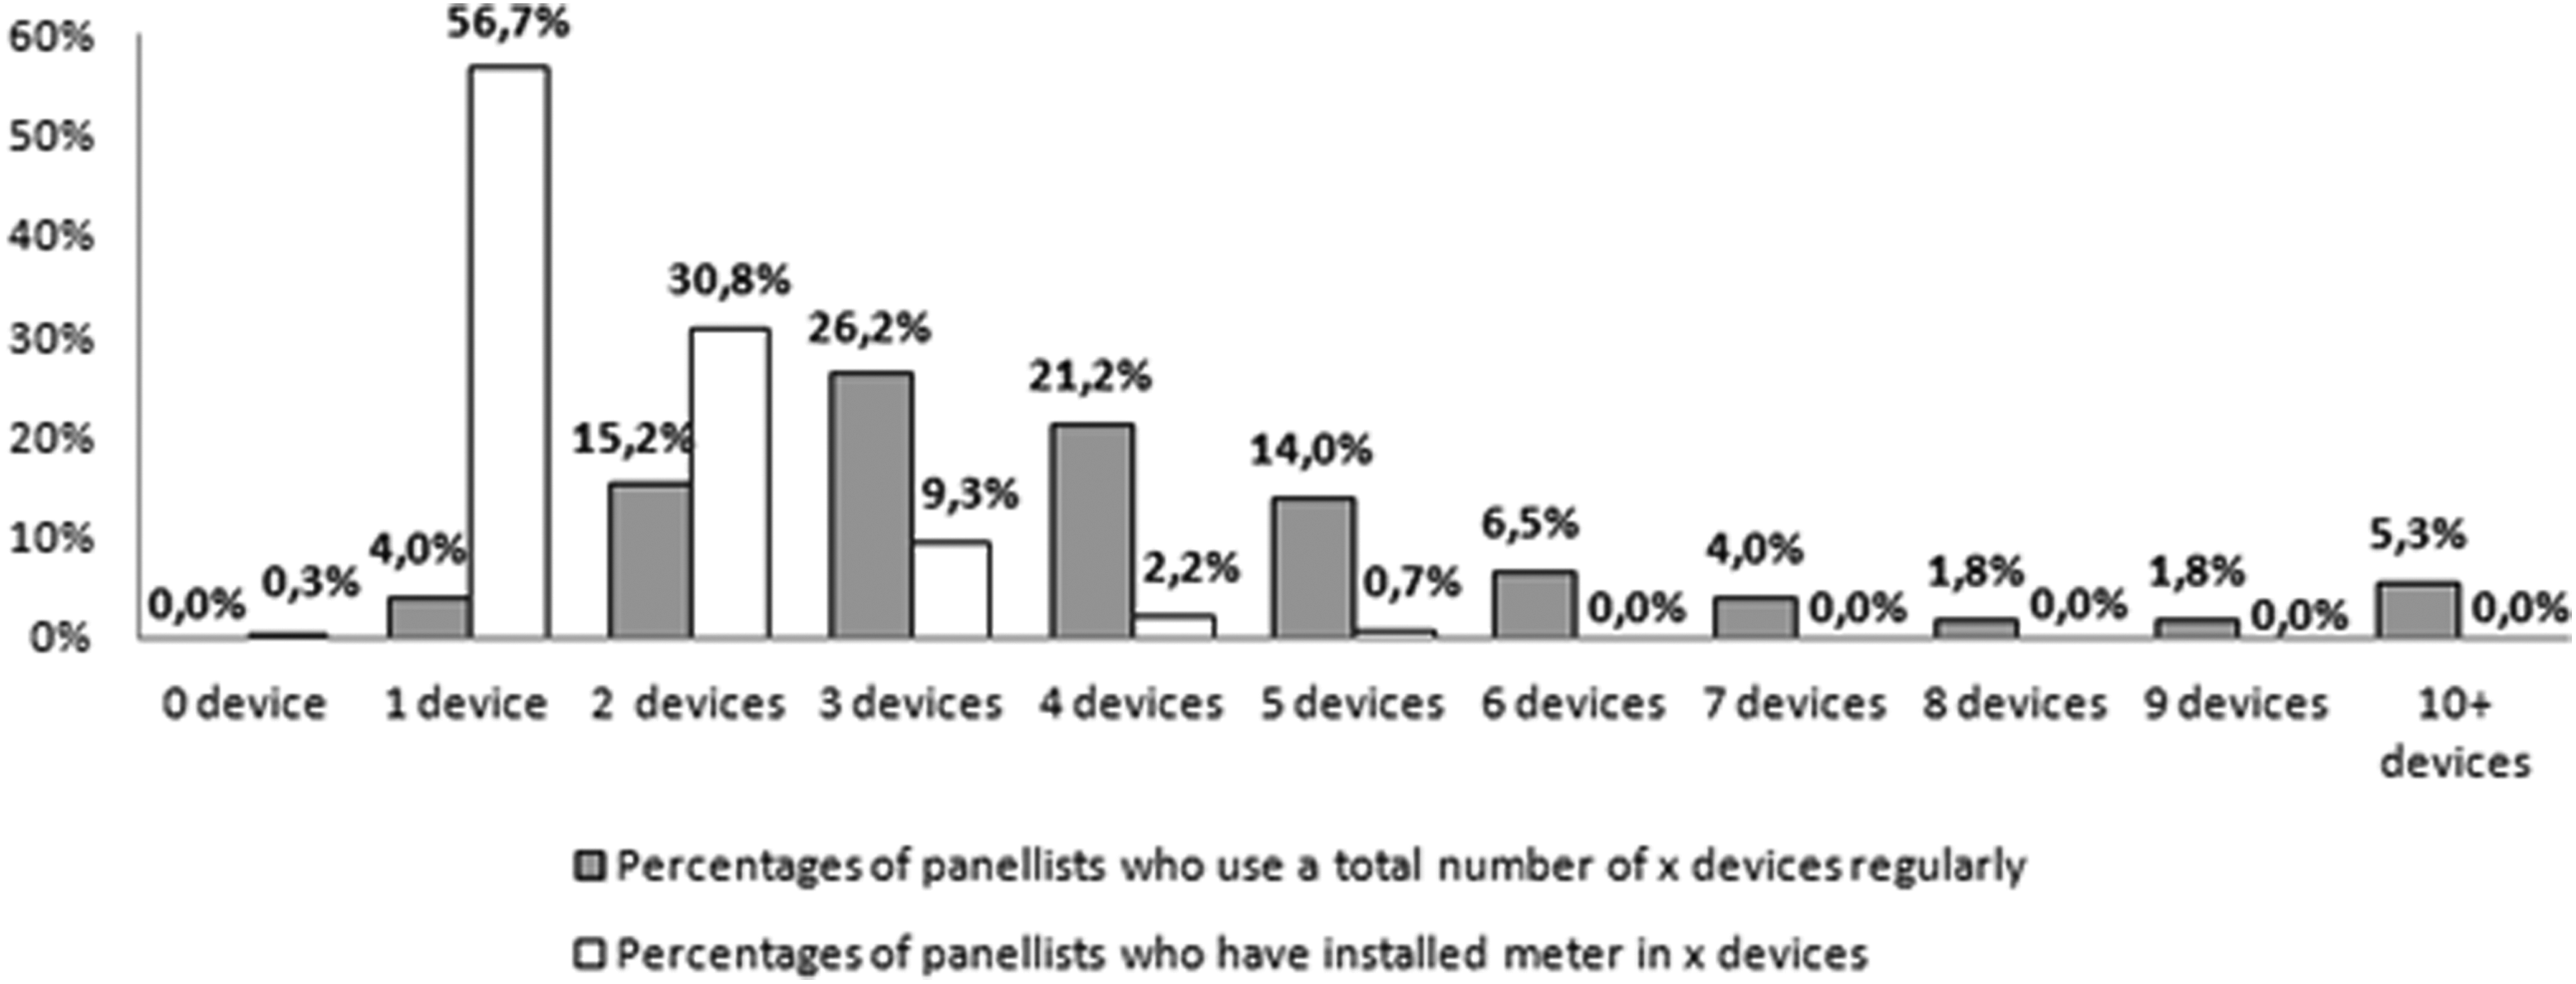
Comparing proportions of panelists using a total of x devices and panelists with the meter installed on x devices (x goes from 0 to “10 or more”).
On one hand, whereas only 4% of the panelists use only one device to go online, almost 57% of them installed the meter in only one device. On the other hand, whereas 19.4% of the panelists use six or more devices in total, no panelist at all installed the meter on more than five devices. These huge differences clearly indicate that the online activity tracked with the meter represents only a limited part of the overall online activity.
This is currently a key limitation to passive data collection. However, there are ways to improve it in the future, although we can expect that there will always be some devices that will not be tracked (e.g., libraries): for instance, by working out a better incentive system, or by giving the panelists better information about the importance of installing the meter on all the devices they use.
Time spent on the Internet in total and for devices with the meter installed
To estimate which proportion of the panelists’ overall online activities the nonobserved activity represents, the survey asked about the time spent on the Internet on an average weekday, both in total and for the devices on which the meter is installed. Table 3 gives the mean and median time in minutes for all devices and for the ones with the meter installed, as well as the difference.
Mean and Median Time in Minutes for All Devices and for the Ones With the Meter Installed and Difference Between All Devices and Devices With the Meter.
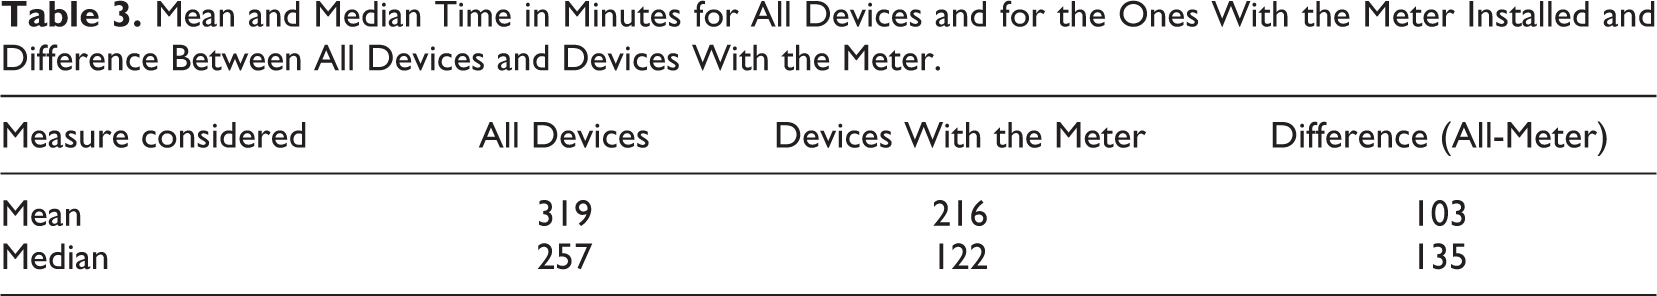
There is a significant difference in mean (103 min) between the total time spent on the Internet on an average weekday and the time spent on the devices with the meter installed. If we consider the median, the difference is even larger: 135 minutes per day. The median time spent on the Internet is twice larger in total than for the devices with the meter installed. We should notice that giving an estimation of the time spent on Internet is a difficult question and that high measurement errors may be expected. However, we compare two similar estimates in consecutive survey questions. Thus, it seems reasonable to assume that similar errors affect both questions and that the difference between the two answers really indicates that panelists think that they spend much more time on Internet in total than on the devices on which they installed the meter. Overall, an important part of online activity is not observed.
Other causes of unobserved data
Besides the fact that panelists can use more devices than the ones with the meter installed, there are other reasons why the observed activity may not be complete. On one hand, in the case of mobile devices with iOS system, information can be lost if the panelists connect to the Internet through a different Wi-Fi connection without configuring a new proxy. On the other hand, for PCs, the panelists have two options that allow them to limit the information they share with the researchers: First, they can create a list of websites for which the URL will never be registered by the meter. Second, they can “pause” the meter to navigate without sharing data and turn it on again only when they want to share again their information.
We do not have information on how often these options are used by the panelists, but we expect their use to be linked to sensitive Internet activities that panelists may feel uncomfortable sharing with the researchers. However, a similar or even greater bias is expected for survey data (social desirability bias; Krosnick, 1991).
Shared Devices
Another issue is that the meter can be installed on devices used by multiple users, not only the panelists. In order to investigate how often this is happening, respondents were asked, for each device they use at least once a month to go online, to indicate who used it: (1) only the respondent; (2) mainly him or her, but others use it occasionally; (3) different people including the respondent use it equally; or (4) mainly others, the respondent uses it only occasionally.
Using this question, first, we learn that panelists tend to install the meter more often on devices for which they are the sole user. Second, focusing on the devices with the meter installed, we looked at the proportions of shared devices.
Figure 2 presents, for the nth desktop, laptop, tablet, or smartphone, the percentages of respondents who chose each answer category. We report the results for the first or first two devices of each type because the number of observations for the others was too low to give meaningful results (<10).
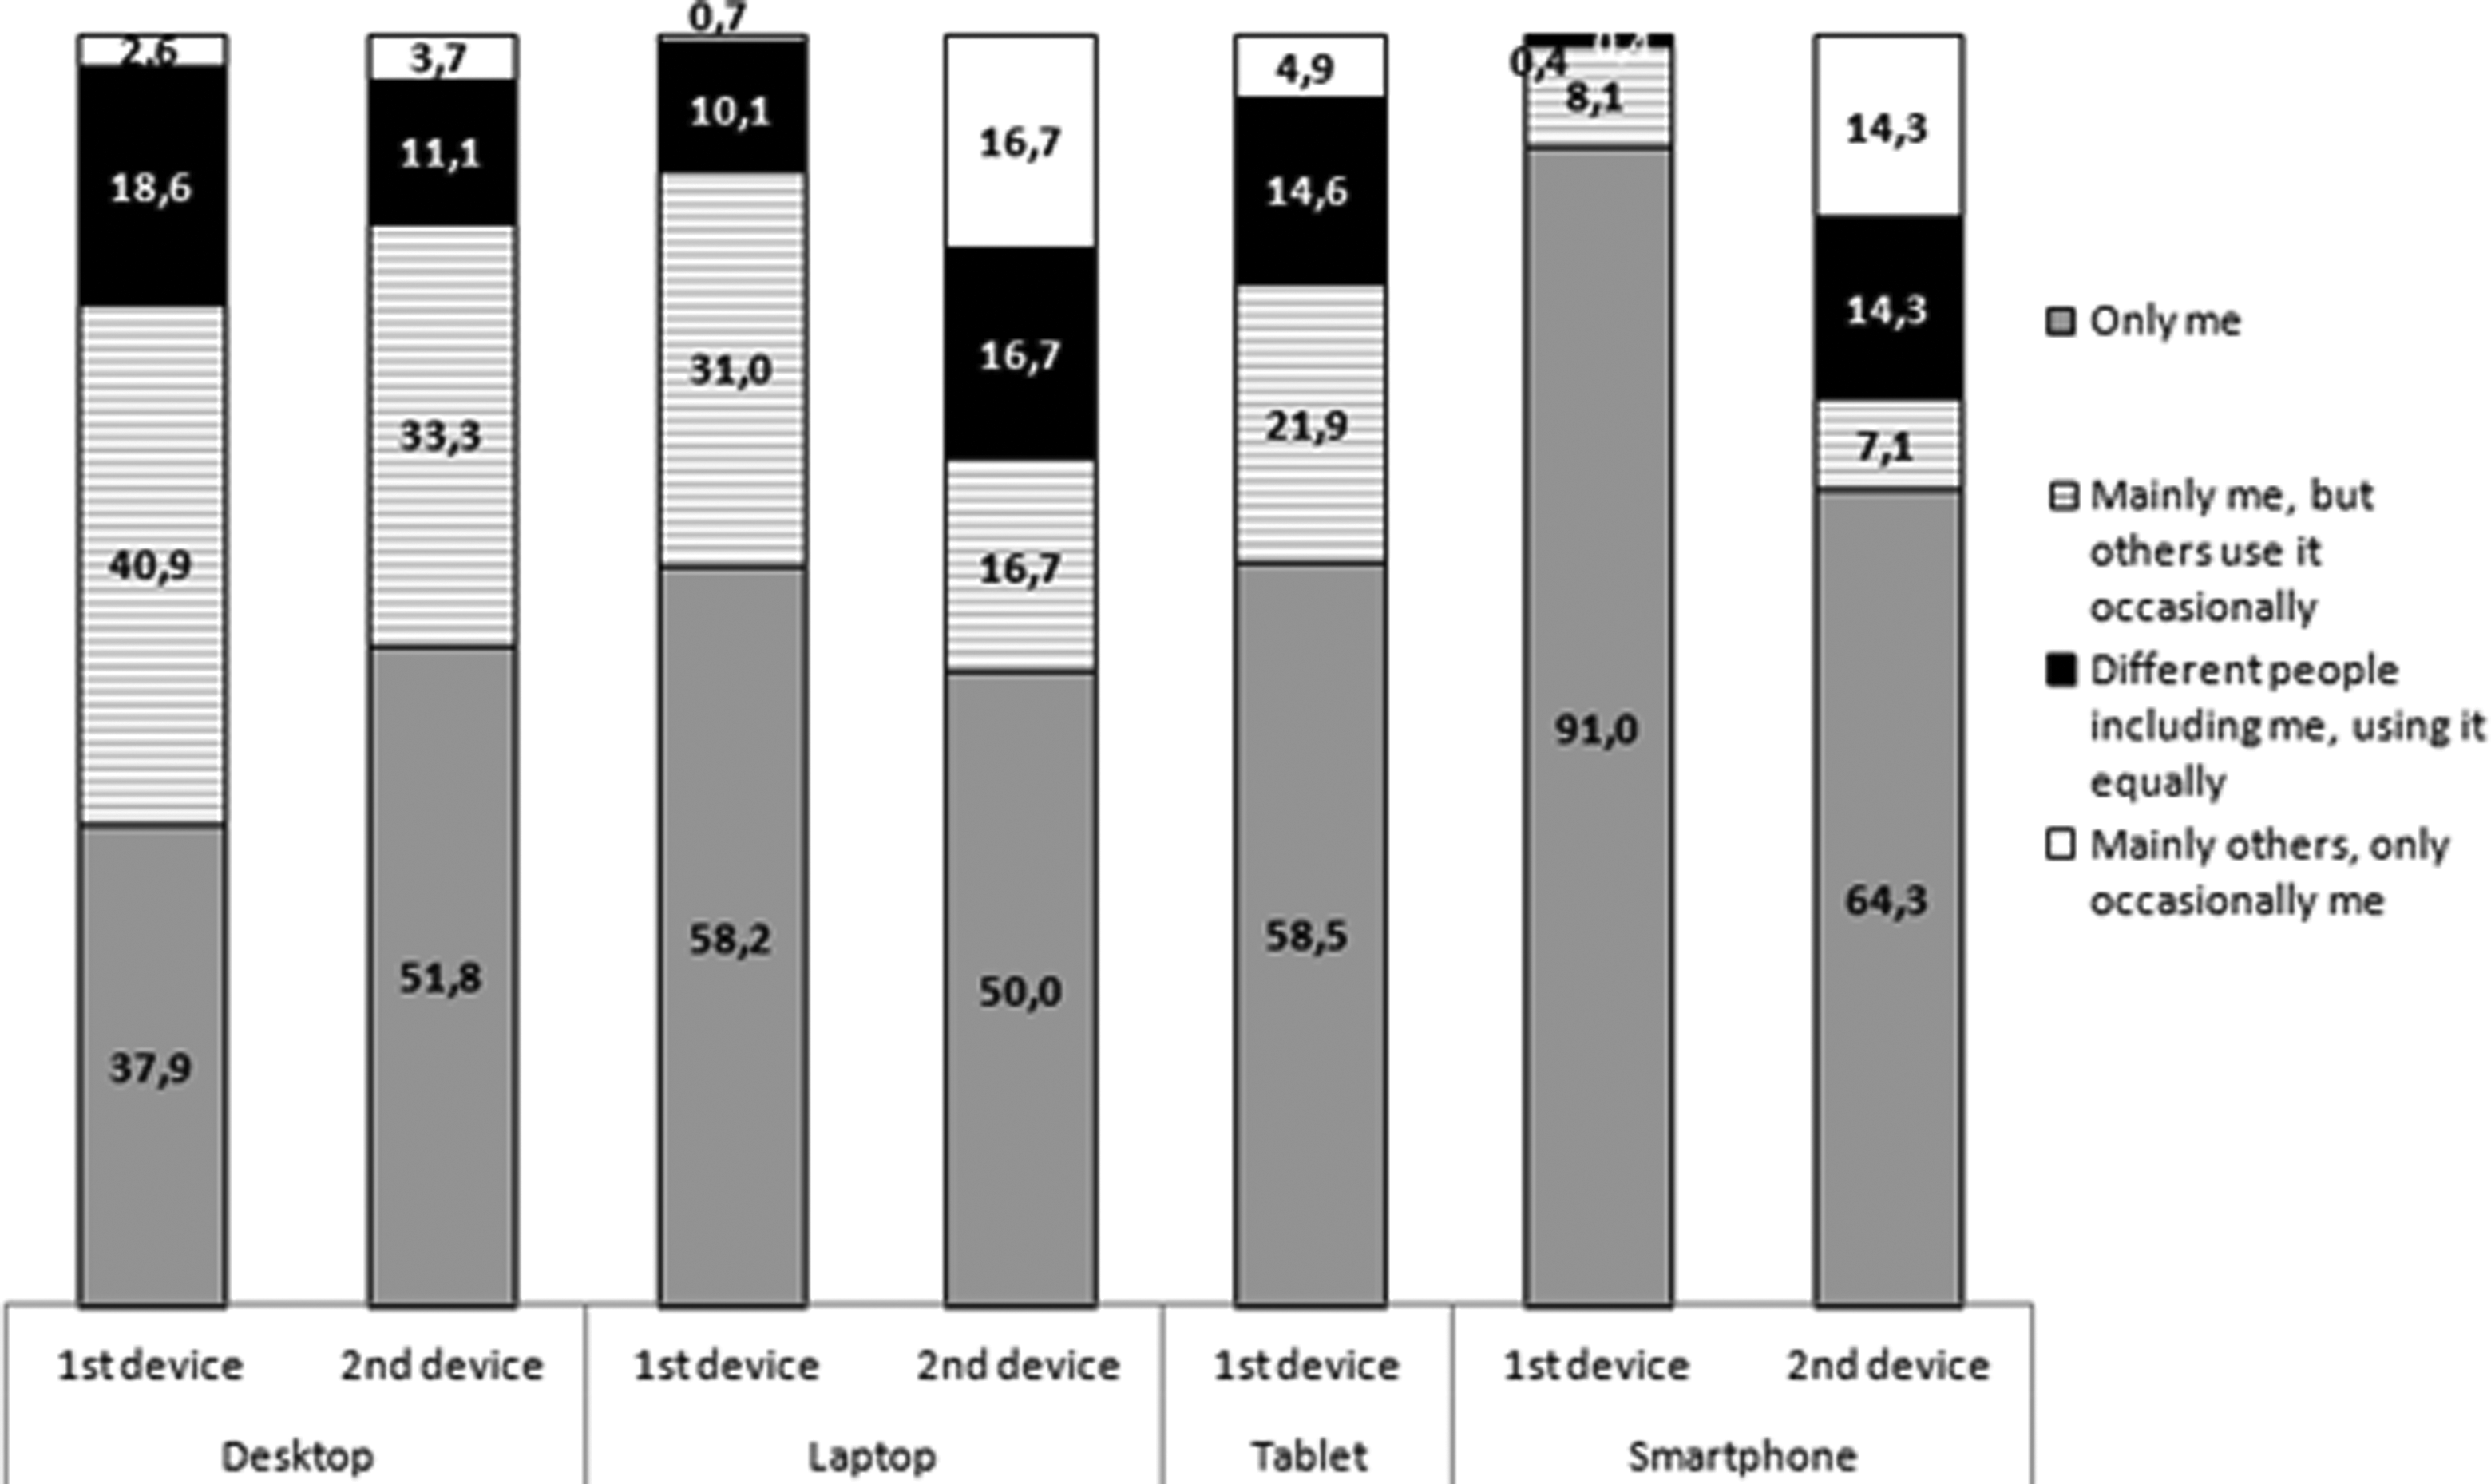
Percentages of respondents who chose each of the four answer categories for the n th desktop, laptop, tablet, or smartphone (n = 1 or 2).
For the first device of each type with the meter installed, more than 60% of desktops, 40% of laptops and tablets, and 9% of smartphones are shared. For the second device, the proportions are somewhat different, but the overall pattern is similar: A high proportion of PCs (desktops/laptops) and tablets are shared, whereas smartphones are not shared so much. For the first smartphone, even when it is shared, the panelist is still the main user in almost all cases. This is quite different for the second smartphone, where up to 28.6% of the devices are used equally or mainly by others than the panelist. Also for PCs and tablets, a nonnegligible proportion of the devices with the meter installed are equally or principally used by others.
Part of the observed online activities in the passive data should therefore not be attributed to the panelists but to other users of the same devices. At an aggregated level, this may not be a problem, if one is interested, for instance, in how much visibility a website has. Then, it may not be necessary to know who visited the website, only that someone did. However, the representativeness of the sample may be affected. Moreover, this is a problem in studying activities at an individual level and in using sociodemographics to explain/correlate with observed behaviors. Then, the presence of shared devices can really disturb the conclusions.
Further research is needed to reduce the potential burden of shared devices in the passive data. There are several possible solutions to be investigated: One might think of algorithms to detect whether the online activity observed is the panelist, using, for instance, information about the profile of the different users of a given device. One might also encourage panelists to log in a separate profile.
Limited Information Available and Difficulties in Analyzing the Data
Even if the previously mentioned limitations could be overcome, there would still be the problem that the information provided by the meter is limited. In our case, it consists of a list of all the URLs visited and apps used, but it does not include the content of a website. For instance, it is possible to detect if a person connected to Facebook and looked at his or her own Facebook wall, but not if she or he posted something or liked someone else post.
Also, the amount of information can quickly become very large: The total amount of page views in our sample, during the last 7 days before the survey, reaches a maximum of 21,920 for PCs and 2,739 for smartphones; the median being 1,072 for PCs and 142 for smartphones. Considering the number of unique websites visited in our sample, in the last 7 days, the maximum is 450 for PCs and 220 for smartphones; the median being 59 for PCs and 22 for smartphones.
Moreover, the format in which the information is obtained can be difficult to analyze. For example, the metered data can be used to detect visits to a specific website. However, if one wants to know if the person bought a product, for each website, this information may be provided in the URL in a different way, so it is necessary to identify first how to detect whether someone bought a product.
Overall, today only some behaviors or facts can be studied using a meter and most of the analyses are time consuming and difficult to carry out. In the next few years, more experience needs to be accumulated and tools making these analyses more efficient need to be developed if passive data are to be used more frequently.
But Passive Data Can Provide Useful Information
So far, we have seen that passive data collection through a meter still suffers many limitations. Much more research is needed in order to find ways to improve the current situation and overcome some of the main challenges that limit the possibilities of getting key insights through this kind of data.
Nevertheless, the main source of data used until now—the survey—also suffers important limitations, in particular when used to study objective online behavior, and because of the explosion of events relevant to researchers wanting to study them. Respondents cannot remember everything they did online to report it accurately when researchers send them a survey.
Method
Using the data described in the second section, we set up an experimental design to minimize the passive data collection issues we have mentioned in the following way: – We compare the survey answers with the metered data for the same sample of panelists. This sample may not be representative of a more general population, but our focus is not on making inferences. We want to study whether similar information is obtained for a given group of panelists when using different sources of data. We compare only panelists who have installed the meter for 2 months or more and have completed the relevant survey. – We run the analyses for each device separately. Thus, even if the panelists also use devices on which the meter is not installed, this cannot affect the comparison between both sources. In the questionnaire, we explicitly ask for Internet activities through each of the devices with a meter. In the passive data, we focus on the corresponding devices. – We study only the panelists who have a maximum of one PC (desktop or laptop), one tablet, and one smartphone with the meter installed, to be sure that the device observed using the meter is the same as the one declared in the survey. – We focus only on the devices for which the panelists stated they were the only user, to avoid the problem of shared devices. – We study PCs and smartphones, but not tablets, because of the low number of observations. – We work at website level by grouping all URLs for a given website together.
In addition, respondents were randomly assigned to a “short-time condition,” in which the time frame for several of the questions was “the last 7 days,” or a “long-time condition,” in which the same questions were asked for “the last 2 months.”
Spontaneous Recall of Websites Visited
Limits of human memory
First, we study the last five websites the respondents visited using a given device just before the point when they started the survey. By asking for what happened just before the survey, we expected to limit the memory issue.
For PCs, the metered data indicate that less than 10% of the last five websites were visited more than 1 day before the start of the survey. The oldest visits happened 7 days before the start of the survey. For smartphones, to get the last five visited websites, up to one third of the panelists had to recall activities that happened more than 1 day before the survey started and, in the worst case, they had to remember visits from 2 months before the survey. This unexpected difference between PCs and smartphones may be related to the limits mentioned previously (e.g., the fact that for smartphones with the iOS system, information can be lost if the panelists connect through a different Wi-Fi without configuring a new proxy). However, further research is needed to understand this better. Because of it, we expect more memory issues when comparing results for smartphones, as well as greater multitasking and greater loss of context in the case of smartphones.
The information in the survey was obtained by asking: “What are the last five websites you visited before starting the survey using the [device name chosen by the respondent] device?”
This information was compared to what is observed in the metered data for the same device. We computed the number of matches between both sources of data. We considered that we had a match if the same website appeared in both sources, independently of the exact position. Thus, if a panelist said Google in Position 3 in the survey and we observed Google in Position 5 in the metered panel, this is counted as a match.
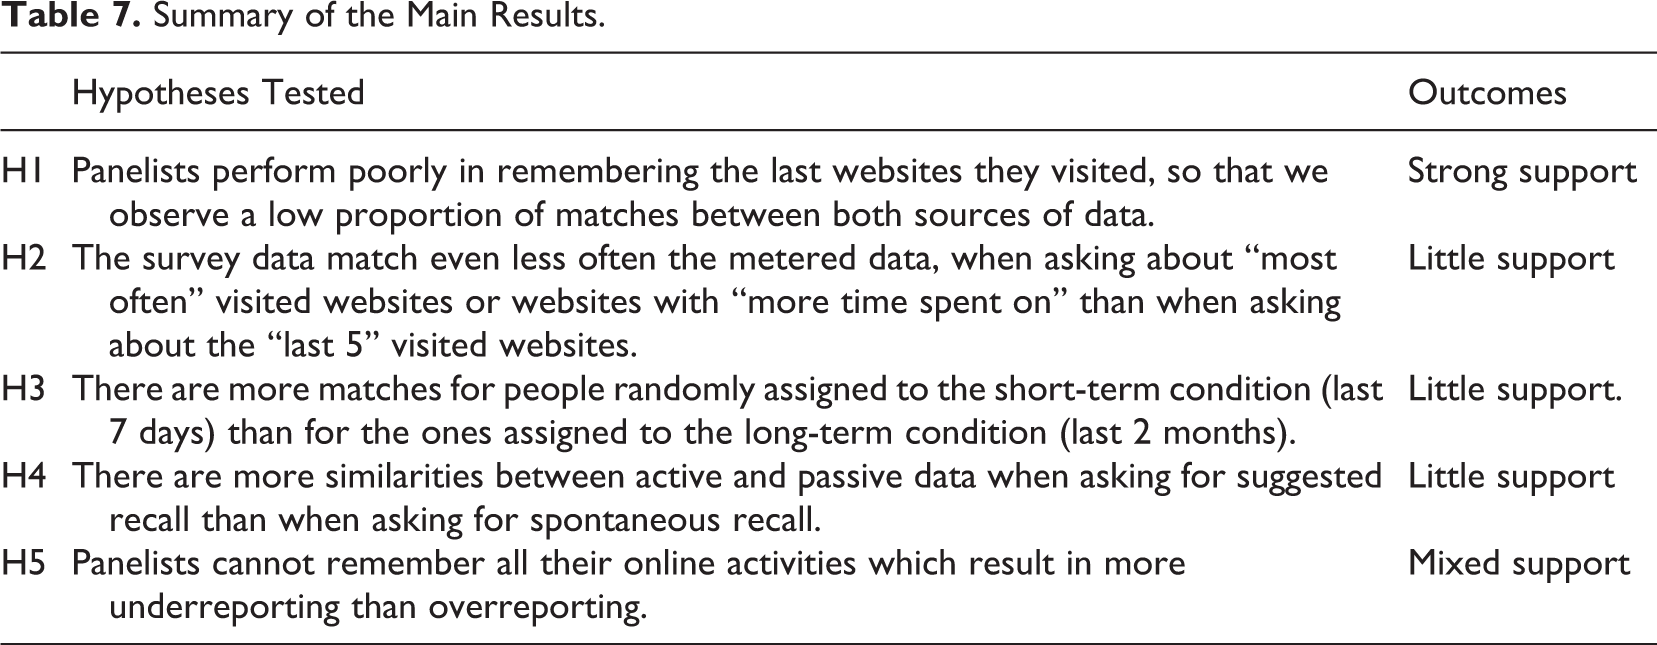
Our first hypothesis is that, because of the overwhelming of memory and multitasking, and because people do not try to remember this information, panelists will perform poorly in remembering the last websites they visited, so we will observe a low proportion of matches between the two sources of data
Proportions of Respondents for Whom 0–5 Websites Appear in Both Sources.
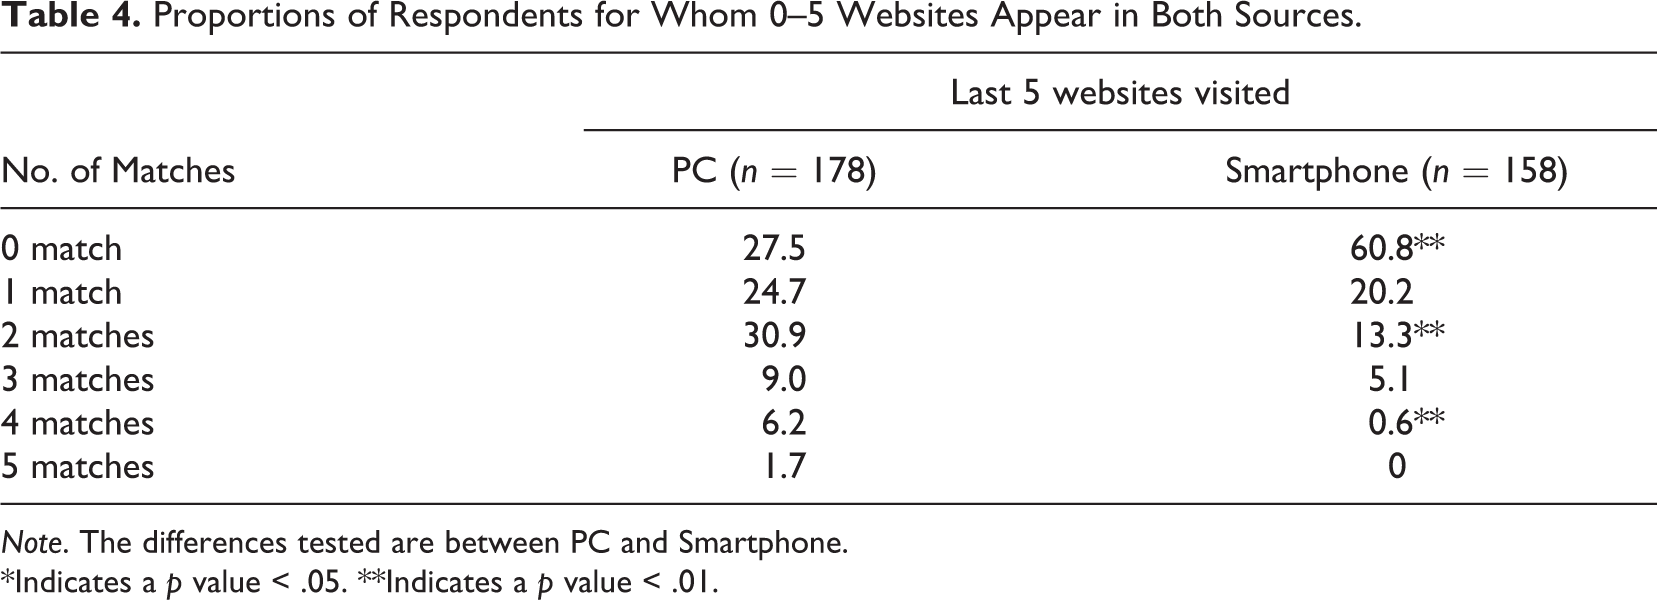
Note. The differences tested are between PC and Smartphone.
*Indicates a p value < .05. **Indicates a p value < .01.
For the PCs, only 1.7% of the panelists gave the five same websites in the survey as the ones observed in the metered data, only 6.2% gave four out of the five, and only 9.0% gave three out of five. For smartphones, these proportions are even lower: 0%, 0.6%, and 5.1%, respectively. On the other hand, no matches at all are observed for 27.5% of the panelists for the PCs. This goes up to 60.8% for the smartphones. Thus, we find strong support for the idea that panelists remember poorly the last websites they visited.
Shorter or longer period
Rather than the last websites visited, researchers are interested in visit traffic (number of visits) and visit engagement (time spent during each visit). As pointed out by Jianga, Tanb, Phangc, Sutantod, and Wei (2013), “competition for consumers to visit company websites has intensified in recent years. An important indicator of website popularity (and consequent survival) is the extent to which the website can draw consumer visits vis-à-vis other websites (p. 752).” The authors argue that it is crucial to identify popular websites from unpopular ones to consider both visit traffic and visit engagement.
Thus, for each device on which the meter is installed, we also ask in the survey “What are the five websites you spent the most time on during the last 7 days/2 months?” and “What are the five websites you visited most frequently during the last 7 days/2 months?”
Then, we compute the number of matches as previously. Answering such questions in a survey requires not only recall of what one did but also the time spent or the frequency of visits. These are very demanding questions in terms of memory and cognitive effort for the respondents. Thus, we expect the survey data to match the metered data even less often (Hypothesis 2).
Besides, we expect (Hypothesis 3) more matches for people randomly assigned to the short-time condition (last 7 days) than for the ones assigned to the long-time condition (last 2 months). Indeed, it seems easier to recall and process what was done in a shorter period closer to the survey than for a longer period. Table 5 presents the proportions of panelists for whom 0–5 matches are found.
Proportions of Respondents for Whom 5 Websites Appear in Both Sources.
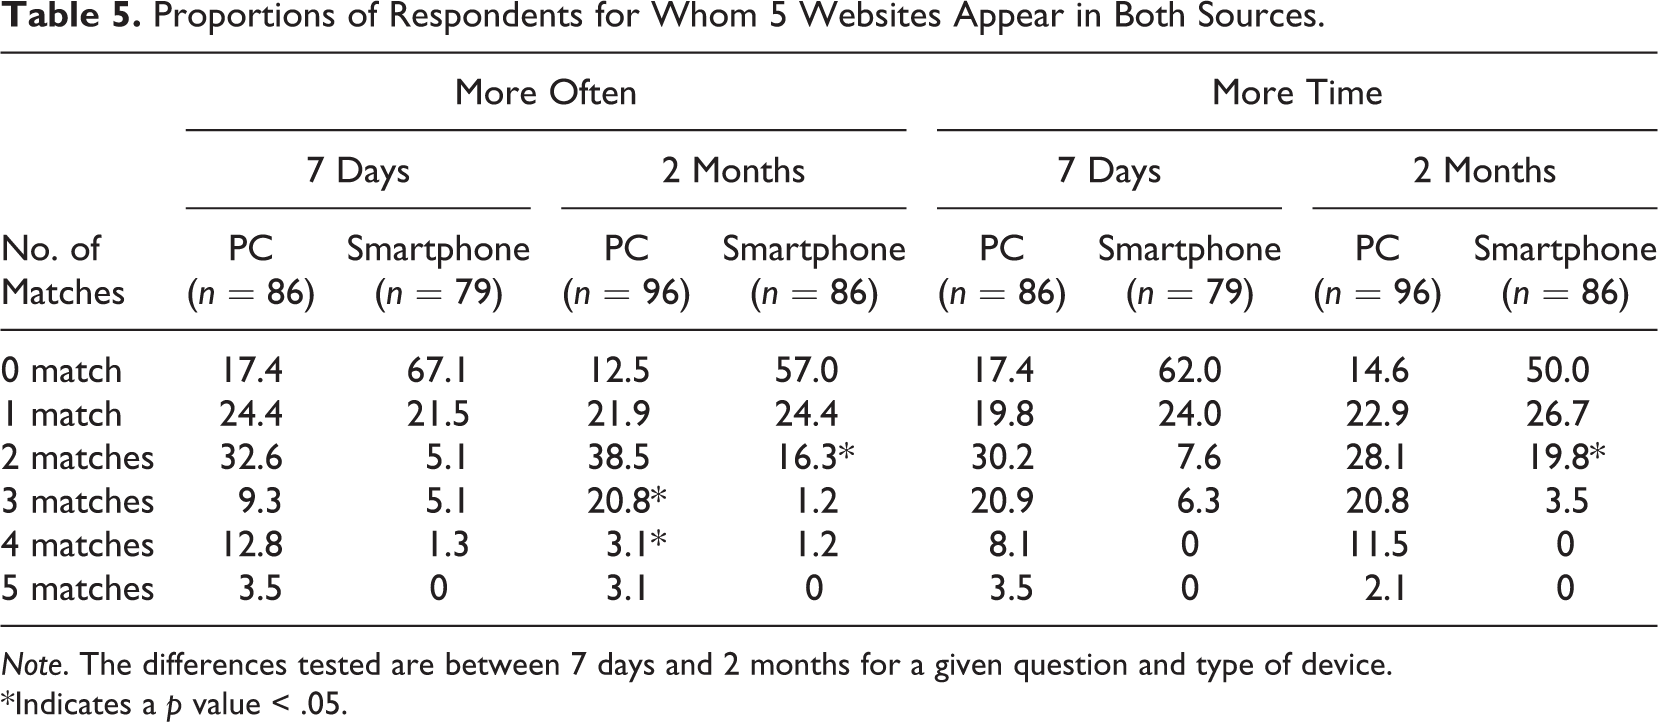
Note. The differences tested are between 7 days and 2 months for a given question and type of device.
*Indicates a p value < .05.
The hypothesis that the survey data will match the metered data even less often when asking about the websites visited more often or on which more time is spent than when asking about the last five visited websites gets little support: Even if the questions seem more demanding cognitively, overall, both sources of data differ less when asking about the websites visited more often or on which more time is spent. We do not observe a higher proportion of respondents with 0 matches or a lower proportion with 4–5 matches. Still, the mismatches between passive and active data are huge.
Concerning the hypothesis about short-time versus long-time conditions, little support is found either. We do not find that the 7 days condition leads to more similarities across data sources than the 2 months condition. There is even always a higher proportion of panelists with 0 matches in the 7 days condition (although the differences are not significant; p > .05), while there are similar proportions with five matches. Further research is needed to understand why this happens. What is clear is that the information obtained through the survey and through the meter differs significantly. This is probably linked to human memory limitations and the respondents’ cognitive burden during survey participation.
Suggested Recall
Next, the differences between passive and active data for a list of suggested websites are studied. The websites were selected from the top websites visited according to information from the overall Netquest metered panel in Spain.
Respondents were asked whether they visited each of 14 websites in the last 7 days/2 months on a given device. In a randomized order, the sites were atrapalo.com, amazon.com/amazon.es, ebay.com/ebay.es, groupon.es, booking.com, elcorteingles.es, segundamano.es, milanuncios.com, travelclub.es, trivago.es, wikipedia.org, youtube.com, wordpress.com, and lacaixa.es. The answers were compared to the observations from the metered data. We expect more similarities between both sources when asking for suggested recall (Hypothesis 4), as panelists only have to focus on remembering visits to a given website.
The two sources of data may differ in two ways: (1) overreporting of visits in the survey, that is, panelists stated in the survey that they visited a website using a given device but the passive data did not indicate any visit to this website on the corresponding device or (2) underreporting of visits, that is, the panelists stated in the survey that they did not visit a website using a given device but the passive data indicated that they did.
Our hypothesis is that panelists cannot remember all their online activities, because of the overwhelming of memory, and so on, which will result in greater underreporting (Hypothesis 5).
Table 6 gives the proportions of panelists who over- or underreported their visits. The websites are ordered by proportions of panelists visiting them according to the metered data for the “PC last 7 days” group.
Over and Underreporting for PCs and Smartphones, in the Short- and Long-Time Conditions, for Each of the 14 Websites (in %).
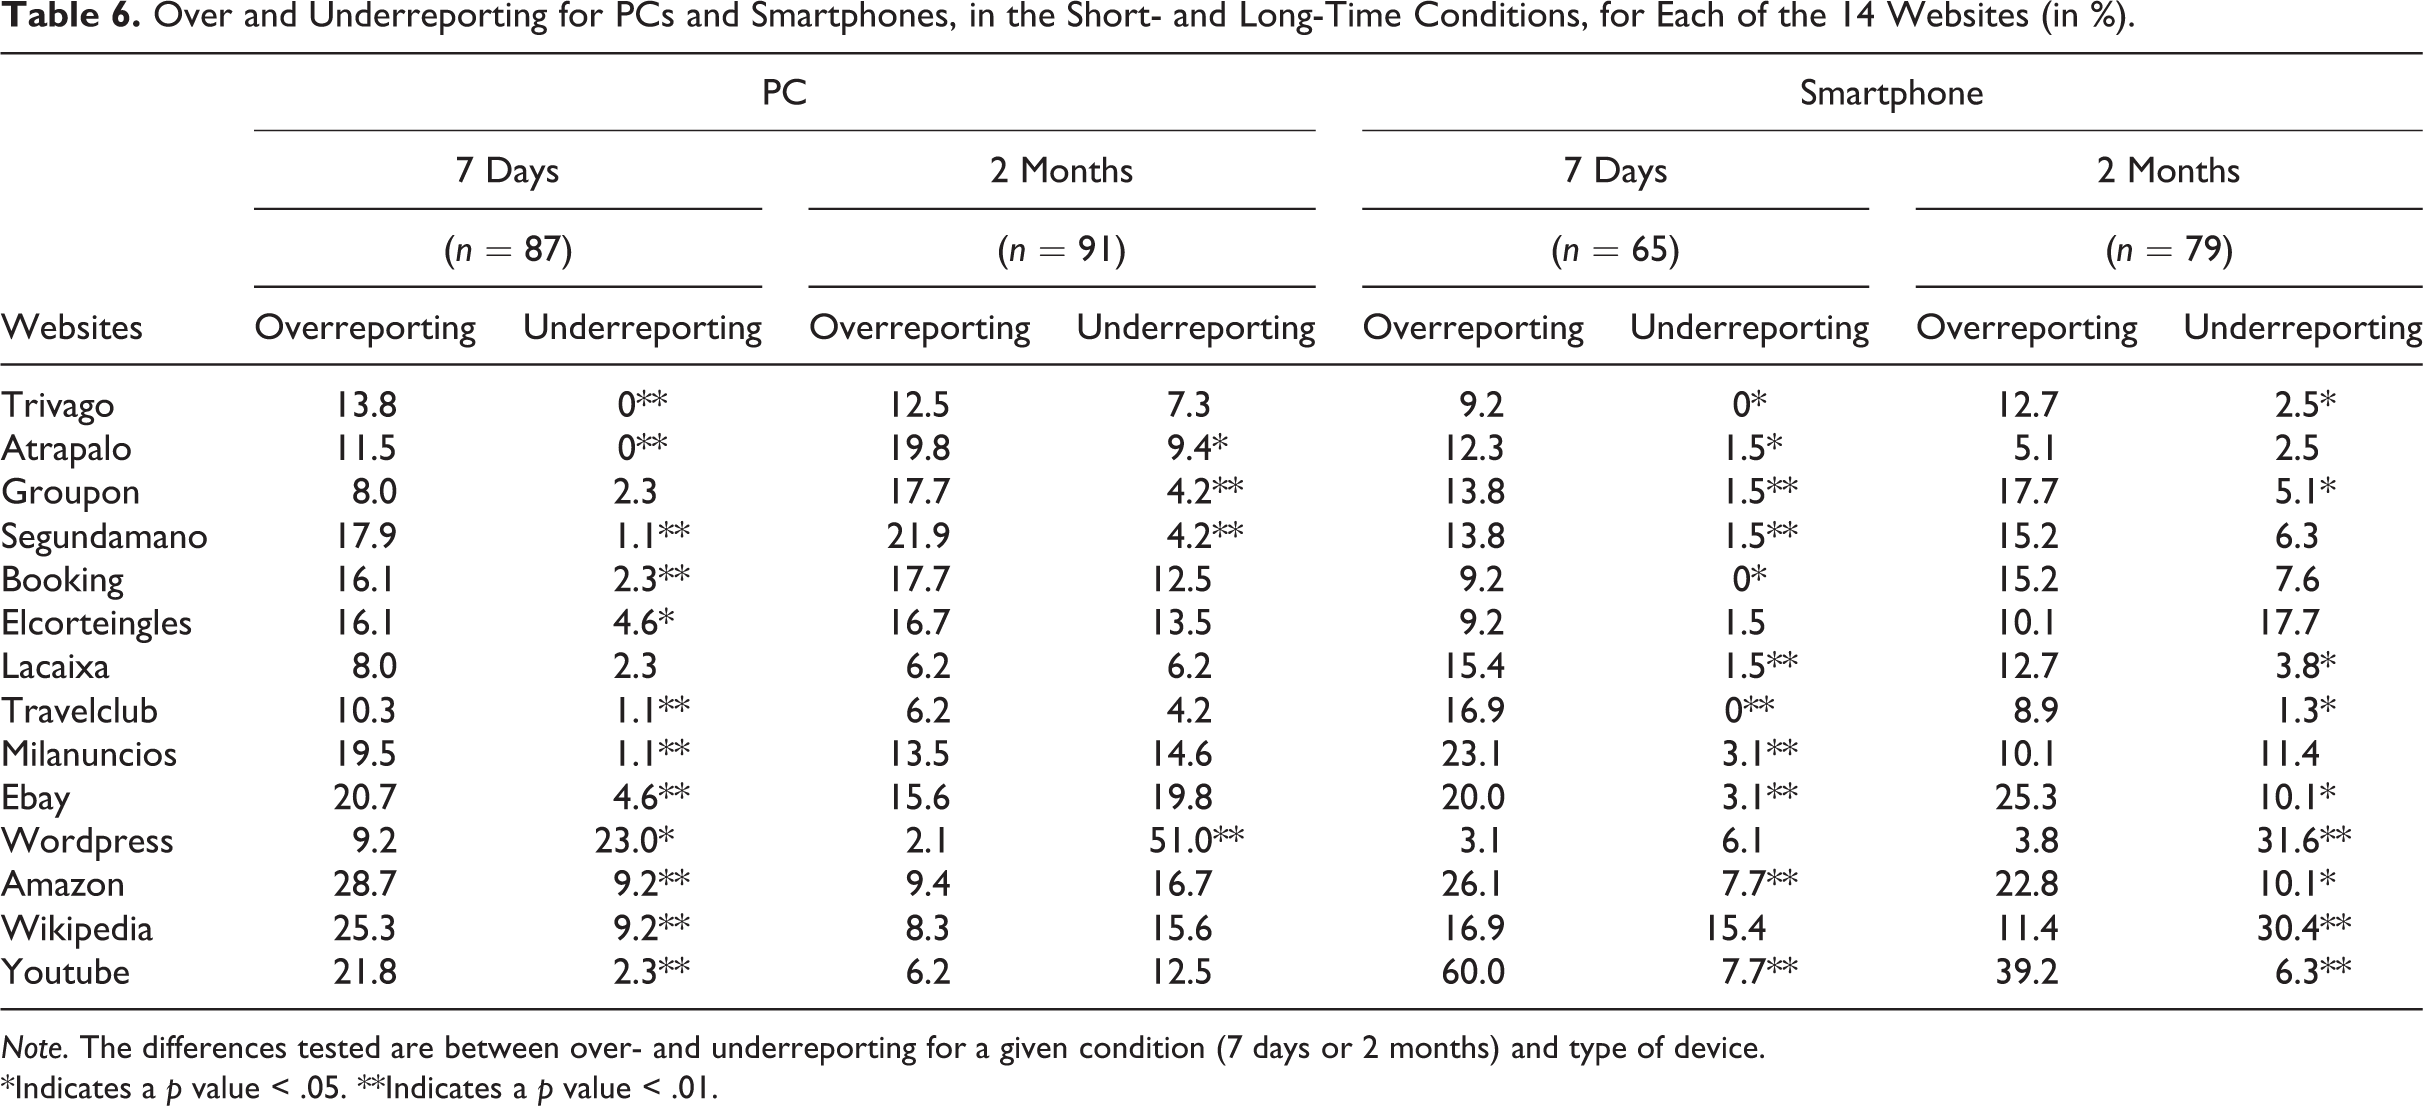
Note. The differences tested are between over- and underreporting for a given condition (7 days or 2 months) and type of device.
*Indicates a p value < .05. **Indicates a p value < .01.
First, the overall differences between both data sources (sum of over- and underreporting) are, in general, quite large, with a maximum of 37.9% for PCs and 67.7% for smartphones. Also for suggested recall, large differences are observed across passive and active data.
Moreover, in the short-term condition, overreporting is systematically higher than underreporting (significant differences in most cases), except for Wordpress. However, Wordpress contains many different blogs so people may not know they are consulting a Wordpress page even when doing so. The high overreporting can be due to the tendency of people to say “yes” in surveys, also known as acquiescence bias (Krosnick, 1991) or to the combined influences of social desirability and memory failure (Belli, Traugott, Young, & McGonagle, 1999).
In the long-term condition, overreporting is higher for a majority of websites. However, there are also websites (e.g., Wikipedia) for which the trend is reversed. This seems to be related to the proportion of panelists visiting them (all reversed websites are in the bottom part of Table 6, which is ordered by proportions of panelists visits). Nevertheless, further research is needed for a better understanding of why some websites are more prone to overreporting and others to underreporting in the long-term condition.
Summary of Results
To summarize the main results, Table 7 provides an overview of the hypotheses studied together with their main outcomes.
Summary of the Main Results.
Discussion
Because of the changing environment, both new challenges and new opportunities appear. In order to study objective online behavior, we investigated the possibility of combining data from surveys with data from a meter installed on the participants’ devices. In order to do that, we first considered how great the current limits of passive data collection through a meter are, using data from the Netquest panel in Spain. We have seen that there are still crucial challenges that limit the possibilities of making inferences from these data, such as selection bias, observation of only some of the devices used, and of only part of the activity for these devices, and the sharing of devices. In addition, the kind of information available, as well as the technical difficulties of running these analyses, reduces the scope of possible studies.
Meter technology must therefore evolve to overcome some of the present limitations: for instance, the problem of shared devices. Direct solutions to this problem, like asking the panelist to provide his identity at the beginning of a browsing session, can be used, but at the expense of methodological and practical drawbacks. Automated browsing pattern recognition algorithms may be a solution and need to be investigated further.
However, using an experiment in which we tried to avoid all these problems (i.e., comparing data for a given device, which is used only by the respondent, and focusing only on measurement differences), we have shown that the information from the metered data differs from that given by the respondents in an online survey. Most of the differences come from bias in the survey, which can be due to human memory limitations, to highly cognitive demanding survey questions and to well-known bias in survey answers such as the tendency to say yes. Our results suggest that survey respondents perform poorly in recalling the websites that they have visited and that they visit more often and spend more time visiting than they say. This is true both for spontaneous and suggested recall, and when asking about the last 7 days or the last 2 months.
This study was only a first step in comparing both sources of information: more kinds of questions, topics, and behavior need to be studied. It would also be necessary to check whether similar patterns are found for other countries. Nevertheless, it already seems clear that using metered data for such questions can be an attractive option. More generally, passive data collection through a tracker application on the PCs or mobile devices of the population of interest might provide valuable information about past online behavior history, evaluations of the time spent or the frequencies of different online activities, in particular for activities requiring a low level of involvement or with a high level of social desirability.
Even though there is still a lot of work to be done to improve the representativeness and quality of the metered data, and even though survey data will still be necessary for most research questions, we believe that, in future, it will be both necessary and useful to combine active and passive data. This seems to be a way to reduce the effort required from survey respondents and, at the same time, to increase the accuracy of the data, if it is done appropriately and carefully.
We can think about different examples of how combining different sources of data might be helpful. For instance, the information from the passive data could be used to select the sample for a survey without the need to use initial profiling or filter questions where measurement error can easily occur, (e.g., selecting a sample of panelists who are Facebook users or panelists who visit websites about cars). It could also be used to survey respondents at a specific time (e.g., just after they visited a given website) so that the information is still fresh in their memory.
Another example of how declarative and passive data can work together is a comparison between real usage and recall, as a measure for brand awareness (e.g., if some websites are better recalled than others that are visited more).
Finally, further research could consider off-line behaviors. Indeed, even if access to passive data is still limited for off-line behaviors, there are some possibilities, like using information about credit card payment. In the future, a new technology like the beacons (i.e., Bluetooth devices that emit signals which could act as cookies, but in the off-line world) could also provide more options. For instance, it would be possible, if someone walks into a store, for his or her smartphone to detect the beacon, which would allow the visit to the shop to be recorded. This could make it possible to combine passive and active data to study off-line behavior too.
In any case, at least for online behavior where the required technology already exists, it is really important to learn how to make the best of the available passive data and combine it with survey data to get a more accurate picture of the overall problems of interest.
Footnotes
Authors’ Note
We want to thank everyone at Netquest who supported this project, in particular Roos Voorend for her help with the passive data analyses. We also want to acknowledge Willem Saris and two anonymous reviewers for their very helpful comments on a previous draft of this article.
Declaration of Conflicting Interests
The authors declared no potential conflicts of interest with respect to the research, authorship, and/or publication of this article.
Funding
The authors received no financial support for the research, authorship, and/or publication of this article.