
Abstract
Mixed-mode surveys need to determine a number of design parameters that may have a strong influence on costs and errors. In a sequential mixed-mode design with web followed by telephone, one of these decisions is when to switch modes. The web mode is relatively inexpensive but produces lower response rates. The telephone mode complements the web mode in that it is relatively expensive but produces higher response rates. Among the potential negative consequences, delaying the switch from web to telephone may lead to lower response rates if the effectiveness of the prenotification contact materials is reduced by longer time lags, or if the additional e-mail reminders to complete the web survey annoy the sampled person. On the positive side, delaying the switch may decrease the costs of the survey. We evaluate these costs and errors by experimentally testing four different timings (1, 2, 3, or 4 weeks) for the mode switch in a web–telephone survey. This experiment was conducted on the fourth wave of a longitudinal study of the mental health of soldiers in the U.S. Army. We find that the different timings of the switch in the range of 1–4 weeks do not produce differences in final response rates or key estimates but longer delays before switching do lead to lower costs.
The rising costs of data collection and decreasing response rates in surveys have led to increased interest in mixed-mode designs that use relatively inexpensive modes to interview those who are relatively easy to interview and then switch to more expensive modes to interview those who are relatively difficult to interview (Couper, 2011; de Leeuw, 2005).
These mixed-mode designs create a set of unique design issues. The decisions include which modes to employ, how to contact sampled units, when to switch modes, whether to make earlier modes unavailable after the switch, and so on. These design features all impact cost and error trade-offs. Understanding the implications of changes to each of these design features is crucial for optimizing designs of this type.
This article presents experimental evidence about the implications of delaying the timing of the mode switch. It considers whether delaying the mode switch might harm overall response rates and lead to increased nonresponse biases relative to a design that switches earlier. We explore the costs and errors associated with each switching time and make recommendations for future practice and research.
Background
There are several important decisions to be made when designing mixed-mode surveys. Of course, one of the key decisions involves the selection of the modes. Choosing these modes relies on a complex balancing of requirements (de Leeuw, 2005). There are, however, other design decisions that need to be made. For instance, whether to offer the modes concurrently or sequentially may impact response rates (Dillman, West, & Clark, 1994; Holmberg, Lorenc, & Werner, 2010; Medway & Fulton, 2012; Millar & Dillman, 2011). The specific order in which the modes are implemented may affect final response rates or other outcomes (Wagner, Arrieta, Guyer, & Ofstedal, 2014). The form or wording of questions may need to be changed across modes in order to convey the same meaning and produce comparable data (Dillman & Christian, 2005).
The focus of this article is on the timing of the mode switch in a sequential mixed-mode design and its effect on response rates and key estimates from the survey. The mode switch involved is from web to telephone. The timing of the switch may have important implications. We focus on the implications of switching when the initial mode is relatively inexpensive and the follow-up mode yields higher response but is more expensive, as this is a very common approach (de Leeuw, 2005). Switching earlier may be a useful design when the inexpensive mode produces response quickly. This is often the case in web surveys, where most of the response happens relatively soon after the initial contact with the request to complete the survey (Akl, Maroun, Klocke, Montori, & Schünemann, 2005; Beebe, Locke, Barnes, Davern, & Anderson, 2007; Leece et al., 2004; McMahon et al., 2003; Shannon & Bradshaw, 2002). Since most of the response happens relatively quickly, delaying the switch often produces only modest increases in response rates (Kittleson, 1997; Munoz-Leiva, Sanchez-Fernandez, Montoro-Rios, & Ibanez-Zapata, 2010).
A longer time in the web mode also allows researchers to send more reminders to complete the web survey. Sampled persons may find additional reminders irritating. The only evidence that this might be the case comes from experiments that vary the number or frequency of reminders. Most of these studies find that the number or frequency of messages makes little difference (Couper, Peytchev, Strecher, Rothert, & Anderson, 2007; Deutskens, de Ruyter, Wetzels, & Oosterveld, 2004; Kittleson, 1997; Munoz-Leiva et al., 2010). Couper (2008, p. 341) speculates that the annoyance factor may play a role with larger numbers of reminders, but he notes that there is little or no experimental evidence.
Arguments for later switching are based on the idea that longer periods of time allow higher response rates to occur in the less expensive mode. This translates into a greater proportion of the interviews being conducted in the less expensive web mode. Several studies have demonstrated cost savings for web surveys relative to telephone or mail surveys (Greenlaw & Brown-Welty, 2009; Hardigan, Succar, & Fleisher, 2012; Kaplowitz, Hadlock, & Levine, 2004; Shin, Johnson, & Rao 2012). Although the literature already cited often found no significant differences with longer field periods for web surveys, response rates generally only rise. In an early meta-analysis of e-mail surveys, Sheehan (2001) found that the number of follow-up contacts was a significant predictor of response rate in the 31 studies reviewed.
Alternatively, delaying the switch may hurt final response rates. We might expect that the second mode could be less effective if the first mode is prolonged. For example, if there is prenotification before the first survey, the impact of this prenotification on response to the second mode might be reduced by switching later. There would be longer time between the prenotification and the survey request in the second mode. This lag could reduce the effectiveness of the second mode. It might also happen that leaving cases in the first mode longer might annoy some sampled units. If the first mode includes repeated reminders (e.g., e-mails or telephone calls), then sampled units may become annoyed or not respond to the second mode. In this way, the first treatment may reduce the effectiveness of the second treatment. Although no research has found this kind of effect related to the timing of the switch, there are examples of this kind of interaction between treatments related to other features of mixed-mode surveys. Lynn (2012) found that the use of inexpensive modes in one wave of a panel survey adversely affected response rates in later waves of the same survey. Wagner, Arrieta, Guyer, and Ofstedal (2014) found that the order of the modes offered in a screening interview led to differences in interview rates for the substantive interview requested from eligible units. In terms of the timing of the mode switch, it may be the case that switching modes earlier may increase the effectiveness of the second mode.
Overall, a review of the literature indicates that there is not much benefit in waiting for longer periods of time or sending more than a few reminders for single-mode web surveys. However, the cited literature does not explore the impact on response rates of the timing of the switch in mixed-mode surveys. This article addresses that gap.
Data and Method
Sample
We report the results of an experiment completed on a component of the Army Study to Assess Risk and Resilience in Servicemembers (Army STARRS; Ursano et al., 2014). This is a large epidemiological study designed to assess the mental health of soldiers in the Army. STARRS has several major components. One of these is the Pre- and Post-Deployment Study (PPDS), a multiwave data collection of self-report survey data and biological data obtained from soldiers in three Brigade Combat Teams (BCTs) that were scheduled at baseline (T0) to be deployed within the next month to Afghanistan and who were subsequently assessed immediately upon return from deployment (T1), 3 months later (T2), and 6–9 months after T2 (T3). The T0 assessment was designed to evaluate baseline risk and resilience factors that may be significant predictors of emotional adjustment to deployment-related stressors, while the T1–T3 assessments obtained information regarding exposure to stressors and the postdeployment mental health of respondents. The T0–T2 PPDS surveys were conducted in group settings where soldiers were asked to complete the survey either on a laptop provided by the project (T0 and T2) or using a paper instrument (T1). The initial sample size for T0 was 9,949. A total of 9,488 soldiers responded at the T0 survey for a response rate of 95.3%. T3, in comparison, was unique in that panel members were contacted individually to request participation. This shift in design at T3 was dictated by the fact that many baseline respondents in the participating units had been assigned to new units or deactivated by T3, making it infeasible to use the same group administration approach employed at T0–T2. Soldiers were defined as eligible at T3 if they had deployed prior to the interview and were interviewed at either T1 or T2. At T3, 8,465 soldiers were eligible to be interviewed and 6,054 responded for a response rate of 71.5%.
The T3 survey had a web and telephone sequential mixed-mode design that began with a prenotification message sent via mail, text, and/or e-mail (Holland et al., 2014) followed by an initial web survey administration phase. If soldiers did not respond during the web phase, an attempt was made to administer the survey by telephone. Web was chosen as the first form of administration, as it is a lower cost mode. Mail mode was not considered, as the questionnaire includes complex skip logic and the use of fills, which make it very difficult to administer via paper-and-pencil. Further, virtually all panel members have Internet access and were familiar with the look and feel of a web questionnaire from computerized self-administered surveys they had likely taken at T0 and T2. Telephone mode was chosen as the sequential follow-up mode, as it generally achieves higher response rates than web mode (Lozar Manfreda, Bosnjak, Berzelak, Haas, & Vehovar, 2008) but has higher per completion costs than web. Telephone interviews are still much less expensive than face-to-face interviewing (Groves et al., 2011).
The T3 sample was released across the three BCTs in random replicates and the data collection design was modified adaptively based on early results. There was a US$20 incentive that was paid after the survey was completed. The incentive was increased to US$50 once a 55% response rate was achieved in each replicate. In each treatment group, this was well after the switch to telephone had been made.
For the mixed-mode design, cases that had both e-mail and telephone contact information were randomized to one of the four treatments. Cases were not eligible for the experiment if either piece of information was missing. A total of 83% of the sample was included in the experiment. The two groups (those with and without complete contact information) were compared on a number of demographic, administrative, and T0 mental health variables. The only significant difference was the percentage male (91.4% male for those with incomplete information and 93.8% male for those with complete information). The randomization was carried out for the first two BCTs. Based on early results of the experiment in the first two BCTs, the third BCT was not randomized to the experimental “switching” treatments and, therefore, is not included in this analysis. There were 3,850 cases randomized to the four treatments. Of these, 2,906 responded for a response rate of 75.5%. The timing of the switch between web and phone was varied experimentally to be 1, 2, 3, or 4 weeks. The “switch” meant that cases were called via telephone, but the web option was still available and, indeed, respondents who reported to the telephone interviewer that they were planning to complete the web survey were allowed to do so rather than being encouraged to complete the survey by telephone. Based on our initial belief that 3 weeks would be the optimal switching time, we differentially allocated half the sample to the 3-week switch and the other half equally to the 1-, 2-, and 4-week switches. The initial invitation was sent on the first day of the survey. Every 7 days, a reminder was sent until the case was switched to telephone. Therefore, the number of reminders and the length of time before switching are confounded with the timing of the switch. After the switch, the field period continued until a target response rate of about 75% had been reached. For the earliest replicates, this meant that the telephone effort stopped, but panel members were still allowed to participate in the web survey. Even after being switched to the telephone mode, panel members continued to receive e-mail reminders about the survey, about once per month. In addition, all active cases received an e-mail when their replicate had the incentive increased to US$50. Finally, near the end of the field period, a final series of three reminders was sent weekly to all active cases. This was administered to all replicates at the same time.
Measures
A thorough review of the measures is available from Kessler, Calabrese, et al. (2013). The instrument is based upon the Composite International Diagnostic Interview Screening Scales (Kessler, Calabrese, et al., 2013). These short scales assess an array of disorders, including attention-deficit hyperactivity disorder (ADHD), bipolar disorder, generalized anxiety disorder (GAD), major depressive episode (MDE), posttraumatic stress disorder (PTSD), obsessive-compulsive disorder (OCD), major depressive disorder (MDD), and intermittent explosive disorder (IED) (Kessler, Colpe, et al., 2013). In addition, the questionnaire asks about experiences during deployment. Since a major objective of the study was to evaluate risk and resiliency for suicide, there are several measures of suicidality. Finally, administrative data were linked to the survey data, including number of deployments, military occupational specialty (MOS), and whether the person was still on active duty at the time of the survey.
Response rates are reported using the guidelines provided by the American Association for Public Opinion Research (AAPOR, 2015) and conform to AAPOR Response Rate 2, which includes partial interviews in the numerator. An interview was treated as partial if at least one question in the final section was answered.
We do not have direct measures of cost for each of the treatment arms. This is because the telephone interviewing staff placed call attempts on sample from each of the treatment groups. As a hypothetical example, we know that an interviewer worked for 4 hours and we know how many call attempts they placed on cases from each of treatment groups, but we don’t know how long each of these attempts took. Therefore, as a proxy measure of costs, we use survey paradata (Couper, 1998; Couper & Lyberg, 2005) known as “call records.” Interviewers working with a computerized sample management system make a record of each call attempt. Each call record has a computer-generated time stamp associated with it. By calculating the time between calls, we estimated the time it takes to make each call. Summing these times over all calls to sampled cases and dividing by the total number of completed interviews produces a ratio measure of the total effort and cost per completed case. This can be inaccurate for several reasons. The length of the last call of the day cannot be examined using this method. Further, interviewers may take breaks or meet with a supervisor between call attempts. Since the statistics we report related to costs are ratios of the totals of two random variables, we estimated the standard errors using a bootstrap technique.
Analysis Methods
The PPDS component of the STARRS study employed a complex sample design that included stratification and clustering. These design features were accounted for in the analysis. When χ2 tests were employed, these were design-adjusted tests using the Rao-Scott χ2 test. The comparisons of number of calls were made using design-adjusted analysis of variance techniques. Logistic regression models were estimated using design-adjusted pseudo-maximum likelihood estimates. Estimates were made using SAS version 9.4 PROC SURVEYFREQ, PROC SURVEYMEANS, and PROC SURVYELOGISTIC. Figures were prepared using the ggplot2 package in R.
All soldiers in the three Army BCTs were eligible to take the PPDS survey. For the analysis of substantive measures from the completed T3 survey questionnaires, nonresponse-adjustment weights were developed to compensate for noninterviewed cases. These weights were constructed using propensity weighting (Little, 1986). The propensity models included as predictors demographic characteristics, administrative data, and mental health measures from the T0 interview. A separate nonresponse adjustment weight was developed for each of the four treatment group samples such that estimates from each group’s respondents should be representative of the PPDS target population.
Results
We first explore response rates by treatment group. We will then examine whether the different treatments led to differences in weighted estimates from the survey. Finally, we will look at costs across the four treatments.
Figure 1 shows the cumulative response rate by day for the four treatments. Figure 1a is a subset of the data that focuses in on the first 35 days of the field period. Figure 1b shows the complete data for the full field period. The figure includes interviews obtained by web and telephone. The response rates rise more rapidly early on for the cases that switch after 1 week. The response rates for the cases that switched after 4 weeks rose the least rapidly of the four treatments within the same time period. However, by the end of the survey, the cumulative response rates for the four treatment group samples converged.
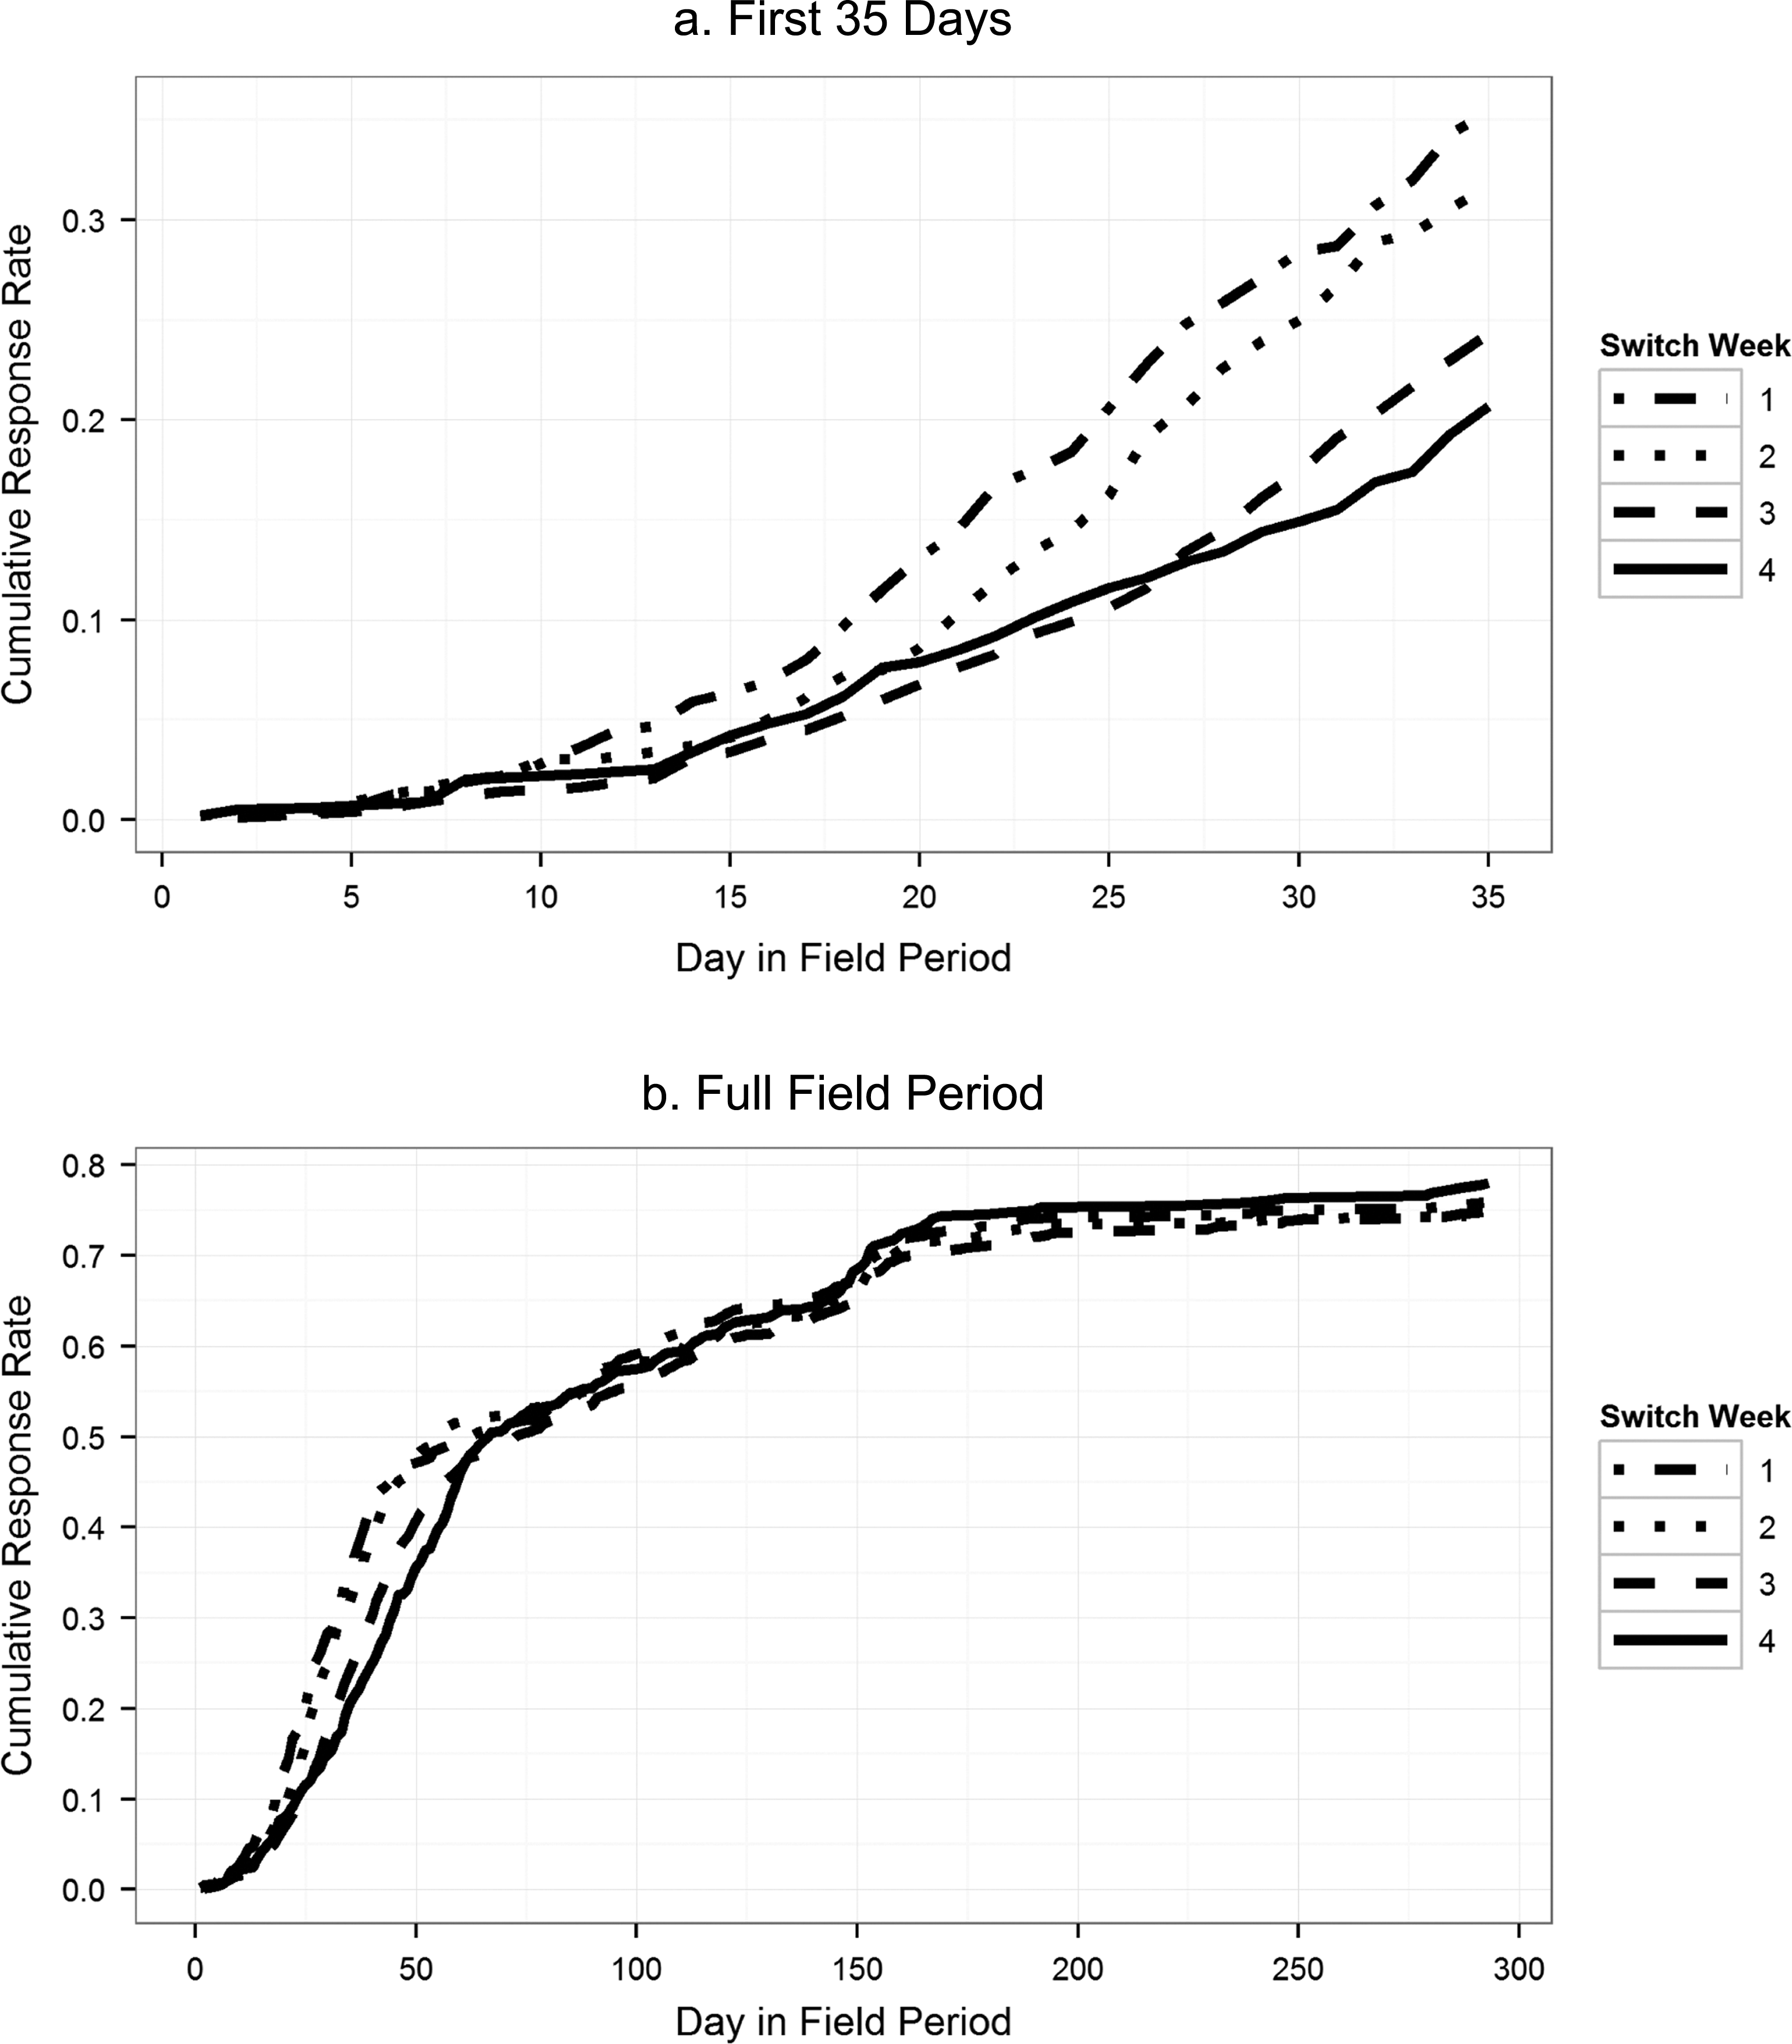
Cumulative response rate by day in field and treatment group.
As described earlier, even after the switch to telephone, the web mode was still available. Table 1 presents the sample sizes, web response rate at the time of the switch, final web response rate, and final response rates for each of the four treatments. It can be seen that the weekly e-mail reminders and time elapsed in the web mode increased web response rates. However, each week and concomitant reminder message experienced diminishing returns. Even so, web response rates at the time of the switch continued to climb for each of the treatments, with the 4-week condition having the highest response rate at the time of the switch. It is also noteworthy that many web interviews were completed after switching to telephone. In fact, web response rates were nearly doubled after the switch. Still, the arm with the largest proportion of interviews completed by web was the 4-week arm.
Response Rates by Treatment Group.

The differences in the web response rates, at both the time of the switch (p < .0001) and at the end of the field period (p = .0004), are significant across the four conditions. However, the differences between the final response rates are not (p = .4427). Therefore, the timing of the switch does not affect the final combined response rate for the multimode survey.
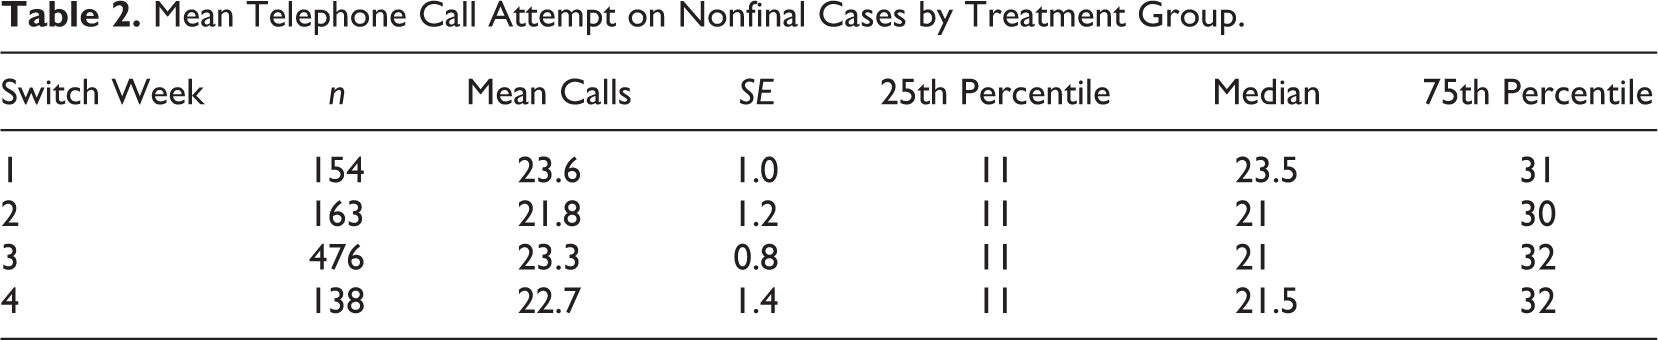
Although we randomized the time of the switch, the relative amount of effort on cases could have varied across the treatment groups. In other words, the cases that were switched at 1 week could have received more telephone effort (calls) than cases that were switched after 4 weeks. We looked at the number of telephone calls placed to nonfinal cases in each group as evidence of whether any of the treatment groups had differences in the amount of telephone effort they received. Table 2 shows the mean number of calls placed on nonfinal cases by treatment group. These differences are not statistically significant ( p = .7129).
Mean Telephone Call Attempt on Nonfinal Cases by Treatment Group.
As a further check on whether the timing of the switch led to differences in response rates, we also fit a multivariate model with a set of predictors drawn from the T0 interviews. The outcome is a binary indicator variable for whether the sample member responded or not to the PPDS T3 survey. These predictors include several demographic variables as well as mental and physical health measures. The results of this logistic regression model are displayed in Table A1 in the Appendix. Also included as predictors in the model are indicators for the week of switching and interactions between this variable and the significant predictors of response (age, race = Black, marital status, and education) identified from a model fit with no interaction terms. As can be seen from Table A1, neither the indicators for the different treatment groups nor any of the interaction terms, with one exception, were significant. There were significant predictors of response, including multiple baseline measures of mental health, military rank, and MOS. A likelihood ratio test of the full model with a nested model which removed the switch week indicators and all interactions with those indicators found no difference in model fit (27 degrees of freedom, p = .9353).
Next, we examine whether the different treatments lead to differences in estimates of several key statistics from the T3 interview. If these estimates differ across the treatments, this is an indication that the treatments influence the composition of who responds, given that the overall response rates did not differ across the treatments. These estimates are weighted using nonresponse adjustments as described earlier. The results are reported in Table 3. In each case, the estimates are not significantly different across the four treatment groups. Unweighted estimates—that is, not adjusted for T3 nonresponse—produced the same result (see Appendix Table A2).
Nonresponse-Adjusted Estimates from T3 by Treatment Group (Percentages).
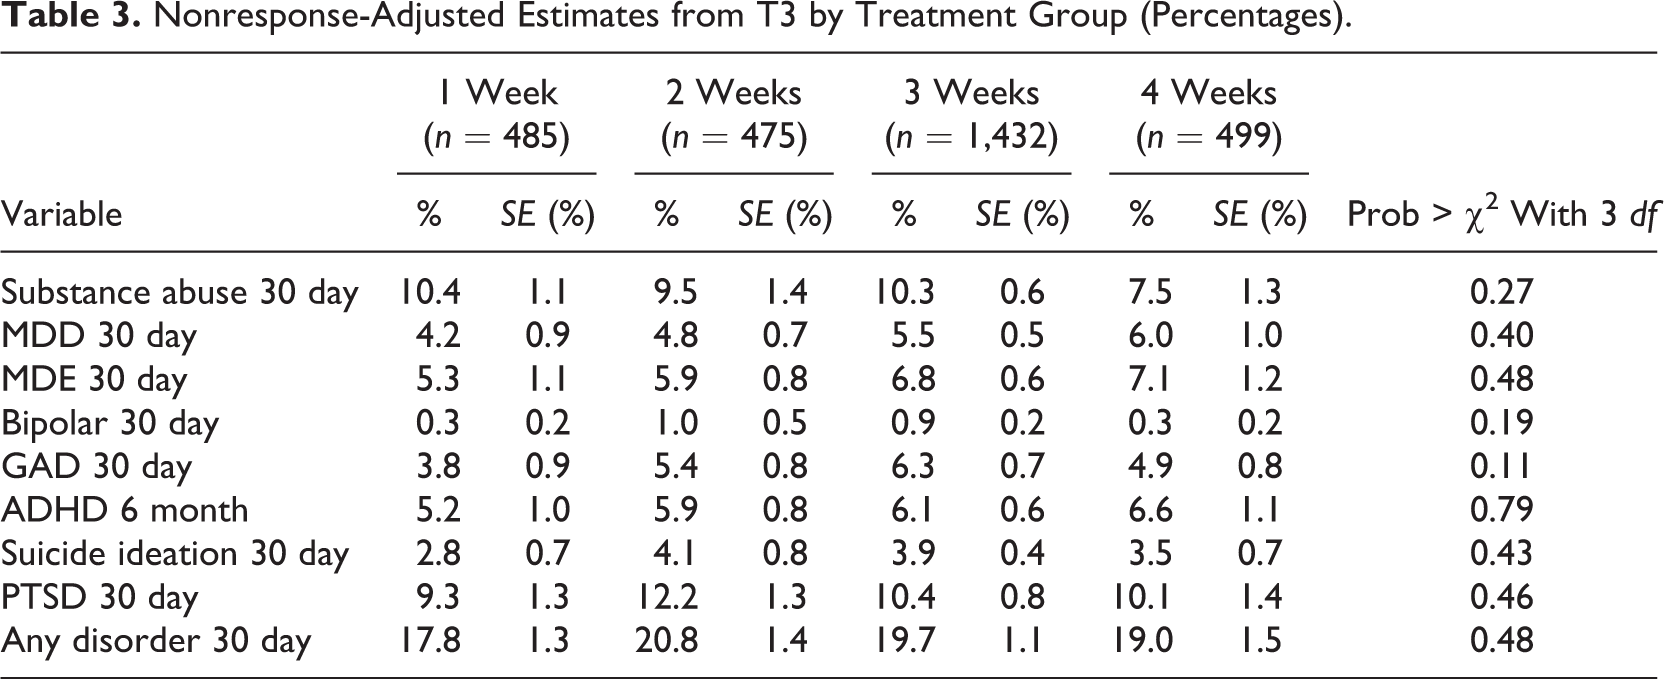
We note that any differences for the T3 measures could also be explained by a measurement effect associated with the mode. The proportion of web interviews varied across the four treatments. Even if there are no differences, this apparent lack of difference could also be explained by nonresponse biases and measurement bias canceling each other out. However, this seems unlikely to occur across all variables.
Finally, we compare costs across the four arms. The cost differences across the arms of the experiment are due to effort expended by interviewers in attempting to complete interviews over the telephone. Therefore, we present costs associated with interviewers’ time to demonstrate the cost differences between the arms. Since the nonrespondents to the web in the 4-week treatment are more difficult to reach, each interview takes more effort on average than telephone interviews with relatively easier respondents in the 1-, 2-, or 3-week arms. We account for this by using all interviews (web and telephone) in the denominator of these calculations. This gives us a “standardized” measure of effort across all four arms. In addition to looking at the number of call attempts made per completed interview (including both web and telephone completes), we look at the estimates of time based on information from the sample management system. Since types of calls can vary a great deal in length (e.g., a ring-no-answer takes less than a minute, while scheduling an appointment may take 5 min and an interview may take 30 min), looking at the composition of the calls in each arm gives us more detailed information than the average number of calls.
Table 4 presents the average number of calls per completed interview (again, including both web and telephone completes) and estimates of the minutes per complete. The column “Minutes per Complete” uses the time between calls as an estimate of the length of each call.
Calls and Minutes Per Complete by Treatment.

Overall, the costs decline with longer periods of time in the web mode before switching to telephone. The lowest costs are associated with the arm that switched to telephone after 4 weeks.
Discussion
One of the key decisions to be made in a mixed-mode survey is when to switch from one mode to another. This decision may have implications for both costs and errors. One hypothesis is that switching at a later time might annoy sampled persons as they receive more e-mail requests to complete the web survey before being asked to complete the survey over the telephone. The results from our survey indicate that this did not happen. Our initial assumption, that 3 weeks would be the best switching time, turned out to be incorrect. Instead, each arm produced very similar response rates.
A second consideration is a variant of the first. It may be the case that some subgroups are more likely to suffer these kinds of synergistic effects between the dosage of first mode and response rate to the second mode. Our analysis looked at a number of characteristics of those responding across the four treatment arms, including both demographic characteristics and mental and physical health measures, and while there were differences in response rates across subgroups defined by baseline mental health measures, rank, MOS, education, and marital status, none of these differences was associated with the treatments. This indicates that the four arms did not differ in who they were likely to recruit.
Therefore, in this case, the decision about which treatment to select comes down to cost. The lowest cost arm is to be preferred. In this case, the lowest costs are associated with switching after 4 weeks.
There are several limitations to our study. First, the lack of differences between estimates across the four treatments could be due to differential measurement biases. Differential measurement biases could be created if interviewer-administration over the telephone led to increased social desirability bias (Brewer, Hallman, Fiedler, & Kipen, 2004; Kreuter, Presser, & Tourangeau, 2008; Tourangeau, Rips, & Rasinski, 2000). Since the four arms had different proportions of web interviews, any consistent social desirability bias due to interviewer-administration would differentially impact estimates across the four treatments. However, the general pattern was one of no difference across the estimates. It is possible that differential social desirability biases were “cancelled out” by differential nonresponse biases across the arms. Given the consistent finding across several measures, this explanation seems unlikely.
Further, we have focused on a single feature in our design—the timing of the switch. This feature is confounded with the number of reminders sent, as is the case with most web survey designs. There are some exceptions where both the number and the frequency of the reminder messages were varied. In an early study, Kittleson (1997) varied both the frequency and number of reminders. They compared the effect of zero reminder, one reminder (after 7 days), two reminders (after 5 or 10 days), and four reminders (after 3, 6, 9, and 12 days) and found that one, two, and four reminders sent at the specified frequencies all had about the same response rate. Munoz-Leiva, Sanchez-Fernandez, Montoro-Rios, and Ibanez-Zapata (2010) tried mailing every 10 days or every 20 days. The former group got six messages and the latter received a total of four messages. They found no difference in response rate between the two groups. Sauermann and Roach (2013) found that changing the day of the week or hour of the day that each reminder is sent did not have a significant impact on response rates. It might be the case that different reminder strategies for the same web survey field period have different effects on response. We did not experiment with this possibility. Further, the timing of the switch to web may interact with other parameters of our design, including the incentive. Survey designers should consider these possible interactions when designing new mixed-mode surveys.
The experiment did not include time periods longer than 4 weeks. It may be that waiting for longer periods of time further decreases costs without increasing any nonresponse biases. We cannot make this conclusion from our experiment. Further experimentation may be warranted, as we experienced diminishing returns with each longer period of time before switching to telephone. Eventually, a length of time may be reached beyond which there are either no cost savings or which leads to irritated sample members who become less likely to respond to the second mode.
Another limitation is that the survey was a mental health survey. The results may not generalize to surveys with other topics. All participants had been surveyed with a similar questionnaire at least one time and, for many participants, on three previous occasions before the T3 administration. Previous exposure to the questionnaire may have affected their willingness to participate. As such, the results may not apply to cross-sectional surveys. A final limitation is that our study population was somewhat specialized—U.S. Army soldiers who were deployed recently and who are 94% male with a mean age of 26.6. This may make it difficult to generalize our results to other survey populations.
Overall, we find a lack of synergy between the timing of the mode switch and the effectiveness of the second mode. Further, the different treatments did not appear to produce different estimates for a set of statistics drawn from the survey. The longer timing before the switch had the benefit of lower costs and was, therefore, preferred. Our recommendation for future practice is to incorporate later switches from web to telephone into the design, working within the constraints of the field period length. Future research may be necessary to see if longer times produce negative effects on response rates or to see if switching time may interact in unanticipated ways with other features across different surveys.
Footnotes
Appendix
Unweighted Estimates From T3 by Treatment Group (Percentages).
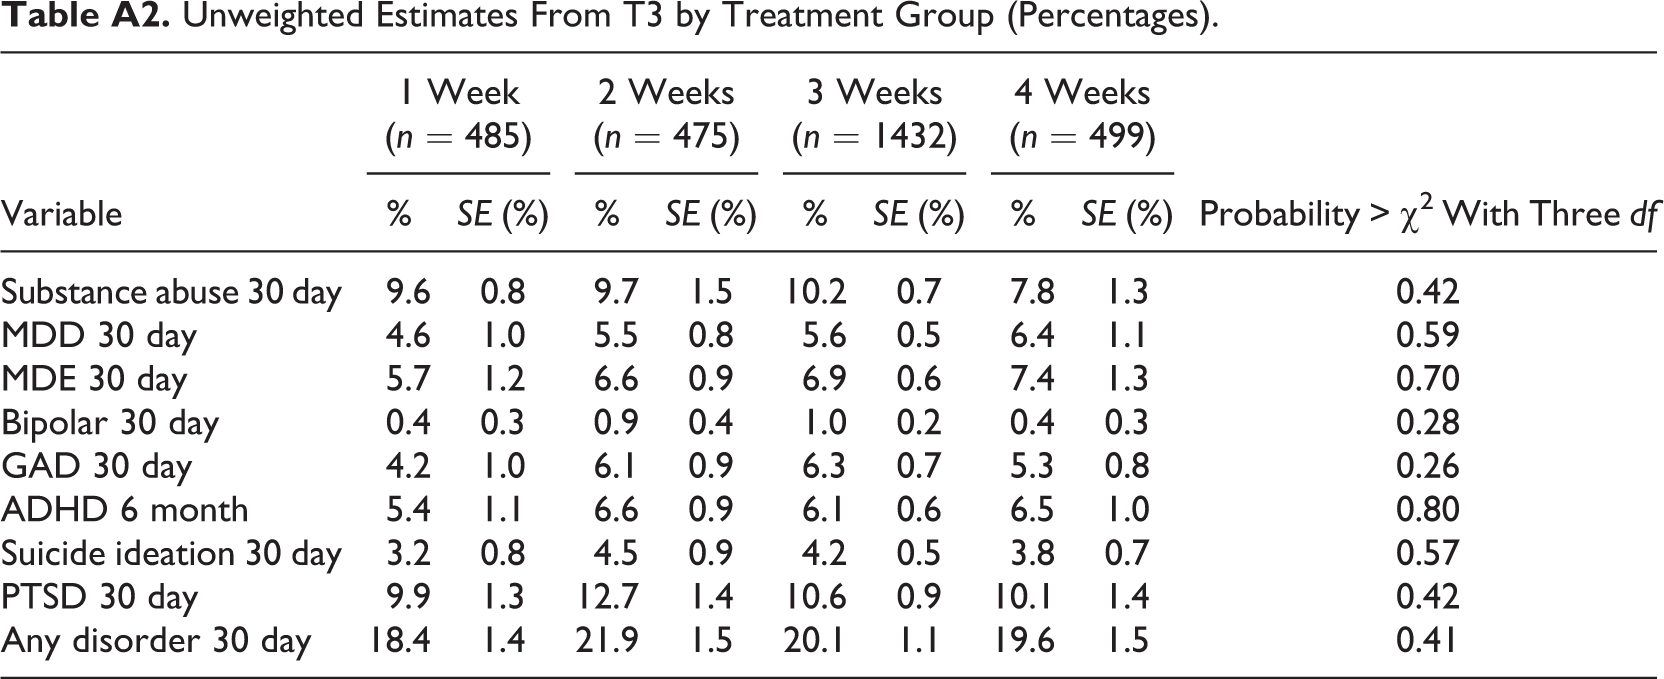
| Variable | 1 Week (n = 485) | 2 Weeks (n = 475) | 3 Weeks (n = 1432) | 4 Weeks (n = 499) | Probability > χ2 With Three df | ||||
|---|---|---|---|---|---|---|---|---|---|
| % | SE (%) | % | SE (%) | % | SE (%) | % | SE (%) | ||
| Substance abuse 30 day | 9.6 | 0.8 | 9.7 | 1.5 | 10.2 | 0.7 | 7.8 | 1.3 | 0.42 |
| MDD 30 day | 4.6 | 1.0 | 5.5 | 0.8 | 5.6 | 0.5 | 6.4 | 1.1 | 0.59 |
| MDE 30 day | 5.7 | 1.2 | 6.6 | 0.9 | 6.9 | 0.6 | 7.4 | 1.3 | 0.70 |
| Bipolar 30 day | 0.4 | 0.3 | 0.9 | 0.4 | 1.0 | 0.2 | 0.4 | 0.3 | 0.28 |
| GAD 30 day | 4.2 | 1.0 | 6.1 | 0.9 | 6.3 | 0.7 | 5.3 | 0.8 | 0.26 |
| ADHD 6 month | 5.4 | 1.1 | 6.6 | 0.9 | 6.1 | 0.6 | 6.5 | 1.0 | 0.80 |
| Suicide ideation 30 day | 3.2 | 0.8 | 4.5 | 0.9 | 4.2 | 0.5 | 3.8 | 0.7 | 0.57 |
| PTSD 30 day | 9.9 | 1.3 | 12.7 | 1.4 | 10.6 | 0.9 | 10.1 | 1.4 | 0.42 |
| Any disorder 30 day | 18.4 | 1.4 | 21.9 | 1.5 | 20.1 | 1.1 | 19.6 | 1.5 | 0.41 |
Authors’ Note
The Army STARRS Team consists of coprincipal investigators: Robert J. Ursano, MD (Uniformed Services University of the Health Sciences) and Murray B. Stein, MD, MPH (University of California–San Diego and VA San Diego Healthcare System); site principal investigators: Steven Heeringa, PhD (University of Michigan) and Ronald C. Kessler, PhD (Harvard Medical School); National Institute of Mental Health (NIMH) collaborating scientists: Lisa J. Colpe, PhD, MPH, and Michael Schoenbaum, PhD; Army liaisons/consultants: COL Steven Cersovsky, MD, MPH (USAPHC) and Kenneth Cox, MD, MPH (USAPHC); other team members: Pablo A. Aliaga, MA (Uniformed Services University of the Health Sciences), COL David M. Benedek, MD (Uniformed Services University of the Health Sciences), K. Nikki Benevides, MA (Uniformed Services University of the Health Sciences), Paul D. Bliese, PhD (University of South Carolina), Susan Borja, PhD (NIMH), Evelyn J. Bromet, PhD (Stony Brook University School of Medicine), Gregory G. Brown, PhD (University of California–San Diego), Christina Buckley, BA (Uniformed Services University of the Health Sciences), Laura Campbell-Sills, PhD (University of California–San Diego), Catherine L. Dempsey, PhD, MPH (Uniformed Services University of the Health Sciences), Carol S. Fullerton, PhD (Uniformed Services University of the Health Sciences), Nancy Gebler, MA (University of Michigan), Robert K. Gifford, PhD (Uniformed Services University of the Health Sciences), Stephen E. Gilman, ScD (Harvard School of Public Health), Marjan G. Holloway, PhD (Uniformed Services University of the Health Sciences), Paul E. Hurwitz, MPH (Uniformed Services University of the Health Sciences), Sonia Jain, PhD (University of California San Diego), Tzu-Cheg Kao, PhD (Uniformed Services University of the Health Sciences), Karestan C. Koenen, PhD (Columbia University), Lisa Lewandowski-Romps, PhD (University of Michigan), Holly Herberman Mash, PhD (Uniformed Services University of the Health Sciences), James E. McCarroll, PhD, MPH (Uniformed Services University of the Health Sciences), James A. Naifeh, PhD (Uniformed Services University of the Health Sciences), Tsz Hin Hinz Ng, MPH (Uniformed Services University of the Health Sciences), Matthew K. Nock, PhD (Harvard University), Rema Raman, PhD (University of California–San Diego), Holly J. Ramsawh, PhD (Uniformed Services University of the Health Sciences), Anthony Joseph Rosellini, PhD (Harvard Medical School), Nancy A. Sampson, BA (Harvard Medical School), LCDR Patcho Santiago, MD, MPH (Uniformed Services University of the Health Sciences), Michaelle Scanlon, MBA (NIMH), Jordan W. Smoller, MD, ScD (Harvard Medical School), Amy Street, PhD (Boston University School of Medicine), Michael L. Thomas, PhD (University of California–San Diego), Patti L. Vegella, MS, MA (Uniformed Services University of the Health Sciences), Leming Wang, MS (Uniformed Services University of the Health Sciences), Christina L. Wassel, PhD (University of Pittsburgh), Simon Wessely, FMedSci (King’s College London), Hongyan Wu, MPH (Uniformed Services University of the Health Sciences), LTC Gary H. Wynn, MD (Uniformed Services University of the Health Sciences), Alan M. Zaslavsky, PhD (Harvard Medical School), and Bailey G. Zhang, MS (Uniformed Services University of the Health Sciences). The contents are solely the responsibility of the authors and do not necessarily represent the views of the Department of Health and Human Services, NIMH, the Department of the Army, or the Department of Defense.
Declaration of Conflicting Interests
The authors declared no potential conflicts of interest with respect to the research, authorship, and/or publication of this article.
Funding
The authors disclosed receipt of the following financial support for the research, authorship, and/or publication of this article: Army STARRS was sponsored by the Department of the Army and funded under cooperative agreement number U01MH087981 with the US Department of Health and Human Services, National Institutes of Health, National Institute of Mental Health (NIH/NIMH).