
Abstract
Videos are often used in web surveys to assess attitudes. While including videos may allow researchers to test immediate reactions, there may be issues associated with displaying videos that are overlooked. In this article, we examine the effects of using video stimuli on responses in a probability-based web survey. Specifically, we evaluate the association between demographics, mobile device usage, and the ability to view videos; differences in ad recall based on whether respondents saw a video or still images of the video; whether respondents’ complete viewing of videos is related to presentation order; and the data quality of follow-up questions to the videos as a function of presentation order and complete viewing. Overall, we found that respondents using mobile browsers were less likely to be able to view videos in the survey. Those who could view videos were more likely to indicate recall compared to those who viewed images, and videos that were shown later in the survey were viewed in their entirety less frequently than those shown earlier. These results directly pertain to the legitimacy of using videos in web surveys to gather data about attitudes.
Web surveys offer options, such as embedded videos, that previously were not possible with paper and telephone surveys. This has enabled researchers and marketers to test immediate reactions to videos, including the effectiveness of advertisements (e.g., Calfee, 2002; Lemert, Wanta, & Lee, 1999; Mehta, 2000) and to provide videos to respondents who may not remember them when prompted with verbal descriptions or still images. However, videos may pose several problems for web surveys (Shapiro-Luft & Cappella, 2013), and there is little existing literature on the implications for survey measurement.
One issue that may arise when using the web to conduct a survey is that respondents may have technical problems. Compatibility issues, lack of broadband access, or lack of Internet experience may affect the ability for people to view and respond to surveys accurately (Couper, 2008; Fielding, Lee, & Blank, 2008). Mobile device usage can impact responses to surveys (Buskirk & Andrus, 2014; Mavletova, 2013; Peytchev & Hill, 2010), which is of increasing importance as smartphone usage continues to grow (Anderson, 2015). Technical limitations and mobile device usage can impact how people respond to surveys, posing problems for videos in web surveys.
Respondents’ demographics can relate to how they access and respond to surveys. For example, broadband Internet access rates vary widely by sociodemographic characteristics, including income, age, and race/ethnicity (Horrigan & Duggan, 2015); this can affect a participant’s survey experience. Age, education, gender, household Internet access, and employment status also influence survey completion time, video viewing time, and video failure (Couper, Traugott, & Lamias, 2001; Groves & Couper, 1998; Peytchev, 2011; Shapiro-Luft & Cappella, 2013). The decision to display videos in web surveys may involve a choice between imperfect options, including trade-offs between internal and external validity. For example, screening out those who cannot view videos could reduce generalizability, whereas tailoring the survey instrument to a respondent’s technology platform could reduce measurement consistency if the modes elicit different responses.
Within the context of advertising research, little is known about the comparability of video-based and image-based advertising recall methodologies. In this exploratory study, we examined technical issues, device, and demographics of respondents who completed a web-based survey that included either video advertisements or images of the videos and questions about advertisement effectiveness for each video. We aimed to answer the following questions:
Even if respondents can be shown videos, if they do not watch the entire video, this could negatively impact responses to follow-up questions, leading to straightlining, in which a respondent selects the same option for every item in a battery, or selecting indefinite responses, such as “don’t know” or “not sure” (Krosnick, 1991). Questionnaire length can also impact data quality—satisficing behaviors tend to occur more frequently in later items of a long survey (Herzog & Bachman, 1981). Thus, we aimed to answer:
Method
Data Collection
Data were collected throughout January and March 2013 via the GfK KnowledgePanel®. Panel members have a known probability of selection, and households that lack Internet access are provided a netbook and Internet service (Dennis, 2010).
The survey is a quarterly tracking study that measures awareness of and reactions to military advertisements among U.S. adults who regularly interact with young people. 1 Of the 11,536 panel members sampled for screening, 8,016 completed the screener (completion rate of 69.5%); of those, 2,914 qualified for the survey (incidence rate of 36.4%). Of eligible panel members, 1,803 were sampled for the survey; 1,237 completed the survey (cumulative response rate CUMRR1 = 7.0%; Callegaro & DiSogra, 2008); 2 after which an additional 12 observations were removed due to incomplete data, leading to a final data set of 1,225 participants. 3 The survey was weighted, 4 although an unweighted, model-based approach was used for inference. 5
Advertising Recall Methodology
Participants were shown advertisements from four of the Active Duty Services of the U.S. Military: the Army, Navy, Air Force, and Marine Corps. Two sets of advertising recall measures were asked. The first set measured unaided advertising recall—respondents were asked questions without prompts about the ads. The second set measured aided advertising recall—respondents were shown either images with text or videos of specific advertisements. The mode in which respondents were provided ads (i.e., images or videos) depended on whether the respondents could view embedded videos.
Unaided advertising recall
First, respondents were asked, “In the past couple of months, have you seen, read or heard any advertisements for the U.S. Military or any of its branches? This does not include news coverage of military activities.” Respondents who indicated “yes” or “not sure” were then shown a list of the Active Duty Services (in randomized order) and were asked, “For which of the following have you seen, read or heard an advertisement in the past couple of months?”
Aided advertising recall
The format of the aided recall question was assigned based on whether respondents could view videos embedded in an HTML survey. The videos were in Windows Media Video format, with a resolution of 320 by 285 pixels, and automatically started playing for respondents after the page was loaded. Respondents were shown a test video and asked, “Were you able to view this video?” Respondents who could view the test video were assigned a video-based question format; otherwise, they were assigned an image-based question format.
Respondents in the video format were shown four pairs of 30-second military advertisements, one pair each for the Army, Navy, Marine Corps, and Air Force. The order of the pairs of ads was randomized, and the order within each pair was randomized. For each ad, the respondent saw the ad and was asked, “Do you recall seeing or hearing this ad in the past couple of months?” Respondents were then asked two follow-up question batteries about the ad: first, regarding their reactions to the advertisement (e.g., if the ad was visually appealing, told them something new or different, accurately portrayed people in the particular Service); second, they responded to five items regarding their attitudes after watching the ad (e.g., if the ad made them interested in finding out more). The response options for each question were “agree,” “disagree,” and “not sure.” After all eight sets of questions (i.e., one set per advertisement), respondents were asked whether they encountered technical problems while viewing the videos.
Respondents in the image viewing condition were similarly provided with advertising recall questions for the eight ads, except that instead of being shown videos, respondents were shown screen captures from key scenes and a text summary of the advertisement. Respondents who recalled seeing an advertisement were asked follow-up questions regarding their reactions and attitudes after watching the ad.
Results
Question 1: What Is the Relationship Between Demographic Characteristics, Mobile Device Usage, and Video Viewing Ability?
We used logistic regression to predict whether respondents could view videos, based on demographics and the use of a mobile device (i.e., smartphone or tablet) to access the survey. Respondents were defined as being able to view videos if they responded “yes” to “were you able to view this video?” and did not report any technical problems after being shown all advertisements. Of the 532 respondents who reported that they could view the test video (of 1,225), 46 subsequently reported technical difficulties; these respondents were coded as unable to view videos for the first analysis and were omitted from subsequent analyses. 6
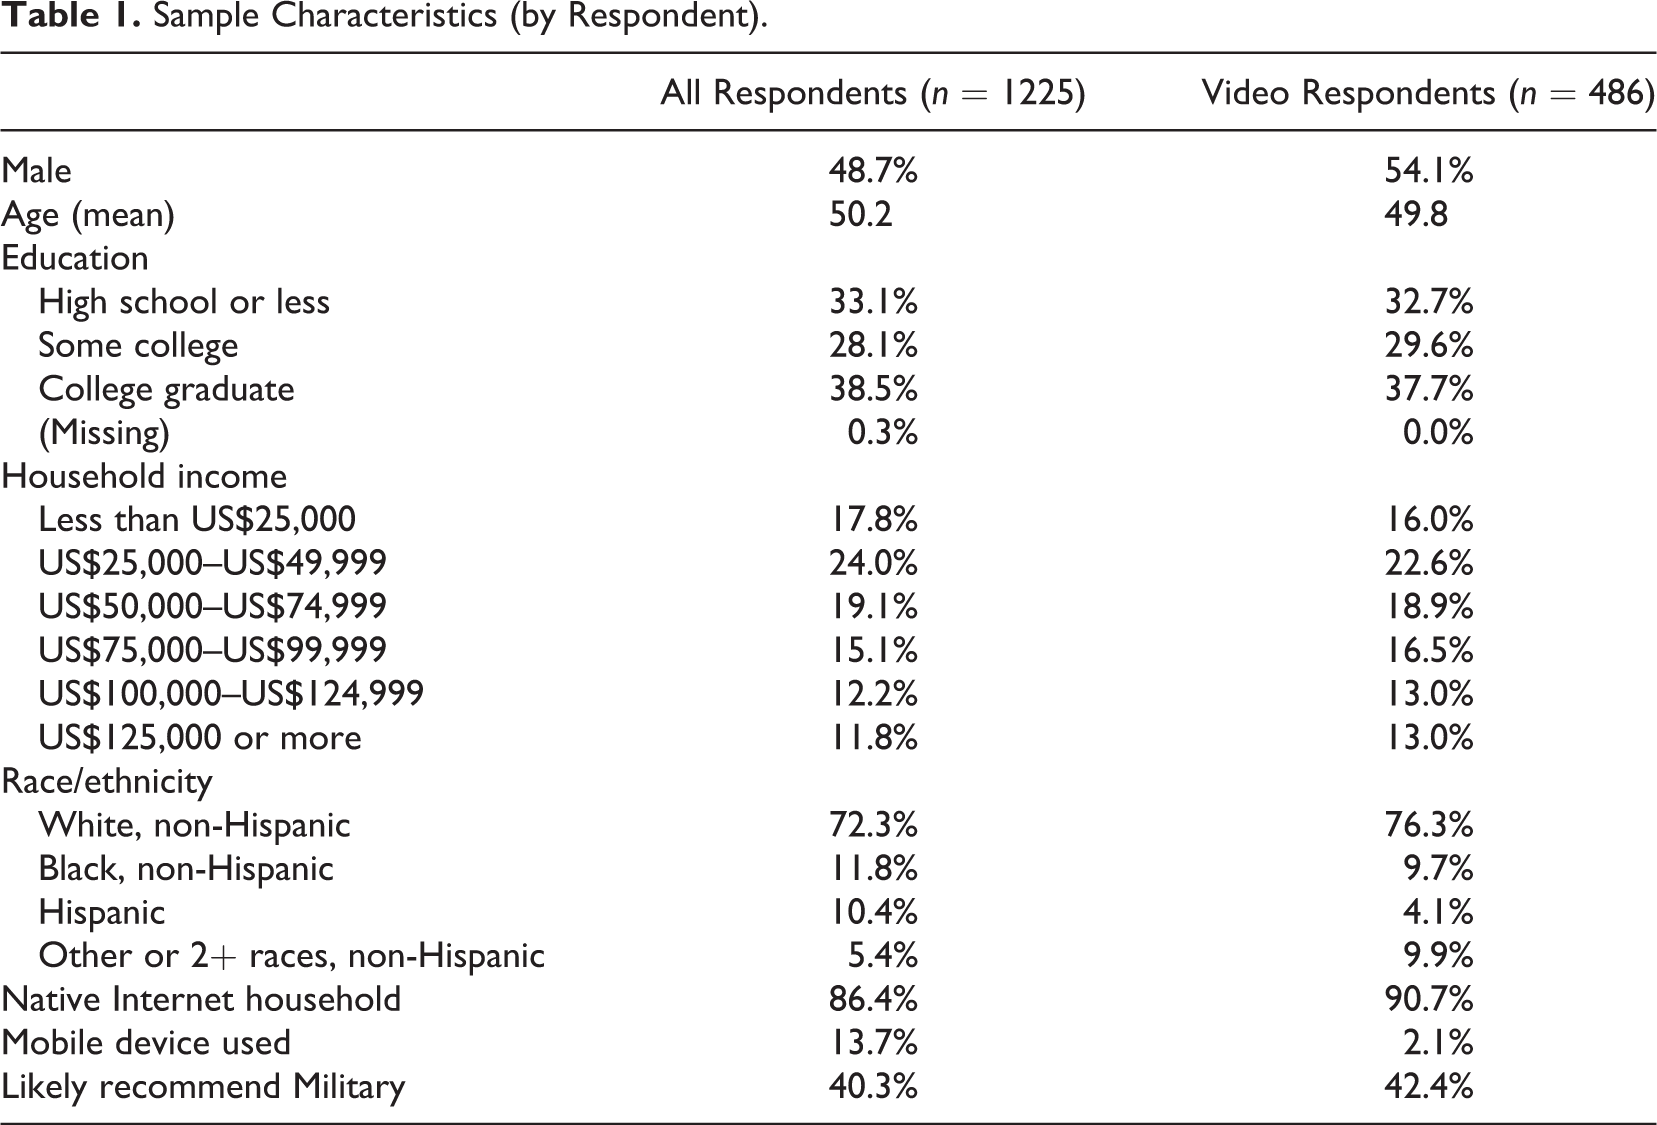
The demographic variables used in the model were gender, age (continuous), educational attainment, annual household income in U.S. dollars, race/ethnicity, and whether the respondent’s household had Internet access prior to joining the panel; 7 the model also included likelihood to recommend military service (recoded as binary), as a possible correlate of survey interest (Table 1). Mobile device usage to access the survey was determined using the browser’s user-agent header. 8 Nine respondents who had missing data on at least one variable were omitted from the analyses.
Sample Characteristics (by Respondent).
A logistic regression predicting viewing ability from mobile browser and demographic characteristics indicated that mobile browser users had 93% lower odds of being able to view videos than others, Exp(
Logistic Regression Analysis Predicting Ad Viewing Ability.
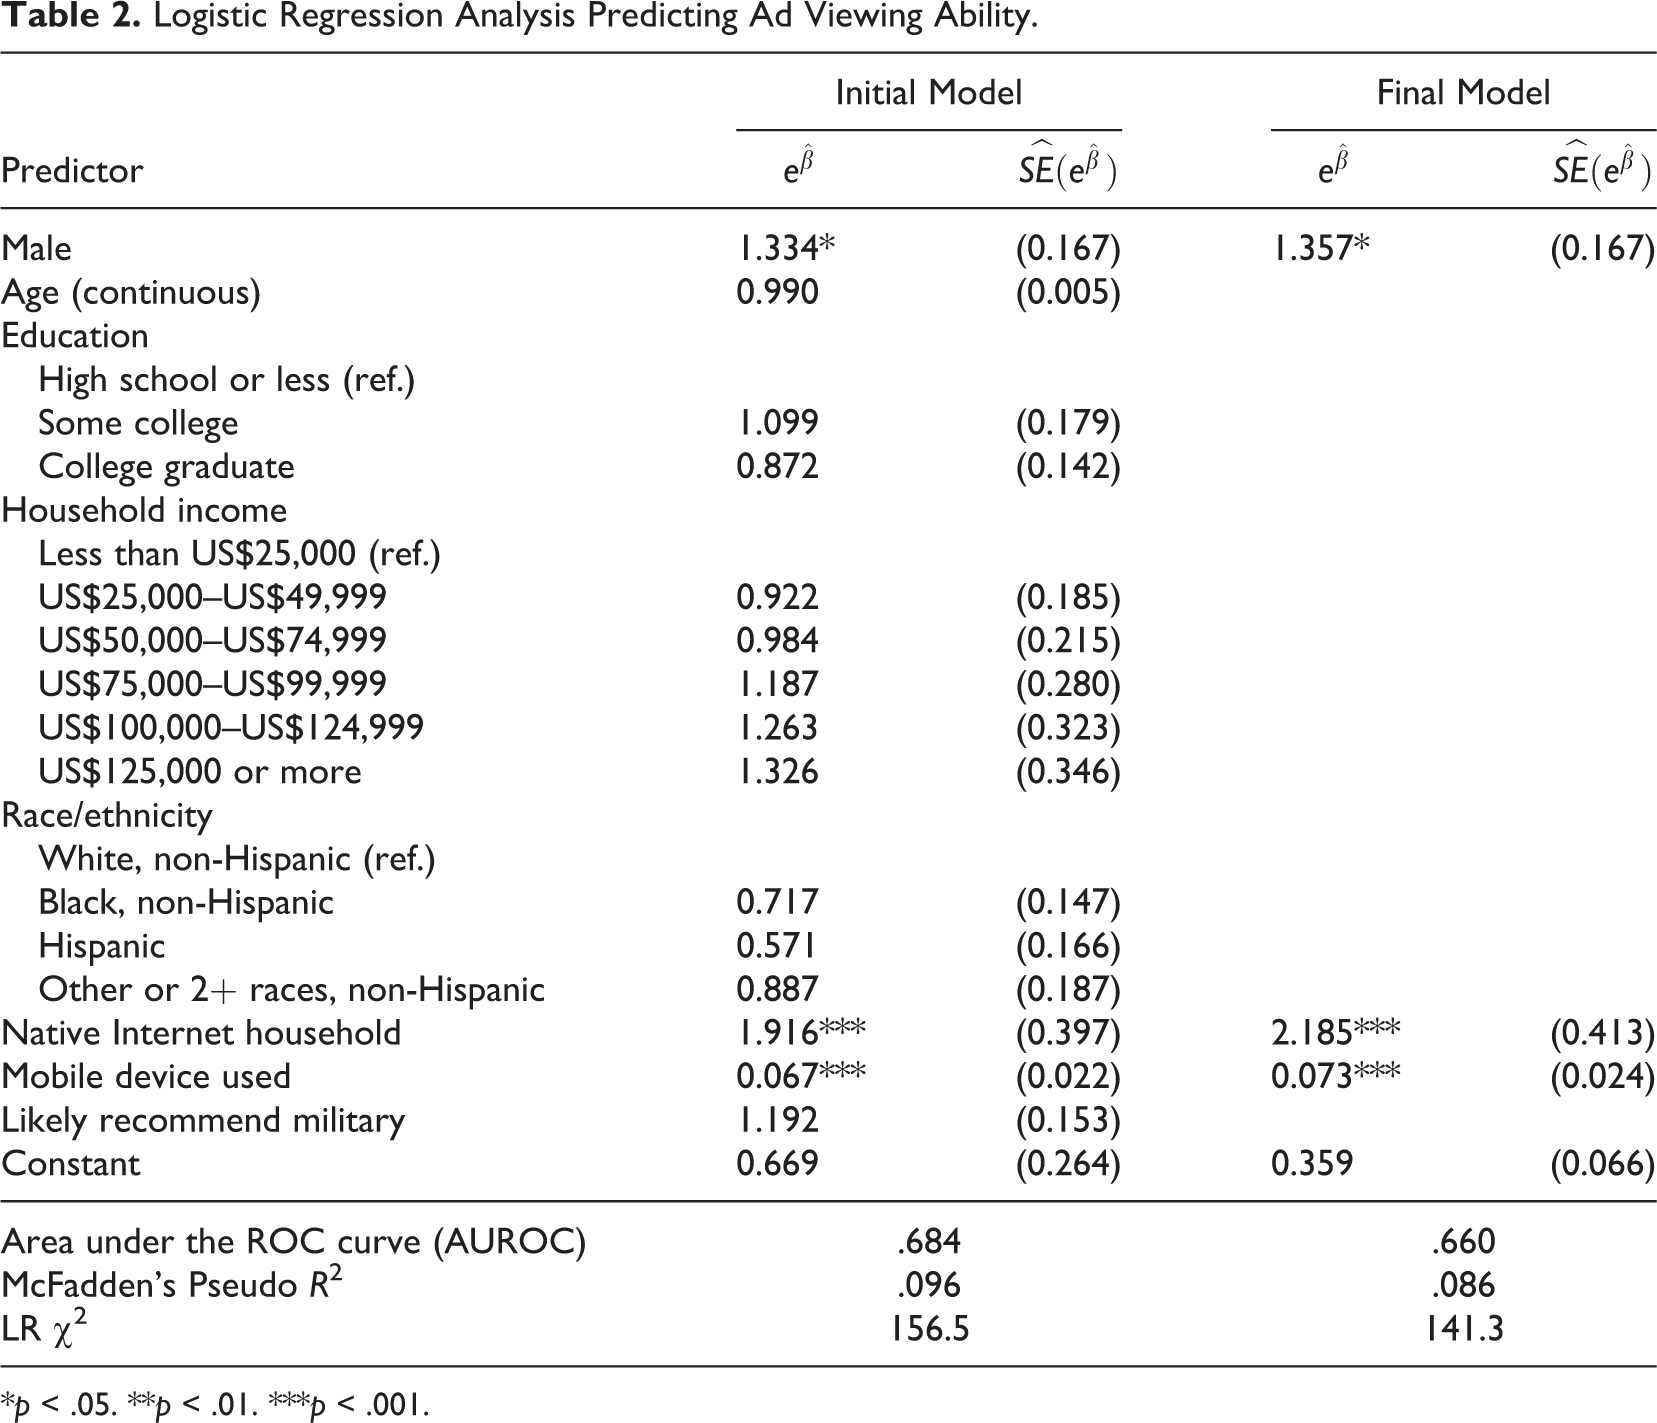
*p < .05. **p < .01. ***p < .001.
These results indicate that mobile compatibility and/or bandwidth issues could have sizable impacts on measurement for web surveys. Only 6% of respondents who completed the survey on mobile were able to view videos, compared with 45% of respondents who completed the survey on computers. Given that panel households without Internet access were generally supplied with dial-up rather than broadband, their lower rates of viewing ability may relate to Internet speed.
Question 2: How Does Mode Affect Ad Recall?
Next, we examined differences in aided ad recall (i.e., recognition) based on whether respondents were shown images or videos, using demographics and the unaided recall questions to control for possible confounds. A random effects logistic model was estimated to account for the nested nature of observations within respondents and predict dichotomous ad recall for the eight advertisements (1 = yes, 0 = no, not sure, or refused). The predictors used were demographic characteristics (limited to those that were marginally significant in the previous model), mobile device usage, Service-specific likelihood to recommend military service (as a possible attitudinal correlate of ad recall), and unaided advertising recall for the given Military Service (1 = yes, 0 = no, not sure, or refused). Although mode and recall are confounded, the use of unaided recall as a covariate may help to lessen this effect. Key sample characteristics are displayed in Table 3 (central column for observations included in the Question 2 analyses; rightmost column for the observations included in the Question 3–Question 4 analyses).
Sample Characteristics (by Respondent and Ad, Complete Records Only).

Note. The table above excludes observations from individuals who encountered technical problems; similarly, it excludes observations for which there were item-missing data for any covariates used in the Question 2–Question 4 analyses.
Results indicated that being shown videos was associated with greater aided ad recall rates,
Random Effects Logistic Model Predicting Aided Ad Recall of Individual Ads.
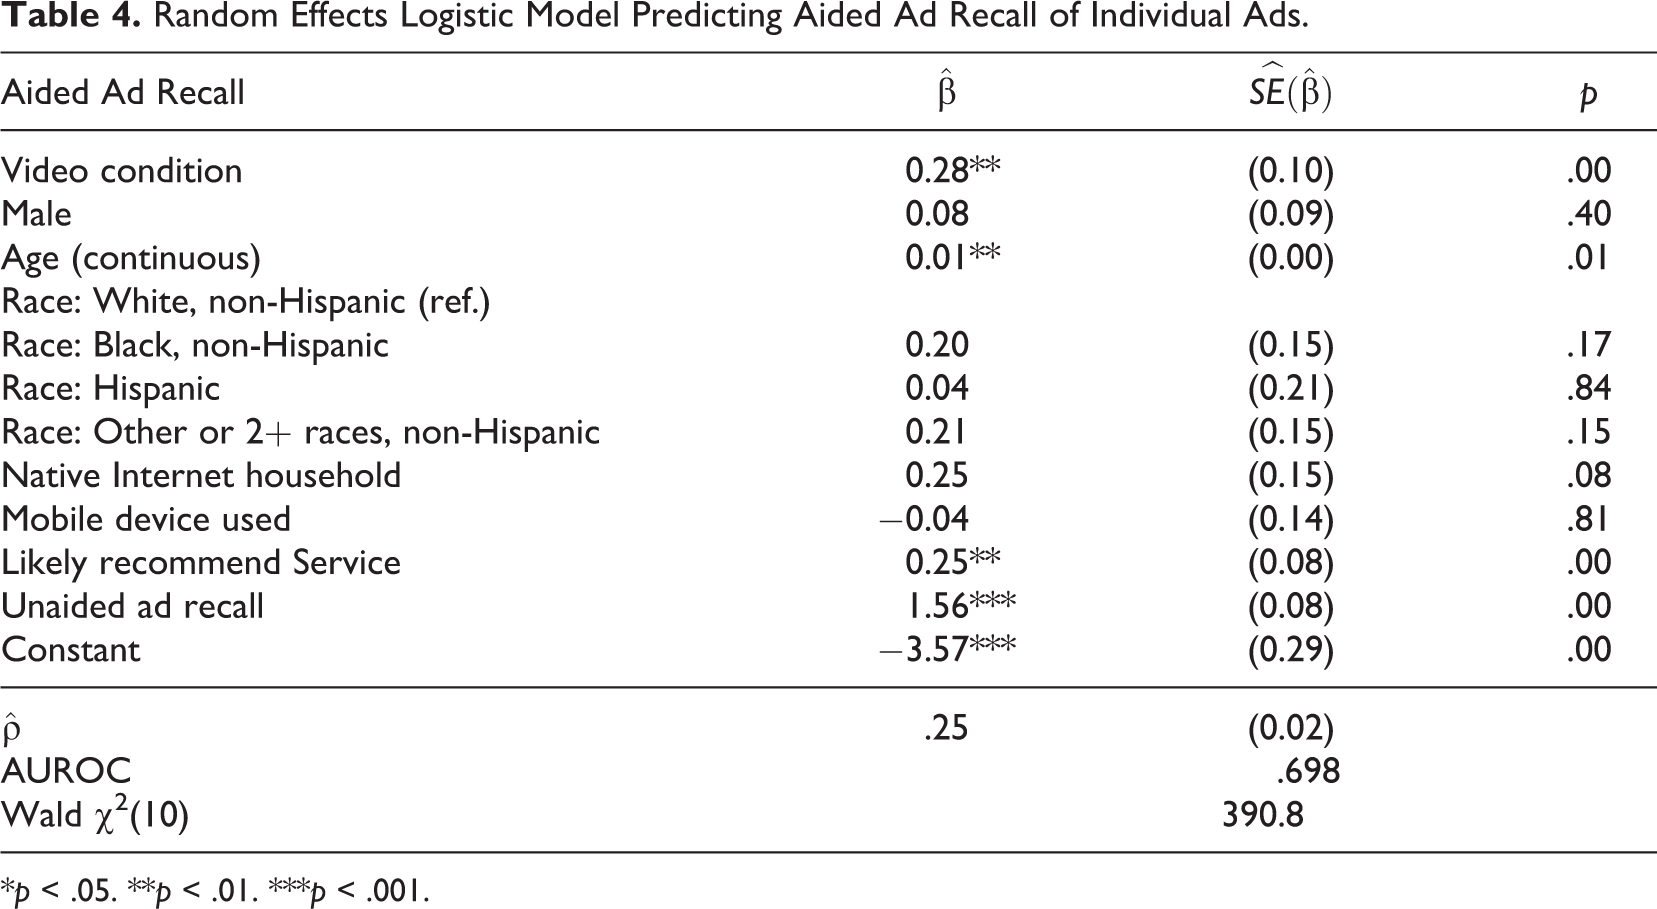
*p < .05. **p < .01. ***p < .001.
Random Effects Logistic Model Predicting Not Sure Response to Individual Aided Recall.
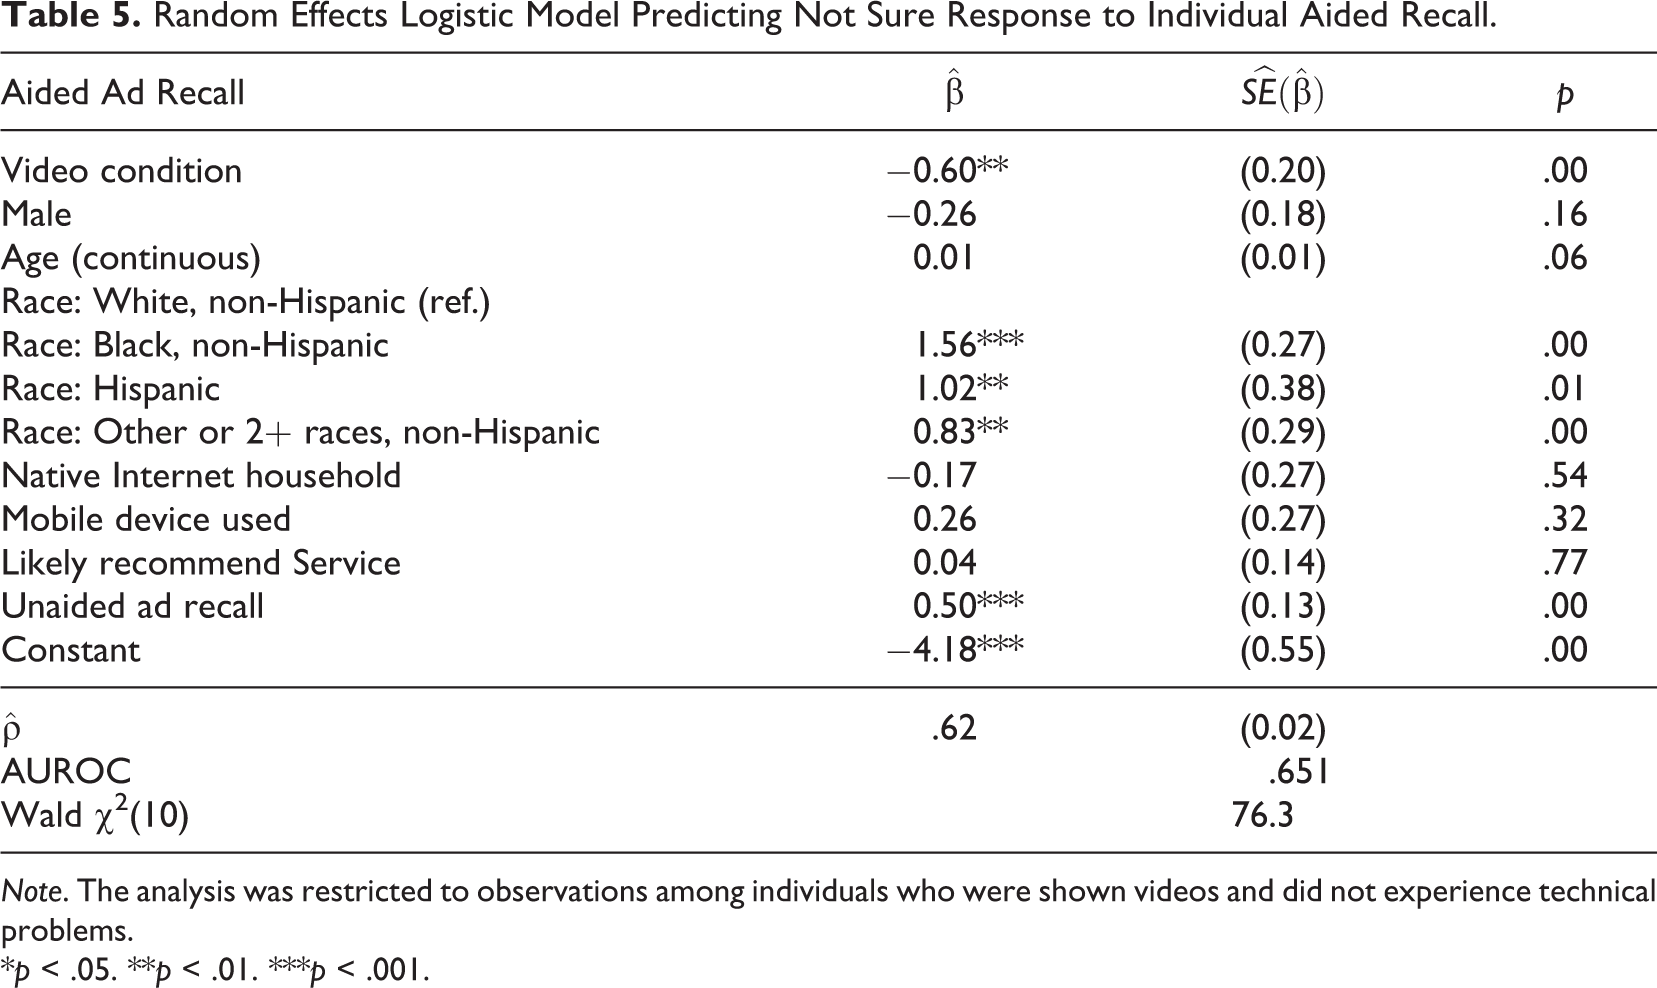
Note. The analysis was restricted to observations among individuals who were shown videos and did not experience technical problems.
*p < .05. **p < .01. ***p < .001.
Question 3: How Do Video Viewing Behavior and Presentation Affect the Data Quality of Follow-Up Questions?
Next, we examined response differentiation and the selection of not sure options in the follow-up ad reaction questions among respondents who were shown videos, based on demographics, whether or not respondents viewed the entire videos, and presentation order. The model was restricted to respondents who successfully viewed videos (n = 486). A random effects logistic model was estimated to predict whether respondents straightlined the follow-up questions. The dependent variable was coded as 1 for respondents who straightlined both follow-up question batteries and 0 for all others. The predictors included the presentation order of the ad, demographics, Service-specific likelihood to recommend military service, and a variable that indicated whether the respondent watched the entire ad (1 = yes, 0 = no). Mobile browser usage was excluded from the model, given that very few respondents successfully viewed videos using a mobile browser.
Respondents who watched the entire ad were significantly less likely to straightline both follow-up batteries,
Random Effects Logistic Model Predicting Straightlining of Both Follow-Up Batteries Based on Presentation Order.
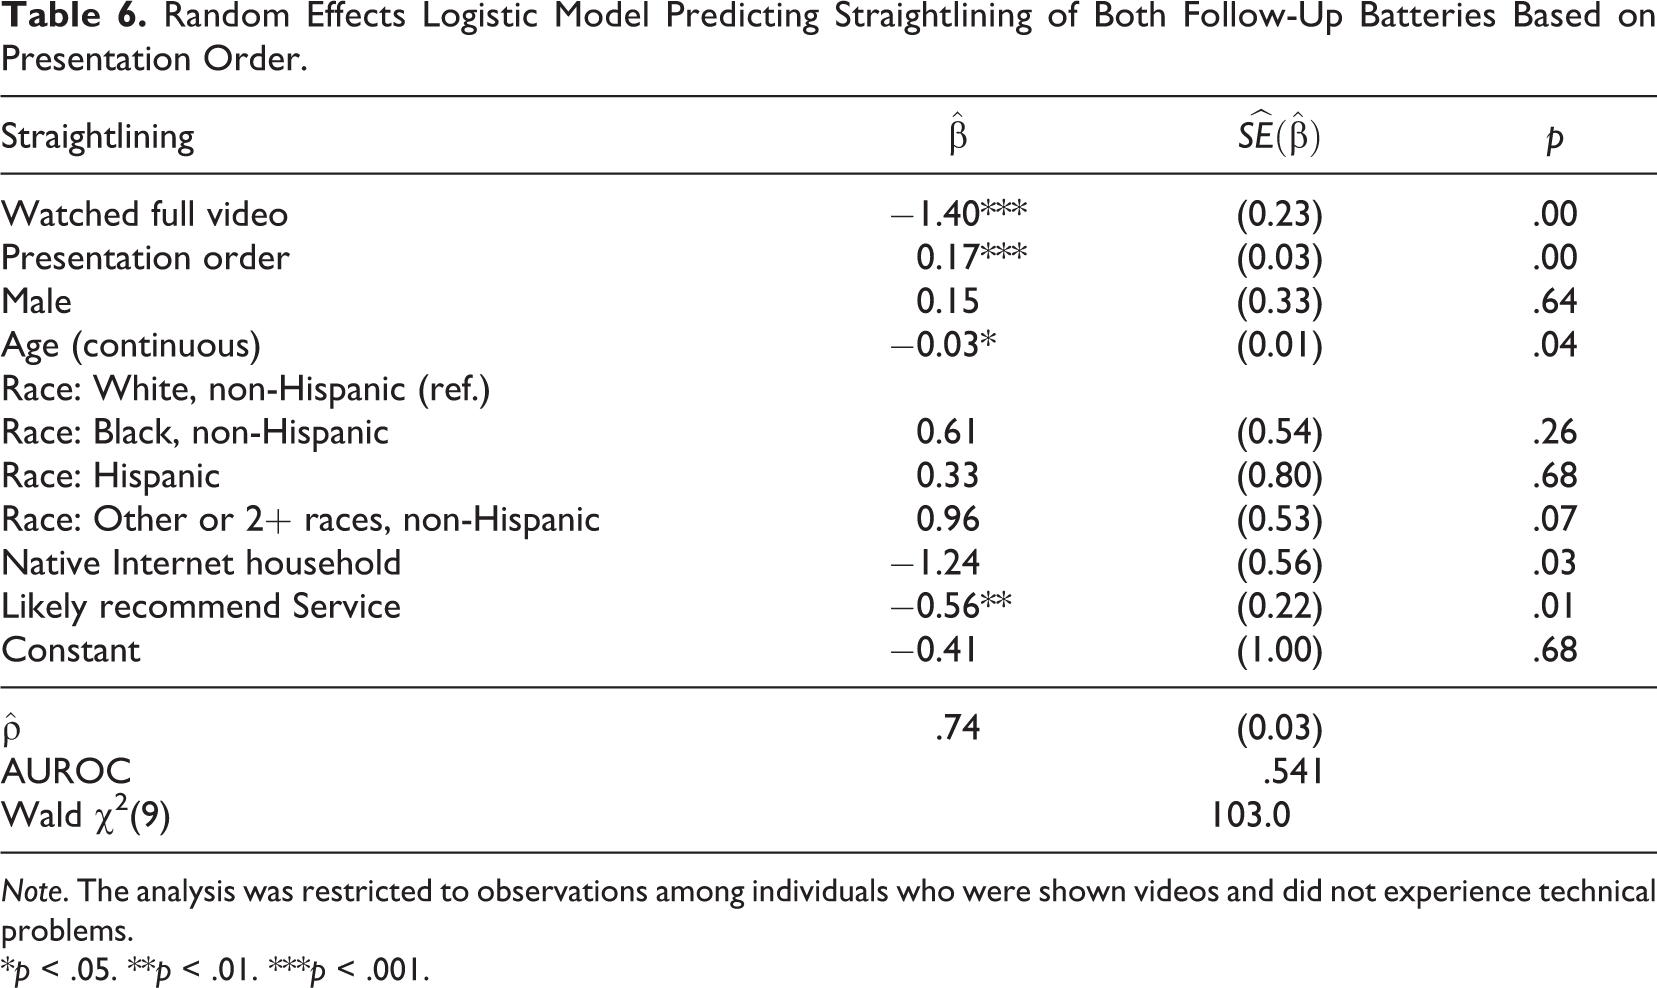
Note. The analysis was restricted to observations among individuals who were shown videos and did not experience technical problems.
*p < .05. **p < .01. ***p < .001.
Next, a random effects model was estimated predicting the number of not sure responses in the follow-up items (Table 7). Across all respondents and all ads, the mean number of not sure responses was 2.32 (range 0–12). The predictors were the same as in the previous model. Respondents who watched the full ad provided significantly fewer not sure responses to the follow-ups,
Random Effects Model Predicting Number of Not Sure Responses to Ad Follow-Up Items.
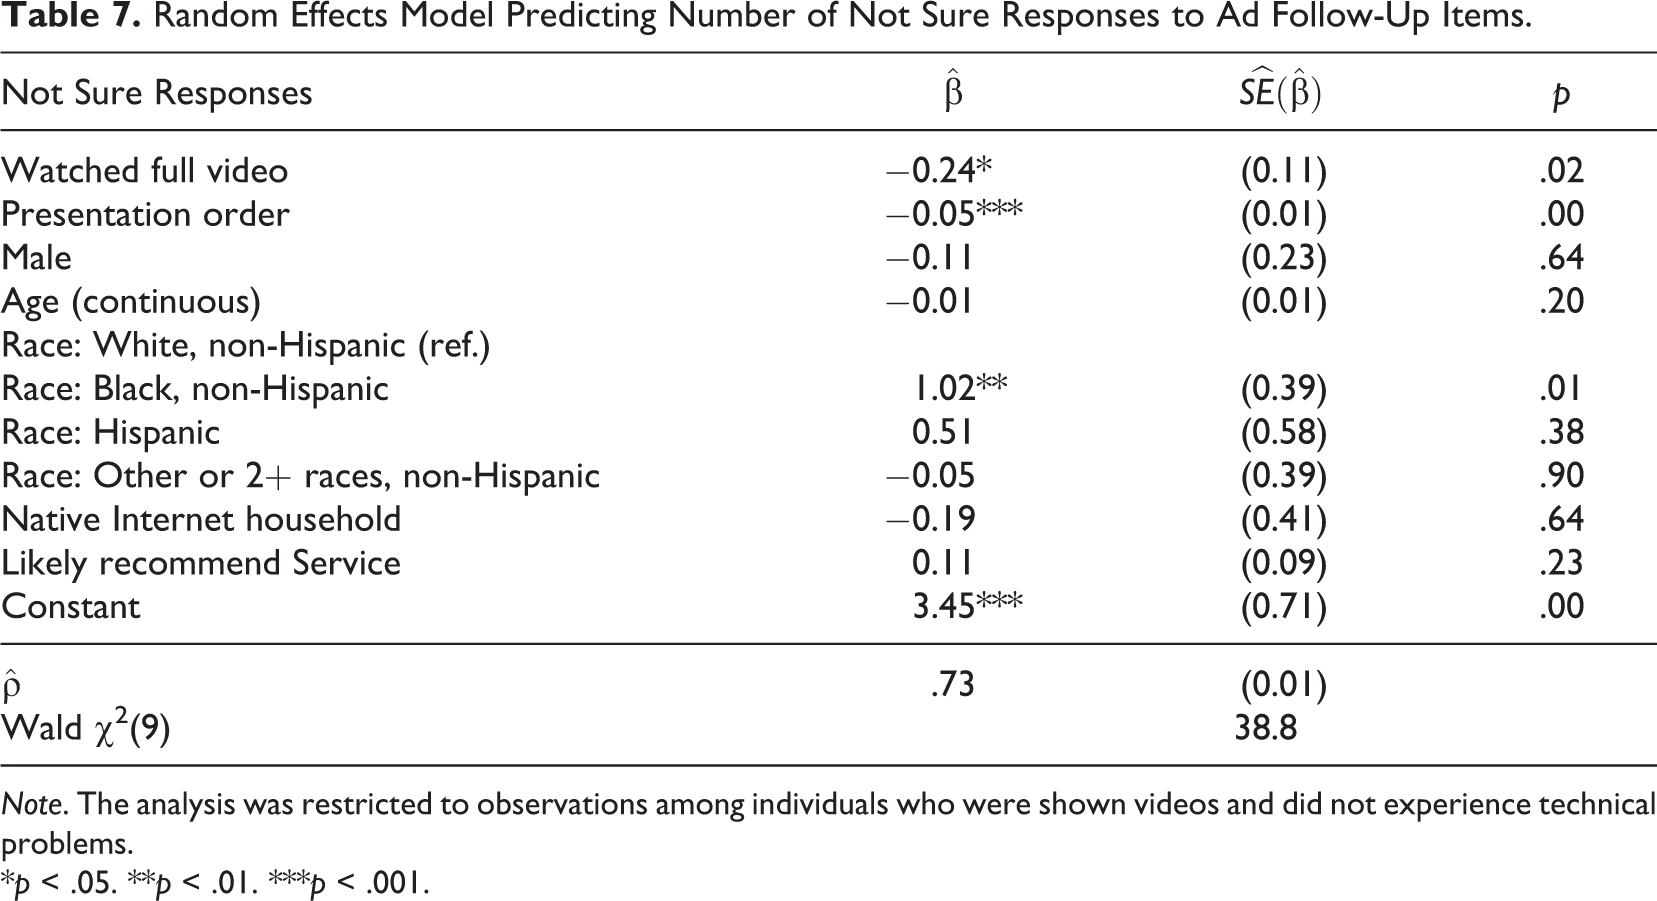
Note. The analysis was restricted to observations among individuals who were shown videos and did not experience technical problems.
*p < .05. **p < .01. ***p < .001.
Thus, data quality indicators for the follow-up questions varied across stimuli and across respondents as a function of presentation order and complete viewing. Ads viewed later in the survey were less likely to be viewed completely, and incomplete viewing of ads was related to straightlining and increased not sure responses.
Question 4: How Does the Order of Video Presentation Affect Whether the Videos Are Fully Watched?
We estimated a random effects model to predict whether respondents who were shown videos viewed the entire advertisements, based on demographics and presentation order (n = 486 respondents who were shown videos and did not experience technical problems). Time spent viewing the ad was coded as 1 for respondents who spent 30 seconds or more watching the ad, based on server-side timestamps, and 0 otherwise. Independent variables included the randomized presentation order of the ad, demographics, and Service-specific likelihood to recommend military service. The demographic variables were the same as in the previous set of regressions.
When ads were shown later in the survey, respondents were less likely to view those ads in their entirety, p < .001 (Table 8). This suggests that ad viewing behavior may be affected by factors such as survey fatigue.
Random Effects Logistic Model Predicting Video Ad Viewing Based on Presentation Order.
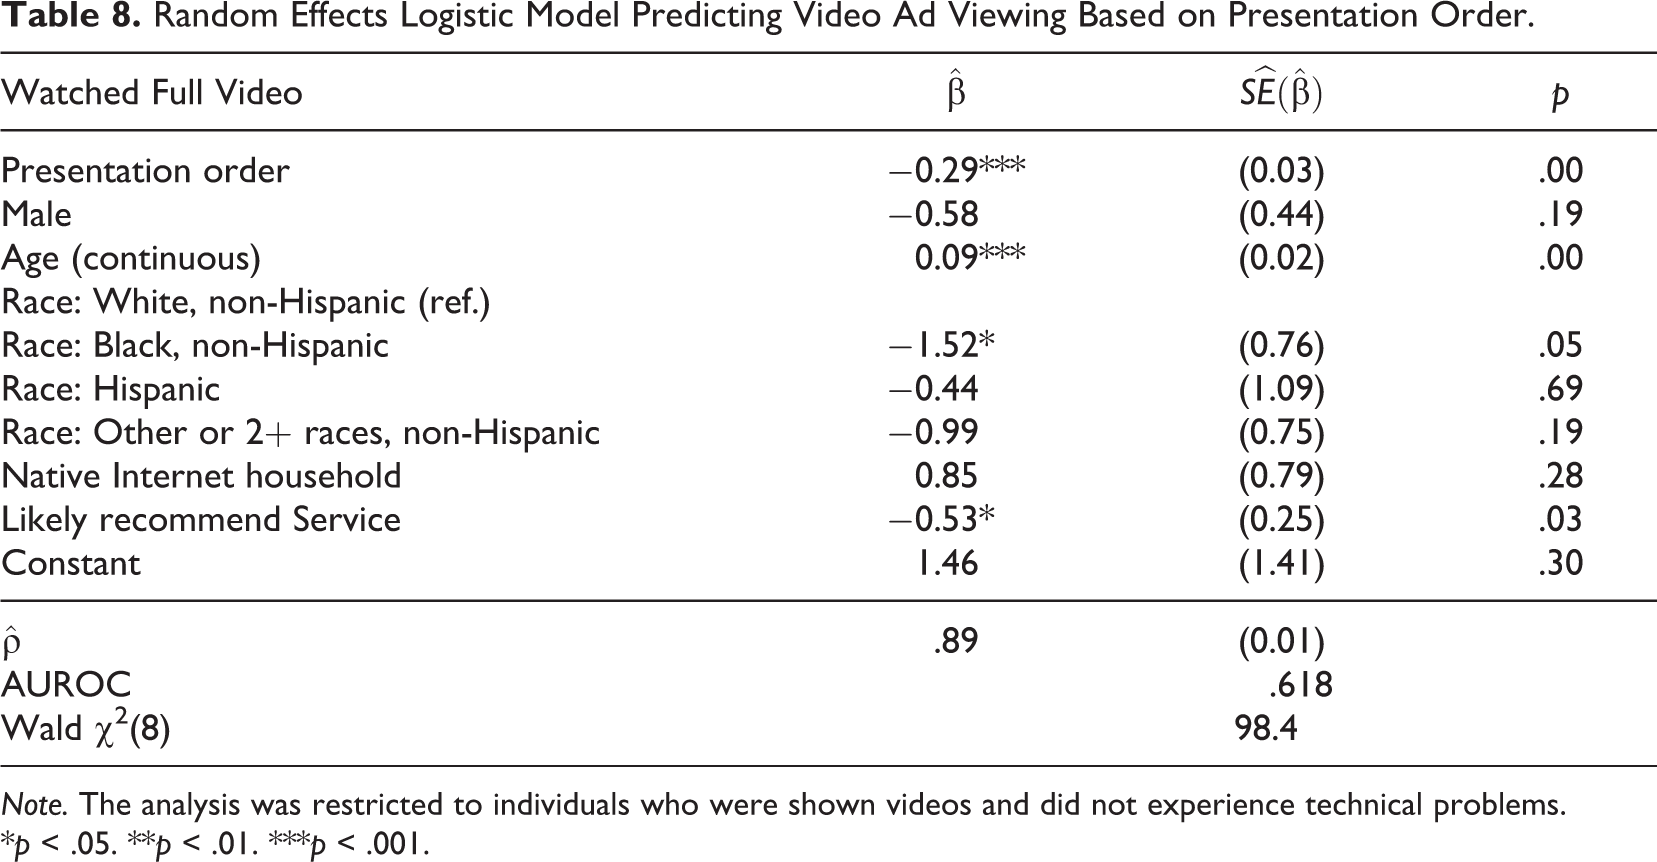
Note. The analysis was restricted to individuals who were shown videos and did not experience technical problems.
*p < .05. **p < .01. ***p < .001.
Summary and Discussion
The key findings from this exploratory study are: Video viewing ability was related to mobile device usage, household Internet access, and gender. Those using a mobile device were less likely to be able to view videos compared with those using computers; those with preexisting Internet access were more likely to view videos than those without; and males were more likely to view videos. These results suggest that mobile compatibility and bandwidth issues impact measurement for web surveys, particularly when rich media are involved. Mode was associated with ad recall: those who viewed videos were more likely to indicate ad recall and were more likely to give a definite response (yes or no) than those who viewed images. These results suggest that video stimuli may be more effective than image stimuli in prompting memory. The data quality of follow-up items varied across respondents as a function of presentation order and complete viewing. Respondents who did not view videos in their entirety were more likely to straightline the follow-up items and provide more not sure responses. Videos that were shown later in the survey were less likely to be viewed in their entirety, suggesting video viewing behavior may be affected by survey fatigue.
Given the fidelity of video stimuli for prompting memories of television advertisements, researchers may favor a video-based question format. However, this format introduces concerns regarding response accuracy and data completeness. Our results indicate that respondents who access a survey through a mobile device may have difficulty viewing videos. Survey designers including videos need to consider whether and to what extent their sample will access the survey through a mobile device and whether the levels of missing data are acceptable. This is particularly important given rising usage of mobile devices for surveys. Although changes to the video delivery format used in our study have led to large increases in ability to view videos, differences between mobile and nonmobile respondents have persisted. 10
Further, respondents may not watch the entirety of videos. Most participants in this study (85%) viewed the whole first ad they were shown, and viewing decreased with order of presentation—only 74% watched the entire eighth ad they were shown. Incomplete ad viewing was significantly associated with not sure responses to the recall question and straightlining responses to subsequent questions. Although these data may truly reflect respondents’ recall, beliefs, or genuine lack of knowledge, these behaviors may indicate satisficing.
Using data from a large field survey in which respondents likely used devices with which they were familiar, we have demonstrated potential advantages and challenges associated with using videos in web-based surveys. While the field survey allowed us to collect data naturalistically, we did not have the advantages of a controlled lab study, such as random assignment to experimental groups or within-person comparisons of video and still image conditions. As such, the ability to view ads and being in the video condition were confounded given that respondents who were unable to view videos were not supplied with a way to view videos; further, nearly all respondents completing the survey using mobile devices were unable to view videos. While we attempted to account for possible demographic confounds by including relevant control variables in the regression models, we were unable to separate mobile device usage and video viewing ability. However, this real-world condition reflects a generalizable experience and informs about what to expect from a survey that includes videos.
To ensure that all respondents could answer questions about the ads of interest, respondents who were unable to view videos were shown still images. Results suggest that video stimuli may be more effective at prompting memory. Having seen videos was generally associated with higher levels of ad recall and increased certainty (fewer participants responding not sure to the recall question) compared to having seen images. It may be that (1) the videos prompted more false memories of the ads or (2) participants who viewed the videos were more likely to have seen the ads before the study. However, the videos were likely to facilitate memory recall since they are more similar to the advertisements being evaluated than the still images in terms of sensory input mode. Remembering involves accessing information that has been encoded in memory. During recall, the brain “replays” the connections that were encoded. Because memory depends on both the nature of the memory and the information available in the retrieval environment (Eysenck & Keane, 2000), it is likely that video stimuli are more effective memory cues than still images for recall of television ads.
Researchers must account for potential incomplete or low-quality data when designing web surveys that require videos. Video length may be reduced in some contexts in an attempt to minimize incomplete viewing, as may the number of videos. Number of videos or number of follow-up questions may be reduced by employing between-person or incomplete counterbalanced designs. If number of videos cannot be reduced, survey designers might consider modifying question order, so that videos are interspersed, shown earlier in a survey, grouped separately from follow-ups, or must be viewed completely before progressing to the next survey item; though modifying the question order rather than reducing the questionnaire length might change the pattern of missing data instead of reducing the overall amount of missing data. Finally, researchers should randomly assign video order when possible since order effects are evident, and incomplete viewing is related to response behavior.
In conclusion, we have demonstrated that survey respondents who used mobile devices were less likely to be able to view videos in a web-based survey, those who could view videos were more likely to indicate recall compared to those who viewed images, and videos that were shown later in the surveys were viewed in their entirety less frequently than those shown earlier in the survey. Our results directly speak to the legitimacy of using videos in web-based surveys to gather data about attitudes.
Footnotes
Authors’ Note
The views, opinions, and findings contained in this paper are solely those of the authors and should not be construed as an official U.S. Department of Defense position, policy, or decision, unless so designated by other documentation.
When this work was conducted, all authors were employed by Fors Marsh Group; Jennifer Romano-Bergstrom is now at Facebook.
Declaration of Conflicting Interests
The authors declared no potential conflicts of interest with respect to the research, authorship, and/or publication of this article.
Funding
The authors received no financial support for the research, authorship, and/or publication of this article.