
Abstract
Does completing a web survey on a smartphone or tablet computer reduce the quality of the data obtained compared to completing the survey on a laptop computer? This is an important question, since a growing proportion of web surveys are done on smartphones and tablets. Several earlier studies have attempted to gauge the effects of the switch from personal computers to mobile devices on data quality. We carried out a field experiment in eight counties around the United States that compared responses obtained by smartphones, tablets, and laptop computers. We examined a range of data quality measures including completion times, rates of missing data, straightlining, and the reliability and validity of scale responses. A unique feature of our study design is that it minimized selection effects; we provided the randomly determined device on which respondents completed the survey after they agreed to take part. As a result, respondents may have been using a device (e.g., a smartphone) for the first time. However, like many of the prior studies examining mobile devices, we find few effects of the type of device on data quality.
Tourangeau, Conrad, and Couper (2013) argue that web surveys have good measurement properties. However, their conclusion is based on experiments and other results from web surveys that were almost exclusively done on personal computers (PCs). A growing proportion of web surveys are now completed on smartphones or tablets rather than laptop or desktop computers (Lugtig & Toepoel, 2015; Mavletova, 2013; Struminskaya, Weyandt, & Bosnjak, 2015). Although much of the work on smartphones for web surveys has been done in Europe, many web surveys are being completed on tablets or smartphones in the United States as well.
Smartphones may increase various forms of nonresponse to web surveys as compared to PCs, including the rates of unit nonresponse, item nonresponse, and breakoffs (see Couper, Antoun, & Mavletova, 2017). However, it is not clear whether web surveys done on smartphones maintain the desirable measurement properties of web surveys done on other types of devices. There are at least three reasons to suspect that they may not.
First, the screens on smartphones are smaller than those on tablets or PCs and smartphone respondents may have to scroll to see the entire question or the full set of response options. This could lead to larger response order effects or to more superficial processing of the questions. Web respondents are more likely to select response options that they can see immediately than options that require an action (such as scrolling) to render them fully visible (Couper, Tourangeau, Conrad, & Crawford, 2004). The need to scroll on a smartphone may make it less likely that respondents will see and consider all the options or process other information they need to give an adequate answer to the question. However, a recent paper by Tourangeau et al. (in press) found that smartphone respondents did not show larger response order effects and were no more prone to ignore definitions than respondents who completed the same survey on a tablet or laptop—in fact, smartphone respondents seemed more likely to attend to definitions than tablet or laptop respondents. It is possible that respondents expect to have to scroll based on their experience with smartphones or that they find scrolling no more effortful than making eye movements.
Another source of concern has been the touch screen interface. Both tablets and smartphone use this interface, but the smaller screens on smartphones could interact with the touch screen interface to make it harder for smartphone respondents to register their answer, leading to item nonresponse or inadvertent choice of the wrong answer.
A third source of concern is that smartphone respondents may complete surveys in settings where other people or other potential distractions are present. This could lead to less candid reporting of sensitive information or sloppier reporting overall. However, Mavletova and Couper (2013), as well as a recent replication by Toninelli and Revilla (2016), found little support for these hypotheses.
The studies that have examined how collecting data on smartphones affects the answers respondents give have generally taken two approaches. Some have collected data only on smartphones but have included experiments within that mode, manipulating the number of items per screen or whether the survey used a paging or scrolling design (de Bruijne & Wijnant, 2014; Mavletova & Couper, 2014, 2015; Peytchev & Hill, 2010). Others compared smartphone responses with those obtained by PC or tablet, sometimes in randomized experiments (de Bruijne & Wijnant, 2013; Keusch & Yan, 2016; Mavletova, 2013; Mavletova & Couper, 2015; Wells, Bailey, & Link, 2014) and sometimes in quasi-experimental designs (Lugtig & Toepoel, 2015; Struminskaya et al., 2015).
These past studies support several generalizations: Smartphone respondents have higher levels of item nonresponse than those completing the survey on tablets or PCs (Keusch & Yan, 2016; Lugtig & Toepoel, 2015; Struminskaya et al., 2015; but see Andreadis, 2015 ; Buskirk & Andrus, 2014). It takes more time to complete a survey on a smartphone than on a tablet or PC (Andreadis, 2015; Buskirk & Andrus, 2014; de Bruijne & Wijnant, 2013; Keusch & Yan, 2016; Struminskaya et al., 2015). Answers to narrative open-ended questions are often shorter on smartphones than on tablets or PCs (de Bruijne & Wijnant, 2013; Mavletova, 2013; Struminskaya et al., 2015), though not always (Lugtig & Toepoel, 2015; Toepoel & Lugtig, 2014).
Tourangeau and his colleagues (in press) provide a more comprehensive summary of the prior work comparing smartphones with tablets or PCs (see also Couper et al., 2017).
Still, the past studies have their limitations. Most of them were done in Europe and, with the ones in Russia, some respondents completed the survey on low-tech feature phones rather than on smartphones. In addition, the experiments are often prey to substantial noncompliance, with respondents randomly assigned to one device instead using another device to do the survey. On the whole, though, the results are reassuring—responses by smartphones appear to be very similar to responses obtained by tablet or PC and the differences that are found (such as differences in item nonresponse) are not very large (Couper et al., 2017).
We carried out a randomized field experiment that attempted to minimize some of the problems with the prior work. First, our study used samples selected via address-based sampling, and respondents were contacted and recruited by field interviewers. Second, we randomly assigned respondents to one of the three devices (a smartphone, tablet, or laptop computer). To reduce any selection effects, we informed participants which device—smartphone, tablet, or laptop—they were assigned to only after they had agreed to complete the questionnaire. Third, the interviewers provided the device, so that all the interviews were done on the same smartphone, tablet, or laptop. Noncompliance was not possible in our study; the web program would only accept data provided on the assigned device.
We examined five main outcomes: item nonresponse, straightlining; completion times, scale reliability (assessed by coefficient α, scale information functions, and differential item functioning [DIF]), and scale validity (assessed by construct validity coefficients).
In each case, we tested the hypothesis that the outcomes would differ across the three types of devices.
Method
Sample
We selected address-based samples in each of eight counties around the United States; the samples in each county were designed to represent the adult household population there. The counties themselves were selected purposively based on the availability of experienced field staff. Still, the eight sample counties encompassed a range of different types of areas. Seven were in metropolitan statistical areas and the other was rural; one of the seven metropolitan areas involved a small central city. The eight counties included all four Census regions.
Within each county, we selected a full probability sample of addresses (i.e., every address had a known and nonzero probability of selection.) We used Census block groups as the second-stage sampling units (SSUs). Six SSUs were selected from each county with probabilities proportional to size (in housing units). One SSU was on a military base and was replaced with the next SSU in the county. In total, we selected 1,824 addresses, 228 within each sample county and 38 in each sample SSU. One hundred and forty-two of the addresses were vacant, could not be found, or turned out not to be dwellings, leaving a final sample of 1,682 occupied dwelling units.
When they contacted a household, interviewers tried to complete a short screener with an adult there. In households with just one adult, he or she was selected for the main interview; in households with two adults, one of the two was selected randomly; and in households with three or more adults, the last birthday method was used to select one for the main interview. Once the sample person had been designated, he or she was asked to complete the interview on a device that had been randomly determined ahead of time. Sample persons were offered a $20 incentive to complete the questionnaire.
Data Collection
Experienced field interviewers conducted data collection from January 21, 2015, through May 4, 2015. They completed 512 interviews, for an overall response rate (American Association for Public Opinion Research [AAPOR] response rate 3 (RR3); see AAPOR, 2016) of 30.4%. The response rates (smartphone 32.9%, tablet 29.6%, and laptop 28.8%) did not differ significantly across the three device conditions (Rao–Scott χ2 = 4.13 with 2 df). Only two cases could not be completed because of problems with cellular coverage, one each in the smartphone and laptop conditions.
Respondents were asked to complete the questions on a device that the interviewer provided while the interviewer remained present. 1 Interviewers were instructed to complete administrative tasks while the respondents answered the survey questions. The overall topic of the questionnaire was health. The interviewer could not change the assigned device type, and the web instrument was programmed to accept data only from the assigned device type.
We examined the demographic makeup of the three device groups, by age, education, sex, Hispanic origin, and race (White vs. non-White). We compared the three device groups on these variables, using the SAS survey procedures that took the clustering of the sample into account. The smartphone group had significantly more females (64.2%) than the tablet and laptop groups (both 50.0%); Rao–Scott χ2 = 8.58 with 2 df (p < .05). In addition, the three device groups differed significantly in their racial composition (Rao–Scott χ2 = 17.4 with 2 df, p < .001), with the laptop group having the highest proportion of Whites (85.8%), the smartphone group, the lowest (78.1%), and the tablet group in between (80.1%). The three device groups did not differ on the other demographic variables. In the subsequent analyses, we included race and sex as covariates (because they differed across the device types) as well as age and education (because we thought they were likely to be related to the size of any device effects).
Data Collection Devices
The key experimental variable in the study was the type of device respondents used to complete the survey. The devices differed in screen size and input method. The laptop featured a mouse and keyboard, whereas the smartphone and tablet used touch screen interfaces.
Each interviewer was provided with a smartphone (an iPhone 5S), a tablet (an iPad Air), and a laptop (a Fujitsu Lifebook E753). We chose these specific models because they varied markedly in screen size (see Figure 1, which shows the relative sizes of each device). Most tablet and smartphone respondents completed the survey in “portrait” orientation, and Figure 1 displays the screens in that orientation. (The percentage of respondents in portrait mode ranged from 52% to 56% in the tablet condition, depending on the specific screen, and from 88% to 98% in the smartphone condition.) Although the web program did not display the entire laptop screen (see the dashed area in Figure 1), the area that was displayed was still about 50% larger than the tablet screen. The survey was not optimized for smartphones.
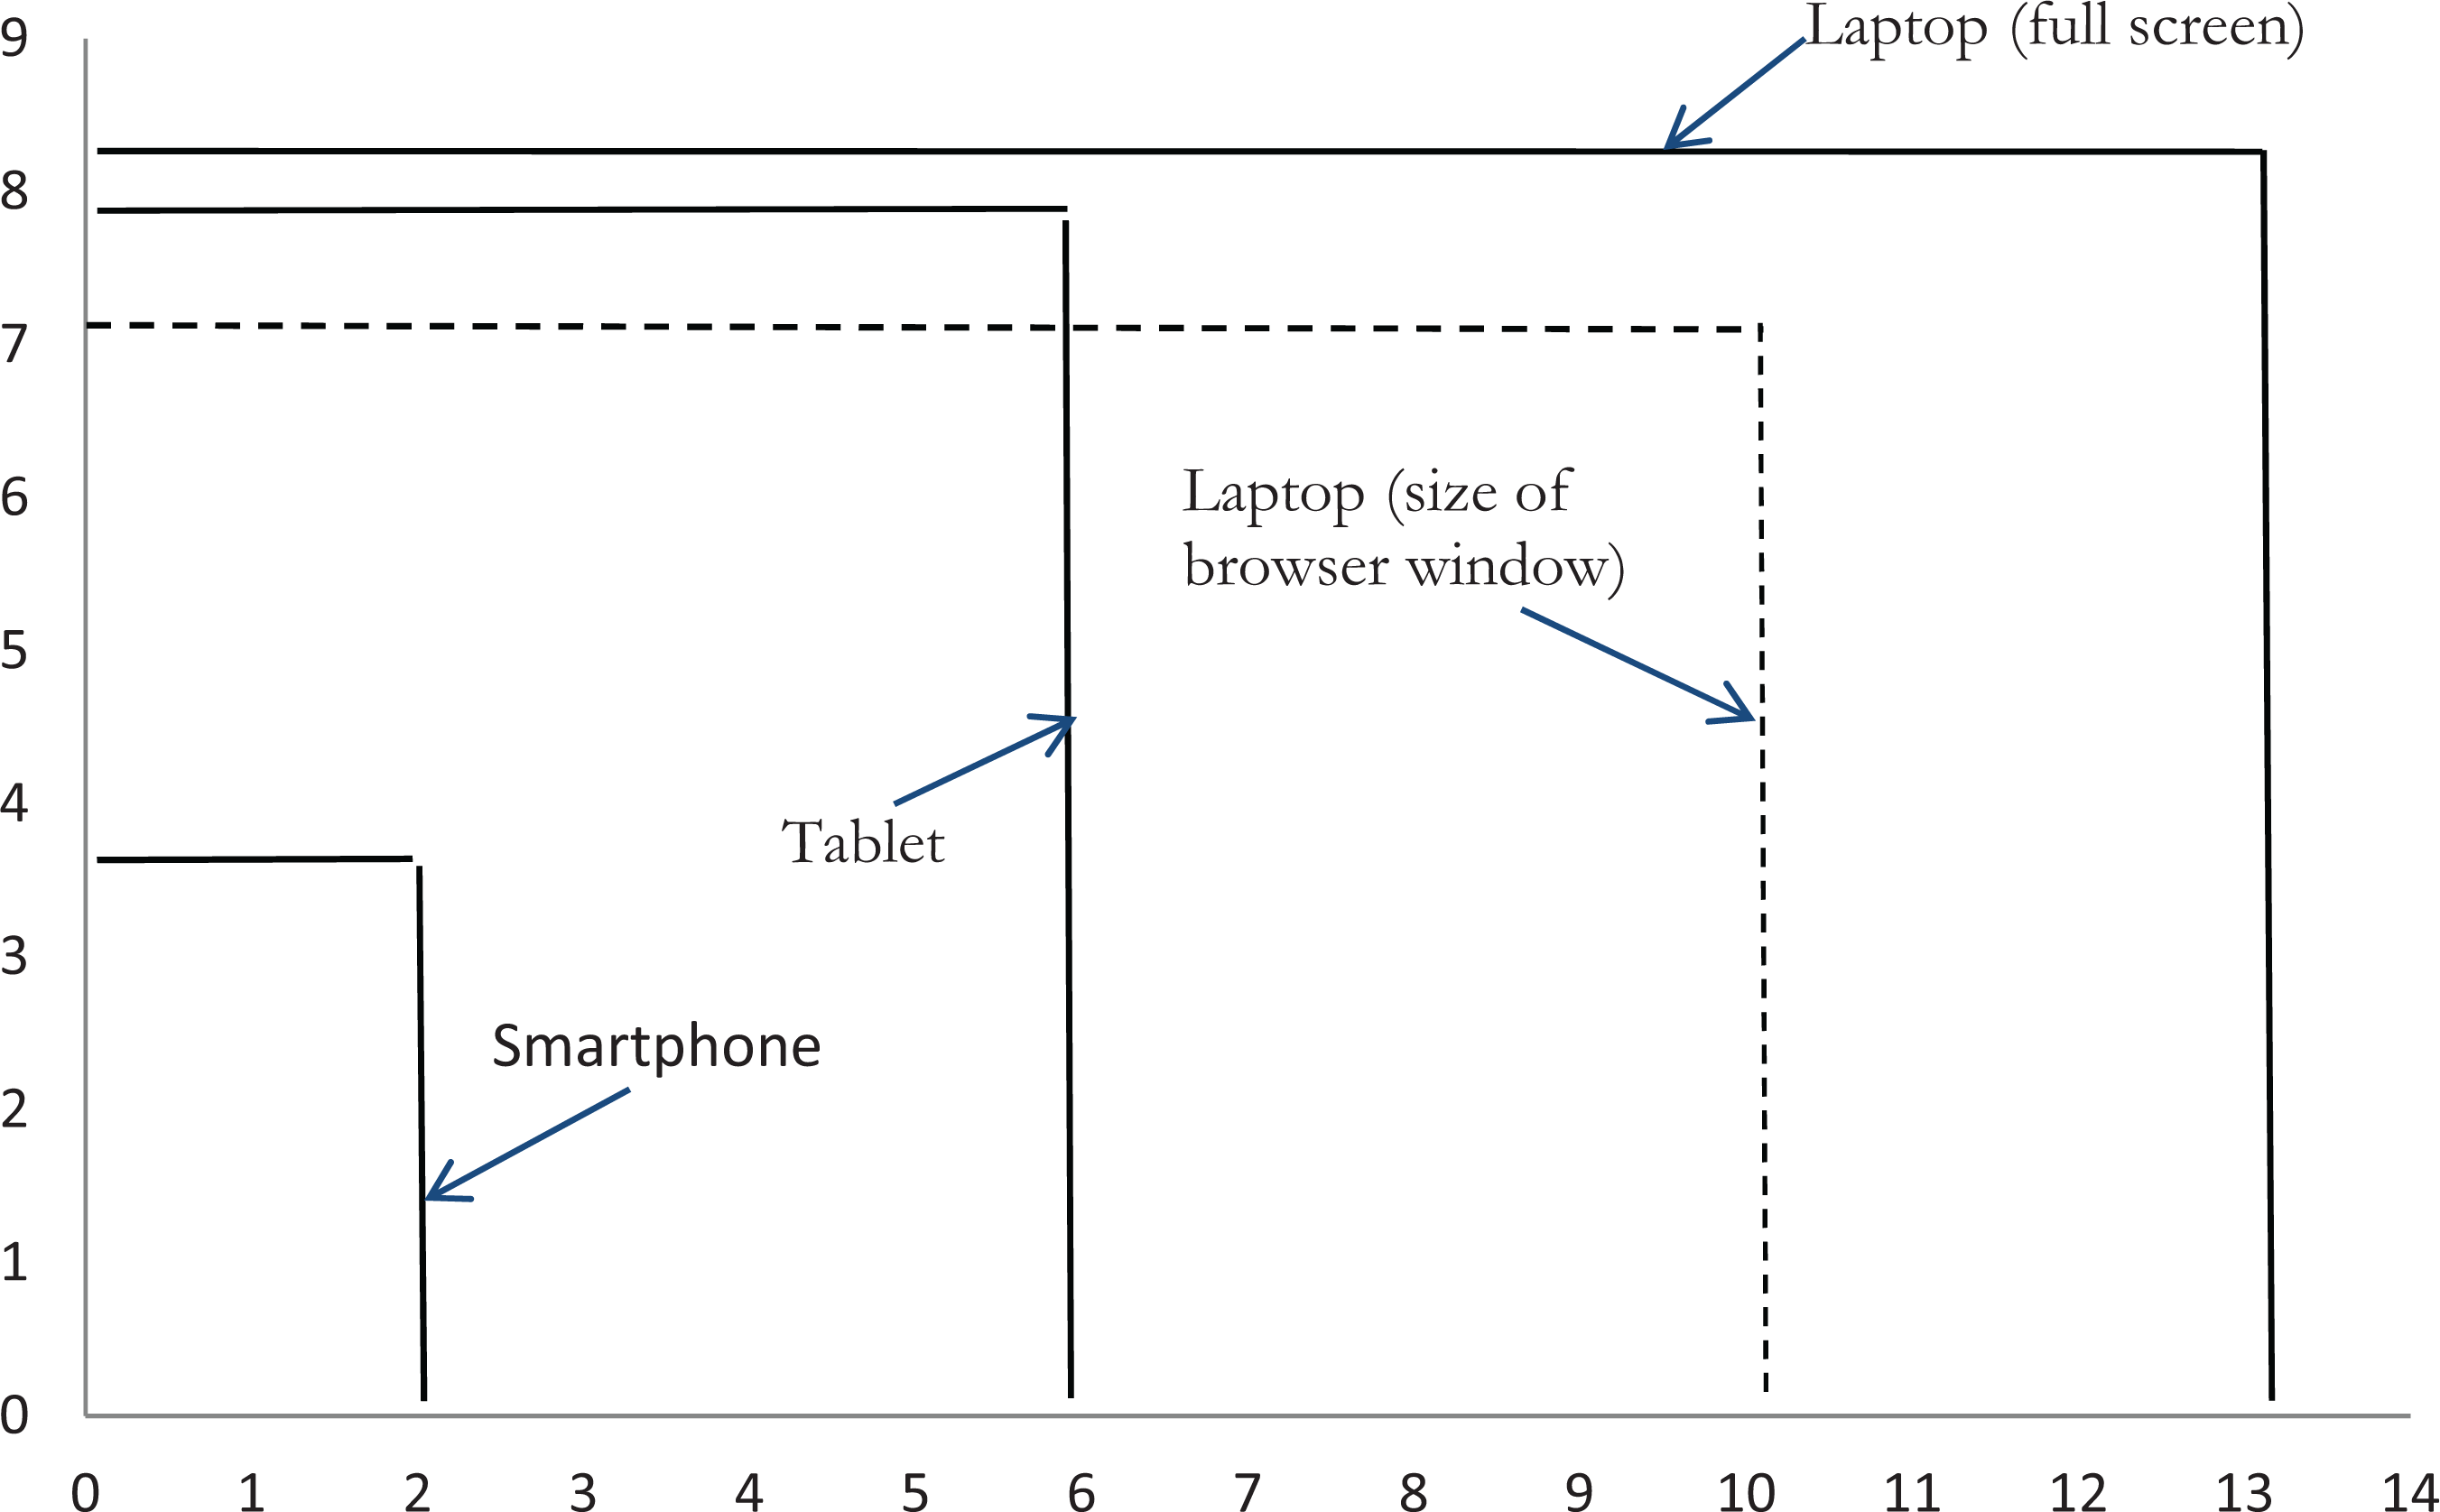
Relative screen size of the three devices. The dashed outline shows actual web browser size displayed on laptop screen. The numbers indicate the size of each device in inches.
Appendix A shows screen shots from the survey for each device type. Each device accessed the web instrument over a cellular network. For the smartphone, this was the telephone’s network. For the tablet and laptop conditions, access was via a wireless hot spot generated by an MiFi device. (An MiFi device is a small, wireless router that generates a WiFi hot spot.) Because the method of getting online was similar for the three devices, download times should have been similar. As a result, completion times are not confounded with differences across devices in connection speeds.
Outcome Measures
We examined five outcome variables. The first was item nonresponse. We counted the number of missing values across the entire questionnaire (a total of 69 items), excluding only the first section. There were no skip patterns involving these items and each respondent should have answered all 69 of them.
The second outcome variable we examined was straightlining (Krosnick, 1991, 1999). The questionnaire included six multi-item batteries. We classified a respondent as a “straightliner” if he or she selected the same response category for every item in any of the six batteries. Straightlining was relatively rare, ranging from less than 1% to 30% across the six batteries. (The items in three of the batteries were displayed one at a time on successive screens, which may have discouraged straightlining.) The analyses presented below grouped respondents by whether they exhibited straightlining on at least one of the six batteries. No one straightlined on all six.
The third outcome variable was the time needed to complete the questions. The program capture the time elapsed from the second section of the questionnaire to the end. (We excluded the first section because interviewers administered that section for about half of the respondents in each device type condition; thus, at the end of the section, the interviewer turned the device over to the respondents who switched to self-administration for the rest of the questions.)
The fourth outcome was the reliability of answers to four batteries of questions, each thought to reflect a single underlying dimension. The four batteries measured subjective well-being, healthy behaviors, perceived social support, and depression. We used coefficient α to measure reliability and compared the three device groups on the α values for each battery. We also conducted item response theory (IRT; Embretson & Reise, 2000) analyses to examine scale information functions and DIF by device type.
The final outcome variable was a measure of scale validity. Specifically, we examined the correlations between the scales and four demographic variables to which they were likely to be related. We compared how these relationships differed across the three devices, on the assumption that weaker relationships indicate higher levels of random measurement error.
Results
The sample counties do not constitute a probability sample, and we did not weight the results. Most of the analyses do take into account the clustering of the data by county, using the SAS survey procedures for this purpose. 2 The clustering of the sample affects the variability of the results, and the SAS procedures use standard methods to adjust for this (see, e.g., Rao & Scott, 1987). Table 1 shows the key results for the five outcomes we examined.
Data Quality Measures (and Sample Sizes) by Device Type.
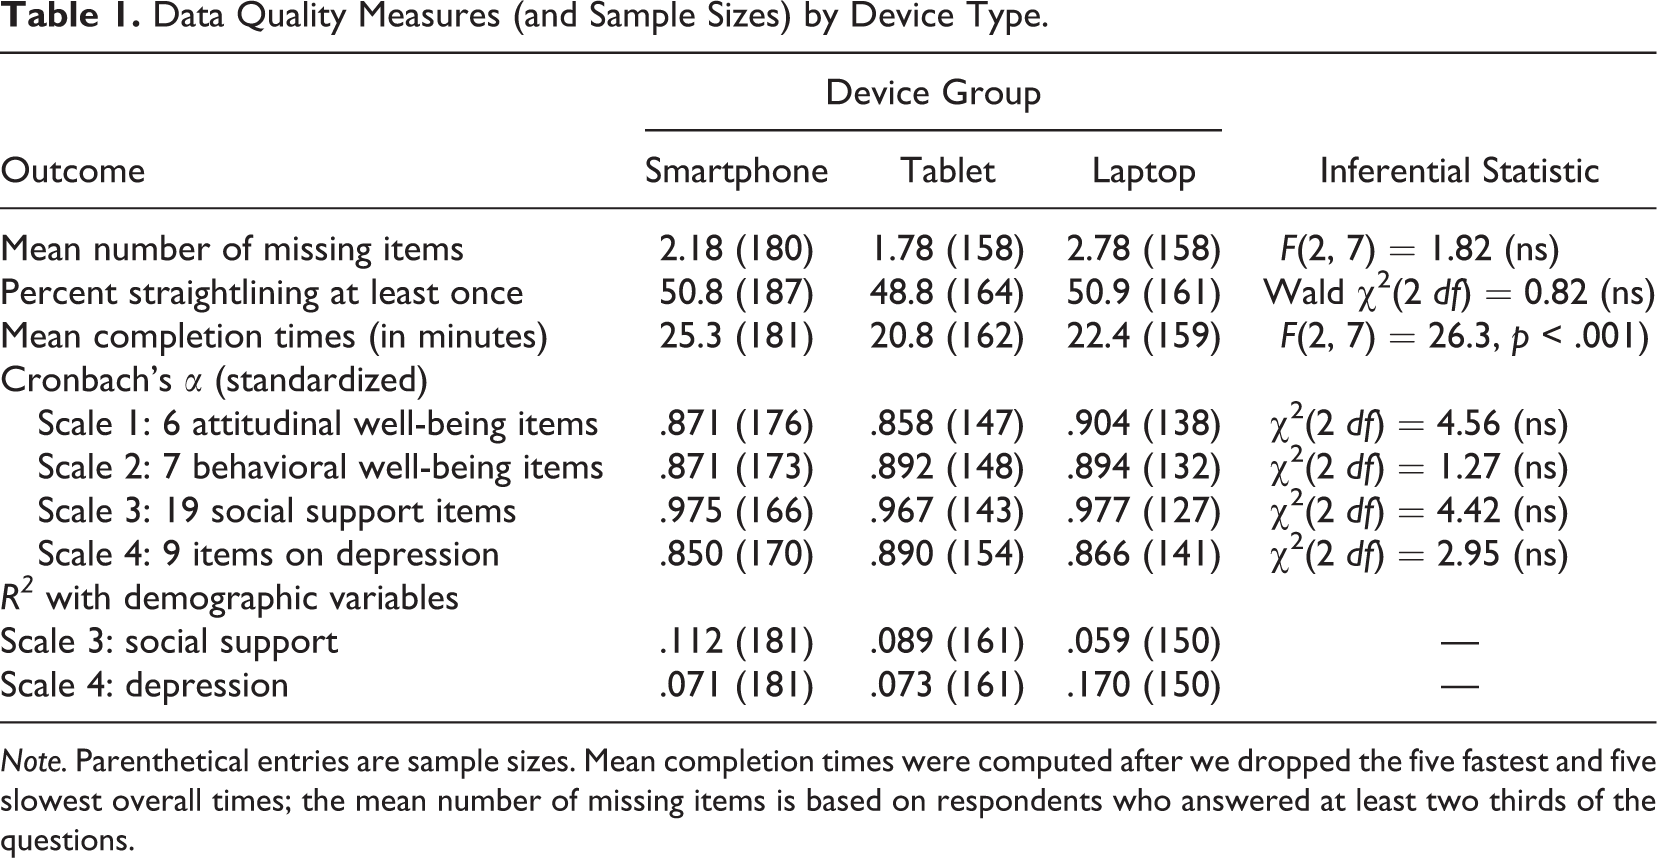
Note. Parenthetical entries are sample sizes. Mean completion times were computed after we dropped the five fastest and five slowest overall times; the mean number of missing items is based on respondents who answered at least two thirds of the questions.
Item Nonresponse
A few of the sample cases skipped many of the questions. We dropped the 16 “respondents” who skipped a third or more of the questions from our analysis of item nonresponse; they were spread across all three device types. In an analysis of covariance that included the number of missing answers as the dependent variable and device type as the independent variable, with race, sex, age, and education as covariates, we found no significant differences across the three device types (see Table 1).
Straightlining
Overall, about half of the respondents straightlined at least once (50.2%), picking the same answer option for every item in one or more of the six batteries of similar items. This figure rises to about 70% if we include respondents who gave the same answer to every item or to every item but one in at least one of the six batteries in the questionnaire. We carried out logistic regression analyses on both of these outcome variables, using a model that included device type, as well as race, sex, age, and education as covariates. We found no significant differences in straightlining across the three device types.
Completion Times
Like many prior studies (e.g., Andreadis, 2015; Buskirk & Andrus, 2014; de Bruijne & Wijnant, 2013; Keusch & Yan, 2016; Struminskaya et al., 2015), ours found that respondents took longer to complete the survey on a smartphone (25.3 min on average for the sections of the questionnaire that were self-administered for all respondents; the median was 23.2 min) than on a tablet (20.8 min on average; median of 18.8 min) or a laptop (22.4 min on average; median of 19.4 min). The means exclude the five fastest and the five slowest overall completion times—that is, the top and bottom 1% of the times (cf. Ratcliff, 1993). The pattern is the same if we include these extreme observations. The difference across the three device groups in average completion time was highly significant—F(2, 7) = 26.3, p < .001 (see the fourth row of Table 1). A contrast comparing the smartphone group with the other two groups was also highly significant, F(1, 7) = 51.3, p < .001.
Scale Reliability
We assessed scale reliability in two ways. We first calculated values of Cronbach’s α for four sets of items intended to form unidimensional scales. As can be seen from the middle four rows of Table 1, the αs are uniformly quite high—.858 is the lowest—but they do not differ systematically by device type. The χ2 values given in the bottom panel of the last columns are from a test originally devised by Feldt, Woodruff, and Salih (1987) and implemented in an R package (Diedenhofen & Musch, 2016). None of them indicates significant differences in scale reliabilities by device type.
We then performed IRT analysis on all four scales and compared scale information functions by device type. Scale information functions indicate the range of the underlying construct where the scale is most useful for discriminating among people—that is, it is a measure of how precise the scale measures people at different levels of the underlying construct the scale is supposed to measure. A higher scale information function indicates more precision and higher reliability. We plotted the scale information function for all fours scales. We display the curves for Scale 3 in Figure 2; the remaining curves are presented in Appendix B.
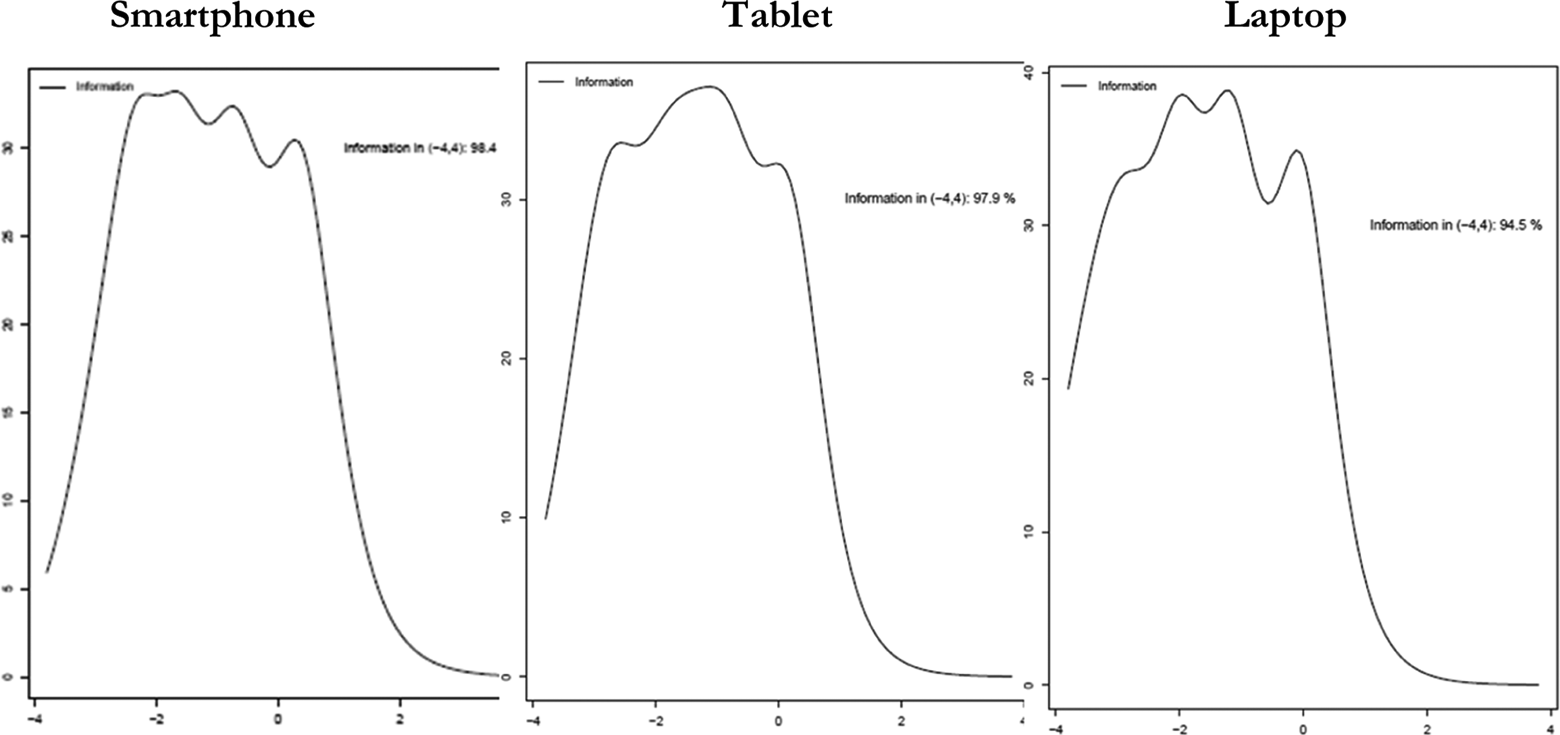
Scale information curves by device type for Scale 3.
As shown in Figure 2, the scale information curves for Scale 3 are largely the same across devices. This is also the case for Scales 1 and 2 (see Appendix B). With Scale 4, for the smartphone and tablet groups, the scale measures people with higher levels of depression with more precision, whereas on the laptop, the scale measures less depressed people with greater precision.
We further tested for DIF across the three device types. DIF occurs when different groups respond to an item in different ways. We identified 7 items (of 39) that exhibited significant DIF across the three device types. As shown in Table 2, four of the items are from Scale 1. This scale consists of six subjective well-being items (e.g., “I feel that life is very rewarding”). It appeared that the laptop respondents were the most reliable on Scale 1, with the laptop showing the highest reliabilities for all 4 items with significant DIF. The other 3 items from two other scales that exhibited significant DIF show no consistent pattern; each device type appeared to provide the most reliable answers for one of the items. None of the items from Scale 4 exhibited DIF.
Items Showing Significant Differential Item Functioning by Device Type.

Scale Validity
We calculated the multiple correlations of each the four scales with four demographic predictors—age, race, education, and sex. Two of the scales (Scale 3 measuring social support and Scale 4 measuring depression) show relatively strong relationships to the demographic variables—R 2 of .057 and .067, respectively. The smartphone respondents showed the strongest overall relationship between the demographic variables and social support (R 2 = .112), but the laptop group showed the strongest relationship between those variables and depression (R 2 = .170).
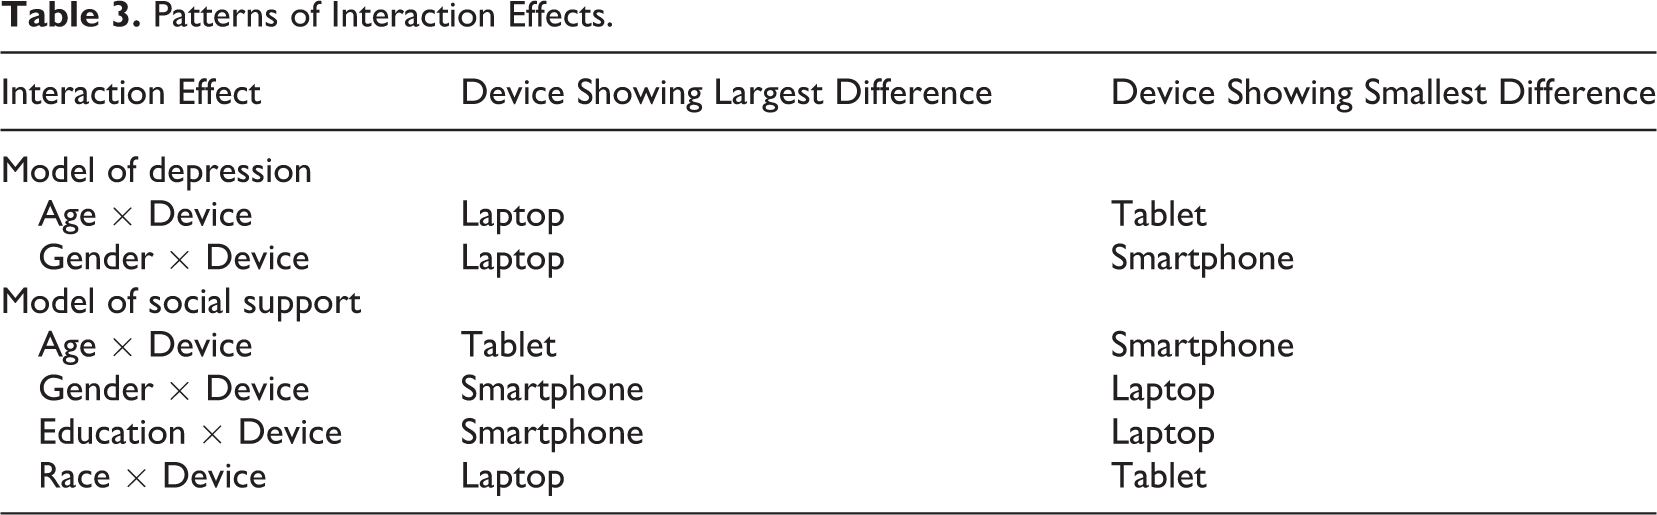
In addition, several of the device type by demographic variable interactions were significant when we added the relevant interaction terms to the models. To show the nature of these interactions, Table 3 displays how the device type moderates the relationship between the demographic variable and the dependent variable. As is apparent in the table, the interactions do not follow any clear pattern. For example, the relationship of age both to depression and social support varied significantly by device, F(6, 7) = 4.94 and 7.76, both p < .05; however, the smartphone group showed the sharpest decline in depression by age-group, whereas the tablet group showed the sharpest decline in social support across the four age-groups. These results were like those from the DIF analysis, with some apparent differences across device type but no consistent overall direction to those differences.
Patterns of Interaction Effects.
Discussion
Although our survey was not optimized for smartphones, the data from the smartphone group seem, by most standards, to be just as good as those obtained on tablet or laptop computers. Our earlier study (Tourangeau et al., in press) reached similar conclusions. Contrary to our hypotheses in that study, the small screens on the smartphone did not significantly alter the impact of response order, scale direction, scale length, or presentation of items in a grid. In those experiments, smartphone users had to scroll to view critical information, but tablet and laptop respondents could see all the relevant information from the outset. For the most part, our findings are good news for survey researchers—data quality does not suffer noticeably when the data are collected via smartphone.
We did a field experiment and had greater control over the devices on which the respondents completed the survey (because we provided the device they used) than in most past studies. In addition, our respondents were not members of an online panel. Because many respondents were using devices they were not familiar with, we might have expected to find larger differences by device type than past studies have. However, we found few differences across the three types of devices in our measures of data quality—which included item nonresponse, straightlining, coefficient αs, and relationships between scale responses and demographic variables.
Past research has mostly shown somewhat higher item nonresponse, longer completion times, and shorter responses to open-ended questions when the data are collected on smartphones rather than laptops or tablets. We replicated the earlier findings on completion times. Our smartphone respondents took about 13% longer than laptop respondents and more than 20% longer than tablet respondents to complete the same sections of the questionnaire. Because the respondents in all three groups accessed the Internet by similar means, this difference probably does not reflect differences in download times. Our respondents were not panel members and they were not necessarily familiar with the device to which they were assigned. About 62% of the smartphone respondents reported that they owned smartphones. Across all three device groups, smartphone owners were faster in completing the self-administered sections of the questionnaire than respondents who did not own smartphones, but smartphone ownership did not interact with device type.
We also examined scale reliability and scale validity. Again, we failed to find consistent differences in Cronbach’s αs and construct validity coefficients by device type. IRT analyses detected several items that display DIF across the device types; for the first of the four scales we examined, the laptop respondents seemed to give the most reliable answers for 4 of the 7 items in the scale. Relationships between two of the scales and four demographic variables also sometimes differed across the devices, but sometimes the relationships were strongest for the smartphone respondents and sometimes they were strongest for the laptop respondents.
Several things may have contributed to the near absence of clear or consistent device effects. It is possible that the particular smartphone we used (the iPhone 5S, with its relatively high screen resolution) played a role. Had we used a smartphone with lower screen resolution, our findings might have been different. Or it could be that most respondents are now comfortable dealing with smaller screens and touch screen entry, so there really is little effect on data quality of doing the survey on a smartphone. Finally, in our study, interviewers handed respondents the devices and were present as the respondents completed the questions. Thus, any concerns about lack of privacy or high levels of distraction for smartphone respondents did not apply in our experiment; the settings were similar for all three devices.
Overall, we find that smartphones produce data that were quite similar in overall quality to those produced on tablets or laptops, and the latter two device types did not differ from each other much either. All in all, we think this augurs well for data collection via the web.
Supplemental Material
Supplemental Material, Supplement_material - Web Surveys by Smartphones and Tablets: Effects on Data Quality
Supplemental Material, Supplement_material for Web Surveys by Smartphones and Tablets: Effects on Data Quality by Roger Tourangeau, Hanyu Sun, Ting Yan, Aaron Maitland, Gonzalo Rivero, and Douglas Williams in Social Science Computer Review
Footnotes
Appendix A
Appendix B
Authors’ Note
Any opinions, findings, and conclusions or recommendations expressed in this article are those of the authors and do not necessarily reflect the views of the National Science Foundation or the Bureau of Justice Statistics. We thank the Methodology, Measurement, and Statistics Program at the National Science Foundation, the Bureau of Justice Statistics, and Dr. Cheryl Eavey for their support. We are grateful to Rose McAloon for her research assistance; Tamara Bruce and Naoko Okuma for their oversight of the field work; and Abie Reifer, Bryan Davis, and Andrew Heller for their management of the technical and programming aspects of the study.
Declaration of Conflicting Interests
The authors declared no potential conflicts of interest with respect to the research, authorship, and/or publication of this article.
Funding
The authors disclosed receipt of the following financial support for the research, authorship, and/or publication of this article: The work reported here was supported by a grant from the National Science Foundation (SES-1261340 to RT), with additional support from the Bureau of Justice Statistics.
Supplemental Material
The supplemental material is available in the online version of the article.
Notes
References
Supplementary Material
Please find the following supplemental material available below.
For Open Access articles published under a Creative Commons License, all supplemental material carries the same license as the article it is associated with.
For non-Open Access articles published, all supplemental material carries a non-exclusive license, and permission requests for re-use of supplemental material or any part of supplemental material shall be sent directly to the copyright owner as specified in the copyright notice associated with the article.