
Abstract
While grids or matrix questions are a widely used format in PC web surveys, there is no agreement on the format in mobile web surveys. We conducted a two-wave experiment in an opt in panel in Russia, varying the question format (grid format and item-by-item format) and device respondents used for survey completion (smartphone and PC). The 1,678 respondents completed the survey in the assigned conditions in the first wave and 1,079 in the second wave. Overall, we found somewhat higher measurement error in the grid format in both mobile and PC web conditions. We found almost no significant effect of the question format on test–retest correlations between the latent scores in two waves and no differences in breakoff rates between the question formats. The multigroup comparison showed some measurement equivalence between the question formats. However, the difference varied depending on the length of a scale with a longer scale producing some differences in the measurement equivalence between the conditions. The levels of straightlining were higher in the grid than in the item-by-item format. In addition, concurrent validity was lower in the grid format in both PC and mobile web conditions. Finally, subjective indicators of respondent burden showed that the grid format increased reported technical difficulties and decreased subjective evaluation of the survey.
Keywords
While grids or matrix questions are a widely used format in PC web surveys (completed on desktop or laptop computers), there is little agreement on the optimal format for mobile web surveys (completed on smartphones). Several practitioners argue against the use of grids on smartphones, and a number of different alternatives have been proposed including item-by-item approaches. However, there is still relatively little empirical research on the performance of grid questions or their alternatives on smartphones, and the findings are generally inconsistent. Given this, we compare data equivalence between two formats (grid and item-by-item questions) and between devices (smartphones and PCs), using a two-wave crossover design. We measure the effect of the question format and device on data quality and whether the effect of the question format varied among PC web and mobile web or smartphone respondents (we use the terms “smartphone” and “mobile web” interchangeably to refer to surveys administered via a browser on a smartphone).
Background and Literature Review
Grid, table, or matrix questions (in which a set of items sharing the same response options are presented together) have been the subject of much attention since the early days of web surveys. Despite researchers and practitioners arguing for avoiding grids altogether or minimizing their use, both in the early days of web surveys (e.g., Gräf, 2002; Poynter, 2001; Wojtowicz, 2001), and more recently (e.g., Callegaro, Lozar Manfreda, & Vehovar, 2015, p. 200; de Leeuw, 2017; Dillman, Smyth, & Christian, 2014, pp. 214–218; Kuper & Glowa, 2014), grids remain a popular web survey design tool (see Revilla, 2017). More recently, the increased use of mobile devices (especially smartphones) to complete web surveys has again raised questions about the use of grid questions (see Couper, Antoun, & Mavletova, 2017). Several new alternatives to grids have been proposed, including concertina or accordion formats (Barlas, Thomas, & Buttermore, 2017; Phillips & Luks, 2016), dynamic grids (Hanson, 2017), menu matrixes (Liu, 2017), and horizontal scrolling matrixes (de Leeuw, Hox, Klausch, Roberts, & de Jongh, 2012; Klausch, de Leeuw, Hox, Roberts, & de Jongh, 2012), again suggesting that grid questions may not be suitable for smartphones. Several studies have also found higher breakoff rates among smartphone users compared to PC users, and grids are a design feature implicated in this effect (see the meta-analysis by Mavletova & Couper, 2015).
Mobile optimization is one of the design features that complicates comparisons of different question formats on smartphones. Mobile optimization (or “mobile friendly” or “mobile first” designs) is implemented in different ways in different software products, ranging from using a liquid design that adjusts to the size of the browser window and replacing standard HTML radio buttons with larger buttons that are easier to select using touch, to systems that automatically convert grids items into some alternative (item-by-item scrolling or accordion formats being two examples). Further, many surveys do not (yet) optimize for mobile devices. In a study cited by York (2017), 29% of surveys submitted to the Research Now survey platform in 2016 were considered “mobile incompatible,” while a further 23% were deemed “mobile possible,” leaving 33% classified as mobile friendly and only 15% as “mobile optimized.” The issue of whether and how to optimize grid or matrix questions for smartphones remains an open one, needing further research.
While arguments both for and against grids have been made, the research evidence on the effect of grids remains mixed. Part of this is related to the many different alternatives to grids, including item-by-item scrolling (with separate items on the same web page) and item-by-item paging (with each item on a separate page), along with the newer alternatives mentioned above. Another reason is that grid questions themselves vary greatly, both in their design and implementation and in their size, including the number of items (rows), the length of the items, the number of response options (columns), whether they are labeled or not, and (if so) the length of the labels. Further, much of the research has focused more on issues of process quality (i.e., breakoffs, completion time, missing data, and straightlining) and less on outcome quality (i.e., the measurement properties of the items).
We briefly summarize some of the findings from the early research on grids before describing our study in greater detail. Extensive reviews of the literature on grids, especially on smartphones, are found elsewhere (e.g., Couper et al., 2017; Revilla & Couper, 2017). As noted above, the early research on grids on PCs yielded mixed results (see Couper et al., 2013). For example, some studies found somewhat higher Cronbach’s α coefficients in the grid format (Couper, Traugott, & Lamias, 2001; Tourangeau, Couper, & Conrad, 2004), while others found no significant differences in inter-item correlations between the formats (Callegaro, Shand-Lubbers, & Dennis, 2009; Toepoel, Das, & Van Soest, 2009; Yan, 2005). Similarly, some studies found higher levels of straightlining and item nonresponse in grids (Callegaro et al., 2009; Toepoel et al., 2009; Tourangeau et al., 2004), but Couper, Traugott, and Lamias (2001) found lower rates of nonsubstantive responses such as “don’t know” or “would rather not answer” in the grid format than a single item per page format.
Several studies have explored grids versus alternative question formats on smartphones. Some of the early studies randomized participants to format (e.g., grid vs. item-by-item) but not to device. This limits the inference if self-selected smartphone users are different from PC users (e.g., they have more experience with the device and greater tolerance of suboptimal survey design). For example, Lattery, Park Bartolone, and Saunders (2013) found no difference in breakoff rates or response distributions between a long 9-item grid format and a shorter 3-item grid format among smartphone users. McClain and Crawford (2013) found shorter median completion times, fewer breakoffs, and lower levels of straightlining in an item-by-item format relative to a grid, but no differences in item nonresponse rates. Peterson, Griffin, LaFrance, and Li (2017) found no significant differences in response distributions or straightlining between a traditional grid and an item-by-item version among self-selected smartphone users, but they did find higher breakoff rates for the grid version.
Liu & Cernat (2016) varied question format (grid vs. item-by-item scrolling) and number of response options (2–11 options) in a 2 × 7 factorial design, with about a third of the sample choosing to complete the survey on mobile devices (smartphones or tablets). They found higher missing data rates for the grid format, reaching significance (p < .05) for three of the seven question sets. But they found no differences in completion times or straightlining between the two formats on mobile devices. Using confirmatory factor analysis (CFA), they found measurement equivalence between the two formats in questions with seven responses or fewer. Questions with nine or more response options showed significant differences in measurement equivalence between formats, with lower reliability for the grid format.
Few experiments have varied both device (PC vs. smartphone) and format (grid vs. item-by-item). Thomas, Barlas, Graham, and Subias (2015) compared grids to several alternatives for three sets of questions, with respondents randomly assigned to device and question format. The item-by-item scrolling version (with horizontal scales) took slightly longer on smartphones than the grid version, but they found no differences in average item means. They concluded that “traditional grids (with 3–4 response categories) performed well across devices.”
Revilla, Toninelli, and Ochoa (2017) randomly assigned respondent to a PC, a nonoptimized smartphone version (both of which used grids) or an optimized smartphone version (with the questions in item-by-item scrolling format) in a two-wave crossover design. They examined two grids, each with 14 items, but one with 5 response options and the other with 11. They found similar inter-item correlations between the two smartphone versions (optimized and nonoptimized). However, they found evidence of higher variances in the optimized (item-by-item) version than the nonoptimized (grid) version, suggesting lower nondifferentiation with the item-by-item version.
In a follow-up study, Revilla and Couper (2017) varied the assigned device (PC vs. smartphone) and format (grid, item-by-item horizontal, and item-by-item vertical) in a single-wave experiment. They found higher rates of missing and nonsubstantive answers, and more nondifferentiation in the grid format, but no differences in completion time. They found few differences in the horizontal versus vertical versions of the item-by-item format. They concluded “…we find no compelling evidence that grids are necessarily bad on smartphones, nor do we find that the alternatives to grids that we tested are consistently superior to grids” (Revilla & Couper, 2017, p. 17).
In summary, the results of studies on alternative formats of grid questions on different devices are mixed (see Couper, Antoun, & Mavletova, 2017, for a review). In part, we attribute this to the wide variety of different design decisions that can be made, one of which relates to the size of the grids (number of items and number of response options). Against this backdrop, we conducted an experiment to explore differences in process and outcome quality between grid and item-by-item scrolling formats on both smartphones and PCs. Respondents were randomized to both format and device using a two-wave crossover design. Further, we examine a range of questions sets, with the number of items ranging from 4 to 11 and the number of response options ranging from 4 to 7. We do this on a survey that is partially optimized for mobile devices.
Our main research hypothesis is that the item-by-item format is associated with higher data quality and stronger measurement equivalence than the grid format across devices (both smartphones and PCs); however, we expect this effect to be stronger among smartphone respondents. We further expect that larger grids (more items and more response options) perform more poorly on smartphones relative to the item-by-item approach. We examine several different outcomes, including indicators of process quality (breakoffs, completion times, and straightlining) that are used in many other studies. However, we focus our attention on measurement equivalence, using methods similar to those used by Liu & Cernat (2016). This addresses the important question of whether the different formats would yield equivalent substantive conclusions across devices. Finally, we also look at subjective indicators of the surveys experience (again, as others have done).
Experimental Design
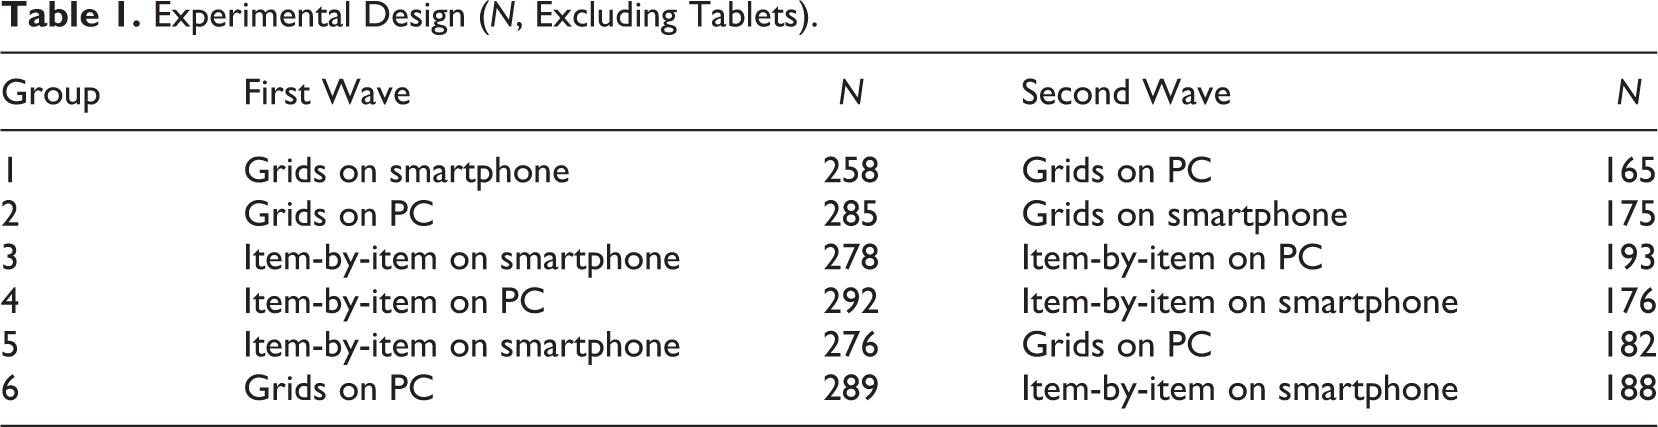
We conducted a two-wave experiment, in which we varied the question format (grid vs. item-by-item) and device used for survey completion. The item-by-item format with a scrolling design presented the items on the same screen. In the first wave, respondents were randomly assigned to one of the following four conditions: grids on a smartphone, grids on a PC, item-by-item on a smartphone, or item-by-item on a PC. In the second wave, respondents were assigned to a different device to complete the survey (see Table 1). In four conditions, respondents were assigned to the same question format (groups 1, 2, 3, and 4), while in two other conditions, respondents were assigned to the item-by-item format on a smartphone and to the grid format on a PC. We did not include a group with item-by-item questions on a PC and grids on a smartphone, as this is typically not considered in practice.
Experimental Design (N, Excluding Tablets).
The item-by-item format was fully optimized for smartphones, but the grid format was not fully optimized for smartphones. While a liquid or fluid design was employed to display the entire grid on the screen, pinching and zooming was required to answer the questions in the grid format on smartphones. Font sizes were not optimized for smartphones in the grid format. The item-by-item format was fully optimized for smartphones: larger buttons and larger font sizes were used, and no horizontal scrolling was required. The screenshots for all conditions are in Online Appendix A. While some have tested horizontal item-by-item formats and others have tested vertical formats (see, e.g., Revilla & Couper, 2017), the format we used is a hybrid approach.
This two-wave crossover design (see Antoun, Couper, & Conrad, 2017; Mavletova & Couper, 2013; Revilla, Toninelli, & Ochoa, 2017) allows us to explore the effect of devices and formats within respondents, allowing us to measure between-wave reliability within and across formats and devices. This design maximizes the internal validity of the results, at some loss to external validity.
Data Collection
The experiment was conducted in Russia using a volunteer online access panel run by Online Market Intelligence (http://www.omirussia.ru/en). All respondents reported using the Internet on their mobile phones in the last 30 days. The first wave was conducted from December 7 to 17, 2016. The second wave was conducted from January 9 to February 3, 2017. All respondents were invited by e-mail. Panelists received the standard panel incentive for participating.
In the PC web condition, we encouraged respondents to use a PC, while in the smartphone condition, we encouraged them to use a smartphone to complete the survey. By capturing user agent string information, we identified the browser and device used by respondents (PC or smartphone). If respondents used another device, they were asked to switch to the requested device and were not allowed to continue otherwise. In the first wave, 57.8% of those who started the survey were redirected because they were using the wrong device; this rate was higher in the smartphone than in the PC web survey condition: 63.7% in the smartphone condition and 51.2% in the PC web condition, χ2(1) = 88.32, p < .001. In the second wave, 15.3% were redirected due to incorrect device use: 23.2% in the smartphone condition and 12.5% in the PC condition, χ2(1) = 31.65, p < .001. Some of the respondents completed the survey via tablets or some other device (n = 82 in the first wave and n = 56 in the second wave) and were also excluded from the analysis.
In the first wave, 1,678 respondents completed the survey in the assigned conditions: 866 in the PC web condition and 812 in the mobile web (smartphone) condition (see Table 2). The completion rate was higher in the PC web condition than in the mobile web condition: 7.1% and 2.3%, respectively, χ2(1) = 603.58, p < .001. The overall completion rate was 3.6%.
Number of Completed Surveys.
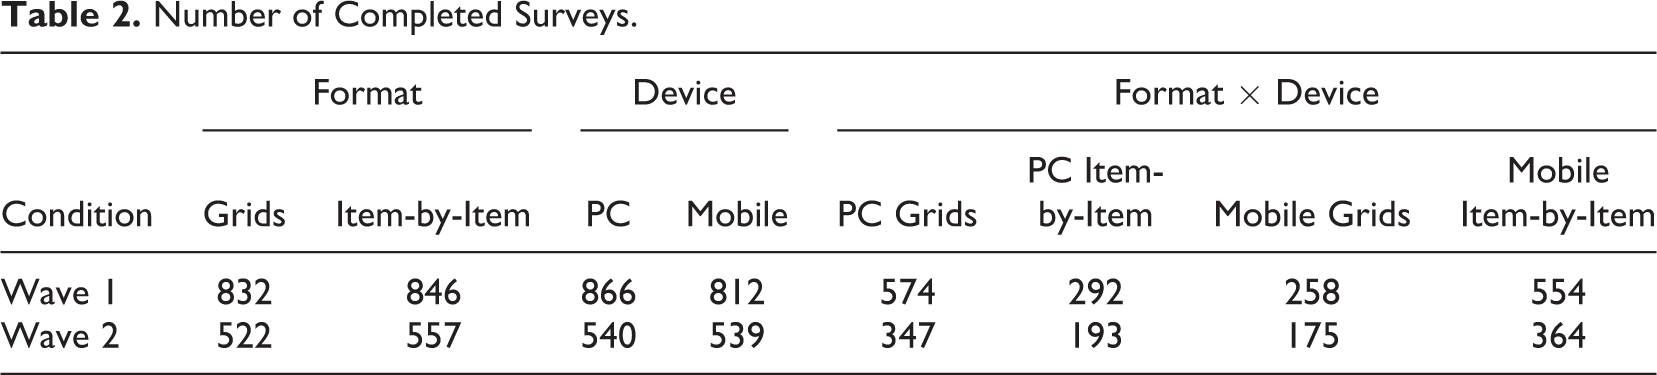
In the second wave, 1,079 respondents completed the survey in the assigned conditions: 540 in the PC web condition and 539 in the mobile web condition (see Table 2). The completion rate was 64.3% with no significant differences between the conditions, χ2(1) = 3.32, p = .07, and between the formats, χ2(1) = 0.51, p = .48. Logistic regression showed that those who completed the survey in the PC web condition in the first wave were expected to complete the second wave in the mobile web condition (odds ratio [OR] = 0.80, p < .05), and females (OR = 0.76, p < .01) had a lower nonresponse rate. No effects of age or question format were found.
Questionnaire
There were a total of 111 items in the questionnaire. The main focus of the survey was trust. The focus of our analysis is on seven sets of questions with 49 items overall (see Table 3 for a short summary and Online Appendix B for question wording). All sets used fully labeled scales, except for Set 4 which used an end point–labeled scale. Most of the questions are from the World Values Survey (see http://www.worldvaluessurvey.org). We conducted 20 cognitive interviews and ran a pretest among 50 respondents on both types of devices before launching the survey. Consistent with other surveys administered to the panel, respondents were required to answer all questions.
Description of Question Sets.

Indicators
Process quality indicators
The first set of indicators we examined relate to process, quality, or respondent behavior completing the survey. We examined three indicators commonly used in the literature:
Breakoff rates: Among those who started each survey, this is the proportion failing to complete the survey. We examine overall breakoff rates and breakoffs on the target question sets.
Completion times: We compare the mean time to complete the question sets. The values were truncated at the 95th percentile (following Yan & Tourangeau, 2008).
Straightlining: We computed the number of question sets in which a respondent selected the same response option as the indicator of straightlining.
Internal consistency: We used Cronbach’s α to measure item–total correlations. Since there were some significant differences in age and gender between the conditions in the first wave, we controlled for age and gender to compare reliability between the conditions.
Measurement quality indicators
The next group of indicators we examined relate to measurement quality. These include the following.
Measurement invariance
Measurement invariance indicates that the same latent constructs are measured among different groups (Cernat, Couper, & Ofstedal, 2016; Horn & McArdle, 1992; Hox, de Leeuw, & Zijlmans, 2015). Multigroup CFA was applied to measure data equivalence across formats and devices, as well as across formats in the two devices (Format × Device). The usual practice is to apply ordered categorical CFA if there are four or fewer response options in a scale and continuous CFA if there are five or more response options (Finney & DiStefano, 2006; Hox et al., 2015) and we followed this convention here. We proceeded with the following steps in assessing measurement equivalence (Meredith, 1993; Steenkamp & Baumgartner, 1998; Vandenberg & Lance, 2000): Configural equivalence—the weakest form of equivalence. Configural equivalence tests whether the same patterns of latent constructs are found across conditions. Metric equivalence constrains the factor loadings to be equal across conditions. If metric equivalence is achieved, the factor loadings are equal across formats and devices. Scalar equivalence constrains factor loadings and intercepts (or thresholds in ordered categorical CFA) to be equal across conditions. If scalar equivalence is achieved, the factor loadings and intercepts are equal across formats and devices. Latent means constrain the means to be equal across conditions. Residuals constrain error variances to be equal across conditions (not applied in ordered categorical CFA). Variances of latent variables are then constrained across conditions. Covariances of latent variables.
If the variances of the latent variables are similar across conditions, we constrained the covariances of the latent variables (if there are at least two factors) to be equal across conditions to measure whether construct validity is similar across conditions. Following Chen’s (2007) recommendation, comparative fit index (CFI) was chosen as the main criterion for measurement equivalence. A change in CFI of 0.01 indicated measurement noninvariance. We used the lavaan package in R (version 0.5-23.1097) (see http://lavaan.org).
Concurrent validity
We measured concurrent validity and compared partial correlation coefficients between the question formats and devices. We included the following three questions in the analysis:
Generalized trust (Question 9)
Generally speaking, would you say that most people can be trusted or that you need to be very careful in dealing with people? (1 = most people can be trusted, 2 = need to be very careful)
Trust (Question 11)
How much would you say one can trust people? (1 = you can trust most people, 7 = you cannot trust most people)
Caution (Question 12)
Some people think that one should be careful in dealing with people, while others think there is no need to be careful in dealing with people. And what do you think? (1 = one should be careful in dealing with people, 7 = there is no need to be careful in dealing with people)
In our study, we compared the partial correlation coefficients between the conditions. We conducted nine models predicting the latent variables while controlling for age and gender based on the following questions: in-group trust (Set 2) based on generalized trust (Question 9); out-group trust (Set 2) based on generalized trust (Question 9); rational trust (Set 4) based on generalized trust (Question 9); in-group trust (Set 2) based on trust (Question 11); out-group trust (Set 2) based on trust (Question 11); rational trust (Set 4) based on trust (Question 11); and out-group caution (Set 3) based on caution (Question 12).
We conducted a multigroup analysis and compared the partial correlations between the formats and devices. We examined the magnitude of the correlation without regard to the direction of the relationship.
Reliability
We predicted the score of the latent constructs in the second wave based on the following variables:
score of the latent construct in the first wave;
device used in the second wave (PC = 1, smartphone = 0);
gender;
age; and
question format in the two waves.
We divided the question format variable into three conditions: grid format in both waves, item-by-item format in both waves, and different question formats between the waves (the latter was selected as the reference group). An example of the structural equation model for Question Set 1 (risk willingness) is shown in Online Appendix C, Figure 1.
We measured the effect of device and question format on the latent score in the second wave. In addition, we measured whether the correlation between the latent score in the first wave and the latent score in the second wave can be mediated by the question format. This would help to examine whether using different formats (grid vs. item-by-item) has an effect on the test–retest reliability correlation between the scores of the latent construct in two waves.
Subjective evaluation
The final set of indicators we examined relate to the respondents’ subjective experience of the survey and serve as indirect indicators of respondent burden. We used the following four variables (asked at the end of each survey) as subjective indicators of respondent burden: self-reported difficulty of completing the survey (4-point scale); self-reported enjoyment of completing the survey (4-point scale); subjective report of technical problems while completing the survey; and subjective survey completion time (how many minutes did it take to complete the survey).
We recoded the self-reported difficulty of completing the survey (1 = very easy to complete, 0 = otherwise) and enjoyment of completing the survey (1 = enjoyed a lot, 0 = otherwise) into binary variables. We conducted logistic and ordinary least squares (OLS) regressions to explore whether there were any differences in the subjective indicators of respondent burden between the question formats and devices.
Sample Composition
Overall, 45% of respondents were male in the first wave and 47% in the second wave. The mean age of the participants was 34.4 years. Significant gender and age differences were found between the two devices in the first wave, but no significant differences were found between formats (see Table 4). No significant gender and age differences were found between device and question format in the second wave. We conclude that the randomization worked as intended, and the two-wave design protects us from selection biases.
Sample Composition.

*p < .05. **p < .01. ***p < .001.
Results
Breakoff Rates
If respondents used the device to which they were assigned, they were randomly assigned either to the grid or to the item-by-item format. We found a higher breakoff rate overall in the smartphone than in the PC web condition in the first wave: 15.2% and 10.0%, respectively, χ2(1) = 16.40, p < .001, and no difference between the survey formats: 12.4% in the grid format and 12.5% in the item-by-item format. No statistically significant breakoff rates were found on any of the seven target questions sets between the question formats or devices.
The breakoff rate in the second wave was 4.0%. There was no difference between devices or question formats: 3.9% on PC and 4.1% on smartphones, χ2(1) = 0.02, p = .88; 4.2% in the grid format and 3.8% in the item-by-item format, χ2(1) = 0.13, p = .72.
Completion Time
For all indicators of data quality, we included in the analysis those who completed the first wave in the assigned condition while analyzing the results of the first wave and those who completed both waves while analyzing the results of the second wave.
The mean completion time was 19.9 min in the first wave and 17.7 min in the second wave. The median completion time was 17.1 min and 15.1 min, respectively. As expected, the mean completion time was shorter in the PC web group than in the mobile web group in both waves and shorter in the grid format than in the item-by-item format (see Table 5, also Figure 1 in Online Appendix D). While analyzing only the target question sets, the same significant differences between question format and device were found.
Survey Completion Times (Minutes).

Note. Standard deviation is given in parentheses.
*p < .05. **p < .01. ***p < .001.
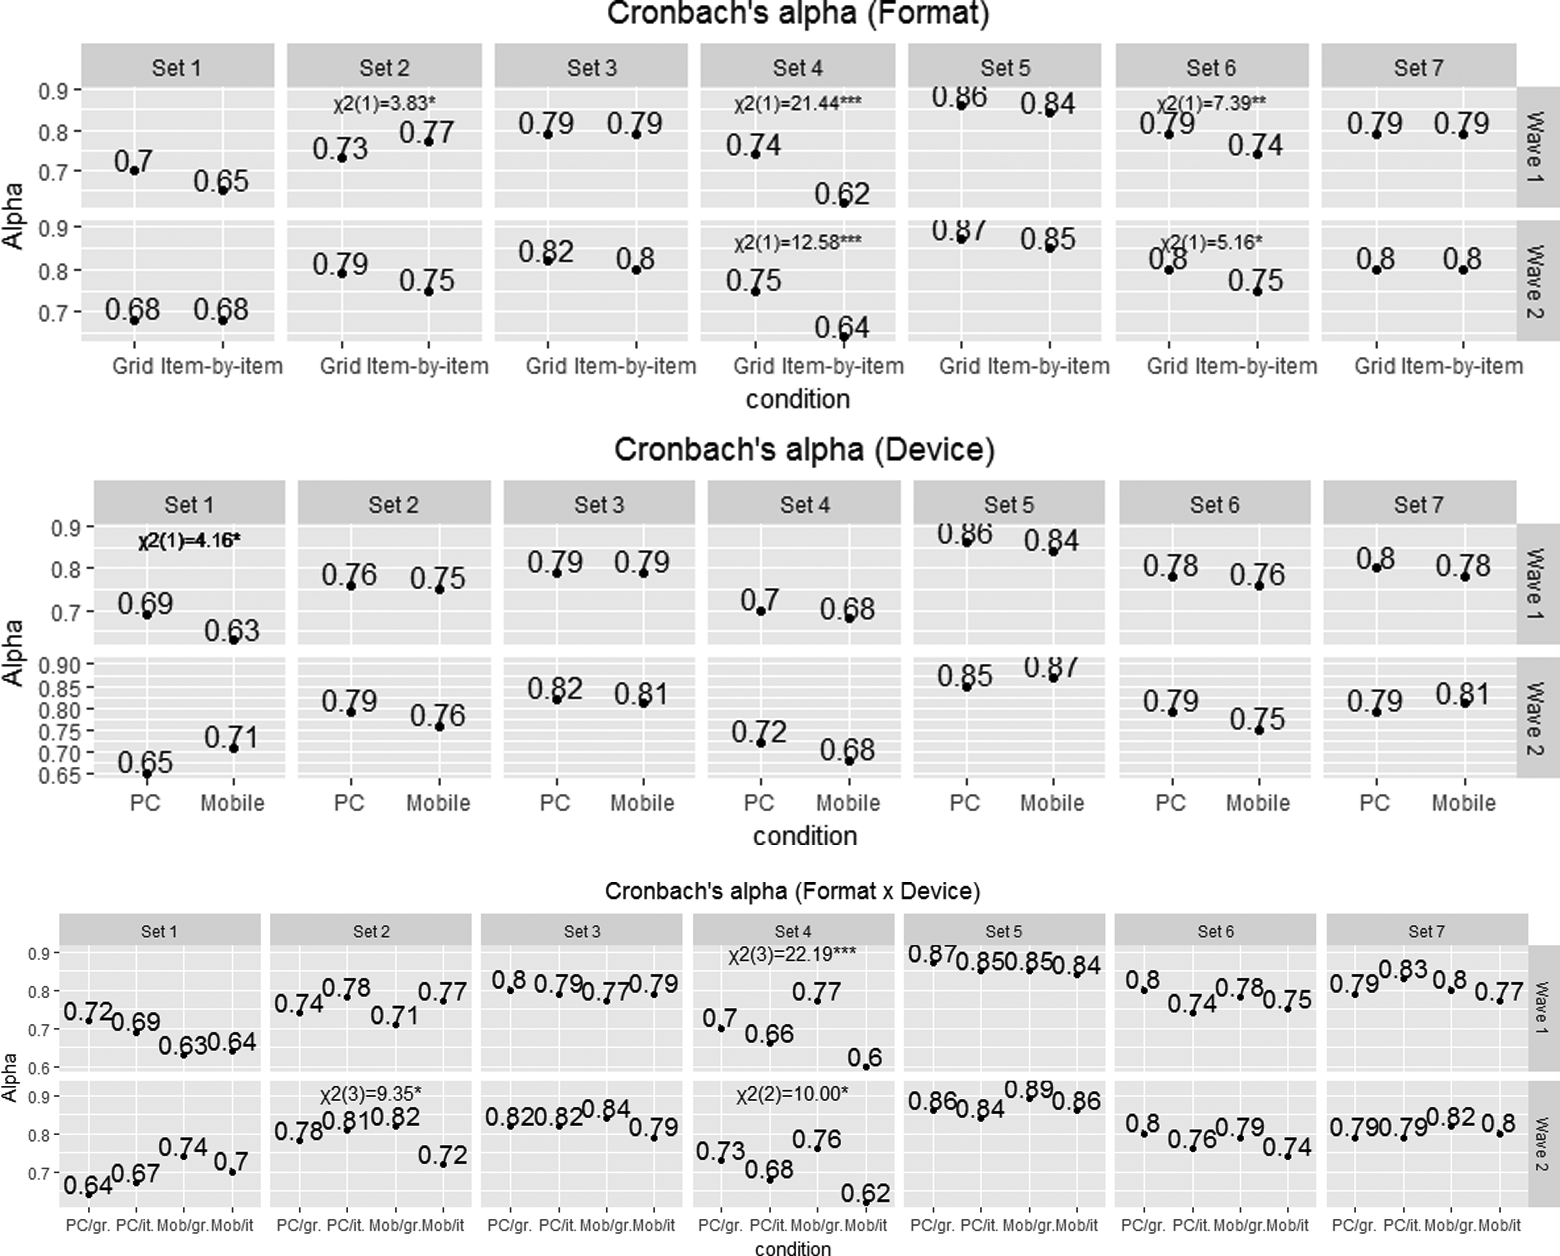
Cronbach’s α by question format and device. *p < .05, **p < .01, ***p < .001. PC/gr. = PC grids; PC/it. = PC items; Mob/gr. = mobile grids; Mob/it. = mobile items.
The longest completion time was found in the mobile item-by-item condition (21.7 min in the first wave and 19.4 min in the second wave) and the shortest completion times in the PC and mobile grid conditions.
The OLS regression that controlled for gender and age differences between the conditions showed the same patterns with significant effects of device and format on overall survey completion time and completion time for the target question sets.
Straightlining
Overall, about 25% of respondents straightlined in at least one of the grids (see Table 1 in Online Appendix D for the percentage straightlining in each question set). We ran a negative binomial model to predict the number of grids in which respondents straightlined, controlling for age and gender. The question format was statistically significant: The grid format increased the odds of straightlining by 1.34 in the first wave and by 1.38 in the second wave (p < .05, see Table 6). Device and the interaction between format and device (the interaction is not shown) had no effect on the level of straightlining. The mixed effects negative binomial model predicting the level of straightlining in both waves showed the same effect of the grid format increasing the level of straightlining (β = 0.30, ORs = 1.35, p < .001), no effect of device and no effect of the interaction between format and device.
Negative Binomial Models of Straightlining.

Note. Standard error is given in parentheses and 95% CI in brackets.
*p < .05. **p < .01. ***p < .001.
Internal Consistency
We measured internal consistency within question sets using Cronbach’s α, while controlling for age and gender. We found significantly higher Cronbach’s α coefficients in two of the seven questions in the grid than in the item-by-item format in both waves. The difference was statistically significant in Question Set 4 on moral and rational trust and Set 6 on tolerance (see Figure 1 and Table 4 in Online Appendix D). The Cronbach’s α coefficients were .74 in the grid format and .62 in the item-by-item format in Question Set 4 in the first wave, χ2(1) = 21.44, p < .001, and .75 in the grid format and .64 in the item-by-item format in the second wave, χ2(1) = 12.58, p < .001. The difference was lower in Question Set 6 on tolerance but also statistically significant: .79 in the grid format and .74 in the item-by-item format in the first wave, χ2(1) = 7.39, p < .01, and .80 in the grid format and .75 in the item-by-item format in the second wave, χ2(1) = 5.16, p < .05. We suggest that higher Cronbach’s α coefficients in the grid format are associated with a higher tendency to straightline, as found earlier (see also Couper et al., 2013).
No statistically significant differences were found between devices except for Set 1 on risk willingness in the first wave (Figure 1 and Table 4 in Online Appendix D). The interaction between question format and device was statistically significant for Question Set 4 (moral and rational trust) in both waves and Set 2 (trust) in the second wave with a lower Cronbach’s α in the mobile item-by-item condition.
Measurement Equivalence
Since there were some differences in gender and age between the conditions in the first wave, we controlled for these variables in the models while running a multigroup CFA to measure data equivalence across formats and devices. While configural equivalence is the weakest form of equivalence, equivalence of variances of latent variables or covariances of latent variables (in the case of at least two latent factors) are the strongest forms of measurement equivalence.
The measurement equivalence at the level of covariances of latent variables or variances of latent variables in the case of a single latent factor was reached between devices in all question sets in both waves (see Table 7; for more details, see Tables 2 and 3 in Online Appendix D). We highlight the cells in gray where the stronger form of measurement equivalence was not reached. In all except one 7-point scale (Set 4), construct validity was reached between the question formats. In this 7-point scale grid, the measurement equivalence was reached at the level of residuals. While exploring the measurement equivalence between the four conditions (the interaction between the question format and device), sufficient construct validity was reached in all except two grids: a 4-point scale on caution (Set 3) and a 7-point scale on moral and rational trust (Set 4).
Summary of Measurement Equivalence (Measurement Equivalence Achieved) by Question Format and Device.

Note. The measurement equivalence from the weakest to the strongest forms of measurement equivalence (see the Indicators section for more details): (1) configural equivalence, (2) metric equivalence, (3) scalar equivalence, (4) latent means, (5) residuals, (6) variances of latent variables, and (7) covariances of latent variables (when there are at least two latent factors). Cells highlighted in grey: The stronger form of measurement equivalence was not reached.
Concurrent Validity
We measured concurrent validity and compared it between the question formats and devices. We predicted some latent variables while controlling for age and gender based on variables which measured similar constructs (using single-item questions).
We found higher partial correlation coefficients in the item-by-item format than in the grid format. Five of the seven correlations were statistically higher in the item-by-item format in the first wave (see Figure 2 and Table 5 in Online Appendix D). The partial correlation between in-group trust (Question Set 2) and generalized trust was .47 in the grid format and .60 in the item-by-item format (z = 3.74, p < .001); between out-group trust (Set 2) and generalized trust .43 and .57, respectively (z = 3.83, p < .001); between rational trust (Set 4) and generalized trust .43 and .52 (z = 2.38, p < .05); between out-group trust (Set 2) and trust .52 and .62 (z = 3.03, p < .01); and between rational trust (Set 4) and trust .50 and .64, respectively (z = 4.26, p < .001). Only one statistically significant difference was found in the second wave.
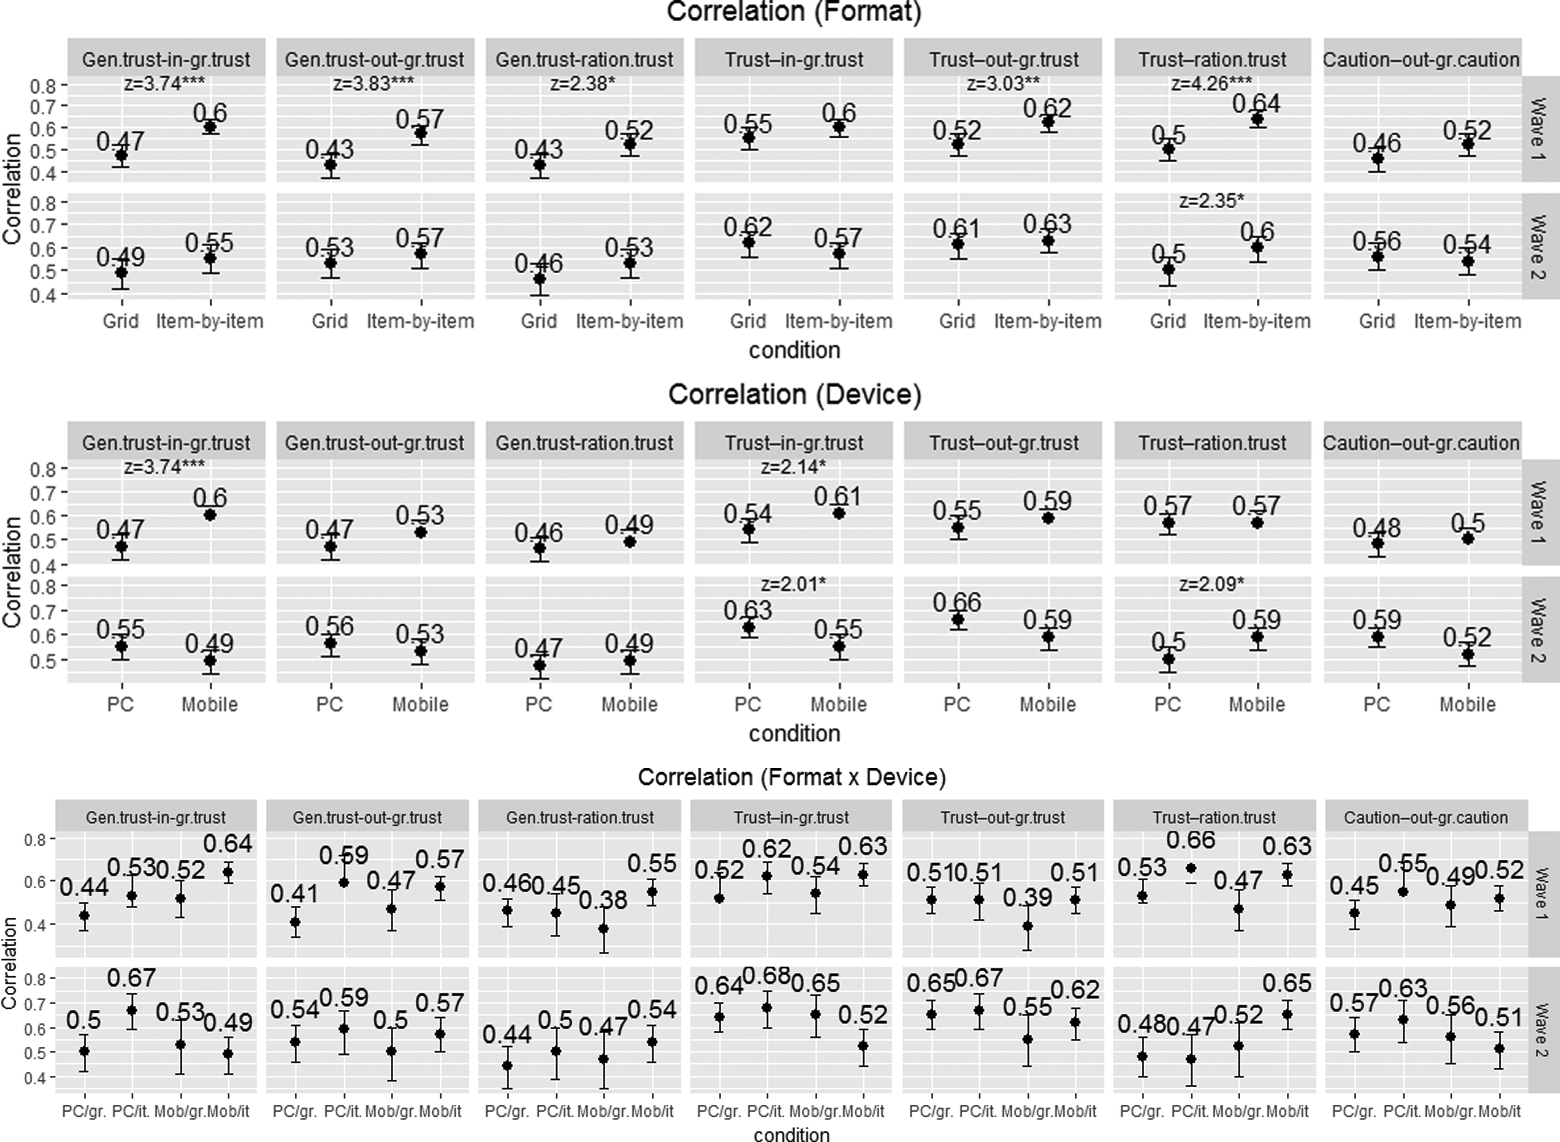
Partial correlation coefficients by question format and device. *p < .05, **p < .01, ***p < .001. PC/gr. = PC grids; PC/it. = PC items; Mob/gr. = mobile grids; Mob/it. = mobile items.
There was no clear pattern in the difference in concurrent validity between devices: Three statistically significant differences were found with a higher partial correlation coefficient in the smartphone condition in both waves and one statistically significant higher partial correlation coefficient in the PC condition (see Figure 2). Comparing all four conditions (PC grid, PC item-by-item, smartphone grid, and smartphone item-by-item), we can conclude that both the smartphone and PC item-by-item conditions produced higher partial correlation coefficients in the first wave; however, there was no clear pattern in the second wave (see Figure 2 and Table 5 in Online Appendix D).
Reliability
To evaluate test–retest reliability, we predicted the score of the latent variable in the second wave based on the score of the latent variable in the first wave, as well as based on the question format (condition with the grid format in both waves, condition with the item-by-item format in both waves, and condition with different question formats between the waves) and device, while controlling for age and gender. We found almost no significant differences between the question formats and no clear pattern of the differences between devices (see Table 6 in Online Appendix D). We also measured whether the correlation between the latent score in the first wave and the latent score in the second wave was mediated by the question format. We found no significant interaction effects. This means that using different formats (grid or item-by-item) had no effect on the test–retest reliability correlations between the scores of the latent construct in the two waves. Overall, we conclude that there is no clear answer which question format or device produced lower measurement error in terms of reliability.
Subjective Evaluation
Overall, 65% of the participants reported that it was very easy to complete the survey in the first wave; however, this proportion was higher for PC than smartphone respondents, 74% versus 55%, χ2(1) = 63.56, p < .001, and in the item-by-item than in the grid format, 69% versus 60%, χ2(1) = 12.75, p < .001. Similar patterns were found in the second wave. Logistic regression showed that the grid format was associated with significantly lower odds of reported ease in both the first wave (OR = 0.22, p < .001, see Table 8) and second wave (OR = 0.24, p < .001), while using a PC rather than a smartphone increased the odds of a very easy rating by 1.40 (p < .05) in the first wave and 1.67 (p < .01) in the second wave. A significant interaction between device and question format shows that using grids on smartphones has a negative effect on self-reported ease of completion, but no such effect was found among PC web respondents.
Logistic Regression: Predicting Subjective Indicators of Respondent Burden.
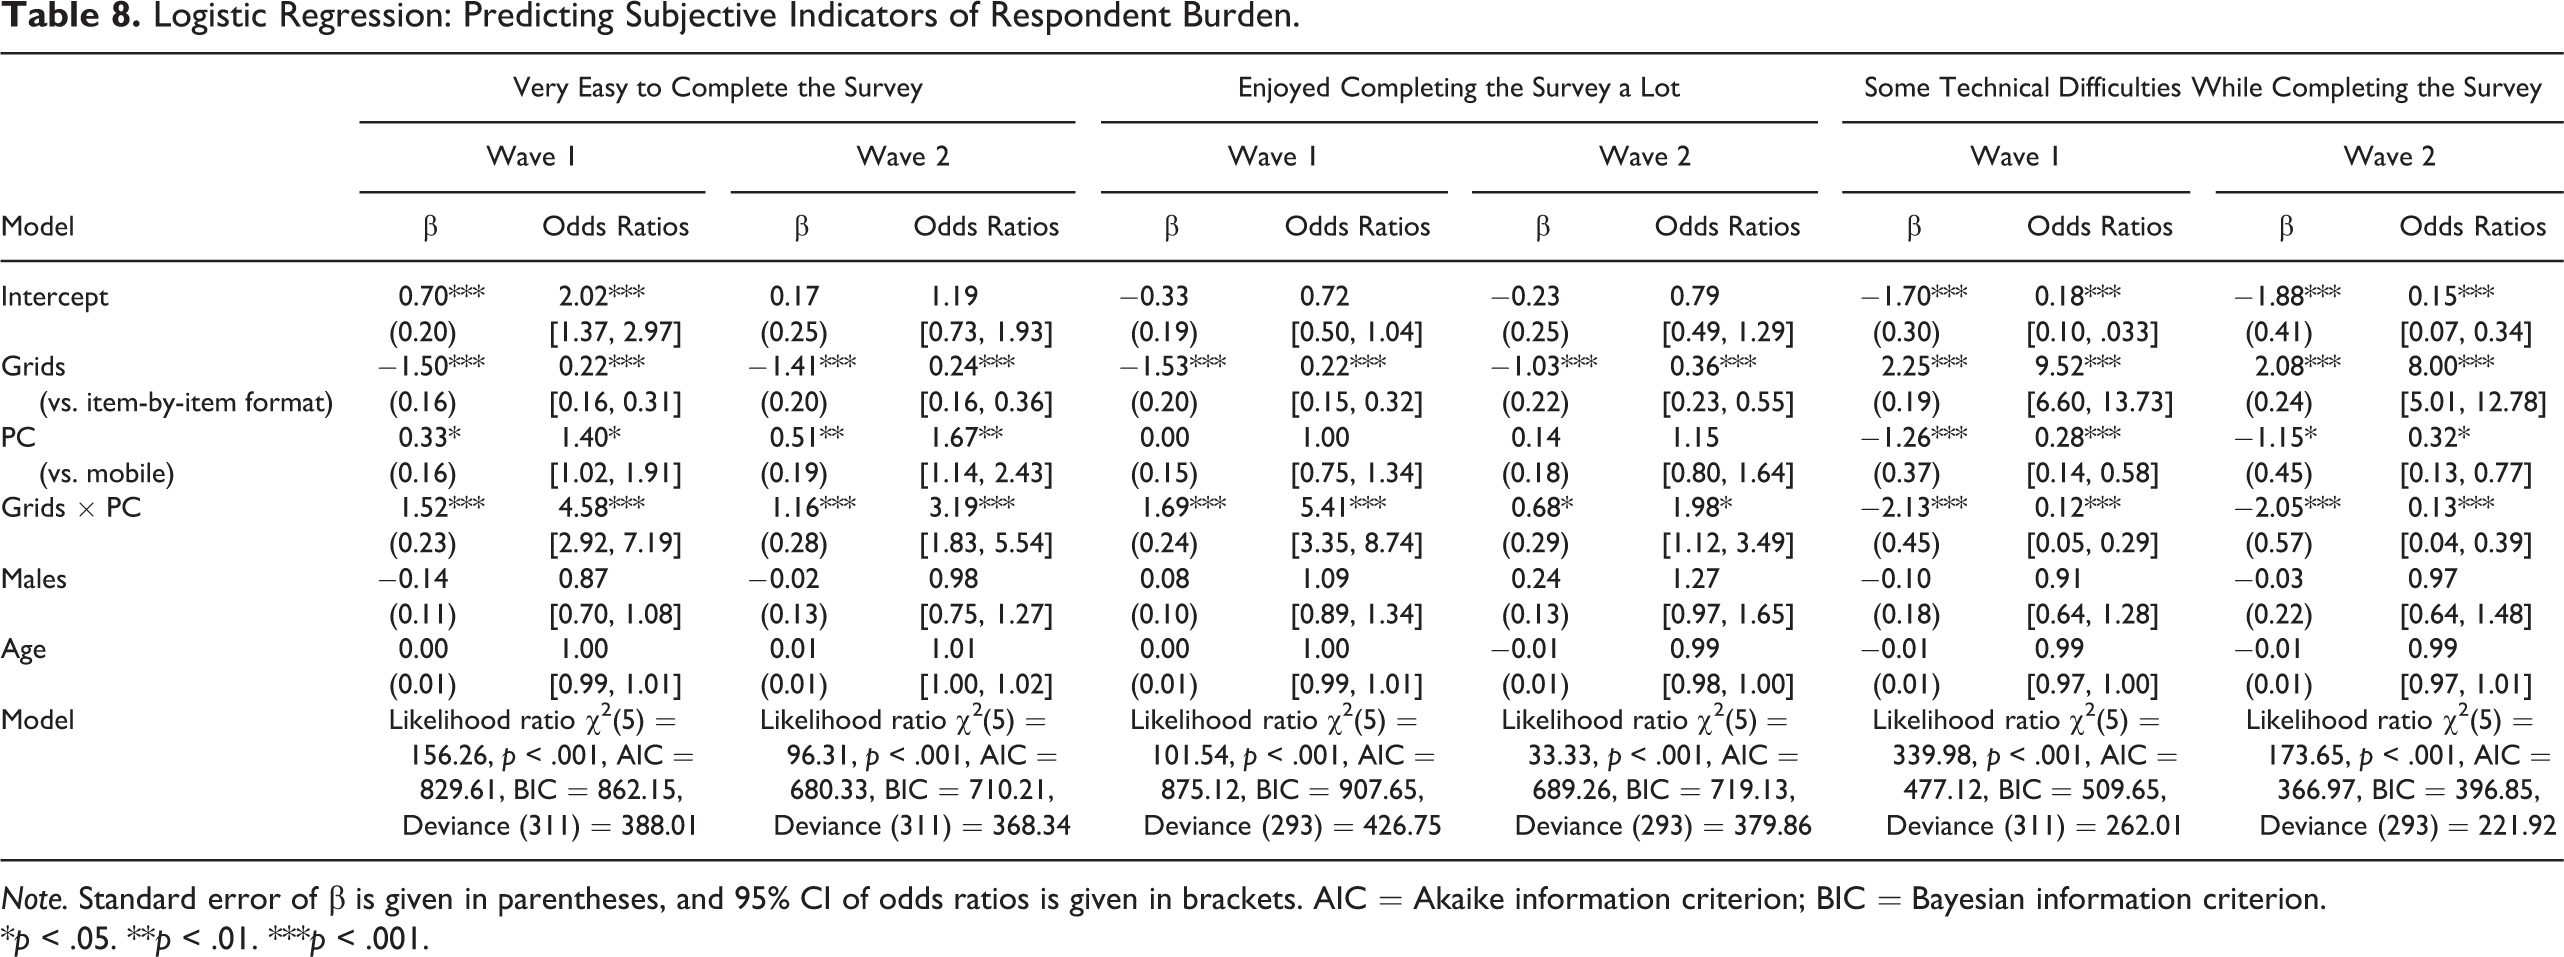
Note. Standard error of β is given in parentheses, and 95% CI of odds ratios is given in brackets. AIC = Akaike information criterion; BIC = Bayesian information criterion.
*p < .05. **p < .01. ***p < .001.
About 41% of the participants reported that they enjoyed completing the survey a lot. More people reported enjoyment in the PC than in the smartphone condition, 47% versus 34%, χ2(1) = 27.26, p < .001, and in the item-by-item than in the grid format, 44% and 38%, χ2(1) = 6.50, p < .05. Similar patterns were found in the second wave. Logistic regressions showed no effect of device and a negative effect of grids on enjoyment. Using grids significantly lowered the odds of reported enjoyment (in both the first OR = 0.22, p < .001, Table 8) and second wave (OR = 0.36, p < .001). A significant interaction between device and format showed that while using grids on smartphones had a negative effect on subjective evaluation, no such effect was found in the PC web condition.
About 13% of the respondents reported having some technical difficulties while completing the questionnaire. This proportion was higher among smartphone than PC respondents, 24% versus 3%, χ2(1) = 153.47, p < .001, and among those in the grid than in the item-by-item format, 19% versus 8%, χ2(1) = 42.70, p < .001. Similar patterns were found in the second wave. Logistic regression showed that grids significantly increased the odds of reporting technical difficulties in both the first (OR = 9.52, p < .001, Table 8) and second wave (OR = 8.00, p < .001). Using a PC rather than a smartphone decreased the odds of reporting technical difficulties in the first (OR = 0.28, p < .001) and second wave (OR = 0.32, p < .05). Similar to other subjective indicators, using a grid format on a smartphone increased the odds of reporting technical difficulties, while using the grid format on a PC had no such effect.
Subjective estimation of completion time showed the same patterns. The OLS regression showed that the grid format increased the subjective length of the survey (β = 2.02, p < .001 in the first wave and β = 1.94, p < .001 in the second wave, data not shown); however, using grids on a PC decreased subjective survey length compared to grids on a smartphone (β = −2.54, p < .001 in the first wave and β = −2.92, p < .001 in the second wave).
Overall, all subjective evaluation indicators showed that the grid format was associated with lower (more negative) subjective evaluation and increased reported technical difficulties and subjective evaluation of survey length. This negative effect was particularly strong for smartphones. However, we should note that these negative effects could be mostly due to the nonoptimized version of the survey in the smartphone condition rather than the grid format per se.
Discussion
Grid or matrix questions are commonly used in web surveys. With a proliferation of mobile devices, some software presents grid questions in an item-by-item format on mobile devices and grid format on PC. Some researchers suggest using the item-by-item format on both PCs and mobile devices (Kuper & Glowa, 2014; Revilla et al., 2017), while others suggest using a grid format on PCs and an item-by-item format on mobile devices (de Bruijne, Marcel, van Soest, & Wijnant, 2015; Stern, Sterrett, & Bilgen, 2016). Still others advocate for new question formats to replace grids on smartphones. We conducted a two-wave experiment and varied the device used (PC vs. smartphone) and the format of the questions (grids vs. item-by-item scrolling) to compare data quality between the formats across devices. The grid format in the mobile web condition was not fully optimized for smartphones.
Our main research hypothesis was that the item-by-item format would produce higher data quality than the grid format for both types of device, but the effect would be stronger among smartphone respondents. Overall, we can conclude with five main research findings.
First, the multigroup comparison showed some measurement equivalence between the question formats. In all except one grid with a 7-point scale, the measurement equivalence was reached at the level of covariances of latent variables (or variances of latent variables in case of one latent factor) between the question formats. The measurement equivalence was reached between devices in all question sets. However, while comparing four conditions (PC grids, PC item-by-item, mobile grids, and mobile item-by-item), the construct validity was not reached in two of the seven sets. The measurement equivalence was not reached in a 7-point scale on moral and rational trust and in a 4-point scale on caution. Liu & Cernat (2016) found measurement equivalence between the grid and item-by-item formats in questions with seven responses or fewer. We found that the questions with a 7-point scale had some differences between the two formats, as well as between the four conditions (Question Format × Device). Overall, we can conclude that in question sets with a 5-point scale or with fewer response categories, the measurement equivalence between the question formats would be reached on both device types. However, there might be some differences in measurement equivalence in the sets with seven or more response categories.
Second, we found almost no significant effects of the question format on test–retest correlations between the latent scores in two waves. We measured whether using a grid format in both waves, using an item-by-item format in both waves, or using different question formats across waves had any effect on predictions of the latent score in the second wave. We found only a few differences and no clear pattern in these differences.
Third, we found no differences in breakoff rates between the question formats. Similar to other studies, we found that mobile web produced a higher breakoff rate than PC web; however, we found no differences between the question formats and between the question formats across devices.
Fourth, similar to other researchers, we found that the grid format is associated with shorter completion times in both PC and mobile web (Callegaro et al., 2009; Couper et al., 2001; Revilla et al., 2017; Toepoel et al., 2009; Tourangeau et al., 2004). However, the price for that shorter completion times is somewhat higher measurement error. The levels of straightlining were also higher in the grid than in the item-by-item format. No stronger effect of the grid format on the level of straightlining was found in the mobile web condition. We also found somewhat higher Cronbach’s α coefficients in the grid than in the item-by-item format, which could be associated with a higher tendency of straightlining. In addition, concurrent validity was lower in the grid than in the item-by-item format in both PC and mobile web conditions. Overall, based on these indicators, the measurement error in the grid format was higher than in the item-by-item format. It seems that the grid format might produce a higher tendency for quicker response, stronger satisficing, and higher probability of less attentive and less thorough responses.
Finally, subjective indicators of respondent burden showed that the grid format increased reported technical difficulties and decreased subjective evaluation of the survey. The effect was substantial in the mobile web condition, while almost no negative effect of the grid format was found in the PC condition. Although the objective completion time was shorter in the grid than in the item-by-item format, subjective evaluation of interview length was longer in the grid format. Again, this effect was strong among mobile web respondents, while no such negative effect of the grid format was found among PC web respondents.
Limitations and Outlook
Some limitations of the experimental study should be noted. First, the study was restricted to members of a single volunteer online opt in panel in a single country. This is not a probability-based sample, and the members of the panel participate in web surveys on a regular basis, which might dampen the effect of different question formats. The sample was further restricted to those who completed two survey waves using the assigned device. While this design limits external validity, it maximizes the internal validity of the comparisons. Second, the grid format in the mobile web condition was implemented using a partially optimized style sheet. This means that implementing grids on smartphones using other forms of mobile optimization may produce different results. It would be useful to replicate these experiments using fully optimized grids (e.g., adjusting font sizes in addition to making the input field touch friendly). Third, we were not able to capture client-side paradata so were not able to measure behaviors such as pinching and zooming or scrolling (see Couper & Peterson, 2017) across formats and devices. Along with Liu & Cernat (2017), we suggest the capture of additional paradata to better understand the reasons for different measurement errors between the question formats on different devices.
A final limitation is that we did not systematically vary the number of response options and number of items in the question sets to explore how these variables may affect nonresponse and measurement error. Liu & Cernat (2017) showed that the number of response categories has an effect on measurement equivalence. We found some support for this in our experimental study but did not exceed seven (end point–labeled) response options. Some researchers showed that measurement errors can be different depending on the number of items included in the grid questions (Peytchev, 2005; Stern et al., 2016; but see Revilla & Couper, 2017). We suggest that further research should vary the number of response options and number of items to measure how these factors might have an effect on different indicators of data quality in PC and mobile web surveys.
Conclusions and Practical Implications
Our findings offer some practical suggestions for implementing grid questions in web surveys. We suggest there are three main implications.
First, based on our results, if one is not able to use mobile optimization for smartphones, then using an item-by-item format rather than a grid format for mobile web surveys may be prudent. This finding replicates several earlier studies that find grids to be less than optimal for nonoptimized surveys on smartphones. Our results suggest that using grids on mobile devices without optimization increases measurement error and decreases the subjective evaluation of the survey.
Second, in questions with a seven or more response options, we recommend using an item-by-item format in both mobile and PC web surveys; otherwise, there may be differences in measurement equivalence between devices. This is important as some survey software optimized automatically for mobile devices by turning grids into item-by-item formats for smartphones, but leaving them as grids on PCs, potentially resulting in compromises in measurement equivalence.
Third, we suggest that using the item-by-item format in PC web surveys may increase concurrent validity and decrease nondifferentiation or straightlining. In addition, we found that although the grid format decreased survey completion time, it had no effect on subjective survey length among PC web respondents.
As we noted at the outset, there are a large number of factors that may affect the choice of a grid format for surveys, including the length and complexity of the survey, the number of items, the number of response options, the proportion of the respondents using a mobile device, the type of mobile optimization (if any) for smartphones, and so on. The choice of whether or not to use grid question should be made on a case-by-case basis and is not an all-or-nothing decision. If the survey software does not optimize for mobile devices (particularly smartphones), we suggest that using an item-by-item format for both mobile and PC web may result in lower measurement error and higher measurement equivalence in a survey.
Supplemental Material
Online_Appendices - Grid and Item-by-Item Formats in PC and Mobile Web Surveys
Online_Appendices for Grid and Item-by-Item Formats in PC and Mobile Web Surveys by Aigul Mavletova, Mick P. Couper, and Daniil Lebedev in Social Science Computer Review
Footnotes
Authors’ Note
Aigul Mavletova would like to thank the Russian Academic Excellence Project “5-100”.
Declaration of Conflicting Interests
The author(s) declared no potential conflicts of interest with respect to the research, authorship, and/or publication of this article.
Funding
The author(s) disclosed receipt of the following financial support for the research, authorship, and/or publication of this article: The article is supported by The Russian Science Foundation (Grant No. 17-78-20172).
Supplemental Material
The supplemental material is available in the online version of the article.
References
Supplementary Material
Please find the following supplemental material available below.
For Open Access articles published under a Creative Commons License, all supplemental material carries the same license as the article it is associated with.
For non-Open Access articles published, all supplemental material carries a non-exclusive license, and permission requests for re-use of supplemental material or any part of supplemental material shall be sent directly to the copyright owner as specified in the copyright notice associated with the article.