
Abstract
Research has shown that the non-Internet population is hesitant to respond to online survey requests. However, also subgroups in the Internet population with low digital affinity may hesitate to respond to online surveys. This latter issue has not yet received much attention by scholars despite its potentially detrimental effects on the external validity of online survey data. In this article, we explore the extent to which a person’s digital affinity contributes to nonresponse bias in the German Internet Panel, a probability-based online panel of the general population. With a multidimensional classification of digital affinity, we predict response to the first online panel wave and participation across panel waves. We find that persons who belong to different classes of digital affinity have systematically different sociodemographic characteristics and show different voting behavior. In addition, we find that initial response propensities vary by classes of digital affinity, as do attrition patterns over time. Our results demonstrate the importance of digital affinity for the reduction in nonresponse bias during fieldwork and for postsurvey adjustments.
Keywords
Online surveys have become a prevalent data source for market research and behavioral sciences (Baker et al., 2010; Schonlau, Fricker, & Elliott, 2002, p. 7). The online mode is attractive because it enables conducting interviews cost-effectively in terms of time, space, and labor (Greenlaw & Brown-Welty, 2009; Hardigan, Succar, & Fleisher, 2012; Kaplowitz, Hadlock, & Levine, 2004). Furthermore, research finds low measurement error in online surveys due to a reduction in social desirability bias (Kreuter, Presser, & Tourangeau, 2008) and a cancellation of interviewer effects in the self-completion mode (for a review, see West & Blom, 2017).
However, researchers have raised concerns about the generalizability to the general population of estimates based on online surveys (Best, Krueger, Hubbard, & Smith, 2001; Bethlehem, 2010; Dever, Rafferty, & Valliant, 2008; Mohorko, de Leeuw, & Hox, 2013; Sterrett, Malato, Benz, Tompson, & English, 2017). Much of this discussion circles around the suitability of the nonprobability sampling methods employed by many commercial online survey providers (Bethlehem & Stoop, 2007; Gelman, Goel, Rothschild, & Wang, 2016; Yeager et al., 2011). Because of apparent selectivities in nonprobability online surveys, there is now an increasing number of probability-based online panels, which acknowledge the need for both probability sampling and coverage of persons without computers and/or Internet (see, e.g., Blom et al., 2017; Bosnjak et al., 2013; de Vos, 2010; Knoef & de Vos, 2009; Revilla, Cornilleau, Cousteaux, Legleye, & de Pedraza, 2016).
Most probability-based online panels account for potential coverage biases by either equipping the so-called offliners with devices and Internet or by interviewing them via a different mode such as mail questionnaires (see Blom et al., 2016; Bosnjak et al., 2017). However, even when covered, offliners tend to be underrepresented in the online sample, because they are less likely to respond to the request to become part of the online panel (Blom et al., 2017; Hoogendoorn & Daalmans, 2009; Leenheer & Scherpenzeel, 2013). Research further shows that offliners differ from onliners in their sociodemographic characteristics (Blom et al., 2017; Eckman, 2016; Leenheer & Scherpenzeel, 2013), their attitudes and behavior (Zhang, Callegaro, & Thomas, 2008), and their general health (Schnell, Noack, & Torregoza, 2017). Therefore, we need to understand the mechanisms of selectivities and discover ways to adjust for them to avoid biased estimates in substantive research.
Studies of selectivities in probability-based online samples have thus far considered the use of digital technologies a binary phenomenon: Persons were considered to be either offline or online. However, there has been a change in the digital divide, away from a mere digital access divide toward a digital usage divide and digital device divide (Antoun, 2015; Hargittai, 2005; van Deursen & van Dijk, 2014). This change in the digital divide is of particular interest to survey research because it is likely associated with response to online surveys (for the association between response rates and mode preferences, see Millar & Dillman, 2011; Olson, Smyth, & Wood, 2012; Rookey, Hanway, & Dillman, 2008; Shih & Fan, 2007).
The notion that differences in Internet access and device usage affect response to online survey requests is supported by Barron and Dennis (2016) and Pforr and Dannwolf (2017), who find that about one fourth of those who use the Internet for private purposes prefer a paper questionnaire or telephone interview over an online questionnaire in mixed-mode surveys. Thus, it is not only offliners who hesitate to respond to an online panel request but also many onliners. Therefore, we need a more fine-grained concept of Internet access, usage, and access to digital devices to account for further subgroups in the online population. In the following, we cover aspects of the digital access divide, the digital device divide, the digital usage divide, and attitudes toward technology under the term digital affinity (for different concepts of digital affinity, see Blank, 2017; Blank & Groselj, 2014; Brandtzæg, 2010; Dutton & Blank, 2014; Hargittai 2009, 2005; Hargittai & Hsieh, 2012; van Deursen & van Dijk, 2014; Wang, Myers, & Sundaram, 2013).
In addition to drawing attention to the concept of digital affinity, we aim to find a single predictor of unit nonresponse in online surveys because this enables the timely and efficient development of adjustments for unit nonresponse both during fieldwork (e.g., for case prioritization and in adaptive or responsive designs see Brick & Tourangeau, 2017; Peytchev, Riley, Rosen, Murphy, Lindblad, 2010) and for weighting and imputation purposes post hoc (see, e.g., Kreuter et al., 2010). The fruitful combination of measuring digital affinity and investigating unit nonresponse in an online panel allows us to add to current research into unit nonresponse and nonresponse bias in probability-based online panels.
Theoretical and Conceptual Framework
Digital Affinity
The traditional concept of the digital divide was based on a dichotomy between “haves” and “have-nots” regarding the means to connect to the Internet (DiMaggio, Hargittai, Celeste, & Shafer, 2004, p. 357; Rice & Katz, 2003). Since Internet penetration rates and the variety of Internet devices available are increasing in Western countries (European Commission, 2016; Mohorko et al., 2013; Sterrett et al., 2017), the term digital divide is ever changing, resulting in a variety of different definitions, which cover different aspects of access to and competence in the use of digital technologies and/or the Internet (see Guo, Dobson, & Petrina, 2008; Hargittai, 2009, 2005; Hargittai & Hsieh, 2012; Wang et al., 2013). In general, the digital divide describes inequalities that can cultivate different forms of digital technology use.
The digital divide literature increasingly argues that the digital access divide turns into a digital usage divide (e.g., van Deursen & van Dijk, 2014). Research investigating the digital usage divide explores the characteristics and quality of typologies regarding digital technology usage (for an overview, see Blank & Groselj, 2014; Brandtzæg, 2010 Brandtzæg, Heim, & Karahasanović, 2011; Hargittai, 2005; van Deursen & van Dijk, 2014). In this respect, the literature on digital affinity typologies identifies three dimensions of Internet usage (see Blank & Groselj, 2014; Brandtzæg, 2010; Holmes, 2011): (1) amount or frequency of Internet use, (2) variety of Internet use, and (3) type or content of Internet use. In addition, Antoun (2015) extends the concepts of digital access divide–being online or offline–and digital usage divide. He adds the concept of digital device divide by identifying four categories of survey respondents: non-Internet users, computer Internet users, mobile Internet users, and Internet users who use a combination of mobile devices and computers (Antoun, 2015). Furthermore, we know from decision models regarding technology adaptation that initial and continued digital technology usage depend on the perceived usefulness of and satisfaction with technology (see Hong, Thong, &Tam, 2006). For example, Porter and Donthu (2006) report that even when controlling for sociodemographic differences and technology access barriers, perceptions regarding the use and usefulness of the Internet have a strong effect on its usage. This process may well translate to online surveys such that attitudes toward technology may impact on persons’ likelihood to participate in an online panel. Based on this literature, researchers investigating nonresponse in probability-based online panels may be well-advised to consider a multidimensional classification of digital affinity that includes aspects of the digital access divide, the digital device divide, the digital usage divide, and attitudes toward technological innovation.
Hypotheses
Digital affinity may be a valuable predictor of nonresponse bias and useful auxiliary variable for postadjustment procedures, if it is associated with both key survey variables and sample units’ propensity to respond (see Groves’s, 2006, common cause model).
First, we consider the association between digital affinity and key survey variables. Previous research has shown that Internet access and usage vary according to age and educational level (e.g., see Antoun, 2015; de Bruijne & Wijnant, 2014; Dutton & Blank, 2014; Friemel, 2016; Rice & Katz, 2003; Slegers, van Boxtel, & Jolles, 2012; van Deursen & van Dijk, 2014, 2015). Furthermore, research has reported differences in news consumption between Internet users and nonusers, and within subgroups of Internet users (Stempel, Hargrove, & Bernt, 2000; van Deursen & van Dijk, 2014). Moreover, Robinson, Neustadtl, and Kestnbaum (2002) and Wei and Hindman (2011) found an association between Internet usage and political opinion. Based on this literature, we derive the following hypothesis regarding the association between digital affinity and key survey variables.
When we consider general predictors of unit nonresponse bias, the decision to participate in surveys is related to a person’s predispositions, such as their sociodemographic characteristics (Couper, Kapteyn, Schonlau, & Winter, 2007; Hoogendoorn & Daalmans, 2009; Kaplowitz et al., 2004; Payne & Barnfather, 2012; Rookey et al., 2008) and the survey topic (Groves, Presser, & Dipko, 2004; Zillmann, Schmitz, Skopek, & Blossfeld, 2014). We expect a person’s digital affinity to be an additional factor in explaining unit nonresponse bias in probability-based online panels. In accordance with the cost-benefit theory, we expect that persons differentially perceive the benefits and costs of participating in an online panel (for an elaboration, see Schnell, 1997, pp. 133–216; Singer, 2011, p. 381). Due to differences in their digital affinity, individuals are likely to differ in their skills to navigate through the Internet and hence, some persons will experience response to an online panel as more burdensome than others (see Fuchs & Busse, 2009; Hoogendoorn & Daalmans, 2009; Kwak & Radler, 2002). How burdensome persons consider their response to an online panel will influence the subjective costs of their subconscious cost–benefit calculation. As described in the unit nonresponse literature, respondents face various costs when participating in a survey (e.g., Singer, 2011). For the sake of simplicity, we assume that other factors that may influence a person’s costs of participation (i.e., those not related to digital affinity) are evenly distributed across different groups of digital affinity.
Based on this hypothesis, we argue that the costs of participating in an online panel are lowest for people who regularly use the Internet and highest for people without computer and/or Internet access (see also Kwak & Radler, 2002). Therefore, we expect that, for probability-based online panels, persons’ response propensity will vary according to their group of digital affinity.
Once a person becomes a member of an online panel, their costs of continued response to online panel waves may change over time, because they receive access to and gain experience with filling out the online questionnaires (for different types of attrition patterns, see Lugtig, 2014). For example, Leenheer and Scherpenzeel (2013) find that non-Internet households are more loyal panel participants than Internet households. In this context, it is conceivable that, once previously offline persons are online, their response costs are reduced, resulting in lower attrition rates over time. For persons using computers and the Internet regularly, in contrast, we do not expect the response costs to change, because they do not gain any significantly new digital technology skills through their online panel participation. Hence, we expect different attrition patterns (propensity to participate) for the groups of digital affinity across online panel waves.
In the following, we explore these hypotheses one by one and thus draw a comprehensive picture of the influence of digital affinity on unit nonresponse and unit nonresponse bias in probability-based online panels.
Data
To investigate the contribution of digital affinity to explain unit nonresponse bias, we use data from the German Internet Panel (GIP, Blom et al., 2017). The GIP is a probability-based online panel of the general population aged 16–75, for which respondents are initially recruited via face-to-face surveys and subsequently invited to the online panel. This procedure ensures that (a) the gross sample can be drawn with strict probability methods and (b) the gross sample includes the offline population. The GIP enables offliners to participate by providing them with the necessary equipment and technical support. GIP panel members are invited to participate in online surveys on a variety of political, social, and economic issues every 2 months (see Blom, Gathmann, & Krieger, 2015).
The GIP recruitment data offer a unique opportunity to gain insights into the nonresponse processes in an online panel. Since the GIP is based on a random sample of the general population and was recruited entirely offline via face-to-face interviews, its recruitment data hold rich information on different aspects of digital affinity, independent of the sample persons’ eventual participation in the online panel.
We use data from the 2014 face-to-face recruitment interview and, based on this data, model response to the online panel. The GIP is sampled and recruited in multiple stages (see Table 1). First, 299 areas were randomly selected (for more details, see Blom et al., 2015). Next, 9,316 eligible households were randomly selected within the 299 areas. Finally, 4,426 face-to-face interviews were conducted with one person per eligible household. Out of the 4,426 persons interviewed face-to-face, 3,985 people were identified as age-eligible. In our models, these constitute the gross sample and we refer to them as sample units or sample persons. Of these 3,985 sample units, 2,064 participated in the first online panel wave. In the following, we refer to them as respondents.
German Internet Panel Data Structure.

Note. n = number of observations. We only present unit nonresponse for individuals within households who participated in the face-to-face interview, as we have no information on households who did not respond to the face-to-face interview. In addition, we argue that the initial unit nonresponse process of the face-to-face interview should have been independent of sample units’ digital affinity.
To account for unequal selection probabilities at the face-to-face interview, we apply design weights (for a description, see Blom et al., 2017). In addition, we account for regional clusters in the sampling design by means of jackknife variance estimation (for details, see Gould, 1995; Quenouille, 1956). A small proportion of item missing information on the variable age (<0.5% refused to answer) was imputed using predictive mean matching (for details, see Little, 1988; Morris, White, & Royston, 2014).
Method
Following Holmes (2011), we investigate our theoretical argument for a multidimensional conceptualization of digital affinity with a latent class analysis (LCA). The latent class (LC) framework categorizes sample units into classes based on their similarity in answer patterns. The latent classes are parameterized by means of a maximum likelihood estimation. Sample units are assigned to a latent class based on their highest class probability in terms of their conditional probabilities for values of the predictor variables. Accordingly, sample units who hold similar characteristics in terms of digital technology access and usage have a high probability of belonging to the same class of digital affinity.
To select the best fitting LC model, we use six evaluation criteria (McCutcheon, 2002; Nylund, Asparouhov, & Muthén, 2007; Vermunt & Magidson, 2016): the number of parameters, the degrees of freedom, the p value of the χ2 statistic, the change in the log likelihood (LL), the Bayesian information criterion (BIC), and the likelihood ratio χ2 statistic (L 2). To formally assess the number of digital affinity classes prevalent in our data, we vary the number of classes in the LCA step by step from two to six and compute our six evaluation criteria (for results, see below). Models with more than six classes did not show any significant changes in the evaluation criteria.
Having selected the model according to these criteria, we investigate whether the detected digital affinity classes contribute to explaining nonresponse bias in the online panel (all models were estimated with Stata SE Version 14). We test whether sample units belonging to different digital affinity classes also vary in key sociodemographic characteristics and political behavior. For this purpose, we conduct tests of differences, such as mean comparisons and Pearson’s χ2 statistics.
To examine whether general predictors of nonresponse correlate with sample units’ propensity to respond, we estimate logistic regression models in which we regress response to the first online panel wave on the general predictors of nonresponse age, gender, educational level, household size, urbanity, political interest, and electoral participation. Subsequently, to investigate the additional contribution of digital affinity, we extend the analysis by our classes of digital affinity and perform a log likelihood ratio test (LR test). In the final model, we extend the analysis by interaction terms between digital affinity and general predictors to examine possible interdependencies of digital affinity with other variables.
Finally, we explore the added value of digital affinity in explaining attrition in the GIP. For this purpose, we run a logistic regression model with a binary dependent variable of participation in each panel wave on the pooled data of the GIP. We treated the 10 panel waves as a continuous variable and included panel waves as a quadratic term, based on the theoretical argument that respondents’ costs of participation diminish from the first online questionnaire to each additional online questionnaire, as they become more familiar with the survey process (the empirical nonlinearity was also graphically tested). In a second step, we extended the model by interaction terms between waves and classes of digital affinity to investigate separate time trends for each class of digital affinity.
Operationalization of Digital Affinity
To identify sample units’ digital affinity with an LCA, we derived measures of digital devices, digital access, digital usage, and attitudes toward technology from the face-to-face recruitment interview. Table 2 presents the four variables included in the LCA. First, a sample unit’s digital devices and Internet access are indicated by whether a sample unit has a computer at home, a computer and Internet at home, or neither a computer nor Internet at home; and whether a sample unit owns a smartphone. We see that the majority of sample units have Internet at home (78%) and that 47% of the sample units own a smartphone. Second, digital usage was identified with a question on a sample unit’s frequency of Internet use (“How often do you use the Internet, the World Wide Web, or e-mail for private purposes, whether at home or at work?”). The majority of sample units use the Internet on a daily basis (60%). Finally, a question evaluates sample units’ attitudes toward technological innovations (“How important is it for you that your technical equipment at home, like mobile phone, television, or computer, is cutting edge technology?”). For most sample units, it is slightly important that their technology is cutting edge (39%).
List of Variables Used for the Latent Class Analysis Models.
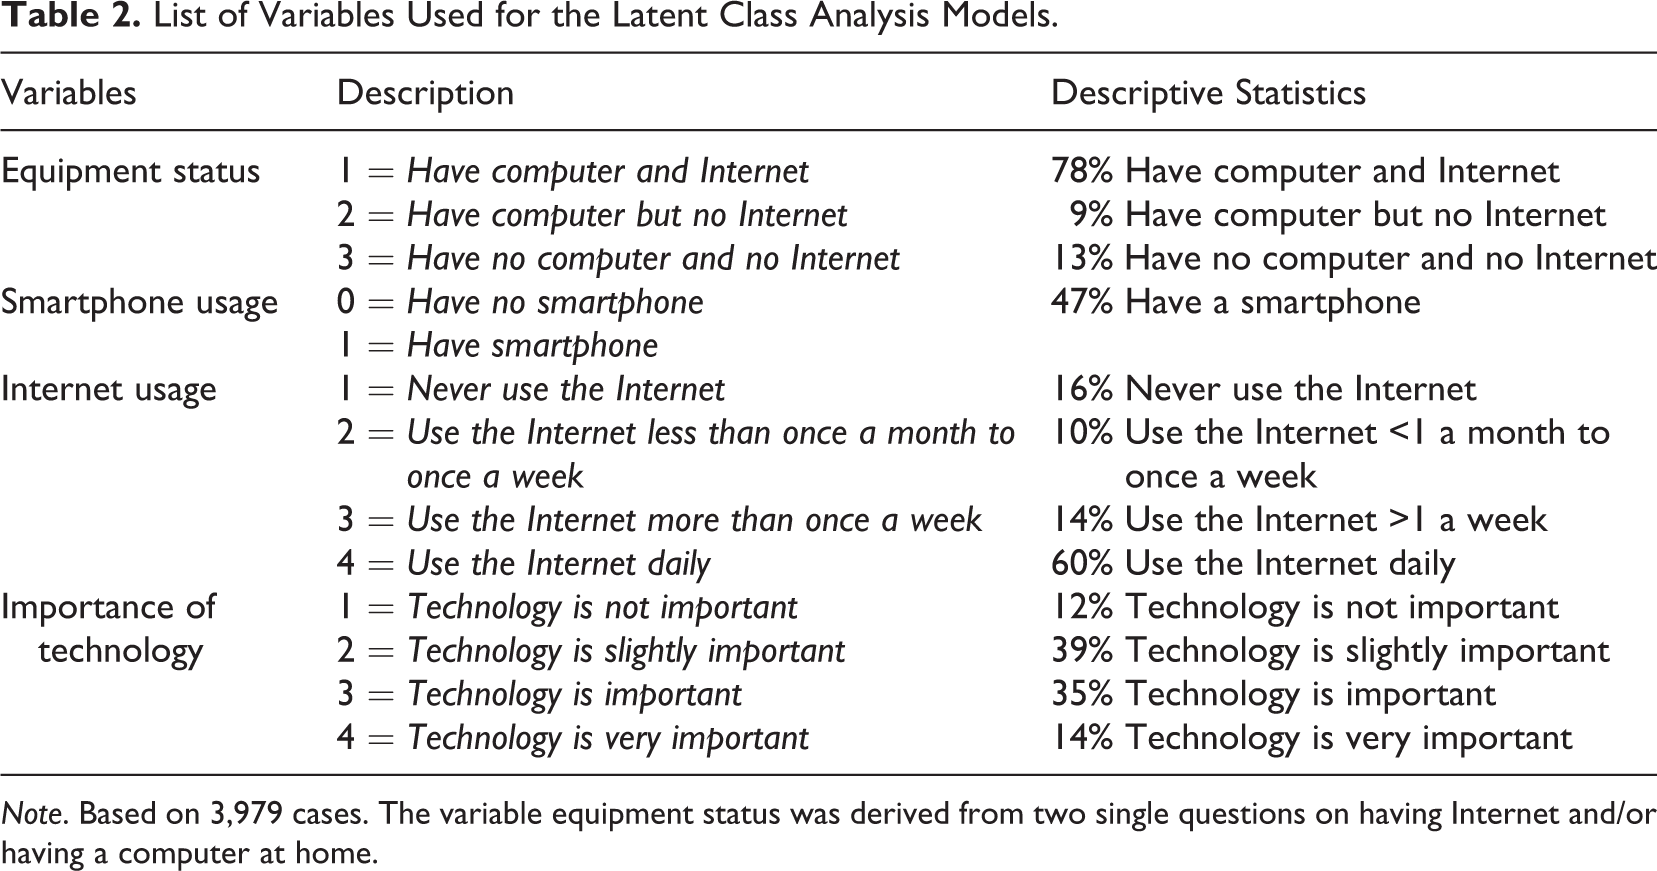
Note. Based on 3,979 cases. The variable equipment status was derived from two single questions on having Internet and/or having a computer at home.
Measuring Digital Affinity
Table 3 shows the six model evaluation criteria (number of parameters, degrees of freedom, p-value of the χ2 statistic, change in the LL, BIC, and L 2) for a series of LCA models with different numbers of classes.
Goodness of Fit for Two to Six Classes of Sample Units’ Digital Affinity.
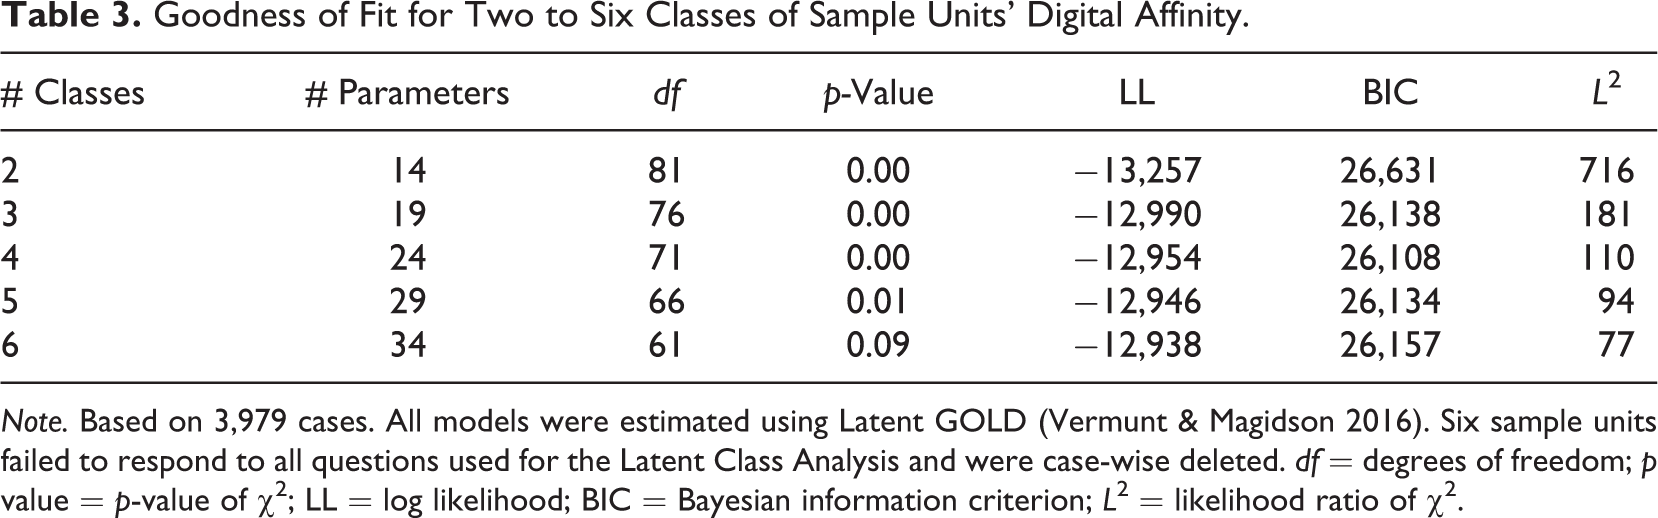
Note. Based on 3,979 cases. All models were estimated using Latent GOLD (Vermunt & Magidson 2016). Six sample units failed to respond to all questions used for the Latent Class Analysis and were case-wise deleted. df = degrees of freedom; p value = p-value of χ2; LL = log likelihood; BIC = Bayesian information criterion; L 2 = likelihood ratio of χ2.
The four-class model shows the best overall results for the statistics examined: a low p-value, the lowest BIC, a relatively low L 2, and LL. With an associated p-value of .00, the four-class solution fits the data well. The BIC value reaches a minimum at the four-class solution, but is higher for two or three and five or six classes, indicating that we can indeed identify four subgroups with distinctive characteristics. Furthermore, when moving from three to four and from four to five classes, the LL fails to decrease substantially. Therefore, we select the model with the lowest BIC. In addition, the L 2 (110) for the four-class model is not substantially larger than the respective degrees of freedom (71), indicating a good model fit. These results are robust to sample size, as we estimated the analysis twice, once with the full data set and once with a 90% random subsample. The assumption of local independence was not violated for the four-class model. Consequently, the statistical arguments suggest a four-class solution for the latent construct digital affinity.
To allow a closer look at the composition of each digital affinity class, Table 4 presents percentages by digital affinity class for each indicator variable used in the LCA for the four-class model. Based on this composition, we describe the four classes as follows:
Digital addicts have a computer and Internet at home (96%) and use new technological devices, like smartphones (77%). They use the Internet on a daily basis (96%), and technology is important to them (very important 23% and important 44%). Thus, this class of persons is motivated and able to use the Internet on a daily basis and has access to smartphones.
Late adopters have a computer and Internet at home (90%) and some of them own a smartphone (32%). About one third of the late adopters use the Internet on a daily basis (34%). On the whole, this class of persons attaches little importance to technology (very important = 6% and important = 29%). Thus, late adopters have access to the Internet and some use a smartphone; however, their lives do not revolve around digital technologies.
Traditional users often have computers, but no Internet at home (51%); however, some of them do not have computers and Internet at all (44%). This class of persons does not own a smartphone (0%), although half of them use the Internet on a daily basis (54%). Furthermore, technology is not important to persons belonging to this class (very important = 11% and important = 36%). Consequently, the majority of this class is familiar with the Internet via computers (maybe at their workplace), but not with smartphones.
Digitally excluded persons do not have a computer or Internet at home (91%). They never use the Internet (97%) or only a few times a year (3%). Furthermore, digitally excluded persons do not own a smartphone (0%) and consider technology only slightly or not at all important (very important 2% and important 19%). All in all, digitally excluded persons are bypassed by recent technological developments.
Percentages for Values of the Predictor Variables by Digital Affinity Class.
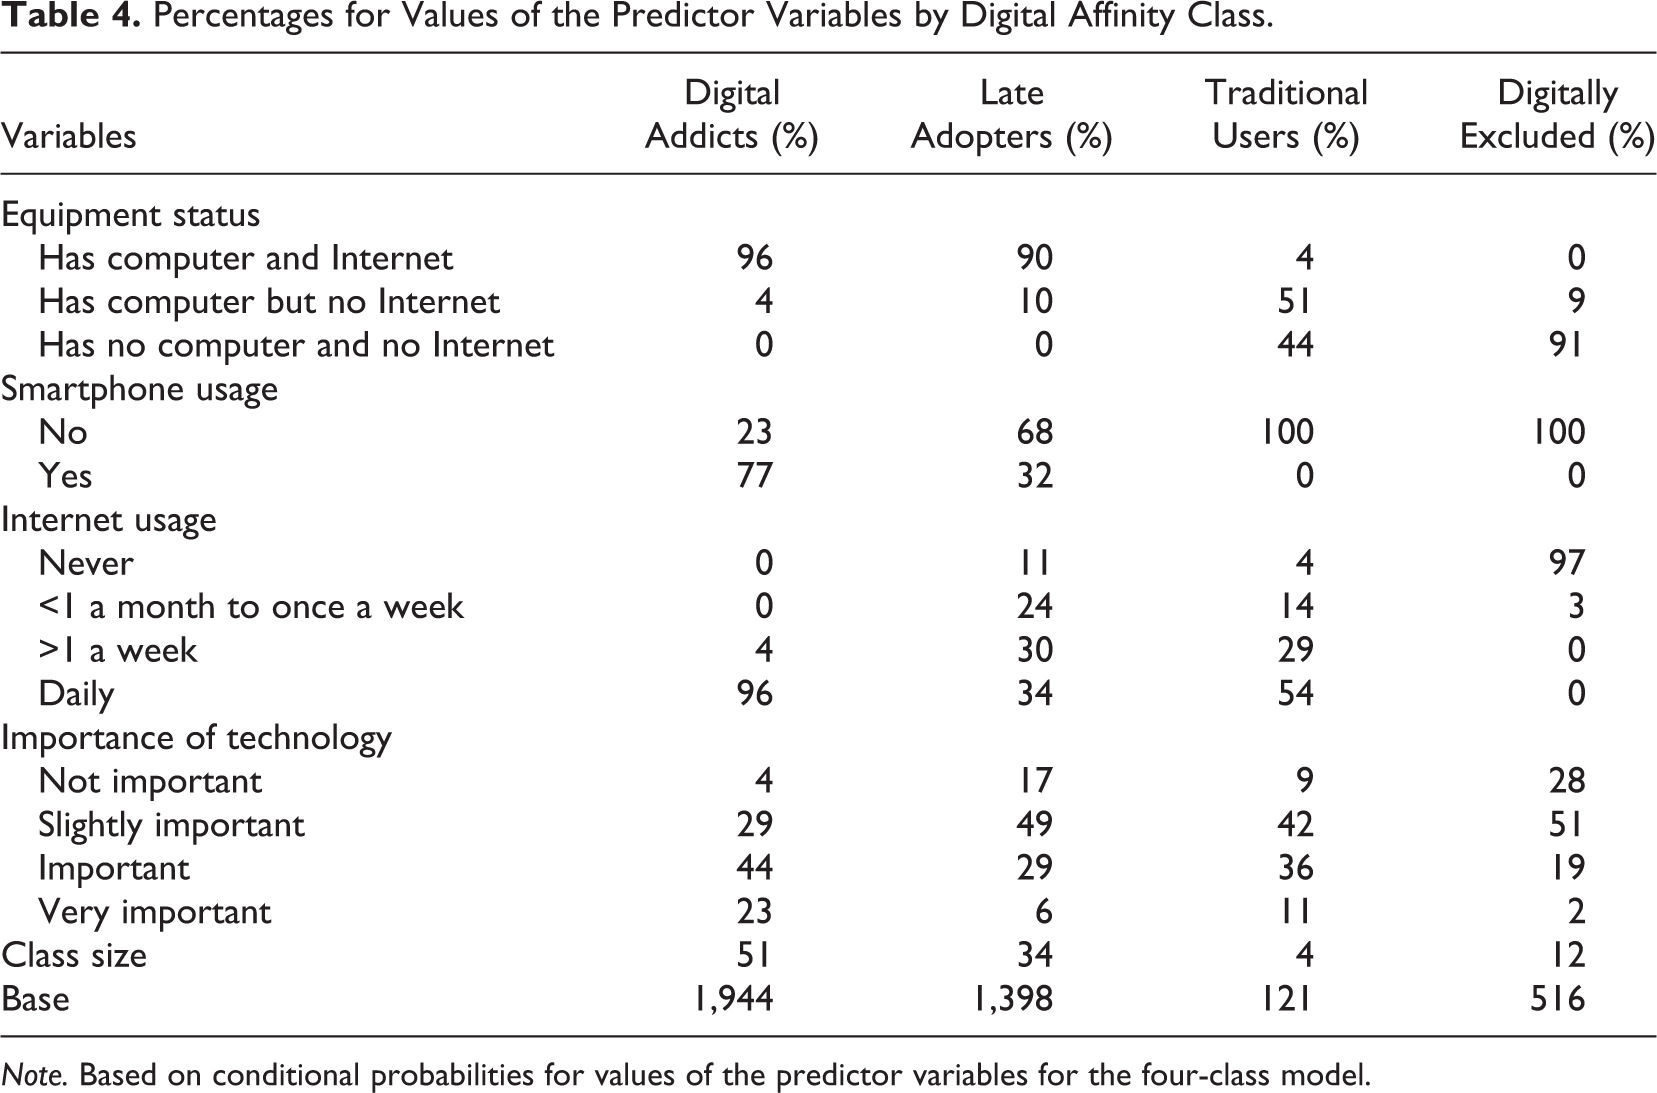
Note. Based on conditional probabilities for values of the predictor variables for the four-class model.
The penultimate row of Table 4 shows the percentage of sample units in each class, which is equivalent to the size of a class. It illustrates that while 51% of persons were identified as digital addicts, a minority of 34% of persons were classified as late adopters, 4% as traditional users, and 12% as digitally excluded.
Given the small size of the class of traditional users, it is likely that a three-class model gives similar results. In addition, the difference between the BICs of the three- and the four-class model is very small, which would also allow a three-class model. Nevertheless, we decided in favor of the four-class model because it maximizes the information gathered from the LCA. In a three-class model, traditional users would merge into the class of late adopters resulting in less discrimination regarding the class of digitally excluded.
To investigate how the LCA classification of digital affinity in this article compares to the binary online/offline classification in previous research into nonresponse in probability-based online panels (see Blom et al., 2017; Leenheer & Scherpenzeel, 2013), we cross-tabulate sample units’ membership in our digital affinity classes with the binary online/offline indicator (see Table 5). We see that 100% of the sample units in the classes of traditional users and digitally excluded would have been classified as offliners. In addition, Table 5 shows that almost all digital addicts and late adopters would have been assigned to the class of onliners (95% and 89%). Thus, we find that Blom et al. (2017) and Leenheer and Scherpenzeel (2013) would have predominantly defined traditional users and digitally excluded as offliners, whereas digital addicts and late adopters would have mainly been classified as onliners. Consequently, our classification of digital affinity subdivides both groups–offliners and onliners–into two subgroups.
Comparison of Binary and Multidimensional Classification in Percentage.
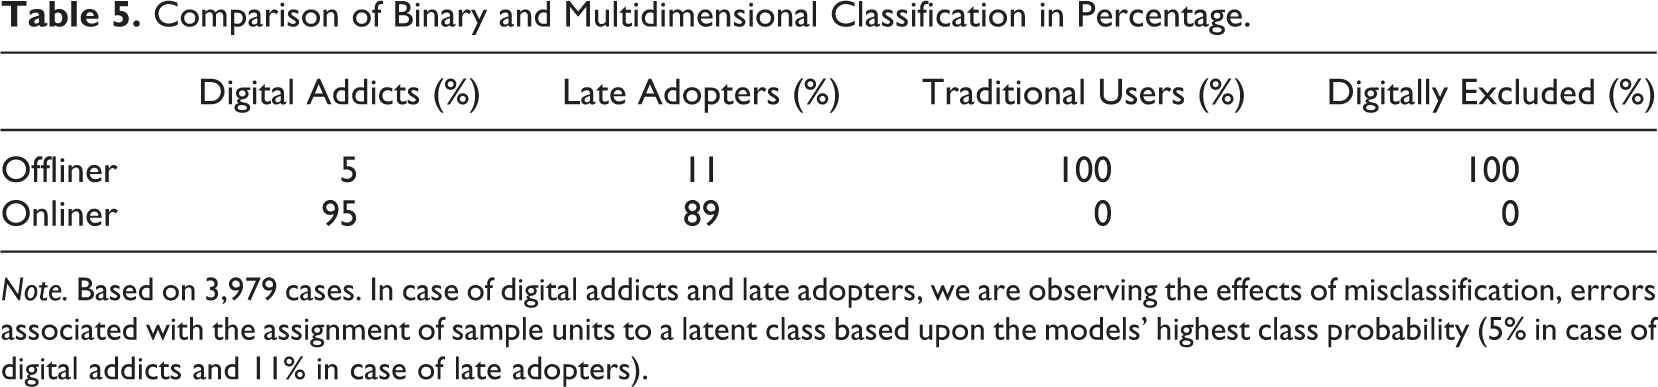
Note. Based on 3,979 cases. In case of digital addicts and late adopters, we are observing the effects of misclassification, errors associated with the assignment of sample units to a latent class based upon the models’ highest class probability (5% in case of digital addicts and 11% in case of late adopters).
Results
Predictors of Unit Nonresponse and Unit Nonresponse Bias
Hypothesis 1
Having derived four classes of digital affinity from information on their access to, use of, and attitudes toward using technology, we next investigate whether sample units that belong to different classes of digital affinity also differ in their sociodemographic characteristics, key political attitudes, and behavior. For this purpose, Table 6 reports differences in sample unit characteristics by digital affinity. We find significant differences in the composition of digital affinity classes regarding all characteristics assessed.
Differences in Sample Units’ Characteristics by Digital Affinity Class.

Note. Analyses conducted with design weights to account for unequal selection probabilities across households of different sizes. We report percentages, with the exception of mean age.
a p- Value based on an one way analysis of variance and covariance. b p- Value based on Pearson’s χ2 statistic. cBase for educational level = 3,972, political interest = 3,977, and media consumption per day = 3,972.
*p < .05, **p < .01, ***p < .001.
As Table 6 shows, there are differences among the four classes of digital affinity with regard to the distribution of age (F 3, 3979 = 364.86, p = 0.00). Sample units belonging to the classes late adopters and traditional users are of similar mean age (51 and 47 years, respectively), whereas digital addicts are on average 41 years and digitally excluded 63 years old.
In addition, we find that digital affinity is significantly related to the educational level (χ2 = 660.45, degree of freedom [df] = 9, p = 0.00). For example, 50% of the digital addicts compared to 6% of the digitally excluded have a high level of education, whereas the digital affinity classes late adopters and traditional users resemble each other in terms of their level of education (31% and 28%, respectively).
We also find differences between the classes of digital affinity with regard to media consumption (χ2 = 38.08, df = 21, p = 0.01). For example, 9% of the digitally excluded and of the traditional users indicated not to use the Internet, radio, television, or newspapers to gather information on political issues as compared to digital addicts and late adopters with 5% and 6%, respectively.
Examining the attitudinal variables, we find significant differences across digital affinity classes regarding political interest (χ2 = 35.63, df = 6, p = 0.00). Digitally excluded persons are most interested in politics, whereas digital addicts are least interested in politics (17% and 10%, respectively).
Furthermore, our results indicate that persons belonging to different digital affinity classes differ in their alleged vote choice (χ2 = 102.05, df = 24, p = 0.00). The digitally excluded (27%) are most likely to say that they voted for the Christian Democrats (CDU/CSU) at the last general election, while only 16% of the traditional users, 21% of the late adopters, and 20% of the digital addicts allegedly voted for this party. In addition, the digitally excluded (2%) are less likely to say that they voted for the Green party (Bündnis 90/die Grünen) at the last general election than the digital addicts (11%), the late adopters (8%), or the traditional users (7%).
We conclude that the composition of our digital affinity classes differs with regard to the sociodemographic characteristics, political attitudes, and voting behavior of sample units. We thus find support for hypothesis 1.
Hypothesis 2
To investigate whether classes of digital affinity–in addition to general predictors of nonresponse–correlate with sample units’ propensity to respond to the first online panel wave of the GIP, we run several logistic regression models. The detailed regression results can be found in Table 7.
Logistic Regression on Response to the First Online Panel Wave.
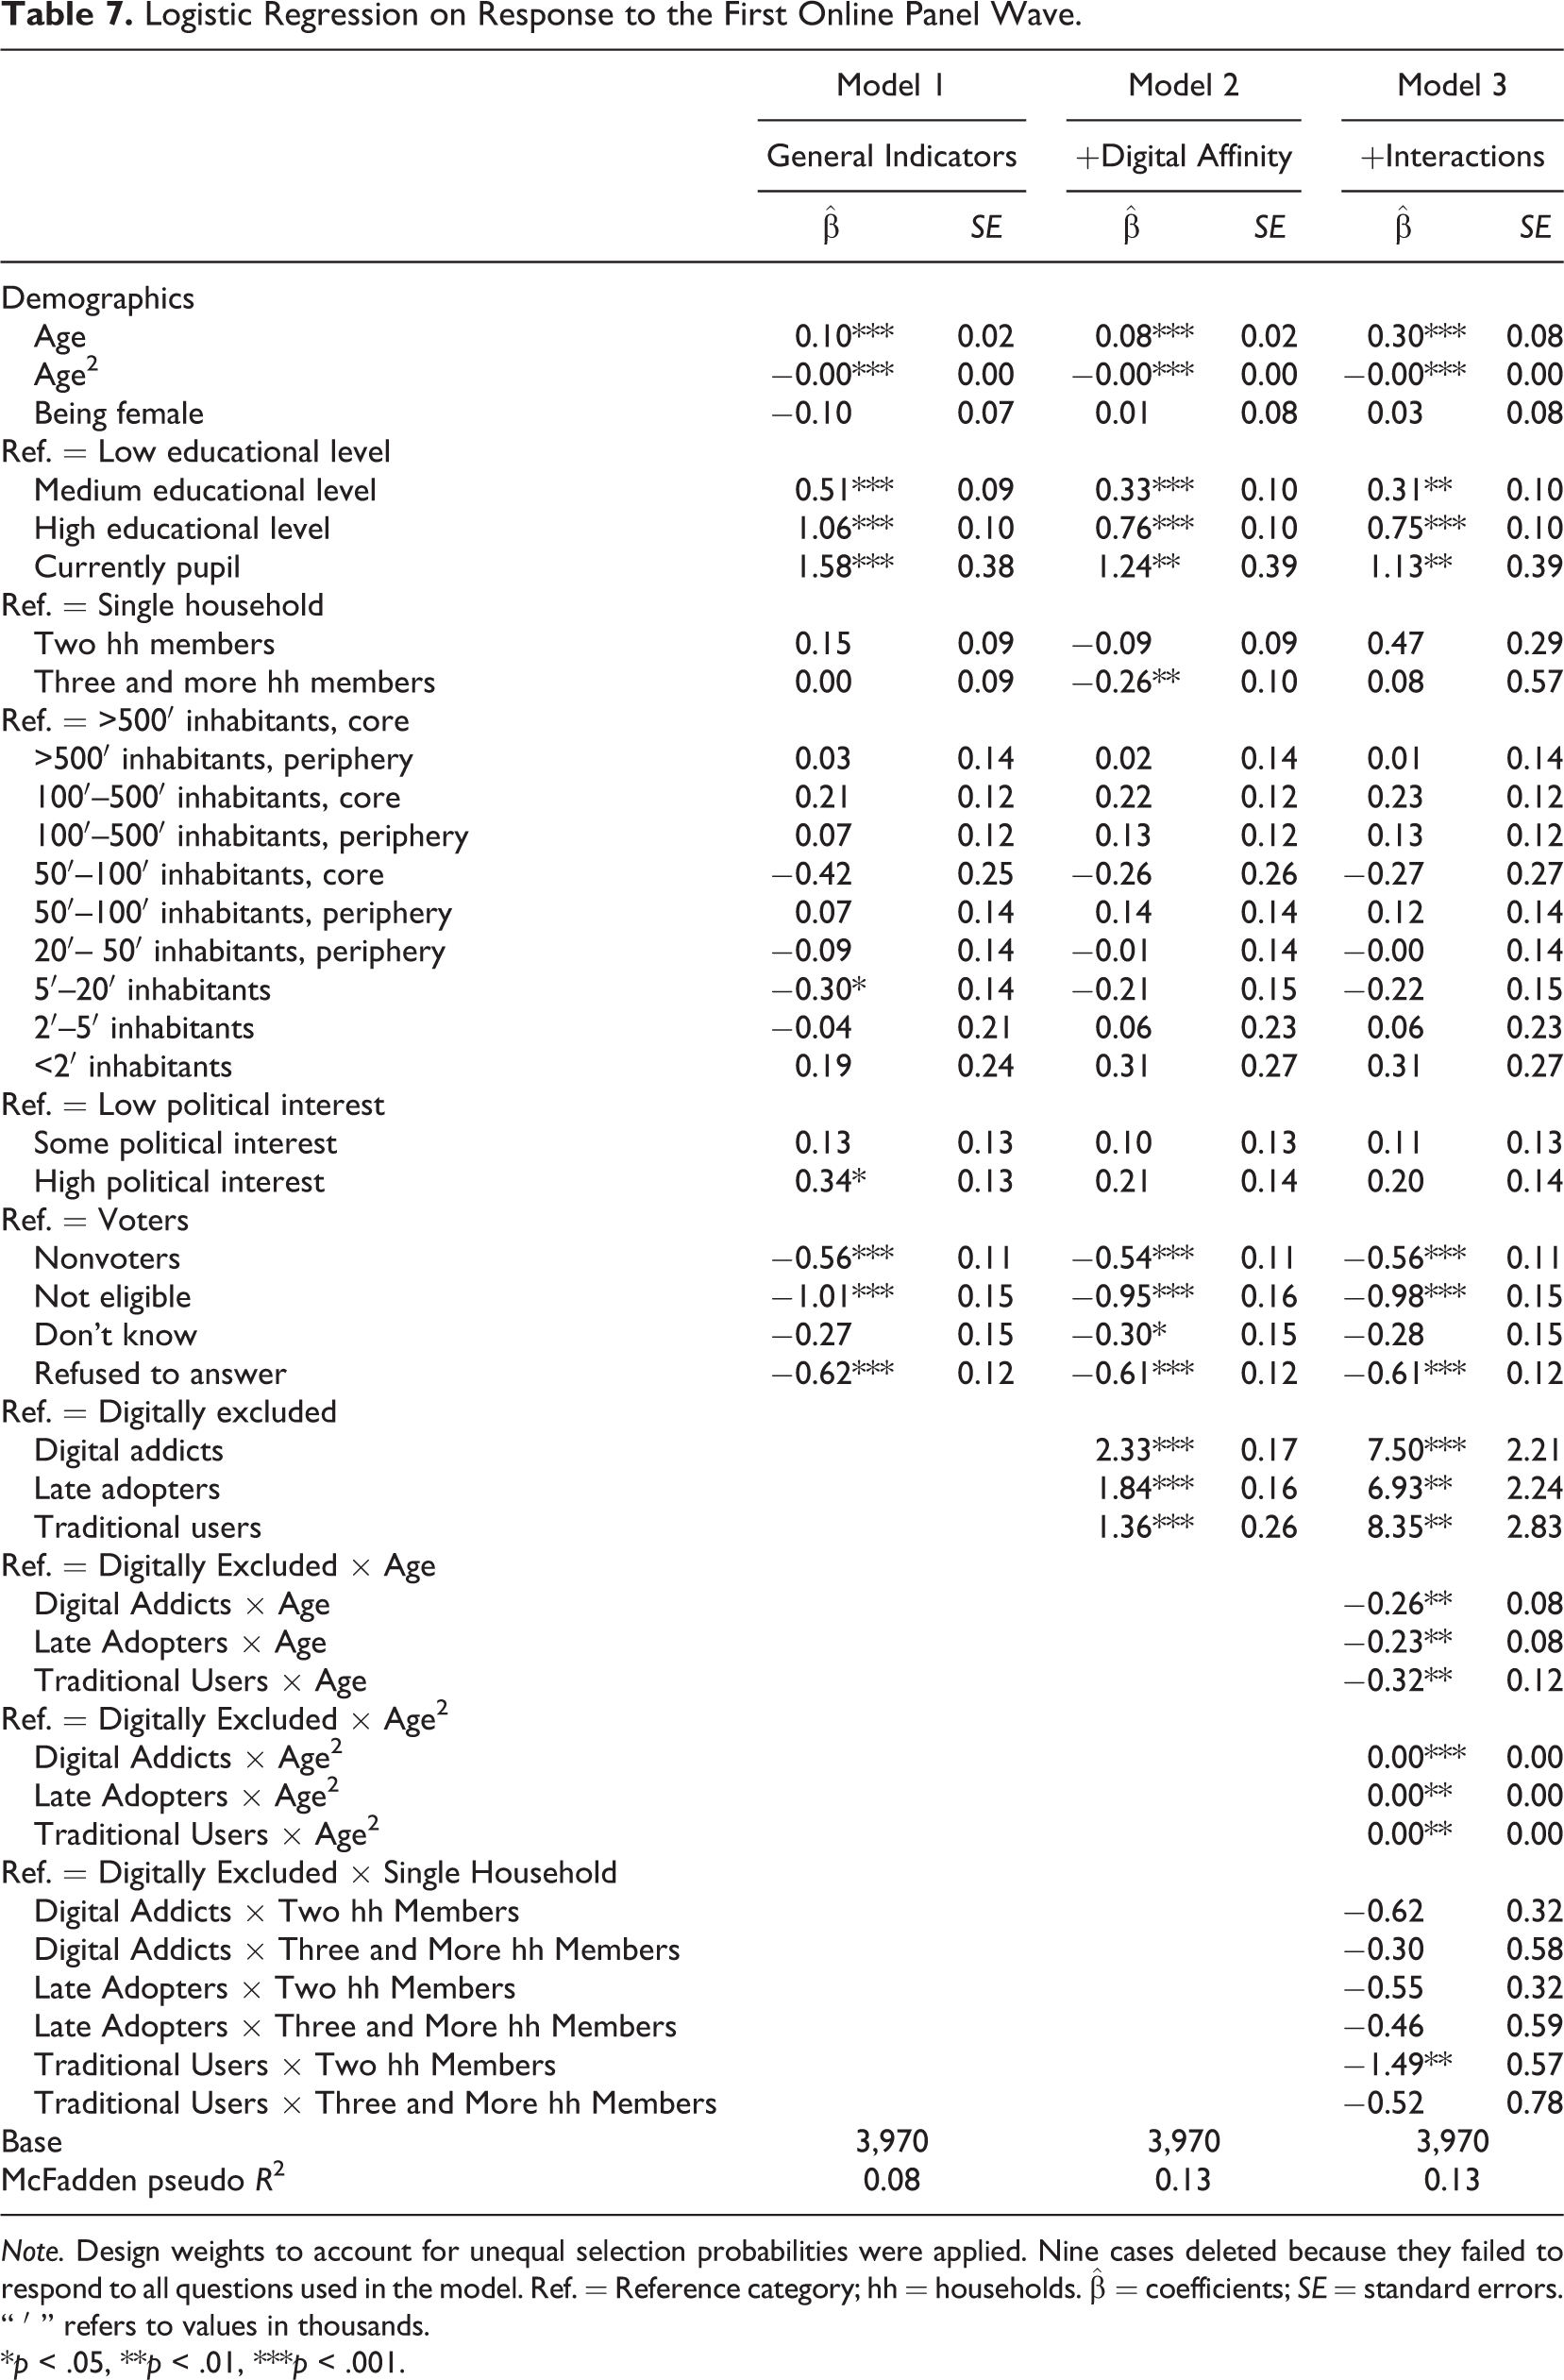
Note. Design weights to account for unequal selection probabilities were applied. Nine cases deleted because they failed to respond to all questions used in the model. Ref. = Reference category; hh = households.
*p < .05, **p < .01, ***p < .001.
The first model includes the general predictors of survey unit nonresponse: age, gender, educational level, household size, urbanity, political interest, and electoral participation. We find that the propensity to participate in the first wave of the online panel significantly increases with age and educational level. Furthermore, the coefficient for a squared age term is negative and significant, suggesting an initial rise in the response propensity with increasing age followed by a fall when reaching older age. In addition, we find significant effects of political interest and voting behavior. Persons with high political interest are more likely to participate in the online panel than persons with some or low political interest. And voters are significantly more likely to respond than nonvoters.
In the second model, we extend the analysis by our classes of digital affinity in order to investigate whether digital affinity contributes to explaining online panel response in addition to the general predictors. By adding the classes of digital affinity the pseudo R 2 of the model increases from 0.08 to 0.13, indicating an improvement in the model fit (see Table 7). The LR test on the two nested models shows that the predictor digital affinity significantly increases the fit of the model (LR χ2 = 212.70, df = 3, p = 0.00). Furthermore, we find some indication for the model with the multidimensional classification of digital affinity fitting the data better than the one with the binary classification of being online and being offline (Akaike information criterion [AIC] = 4,818, BIC = 4,987 vs. AIC = 4,850, BIC = 5,008; results not shown), though nonnested nonlinear models cannot be compared conclusively. Therefore, digital affinity explains unit nonresponse in addition to general predictors, and we find support for our hypothesis 2.
Hypothesis 3
Figure 1 presents a coefficient plot in which we further investigate the effect of the different classes of digital affinity on response (based on Table 7, Model 2). We find that digital addicts, late adopters, and traditional users are significantly more likely to respond to the first wave of the online panel than the digitally excluded. The response propensity is highest for the digital addicts, followed by the late adopters, and the traditional users. Even though we see an overlap in confidence intervals for digital addicts, late adopters, and traditional users, varying the reference categories (results not shown) reveals a significant difference between digital addicts and all other classes of digital affinity (for a discussion on overlapping confidence intervals and significant differences, see Schenker & Gentleman, 2001). These results support our hypothesis that a person’s propensity to respond to an online panel differs by the digital affinity class that they belong to (hypothesis 3).
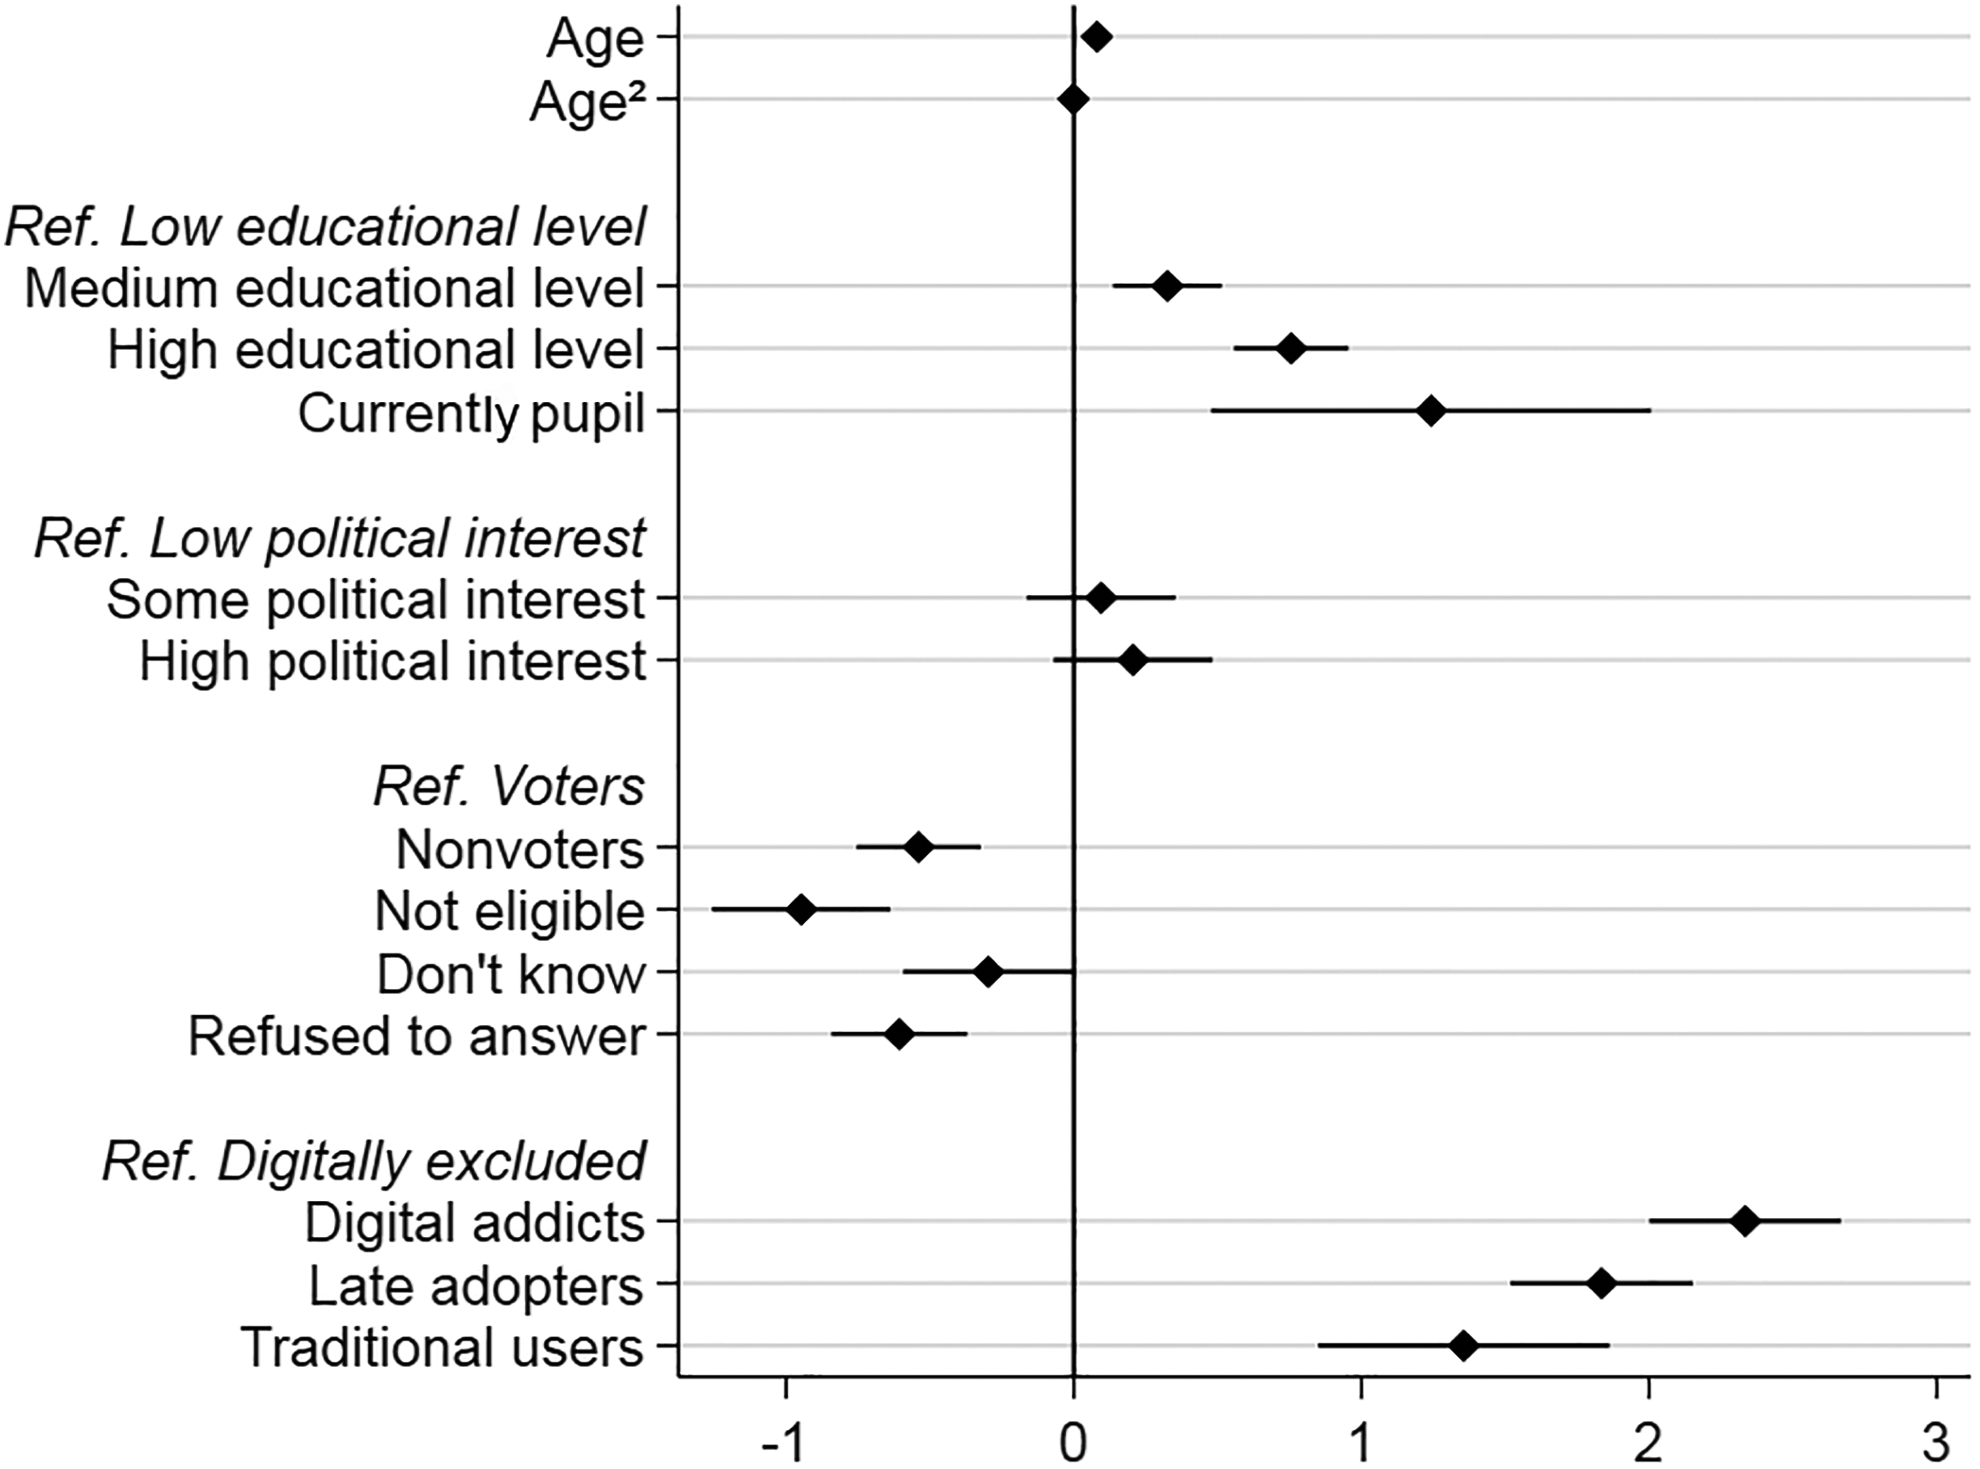
Effects on response to the first online panel wave based on Model 2 in Table 7. Plot markers are coefficients and horizontal spikes are 95% confidence intervals.
To investigate further whether digital affinity adds to explaining response to an online panel, we extend the second model by interaction terms between digital affinity and each of the significant general predictors of Model 2 (see Table 7, Model 3). We find significant interactions of digital affinity with age and with household size. The interactions mean that digital affinity is not only directly associated with response to the online panel. In addition, the effect of digital affinity on nonresponse is differentially strong for people with different background characteristics. However, while the interaction between digital affinity and household size is only significant for one subgroup combination, the interaction of the digital affinity classes with age is consistent both in its direction and in its significance. It thus warrants further investigation.
The effect of age on response propensity clearly differs by class of digital affinity: The slopes of the predicted response probabilities differ across the four classes of digital affinity (see Figure 2). For example, while the young digitally excluded sample units are very unlikely to participate in the online panel, the response propensity increases for the middle-aged but decreases again for the older digitally excluded. In contrast, the response propensity for digital addicts rises constantly with age. For traditional users and late adopters, the propensity to respond to the online panel is independent of age.
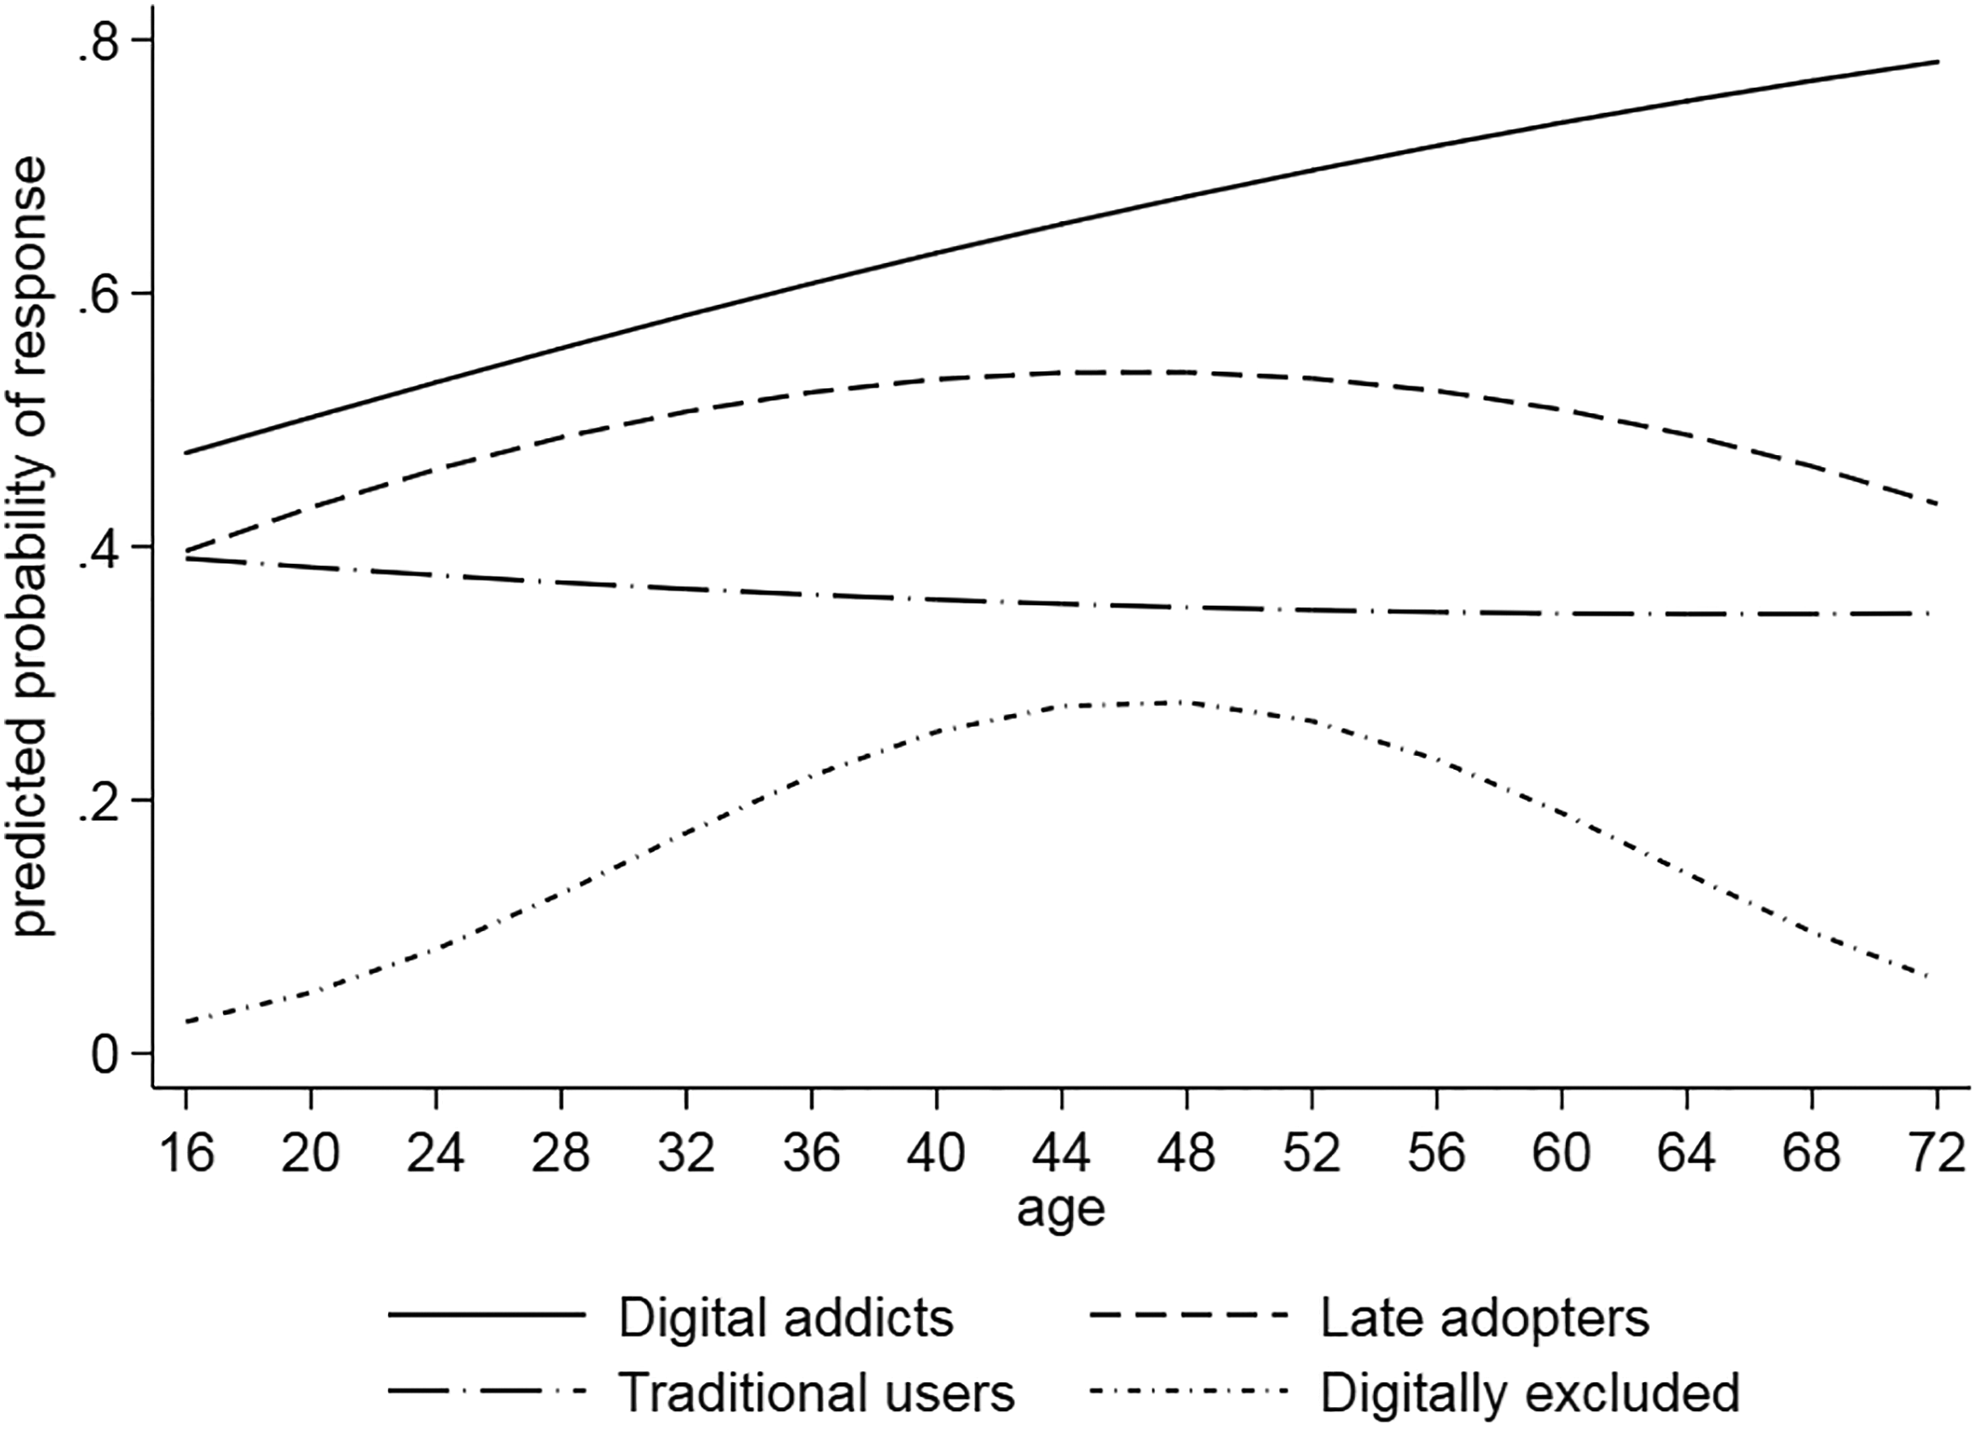
Predicted probabilities of response to the first online panel wave plotted against age, separately for digital affinity classes, based on Model 3 in Table 7.
Online Panel Attrition by Digital Affinity
Hypothesis 4
Our last set of analyses concerns the added value of digital affinity in explaining participation across online panel waves (i.e., attrition). We find a significantly negative effect of wave and a significantly positive effect of wave squared, indicating that with ongoing panel waves the probability of initial panel members to respond to the survey requests becomes lower, but this decrease in response propensity flattens after about 1.5 years (Wave 9, see Table 8, Model 1).
Logistic Regression on Participation Across Panel Waves.

Note. Wave 3 was left out of the analysis to account for the late recruitment of offliners.
*p < .05, **p < .01, ***p < .001.
To investigate separate time trends for each class of digital affinity, we include interaction terms of the waves and digital affinity in our model (Table 8, Model 2). We see a significant difference between the probability of participation across panel waves in the classes of the digital excluded and the digital addicts as well as the digital excluded and the late adopters. These results are also robust when we estimate a random effects model with clustered sandwich estimators for general errors instead of the logistic regressions presented here.
The interaction terms are visualized in Figure 3, where we plotted predicted probabilities of attrition against panel waves, separately for each digital affinity class. Figure 3 shows that the classes of digital affinity differ in their probability to participate in the online waves over time. The attrition curve for the digital addicts is higher than the curve for any other class of digital affinity. Furthermore, while for the digital addicts, the probability to participate in a panel wave decreases relatively steeply at the beginning, for late adopters and traditional users, it stabilizes after about 10 waves. In contrast, the functional form of the attrition curve for the digitally excluded is almost linear with little change over time. The slope of the attrition curve flattens more quickly for the late adopters and traditional users than for digital addicts and digitally excluded. As a consequence, after Wave 4, the digitally excluded are more likely to participate in a panel wave than the traditional users. After Wave 7, the digitally excluded are also more likely to participate in a panel wave than the late adopters. These results are in line with our hypothesis that attrition rates differ by class of digital affinity (hypothesis 4).
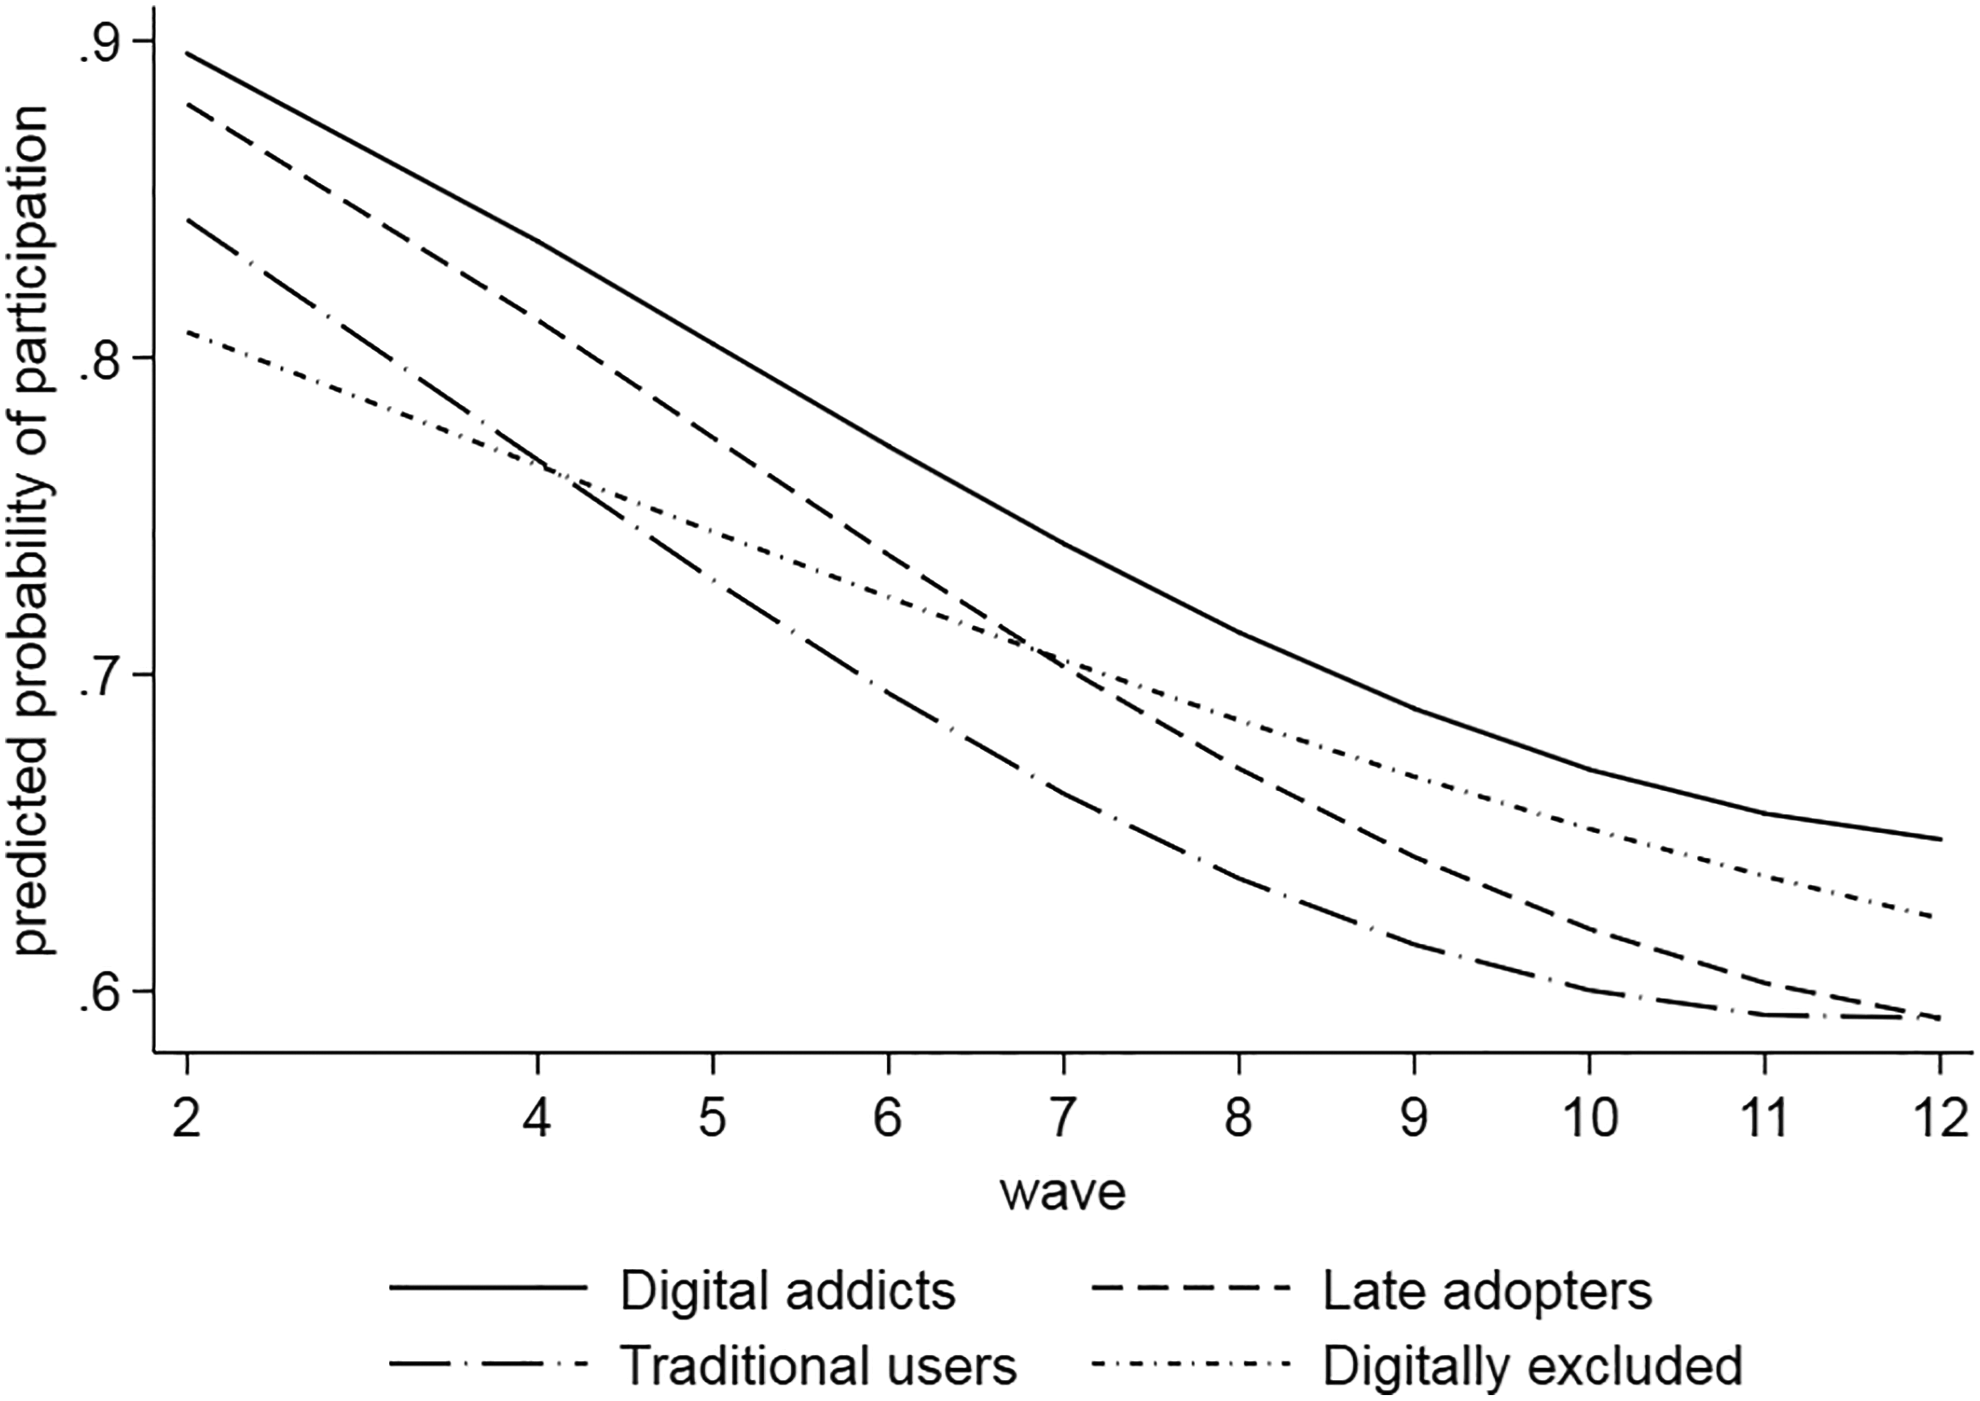
Predicted probabilities of participation in the online panel plotted against panel waves, separately for digital affinity, based on Model 2 in Table 8. Wave 3 was left out of the analysis to account for the late recruitment of offliners.
Discussion
Research into the selectivities of probability-based online panels has thus far considered the digital divide to be a binary phenomenon: Persons were either offline or online. In this article, we draw attention to a change in the digital divide as a result of increasing Internet penetration rates and an increasing diversification in people’s participation in digital developments (for changes in the measurement of digital literacy, see Hargittai, 2009; Hargittai & Hsieh, 2012). We propose a more fine-grained classification of digital affinity to investigate unit nonresponse and unit nonresponse bias in probability-based online panels.
In a first step, we extend the binary differentiation of having Internet access versus not having Internet access into a multidimensional classification covering aspects of the digital access divide, the digital device divide, the digital usage divide, and attitudes toward technical innovations. An LCA identifies four classes of digital affinity: digital addicts, late adopters, traditional users, and digitally excluded. Digital addicts have a computer and Internet at home, own new technological devices, such as smartphones, use the Internet on a daily basis, and consider technology important. Late adopters have a computer and Internet at home and some of them own a smartphone. Many late adopters use the Internet on a daily basis, but they attach little importance to technology. Traditional users have computers without Internet or no computers at all at home, do not own a smartphone, and consider technology unimportant. Nonetheless, most traditional users use the Internet on a daily basis, presumably at work. Finally, the digitally excluded never use the Internet, do not own a smartphone, and attach little or no importance to technology.
Investigating the characteristics of the four classes of digital affinity, their probability to become online panel members, and their probability to continue participation in online panel waves, we find support for each of our four hypotheses. First, we show that sample units that belong to different digital affinity classes also significantly differ in key survey variables, in particular, in their sociodemographic characteristics, political attitudes, and voting behavior.
Second, we show that our multidimensional conceptualization of digital affinity, alongside the general predictors of unit nonresponse, explains panel membership in the online panel. An increase in the pseudo R 2 when adding classes of digital affinity to the model indicates an added value in the classes of digital affinity for predicting participation in the first online panel wave.
Third, we find that sample units’ propensity to participate in the first online panel wave varies by their class of digital affinity. We find evidence that not only offliners, but also certain groups among the online population, are underrepresented in online panels. More generally, different digital affinity classes have different propensities to participate in the online panel: Digital addicts have a higher probability to respond to the online panel than late adopters, traditional users, and digitally excluded. In addition, digital affinity interacts with age. The functional form and slopes of the association between age and response differ across the four classes of digital affinity. For example, while we observe an inversely U-shaped relationship for the digitally excluded, the response propensity for digital addicts rises constantly with age. In contrast, for traditional users and late adopters, response to the online panel appears not to be related to age.
Fourth, we find evidence that different digital affinity classes are associated with different attrition patterns. The functional forms of the estimated logistic regression curves differ by class of digital affinity: While the digitally excluded are hesitant starters, after a few waves, they are more likely to participate every 2 months in online interviews than late adopters and traditional users. These findings suggest that the digitally excluded are very committed to the online panel after having been equipped with the necessary devices. This commitment may stem from a feeling of obligation resulting from the investments made by providing them with computer and Internet access.
Conclusions
With the ubiquity of online surveys in social, political, and economic research, understanding the underlying selection mechanisms is of key interest to both methodologists and researchers using survey data. Recent years have seen the establishment of probability-based online panels, which are representative of the general population, many of which are accompanied with research programs into the coverage and nonresponse biases that may stem from the online mode (see, e.g., Blom et al., 2017; de Vos, 2010; Leenheer & Scherpenzeel, 2013; Revilla et al., 2016). Most of this research, however, investigates whether it “pays off” to integrate persons who have no computer and/or Internet (so-called offliners) in the sample to reduce coverage bias; it overlooks potential biases that arise from groups within the online and offline population that maybe differentially likely to participate in the online panel due to their digital affinity.
The results presented in this article identify four different classes of digital affinity among the general population in Germany. These four classes differ in their personal characteristics, initial response to the online panel, and longitudinal attrition patterns. Following Groves’s (2006) common cause model, we detect nonresponse bias with respect to digital affinity in the GIP data. However, this finding is accompanied by good news: We can use our digital affinity indicator to reduce the detected bias. Our digital affinity indicator can function as variable in postsurvey adjustments as digital affinity correlates with the variables of interest and response propensities. In addition, the knowledge gained from our research can inform fieldwork monitoring when recruiting and maintaining probability-based online panels. Well-designed fieldwork monitoring procedures (e.g., in responsive designs, see Groves & Heeringa, 2006) may even overcome nonresponse bias, due to digital affinity, in the first place.
While we were very fortunate to receive access to the detailed recruitment data of the GIP, our results are also limited by the data available. The GIP face-to-face recruitment interview was neither designed to measure digital affinity nor envisaged to facilitate the research we conducted. We hope that our results will inform the design of future recruitment interviews of the GIP and other probability-based online panels. A purposively developed recruitment questionnaire would allow to better capture the different aspects of digital affinity. In particular, it may enable a further subdivision of the large and diverse class of digital addicts or a disappearance of smaller classes (in our case traditional users). In 2014, the class of digital addicts already contained the majority of GIP sample; increasing digitalization is likely to further strengthen and diversify this class, a process we should capture and analyze. Finally, more detailed data on digital affinity during the recruitment process may improve fieldwork monitoring processes.
More generally, our research contains key messages for both survey practitioners and analysts. To survey practitioners setting up probability-based online panels, we recommend monitoring participation in the online panel across classes of digital affinity in the course of the recruitment and panel maintenance processes. Covering digital affinity classes during interviewer trainings or considering digital affinity classes in the amount and timing of reminders might be an effective strategy to decrease differential unit nonresponse in the first place. For example, using more experienced interviewers for digitally excluded who are hard to recruit but attrite less or sending more reminders to late adopters after six panel waves might reduce unit nonresponse. For analysts, classes of digital affinity may be valuable when developing effective weights because classes of digital affinity comprise information that reaches beyond general predictors of unit nonresponse and are correlated with key survey outcomes. Future research should look into the development of such nonresponse weights.
On a final note, online surveys seem to be here to stay. Their data facilitate research on a diversity of essential research topics, in the case of the GIP, for example, the political economy of reforms. Understanding the mechanism leading to selectivities in the data of online surveys and discovering ways to adjust for such selectivities will enable a better understanding of political, social, and economic processes and is a prerequisite for making substantive research count.
Footnotes
Authors’ Note
The majority of the data used in the analyses of this article are freely available as part of the Scientific Use Files (SUFs) of the German Internet Panel (GIP) survey data. They can be requested from the GESIS Data Archive for the Social Sciences (GESIS-DAS) at https://dbk.gesis.org/dbksearch/GDesc2.asp?no=0109&tab=&ll=10¬abs=1&db=E. The data sets used are catalogued under the GESIS-DAS reference numbers ZA5924 through ZA6757, which correspond to the following DOI numbers: 10.4232/1.12619, 10.4232/1.12620, 10.4232/1.12621, 10.4232/1.12622, 10.4232/1.12623, 10.4232/1.12624, 10.42 32/1.12838, 10.4232/1.12840, 10.4232/1.12841, 10.4232/1.12842, 10.4232/1.12843, 10.4232/1.12844, and 10.4232/1.12755. In addition, some analyses build on data from the GIP face-to-face recruitment interviews. For ethical and data protection reasons, these data cannot be published as SUFs because such publication would endanger the anonymity of the GIP respondents and nonrespondents. Instead, these data can be accessed at the Onsite Data Access (ODA) facilities of the GIP Secure Data Center (SDC) located at the Collaborative Research Center “Political Economy of Reforms” (SFB 884), University of Mannheim, B6 30-32, Mannheim, Germany. Researchers wishing to make use of the ODA please contact ![]() . The Collaborative Research Center is funded until December 2021. Thereafter, the ODA is envisaged to move to a new SDC. If you wish to access the ODA after December 2021, please contact the authors for further information. The GIP is the central data collection of the SFB 884 (Project Z1).
. The Collaborative Research Center is funded until December 2021. Thereafter, the ODA is envisaged to move to a new SDC. If you wish to access the ODA after December 2021, please contact the authors for further information. The GIP is the central data collection of the SFB 884 (Project Z1).
Declaration of Conflicting Interests
The authors declared no potential conflicts of interest with respect to the research, authorship, and/or publication of this article.
Funding
The authors disclosed receipt of the following financial support for the research, authorship, and/or publication of this article: German Research Foundation (DFG [SFB 884]), Collaborative Research Center (SFB) 884 “Political Economy of Reforms” at the University of Mannheim.