
Abstract
The pervasive use of mobile information technologies brings new patterns of media usage, but also challenges to the measurement of media exposure. Researchers wishing to, for example, understand the nature of selective exposure on algorithmically driven platforms need to precisely attribute individuals’ exposure to specific content. Prior research has used tracking data to show that survey-based self-reports of media exposure are critically unreliable. So far, however, little effort has been invested into assessing the specific biases of tracking methods themselves. Using data from a multimethod study, we show that tracking data from mobile devices is linked to systematic distortions in self-report biases. Further inherent but unobservable sources of bias, along with potential solutions, are discussed.
Keywords
This article is part of the SSCR special issue on “Integrating Survey Data and Digital Trace Data“ guest edited by Sebastian Stier, Johannes Breuer, Pascal Siegers (GESIS – Leibniz Institute for the Social Sciences) & Kjerstin Thorson (Michigan State University).
Media exposure, as a measurement of contact with media content, is so elementary to virtually any kind of media effects research that it almost seems mundane. Yet, the proliferation of digital communication, along with the “high-choice media environment” p. 15 (Prior, 2007) it created, has spurred a search for new, accurate measurements of exposure such as automated tracking of online activity. The driving factor behind this methodological trend is not only the incremental improvement of existing survey-based measures. Its goal is also to establish access to media exposure in new contexts and with increased precision where established methods of data collection are lacking: Mobile devices now offer convenient access to a wealth of content, extending the time and locations where media can be consumed throughout the day. The result is a potentially growing power of communication and platforms, along with new kinds of media effects (Bennett & Iyengar, 2008; Iyengar & Hahn, 2009). Because these developments lead to increasingly elaborate and specific effect assumptions (Garrett, 2013; Hayes, 2013), researchers are in need of exposure measurements that reliably capture content that recipients were exposed to—be it at home or on the go, on computers, or smartphones.
A major and known challenge in this endeavor is the limited ability of recipients to accurately recall or estimate media consumption (Prior, 2009, 2013; Scharkow, 2016). Even if self-reports were accurate in the past, remembering sources—and paths that led there—throughout the day is poised to become increasingly difficult (Niederdeppe, 2016). A growing literature provides evidence that self-reports are severely and systematically skewed when compared with tracking data from desktop PCs (e.g., Scharkow, 2016) or mobile phone usage (Boase & Ling, 2013). Self-assessments, these studies contend, suffer from severe bias in the form of over- and underestimation that becomes visible only when gauging them against tracking data as a “true” baseline. Whether tracking methods fit this role, however, is an open question: After all, any new method comes with specific challenges and consequences, which in this case have so far drawn little scrutiny. In this article, we set out to complement our methodological picture of tracking by focusing on three key phenomena: the specific types of bias inherent in tracking methods, the potential effects of differential self-selection, and the consequences of differential bias in tracking methods and/or participant responses.
The article is structured as follows: We first review the existing state of research on the relation between self-reports and tracking data. Building on that literature, we discuss the theoretical and pragmatic limitations in the data collection process of various tracking methods, with a special focus on mobile devices. As that section will reveal, there are numerous potential sources of errors at various stages in the data collection process, which warrant an investigation into biases in tracking data. We go on to show empirically that such biases exist, drawing on original data from a multimethod study comprising survey and tracking data. In order to establish the validity of data and method, we first replicate existing findings of biased self-assessments (Research Question [RQ] 1). Using the differences between participants who provided mobile and/or desktop tracking data, we then show a genuinely new type of bias, namely, a differential bias in self-reports of people willing to share mobile tracking data (RQ2). Finally, we assess the impact of this bias through a simulation exercise (RQ3), which builds on a realistic statistical model of perceived polarization to show how strong tracking bias will impact results.
Literature Review: Self-Report Bias, Direction, and Sources
A growing list of study designs aims to bypass the insufficient reliability of self-reports by directly capturing trace data of digital media usage through various means (Araujo, Wonneberger, Neijens, & de Vreese, 2017; Revilla, Ochoa, & Loewe, 2017; Scharkow, 2016; Vraga, Bode, & Troller-Renfree, 2016). The results show rather consistently that there are strong systematic biases present in self-reports across different devices, settings, and operationalizations. An early study that served to draw attention to the issues is Prior’s (2009) investigation of time spent on TV. By comparing survey-based self-assessments to Nielsen people meter data (which are generated from custom tracking devices on TVs; see Napoli, 2003), he shows that individuals on average overestimate their TV usage by a factor of 3, with younger respondents doing worse. Tapping into an earlier debate in political communication (Price & Zaller, 1993), the article suggests either using alternative methods for measuring exposure or instead focusing on deeper layers of processing: Instead of merely recording exposure, researchers should rely on measures of reception, which presuppose exposure but capture the resulting effects. Subsequent investigations support and even extend Prior’s pessimistic diagnosis. Studying the usage of cell phones for text messages and phone calls, Boase and Ling (2013) validated survey answers against a rarely available true baseline—the log data from mobile network operators. While the results confirm the existence of bias, the authors document cases of systematic underreporting in addition to overreporting. Regression across various sociodemographic variables shows few clear patterns, although males clearly tend to overestimate.
Applying the same approach to Internet tracking data, Scharkow (2016) used a large representative household sample and extended the analysis to include specific online platforms. His analysis confirmed an overall tendency for overestimation, along with low and heterogeneous correlations (.15–.57) between self-assessed and tracked time spent online, usage of social networking sites, video platforms, and auction sites. In an extension of this design, Araujo, Wonneberger, Neijens, and de Vreese (2017) included tracking data from Android tablets in addition to PCs and assessed the validity of both self-assessed recent and typical usage. In line with their expectations, higher Internet usage was correlated with lower accuracy of survey measures, whereas the answers given for typical usage were less biased than those for recent usage. Other methods have supported the conclusion of highly unreliable self-reports plagued with over- and underreporting, even though there does not seem to be a consensus on the causes yet. In a lab experiment, Jerit et al. (2016) confirmed both types of bias through manipulated exposure, while Vraga, Bode, and Troller-Renfree (2016) come to the same conclusion after using eye-tracking.
The newer literature also presents several suggestions for decreasing errors when using self-reports. Andersen, de Vreese, and Albæk (2016) test existing ways to measure exposure to specific programs, in particular the program list technique (Dilliplane, Goldman, & Mutz, 2013), where recipients check programs they watch regularly. Contending that such a binary measure of regular exposure is inadequate, the authors argue in favor of a dual measurement of both information channel (such as TV) and usage frequency, an approach they call “list-frequency technique.” Guess (2015) used tracking data from the browser-stored history to assess the performance of three different types of exposure questions: open-ended (participants name news sources from the previous 30 days in a text entry box), check-all (a list of sources is presented and participants mark those they used), and a forced-choice condition where each source had a mandatory yes or no answer. Of all three, open-ended responses were least biased, whereas the forced-choice condition incurred the largest error. Finally, Ohme, Albæk, and de Vreese (2016) assessed the reliability and feasibility of mobile-based daily surveys. They report a high reliability when comparing measurements of exposure to political news over the course of 15 days. However, reliabilities were lower for online sources (operationalized as social media) than for off-line sources (p. 148). There is clearly a solid amount of evidence on biased self-reports across a myriad of settings and methodological approaches. Some wordings do better than others, but in the end, they will still exhibit marked differences from nonreactive tracking measurements. Going deeper, things become much less clear. For example, we still lack a coherent theoretical explanation for self-report bias that is empirically well-supported. There are also mixed findings regarding the predictors of bias (Araujo et al., 2017; Scharkow, 2016). Most crucially, perhaps, is the lack of insight into the specific errors of the tracking methods that serve as the analysis baseline. We hence discuss theoretical considerations of tracking method reliability, before empirically assessing bias.
The Pitfalls of Tracking Data Collection
Despite its growing popularity, we posit too little attention has been dedicated to the specific potential error sources in tracking data, which is why we want to highlight some of them. 1 In general, the new sources of bias in tracking methods can be thought of as an extension of error types known from other kinds of data collection. Figure 1 shows a simplified schematic of the stages that constitute a tracking study, along with corresponding occurrences of bias. As in any study involving a subset of a population, the first important step is drawing a representative sample (1). However, the issue of sampling bias arises a second time, insofar as participation in a tracking study is dependent on the participant. If participants need to consciously opt in to the study, self-install software, and/or perform other actions in order to enable data collection, we may see a secondary sampling bias: The presence of tracking data is then contingent on participants’ willingness and ability to provide data. When combining data from different settings, such as tracking of mobile and desktop devices, this bias may additionally differ between the groups. The result is then a differential selection bias (2), where the makeup of one self-selected group, say mobile phone users, differs from the makeup of another group such as desktop PC users. Following the sampling stages (1 and 2) that may change the composition of the sample, additional errors may occur in the generation and collection of the data itself (3). On the one hand, technical issues may distort the collection. Other causes may lie within participants themselves, such as reactivity to the knowledge of being tracked. As is the case with sampling, these response biases may vary between subpopulations for which the data collection methodology differs. Finally, all three sources of bias (general sampling, tracking sampling, and response bias) will cumulatively propagate into any further analysis (4) done on the data.
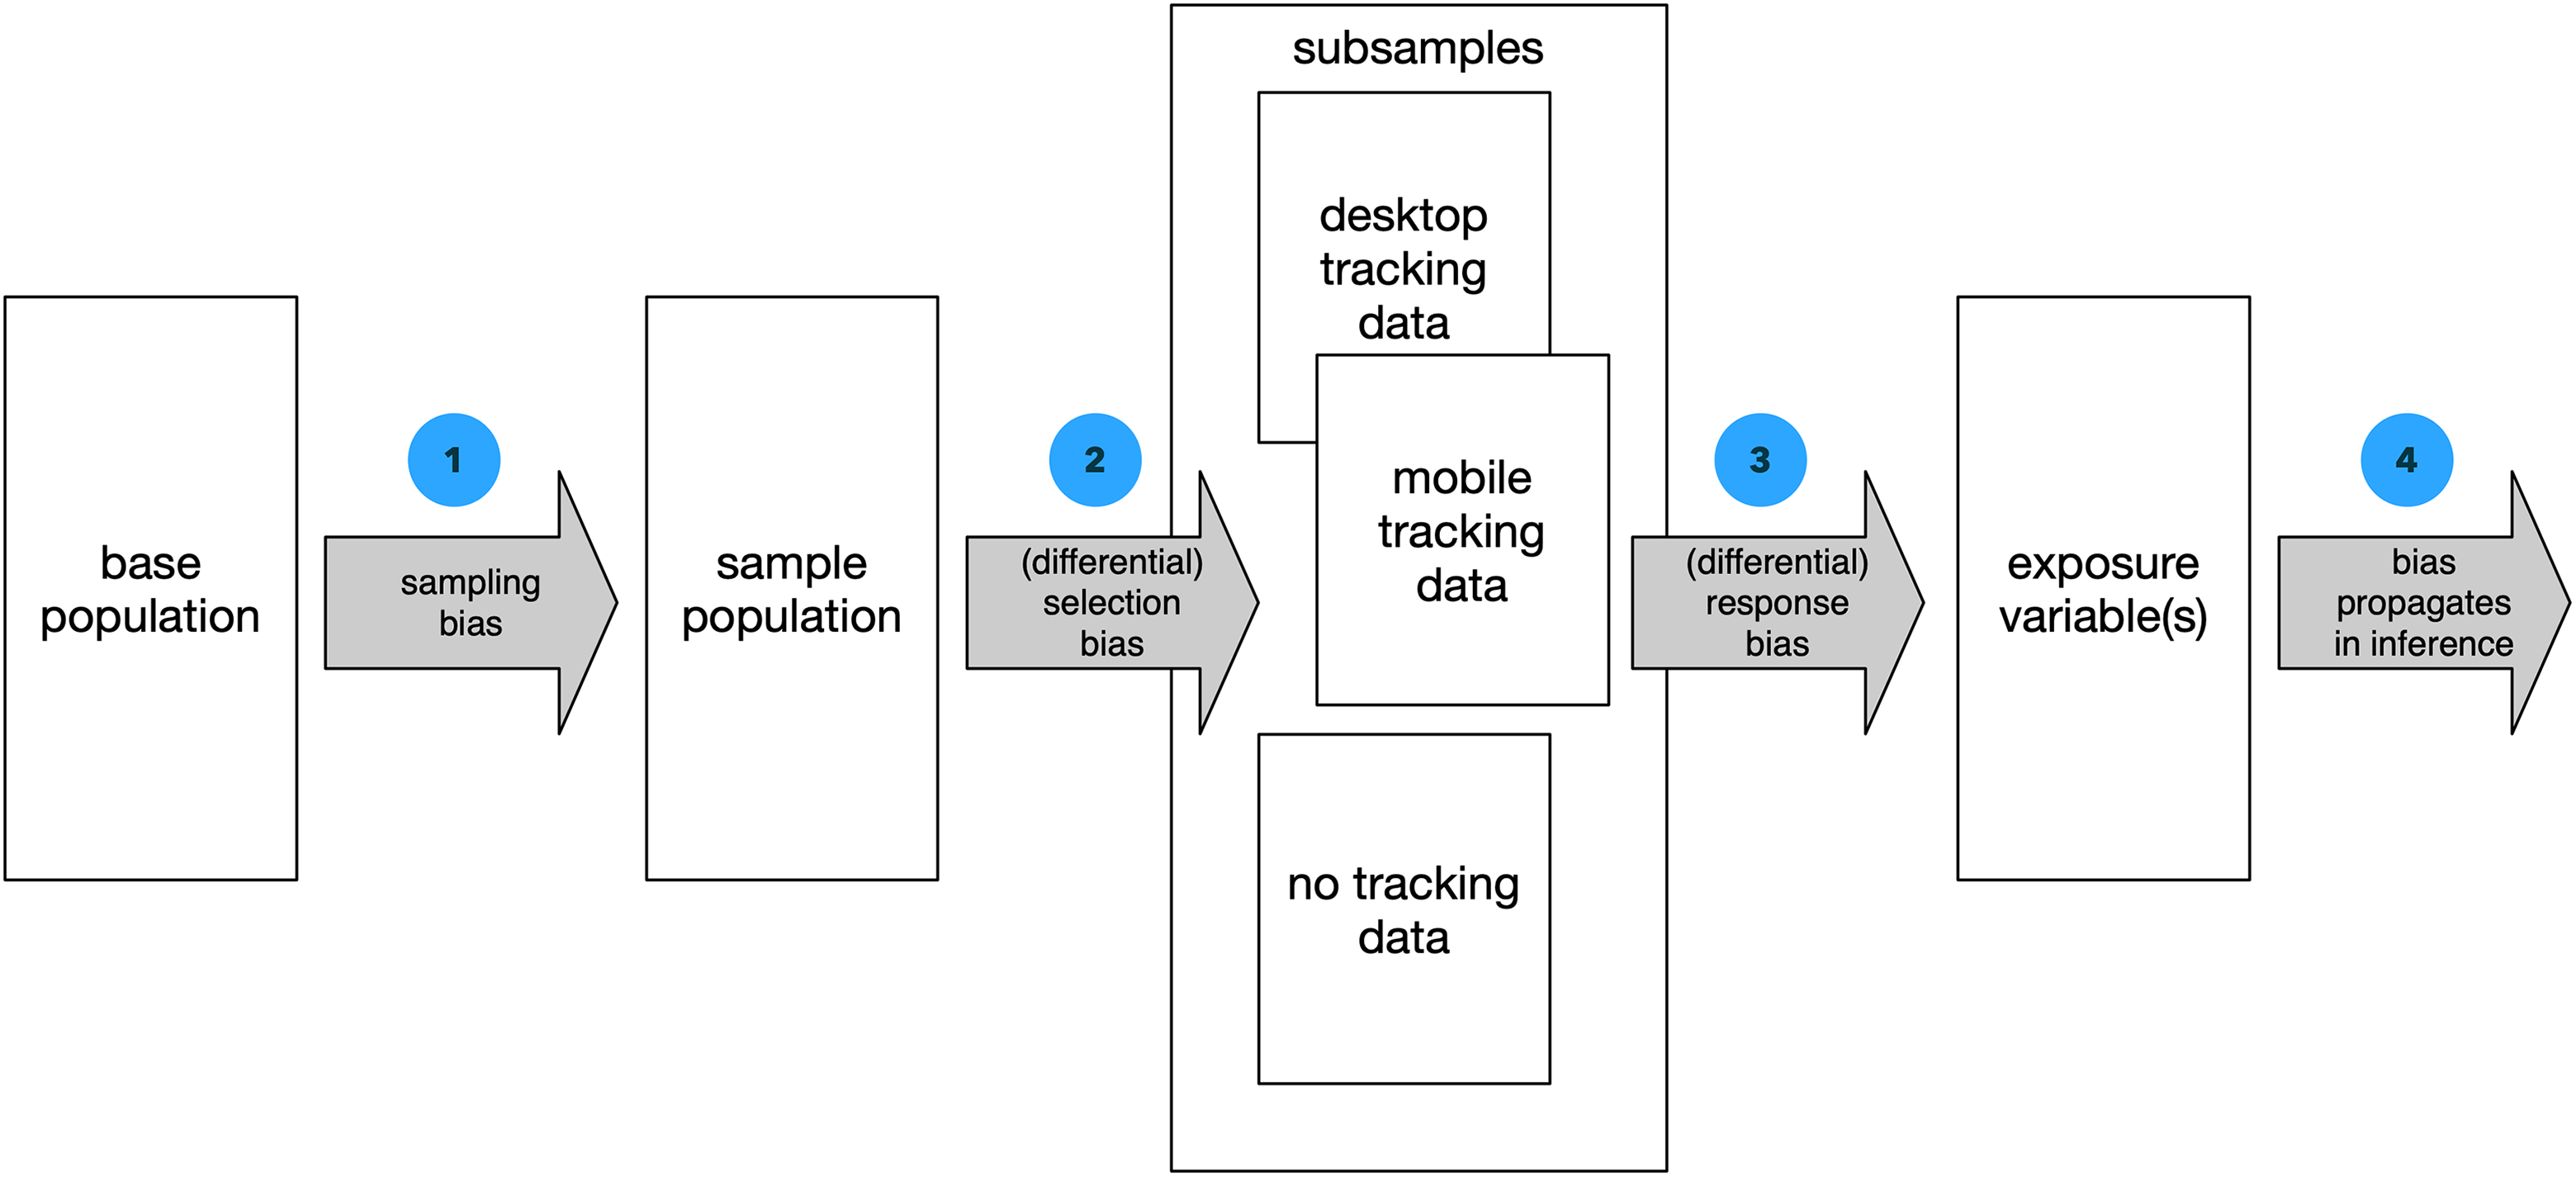
Error sources in tracking studies, simplified schema.
Limiting bias is possible by evading self-selection effects in sampling and tightly controlling technical error sources—but this requires close control over the overall study design. Researchers will need to be more involved in the conception and execution of tracking studies, which is complicated in particular by the evolution of mobile devices.
Scharkow (2016) considers mobile devices to be prohibitively heterogeneous targets, noting that “the sheer diversity of devices, applications and differences in user behavior make it impossible to capture a complex phenomenon like Internet use entirely using client logs.” p. 23 Although this statement might seem overly cautious, it is getting more and more accurate. Largely due to a substantial security and privacy-related effort of mobile operating system producers Google (Android) and Apple (iOS), access to usage data has become more and more restrictive. In general, there are three different ways of capturing digital device usage, each of which carries specific challenges.
Installing software on the device that records usage: This is a popular approach. The GfK SE media efficiency panel data used by Scharkow (2016) is produced by software running on desktop PCs. Araujo et al. (2017) also used this method for Android tablets. However, it does not work on iOS devices and has only limited application on newer Android devices.
Routing the devices’ Internet access through a special server that logs usage: This solution requires end users to configure their devices themselves, which can hinder uptake and increase mortality. Furthermore, there are significant limits to tracking precision: Encrypted connections (HTTPS) do contain the domain that was requested
2
—such as washingtonpost.com—but not the full path of the URL. In some cases, the encryption can be dropped by installing a special certificate on the device, but many modern apps (e.g., Facebook and Instagram) are resistant to this technique. In this setting where activity is merely recorded through URLs, page visit durations and app usage durations can furthermore only be approximated since the true point when they are closed does not necessarily generate records. Worse, there are subtle variations in the possible failure scenarios for this kind of tracking. For example, when Android devices are tracked via a custom Virtual Private Network (VPN) connection, that connection will be dropped automatically when the battery is low. At the same time, iOS devices can be tracked via proxies, but those have to be set up for every Internet connection (mobile and each Wi-Fi). Finally, more precise access to usage data may be gained by physically accessing devices in order to either extract existing log data or in order to tamper with its software.
3
Each of these technical limitations may introduce differential response biases at Stage 3 in Figure 1.
Measuring Bias in Self-Reports and Tracking
Objectively, measuring bias in a tracking method itself is inherently difficult, because we know that other benchmarks (surveys) carry error too. We therefore attack the problem in three stages: First, we assess the validity of our data and method. RQ1 is hence: Can we generally support existing findings of bias in self-reports with our sample and study design? RQ2 aims at the distinction between respondents providing desktop and mobile device data: Do we find systematic differences in the bias of self-reports between both groups? Do these differences appear because of different sociodemographic makeup of the groups (which would point to a sampling issue) or not (which would be an indicator of differences in behavior)? Finally (RQ3), using simulation, we explore an example model built from the data to show how bias in exposure measurements propagates into analyses of other variables. The analyses are made possible by a particular multimethod study design, which is presented first.
Study Design
The data used in this study were collected in integrated multimethod design combining cross-sectional and daily surveys as well as tracking data of the same sample (Stark, Magin, & Jürgens, 2017). We used a commercial access panel to recruit a quota sample of 459 participants who were the representatives of the German online population (14–69 years) regarding age, gender, education, and usage of Facebook (condition: having an account and using it at least once a week). Participation was incentivized through the access panel’s bonus point system, paying an equivalent of €1 per day plus a base amount of €3.5 for a total of roughly US$15. Descriptive statistics and question wordings can be found in the Online Appendix. An initial cross-sectional online survey assessed sociodemographics along with media usage. For Internet usage, respondents gave time estimates of usage on a “typical day” on an Ordinal Scale ranging from less than 1 hr to more than 6 hr per day in steps of on hour each. Usage of other sources was collected but is not considered further here. The main study module consisted of a daily online survey over the period of 14 days. On each of those days, participants were asked to list the two subjectively most important political issues of the respective day (open-ended). These issue mentions were coded manually afterward.
4
For both issue mentions per day, the respondents self-assessed five constructs related to opinion formation, among them the perceived political polarization (for the theoretical concept, see Yang et al., 2016). Those variables will be used in the assessment and simulation of bias toward the end of the article. In parallel to the 14-day longitudinal module, tracking data was collected from computers (PC and Mac), mobile phones, and tablets (Android and iOS) of participants. The installation of tracking software was optional, self-selected, and incentivized with additional bonus points with a value of approximately €3. Upon agreeing to take part, users received instructions for installing and setting up the software, with help available upon request. The technical tracking solution was provided and administrated by the market research company who in turn sourced it from the specialized supplier Wakoopa, which has since been bought by GfK (https://www.gfk.com/insights/press-release/gfk-drives-its-global-digitalization-through-acquisition-of-digital-panel-specialist-netquest/).
Overall, computers produced 2,098,299 records (URLs) from 411 of the 459 total users (the rest either failed to install the software properly or did not use their devices at all), whereas mobile devices generated 266,594 records (URLs and App usage) from 163 users. For each of those requested URLs, the tracking software reported an active duration in seconds, which reflects how long a user was actively exposed to the content. 5 Further pruning was done for validity and completeness of the survey part of the data set: A total of 354 participants from the entire sample had at least 5 days of survey responses with valid political issues; other data sets were dropped. In the initial recruitment, 1,818 individuals were contacted, resulting in an American Association for Public Opinion Research (AAPOR) response rate type 1 of 25% (recruitment) and 19% (ready to analyze). The resulting working sample of 354 participants showed no significant skew in terms of the sampling quota and gave a total of 8,866 valid issue-specific answers out of a theoretical maximum of 9,912 (354 participants × 14 days × 2 issues per day). Corresponding to the possible combination of devices, the tracking data yielded four distinct groups: 73 participants produced no tracking data whatsoever, 243 had at least one URL recorded from a PC but no mobile device, 25 participants sent at least one URL from a mobile device but had no PC data, and 13 sent data from both types of devices. While the number of individuals in these groups is rather low, each of them provided up to 14 days of tracking measurements, yielding a data set of adequate size.
Assessing Tracking Bias
Discrepancy Between Self-Reports and Tracking Data (RQ1)
Following prior studies, we first assess the discrepancy between self-assessment and tracking data by computing the difference between both values. Since our study design is based on days as the basic time unit, we aggregated both desktop usage times and mobile usage times into one daily tracking sum per user. The resulting scores, in the hypothetical absence of any technical measurement errors, reflect the precise amount of time a participant spent on digital devices on a particular day.
Self-assessment of time spent online originates from the initial cross-sectional survey, where Internet usage times for a typical day were collected on ordinal scales. Since those scales consist of hourly intervals, we transformed the answers into metric records centered on intervals (0 to under 1 hr = 0.5 hr, 1 to under 2 hr = 1.5 hr, etc.). The deviation from actual tracking data can then be calculated by subtracting the tracking estimate from the subjective estimate and further decreasing that number by 0.5 to give a distance to the bin itself.
In line with previous results, we find significant differences between tracking and self-reports of Internet usage (mean = .85, median = .68, SD = 2.3). Whereas the average amount of bias is lower than one might expect, this is due to the fact that both over- and underreporting are present.
Figure 2 shows boxplots 6 of the relation between self-reports (x-axis) and tracking data (y-axis). Panel A shows data for the average daily Internet use per user; the boxplots depict variation between users. Panel B instead uses the un-aggregated days, showing within-user variation and allowing inferences about the general volatility of measurements day-to-day. The dashed line in each panel represents the perfect precision, that is, the points where both measurements match. Cases above the dashed line have more tracked time than expected (underreporting time spent). Consistent with Prior (2009), Scharkow (2016), and Araujo et al. (2017), we see that the vast majority of people who say they are online for more than 2 hr do actually spend much less time. The error also grows along with peoples’ own estimates: Self-declared heavy users overreport more than moderate users.
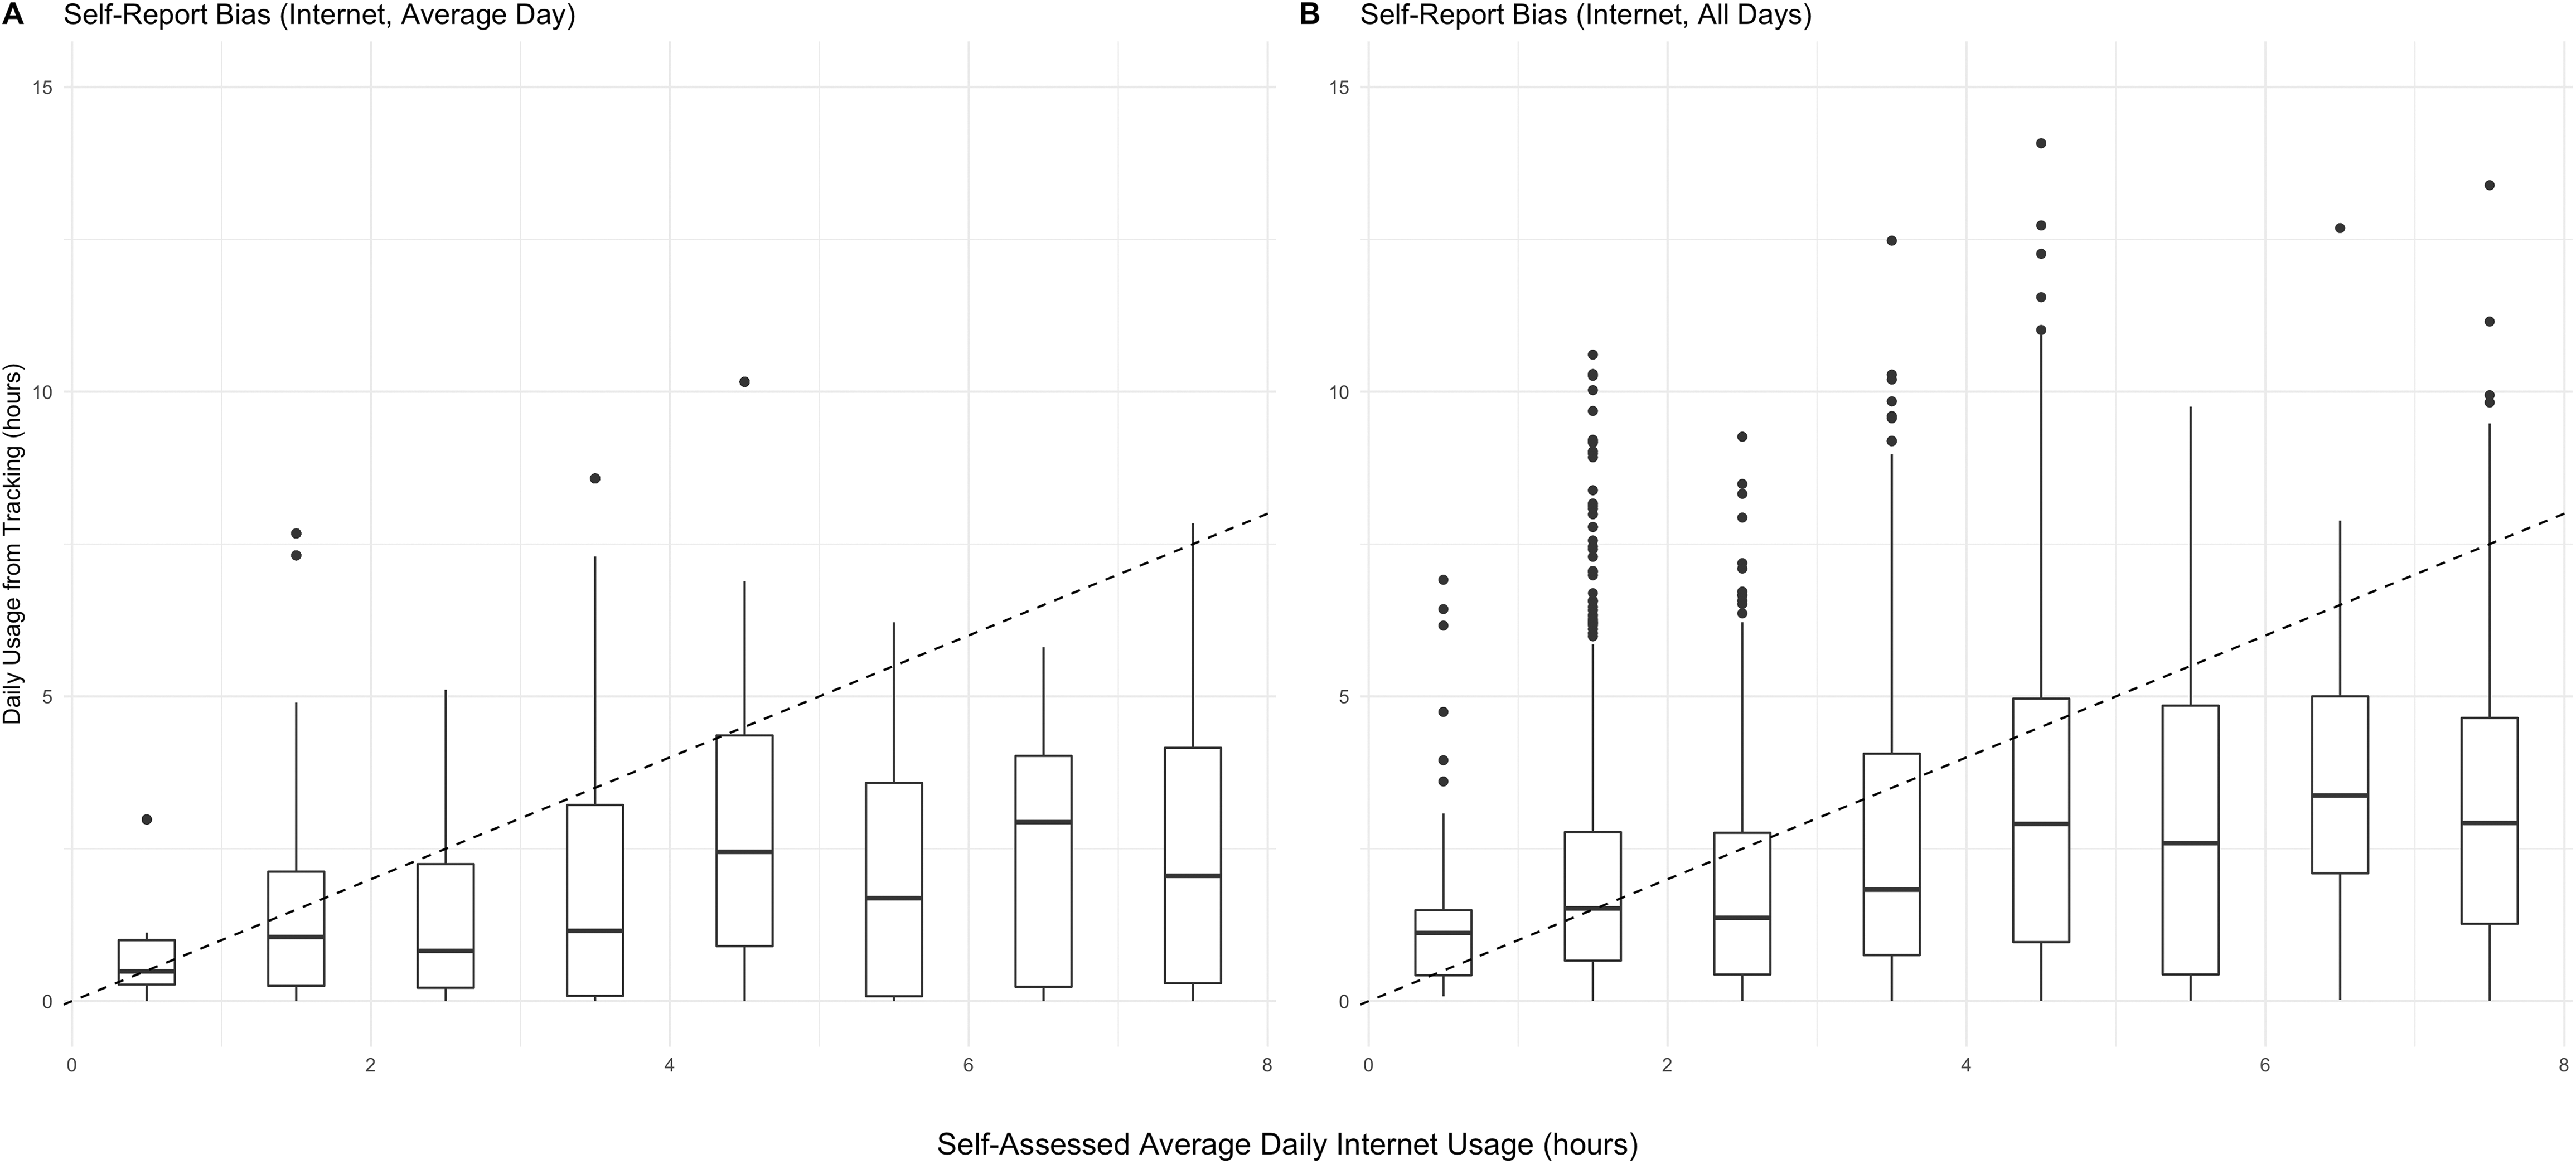
Self-report bias of Internet usage.
Mobile Tracking: Self-Selection or Response Bias? (RQ2)
One particularly interesting aspect of our design is the integration of tracking across both PCs and mobile devices. The sample contains subsets of users who only agreed to desktop tracking, only to mobile or both. Any systematic differences will point to either a differential selection effect (Stage 2 in the tracking study schematic in Figure 1) or a differential response effect (Stage 3). The latter might occur when participants perceive mobile device tracking to be more invasive—for example, due to the fact that mobile devices are more personal (as opposed to computers that might be shared) and used in many personal contexts (see works on everyday information seeking, e.g., Savolainen, 1995).
Figure 3 depicts the overestimation of Internet usage in hours (self-report in survey minus actual usage time), by availability of tracking data from devices; the dashed line again denotes an unbiased perfect match between survey answer and tracking data. The primary visible trend is the aforementioned relation between the expected usage time and the magnitude of the error. The longer people think they use the Internet (x-axis), the more do they tend to overestimate their usage. Participants who don’t think they use the Internet much at all (leftmost bin), on the other hand, exhibit negative bias, meaning that they underestimate actual time spent. The result is an inflation of distance from the center.
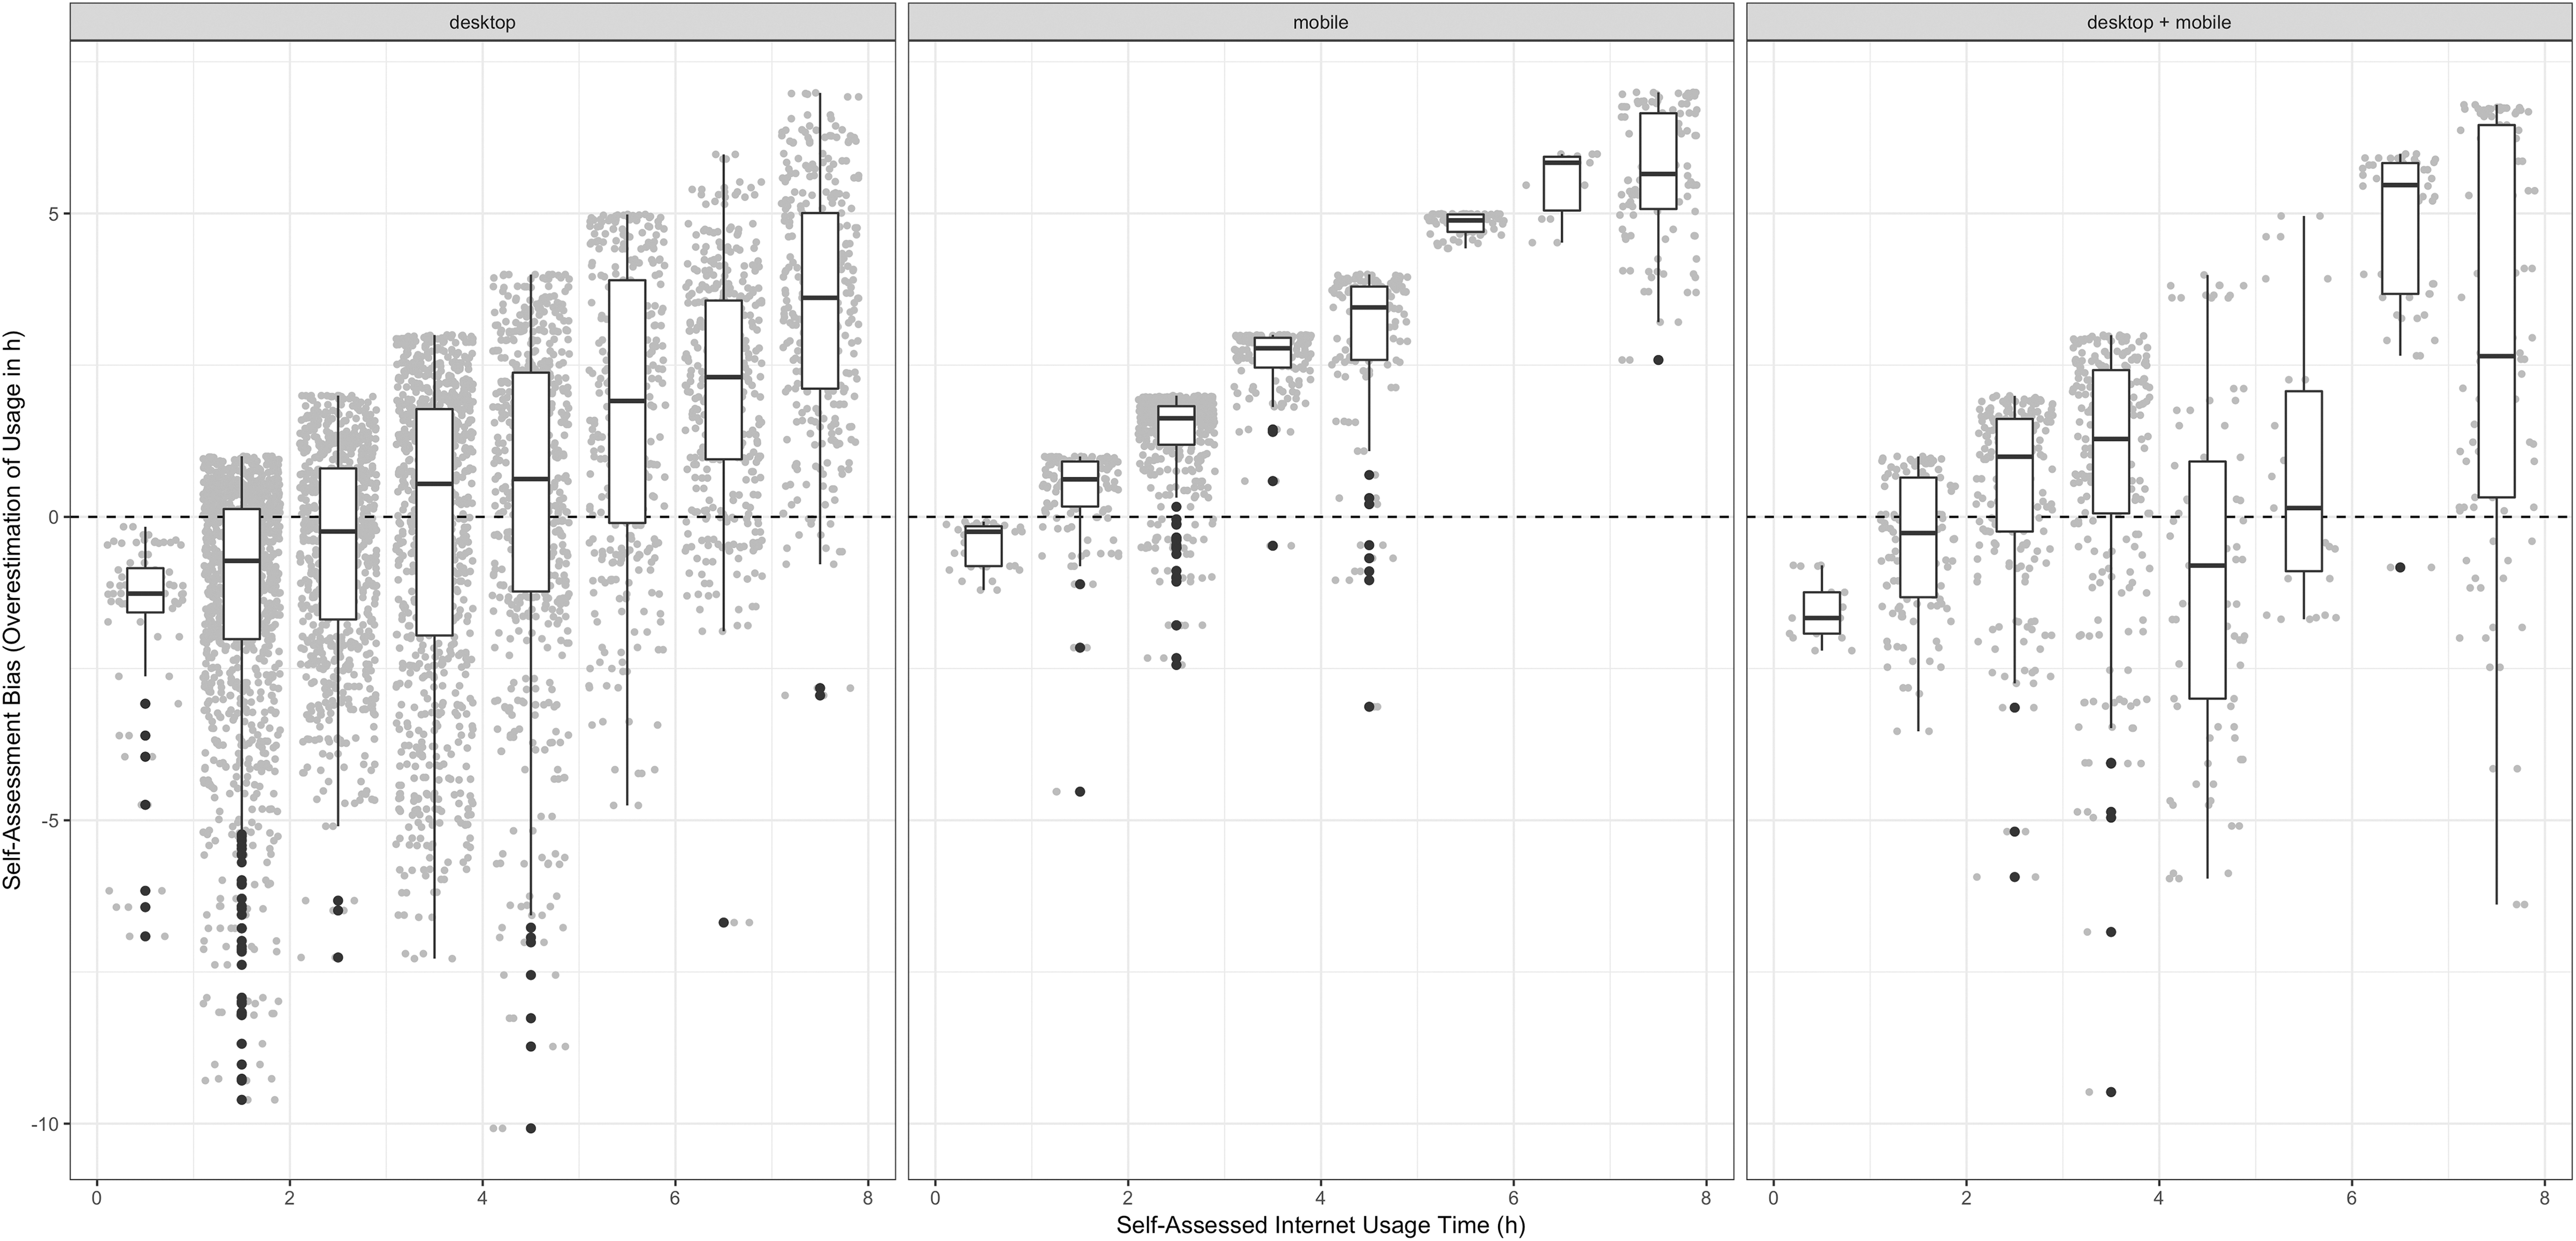
Self-report bias by availability of device data.
A second visible phenomenon is the difference between the desktop and mobile tracking groups. Users with only mobile data have a higher average bias than both other groups. 7 Even though they may in fact spend more time online (e.g., due to the simple availability of the device), they still exaggerate this difference, resulting in an even stronger overestimation. This difference does support our assumption of second-order bias through sampling or response errors. The mixed group seems to fall in between both, but a clear assessment is unfortunately prevented by the low number of measurements and high variance.
We can further estimate the magnitude of this effect and reason about the underlying mechanisms through a proper model (similar to Scharkow, 2016, and Araujo et al., 2017)—with self-assessment error as the dependent variable and various sociodemographic variables as predictors. Table 1 shows effect estimates with credible intervals from a Bayesian linear mixed model predicting self-assessment bias on an average day. The model explains daily bias as a function of the individual-level variables: age, sex, education, income, self-assessed Internet usage, and tracking type (dummy-coded with desktop as baseline) while accounting for group-level random intercepts within participants, and days. 8 As expected, the number of hours spent online is a major predictor of bias—this represents the roughly linear trend seen in Figure 3. The second important factor is the presence of mobile tracking data, while sociodemographic variables play no significant role. Hence, we see that even when controlling for potential differences in the demographic makeup of the groups of desktop and mobile device users, there still remains a significant difference in the strength of their self-assessment bias.
Predictors of Bias in Self-Reports (Bayesian Mixed Model).
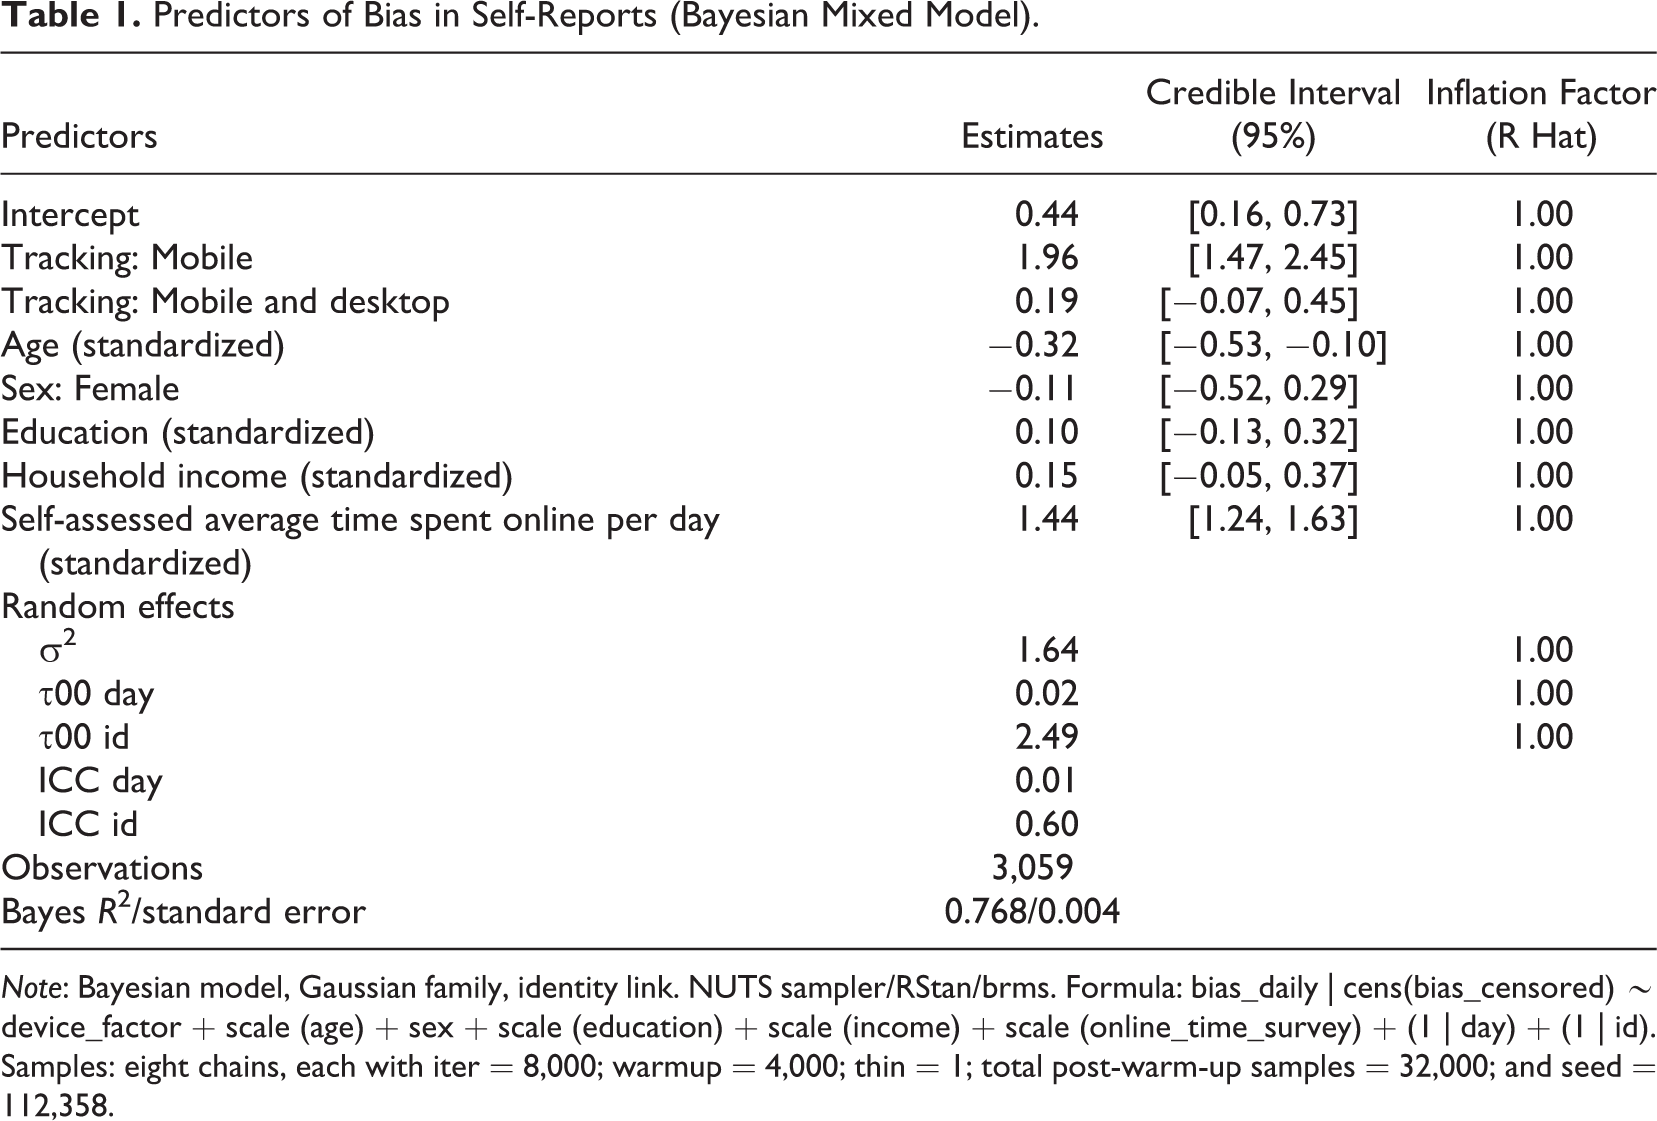
Note: Bayesian model, Gaussian family, identity link. NUTS sampler/RStan/brms. Formula: bias_daily | cens(bias_censored) ∼ device_factor + scale (age) + sex + scale (education) + scale (income) + scale (online_time_survey) + (1 | day) + (1 | id). Samples: eight chains, each with iter = 8,000; warmup = 4,000; thin = 1; total post-warm-up samples = 32,000; and seed = 112,358.
There are three possible interpretations for this, all of them troubling: First, there could be technical issues with the data collection. A possible indicator is the strikingly differing variance: Mobile device usage times have much lower variance, which might, for example, imply that they are artificially constrained (such as by the automatic lock function of smartphones). Second, people who participate in invasive tracking might have an extremely exaggerated impression of their own habits—even more so that “ordinary” respondents. If true, this would mean that mobile tracking is not any more biased than other tracking, only that mobile phone users overestimate how much they use the devices—possibly because they handle their phones so often. Finally, knowledge of the recording of their activity could motivate participants to suppress their usual behavior, leading to unnaturally low tallies. In any case, we find that the issue at hand seems to be caused not by distorted sampling (at least not along the controlled variables) but rather by some inherent difference in either the tracking method or differing user behavior.
Consequences of Tracking Bias: An Exploration (RQ3)
The fact that both self-reports and tracking data suffer from distortions leads to a pressing need for methods that can mitigate any or both of those issues. While we have high hopes for future methodological advances, there are existing strategies that can help to control harmful interference. Tracking studies should try to explicitly incorporate different device types and model them as a “canary” variable in the analysis. If an analysis shows a strong effect from any of the devices, then there is likely either a methodologically induced bias or a source of response bias that should be addressed. The strength of this device effect can be interpreted as an indicator of the variance and hence uncertainty inherent to the tracking method. The arguably easiest way to do this is by using multilevel models, which allow for nested predictors that make efficient use of available information (Gelman & Hill, 2007).
While a full investigation into statistical consequences and mitigation of the differential bias we identified goes beyond the scope of this article, we still want to provide at least an outlook of these issues. We therefore conclude by building a realistic but simple model from the data used above and then simulate a higher level of bias in order to show its impact on results. The model uses sociodemographic variables, exposure measurements, and participants’ attitude toward an issue to explain “perceived polarization.” Perceived polarization (see Yang et al., 2016) is a concept that captures peoples’ impression of how deeply a society is split regarding an issue—how strongly the different camps oppose each other. In contrast to other forms of polarization (such as ideological or affective polarization), and with media coverage being an important source for people’s assessment of the state of public opinion, perceived polarization is thought to be directly malleable by media effects. A comparative analysis of 10 countries (Yang et al., 2016.) supports this assumption, revealing a strong effect from online (but not off-line) news. Drawing on and extending this idea, one might assume that using the Internet in general harbors the same potential, since much online activity is spent on sites that include social network elements that are susceptible to amplifying perceptions of differences (Stark et al., 2017). We therefore build models that use the base variables from the original study (Yang et al., 2016) while, for the purpose of this article, replacing news sources with Internet usage measures.
Using the “authentic” base model, we can simulate the effects of strong differential bias on the results by selectively increasing the existing overestimation of mobile device users through a higher self-assessed time. 9 Table 2 shows three different analyses: Model 0, which is computed using the authentic, unchanged data; Model 1, which uses the data with an artificially increased bias for mobile device users but no information about the type of tracking data used; and Model 2, which still uses simulated data but contains dummy coded variables for mobile device tracking and mobile and computer tracking. Comparing the three, we can see that most predictors do not change dramatically. However, the role of tracking data is portrayed differently across the three models (see highlighted row): In the actual data (Model 0), there is no strong relationship between online time tracked and perceived polarization (confidence interval (CI) crosses 0). In Model 1, where the self-assessment was inflated for mobile users, there is a strong, positive link between the two variables. Once we introduce the device factor, however, this exaggerated estimator shrinks to almost its realistic level, whereas we see a very large estimate for the mobile dummy variable. Thus, the “canary” device variable helped catch the hypothetical increased differential bias. Note that, in this simple simulation exercise, the exposure variables and the other predictors are not strongly correlated, resulting in a relatively robust behavior of the regression models. Were there stronger interrelations (which we did not simulate for the sake of the clarity of this demonstration), then effect estimates would change more.
Bayesian Models for Bias Simulation.

Note: Bayesian model, Gaussian family, identity link. NUTS sampler/RStan/brms. Formula: p.polarization ∼ device_factor + scale (age) + sex + scale (education) + scale (income) + scale (online_time_survey) + scale (online_time_tracking_daily) + (1 | day) + (1 | issue) [Model 1 omits device_factor]. Samples: four chains, each with iter = 2,000; warmup = 1,000; thin = 1; total post-warmup samples = 4,000; and seed = 112,358. Convergence unproblematic, all R hat = 1.00.
Conclusions
This article is concerned with systematic bias in self-reports and tracking data on media exposure. Using a multimethod study design, we replicated prior studies’ findings to show that self-reports are on average strongly exaggerated. Respondents tend to diverge from the center, with light users underestimating and heavy users overestimating the duration. By using differences in the groups of participants supplying data from computer and mobile devices, we were further able to show that there is a systematic second-order bias: Those participants who are willing to share mobile device data exhibit significantly higher overreporting than those who do not.
There are important conclusions to be drawn from this reassessment of the state of combining tracking and survey data. First and foremost, it is crucial to admit that apart from very few exceptions (such as Boase & Ling, 2013, or Dunn, Gupta, Gerber, & Spatscheck, 2012), tracking data should not by default be considered an unbiased source of “true” media exposure. Second, our findings of differential bias depending on the device type suggest that we cannot treat the results from different devices equally. In essence, tracking methods might result in exchanging lower measurement bias (than surveys) against a fragmentation of the meaning, where tracking results from separate devices incur different biases.
What, then, is a good way of attacking the problem of biased exposure measurements, if no one method proves faultless? Recapitulating the state of the literature, we see three options that could lead to increasingly valid, well-understood measurements:
Development of improved tracking tools. Today’s shortcomings of mobile device tracking not only arise from the design of smartphone operating systems but also from the opaque nature of proprietary tracking solutions and restricted access to study participants. With greater knowledge of and control over technical errors, along with direct access to recruitment, researchers will be able to counteract visible and reveal previously hidden error sources. A remaining challenge lies in the “black box” of platforms and their algorithms (Jürgens & Stark, 2017). Clearly, the limitations to scholarly data collection are a serious impediment—they limit the ability to understand platform effects and add further methodological uncertainty (Bachl, 2018).
Moving toward more precise survey methods, including high-frequency longitudinal designs, source- and issue-specific questions, as done in our study, along with measures of reception rather than exposure (Price & Zaller, 1993).
Combining data sources. Joining different methods, as we have shown, ultimately requires modeling their specific characteristics if one wants to reduce the resulting overall error. An especially interesting approach for doing this is the experimental assessment of bias by Jerit et al. (2016). Study designs can contain interventions, whose effects in turn are measured through tracking data. By compelling participants to use a particular stimulus and then gauging over- and underreporting, it may be possible to create a benchmark for the rest of the study.
Finally, the methodological discussion cannot and should not be detached from the crucial ethical considerations underlying not only scientific but also commercial tracking of user behavior. It is clear that advances in one area are directly related to the development of the other, albeit with both beneficial and harmful consequences.
This article highlighted theoretical and empirical concerns about the use of new methods for measuring media exposure. Rather than being a panacea, tracking data itself is subject to errors, many of which are not well understood today. Even though our results reinforce earlier warnings, the fact that different data sources are available today will contribute to a better understanding of problems that existed all along. We hope for future research to unveil more of the cognitive and technical mechanisms at work.
Data Availability
The authors are committed to transparent and replicable research. Replication data may be obtained by request to the primary author, Pascal Jürgens (
Software Information
All final calculations were performed in R (Version 3.5.1 on macOS) with the libraries brms (function brm for building Bayesian models via rstan, function waic for computing the WAIC, and function compare_ic for assessing incremental model fit, Version 2.6.0), cowplot (function plot_grid for creating enumerated multiplot figures, Version 0.9.3), dplyr (function group_by, Version 0.7.8), ggplot2 (function ggplot for plotting, Version 3.1.0), sjPlot (function tab_model for model result tables, Version 2.6.1), and rstan (used via brms, Version 2.18.2). Preceding the analysis, the raw tracking data was preprocessed with a custom python script in order to aggregate usage times by user and merge them into the R data set.
Supplemental Material
Supplemental Material, Jurgens_online_supplement - Two Half-Truths Make a Whole? On Bias in Self-Reports and Tracking Data
Supplemental Material, Jurgens_online_supplement for Two Half-Truths Make a Whole? On Bias in Self-Reports and Tracking Data by Pascal Jürgens, Birgit Stark and Melanie Magin in Social Science Computer Review
Footnotes
Declaration of Conflicting Interests
The author(s) declared no potential conflicts of interest with respect to the research, authorship, and/or publication of this article.
Funding
The author(s) disclosed receipt of the following financial support for the research, authorship, and/or publication of this article: The study was co-funded by the Landesmedienanstalt Nordrhein-Westfalen (LfM), a German media regulation body, and by the Research Unit Media Convergence, University of Mainz.
Supplemental Material
Supplemental material for this article is available online.
Notes
References
Supplementary Material
Please find the following supplemental material available below.
For Open Access articles published under a Creative Commons License, all supplemental material carries the same license as the article it is associated with.
For non-Open Access articles published, all supplemental material carries a non-exclusive license, and permission requests for re-use of supplemental material or any part of supplemental material shall be sent directly to the copyright owner as specified in the copyright notice associated with the article.