
Abstract
Little prior research on computer or smartphone interruptive notifications (INs) has examined psychological constructs associated with their adverse effects. We examined several mental health constructs in relation to disruptions in various daily activities resulting from INs. A total of 316 undergraduate students completed a web survey querying severity of depression, anxiety, boredom proneness, emotional distress tolerance, and frequency of IN-related activity disruptions. Bivariate correlations revealed that IN-related activity disruptions were positively related to levels of depression, anxiety, and boredom proneness. Using structural equation modeling, boredom proneness mediated relations between depression severity and IN-related disruptions. Results are discussed within the context of theories on cognitive resource limitations and excessive Internet use.
Experiencing interruptions when working on tasks can be distracting and results in more required time for task completion (Bailey & Konstan, 2006; Czerwinski, Horvitz, & Wilhite, 2004). Research has investigated work performance results from interruptive personal computer notifications (e.g., Bailey & Konstan, 2006; Iqbal & Bailey, 2008). However, few studies have examined the impact of interruptive smartphone notifications. This issue is important because in modern times most people have their smartphones constantly accessible (Poushter, Bishop, & Chwe, 2018), resulting in notifications frequently interrupting tasks at home and work (Kushlev, Proulx, & Dunn, 2016). Furthermore, smartphones are the preferred way for receiving electronic device notifications (Weber, Voit, Kratzer, & Henze, 2016). Yet, little inquiry has investigated individual differences in adverse effects from notifications.
Interruptive notifications (INs), also known as “pop-up notifications,” are information alerts that intend to actively draw away one’s attention to inform the individual of a new event or information (Paul, Komlodi, & Lutters, 2015). Research has examined effects of INs on work performance. For example, using a controlled experiment, Bailey and Konstan (2006) found that computer INs resulted in more time needed to complete primary tasks, more errors committed, and greater associated annoyance and anxiety. Additionally, increased smartphone INs were found to impair attention and result in hyperactivity symptoms (Kushlev et al., 2016; Stothart, Mitchum, & Yehnert, 2015). In fact, the relationship between smartphone use and productivity has been described as an inverted U shape, whereby mild and healthier levels of use can boost productivity, while overuse (such as from interacting with too many distracting INs) can harm productivity (Montag & Diefenbach, 2018; Montag, Walla, & Koller, 2016).
However, not all INs are perceived as negative or aversive. More favorably rated INs were those perceived as more relevant (rather than of general interest; Iqbal & Bailey, 2008), such as INs about work while working (Ardissono & Bosio, 2011), and those of greater urgency (Paul et al., 2015; Vastenburg, Keyson, & de Ridder, 2009). Additionally, social (rather than nonsocial) INs are rated more favorably (Paul, Komlodi, & Lutters, 2011; Paul et al., 2015).
Yet few studies have examined individual differences associated with more adverse consequences of INs, especially psychological differences (Walter, Dunsmuir, & Westbrook, 2015). The scant available data demonstrate that decreased openness to experience and decreased need for personal structure resulted in slower completion of interrupted tasks (Mark, Gudith, & Kocke, 2008). As indicated above, higher inattention and hyperactivity were associated with activity disruptions from smartphone INs (Kushlev et al., 2016). Furthermore, increased INs can result in adverse effects in romantic relationships between partners, driving worse relationship perceptions, more conflict over technology usage and can consequently drive less positive face-to-face interactions (McDaniel & Drouin, 2019).
We focus here on INs from one’s smartphone or smartwatch. Several older papers focused on computer INs (Ardissono & Bosio, 2011; Bailey & Konstan, 2006; Bogunovich & Salvucci, 2011; Iqbal & Bailey, 2008; Paul et al., 2011). However, currently most people own a smartphone that is more frequently available to them. In fact, the mean rate of smartphone ownership in adults across countries is 59% and is higher in advanced economies (72%; Poushter et al., 2018). And, smartphones are used for many purposes in everyday life (Contractor, Weiss, & Elhai, 2019; van Deursen, Bolle, Hegner, & Kommers, 2015).
Relevant to INs and their adverse impact is problematic smartphone use (PSU), as IN’s negative consequences are central to PSU. PSU involves problems in everyday life as a consequence of mobile phone overuse such as social, occupational, or school impairment (Billieux, Maurage, Lopez-Fernandez, Kuss, & Griffiths, 2015; Herrero, Urueña, Torres, & Hidalgo, 2017). PSU is distinguished from healthy smartphone use in that PSU symptoms resemble substance use disorder symptom criteria. For example, PSU can involve psychological withdrawal (when unable to use one’s phone such as due to battery drain), tolerance (increased use to attain the same satisfaction level), dangerous use (e.g., while driving), and relationship interference (De-Sola Gutierrez, Rodriguez de Fonseca, & Rubio, 2016). We should also note that PSU is sometimes referred to by alternative terms in the literature such as “excessive smartphone use,” “smartphone addiction,” and “smartphone use disorder” (Kardefelt-Winther, 2014; Lachmann et al., 2018). It should also be emphasized that at the present time, PSU is not formally classified as a diagnosis in medical or mental health diagnostic manuals, nor is it a commonly accepted “addictive disorder” in the scientific literature (Panova & Carbonell, 2018). Yet, Internet gaming disorder was recently included in International Classification of Diseases, eleventh revision as a formal diagnosis (World Health Organization, 2018), which could signal other forms of excessive technology use being similarly classified in the future.
PSU is relevant to INs. The gratification experienced from receiving smartphone INs is positively reinforcing, leading to increased and habitual phone checking behavior for more notifications (Oulasvirta, Rattenbury, Ma, & Raita, 2012). Furthermore, habitual smartphone use can lead to PSU (Oulasvirta et al., 2012; van Deursen et al., 2015). In fact, Duke and Montag (2017) discovered that more smartphone INs correlated with higher PSU and lower work productivity.
Despite little research on psychological constructs related to adverse consequences of INs, such constructs are related to PSU severity. In fact, adverse consequences of INs are fundamental to PSU (e.g., social and occupational impairment, dangerous use by responding to INs when driving or crossing intersections; Billieux et al., 2015; De-Sola Gutierrez et al., 2016). Psychological constructs related to PSU may also relate to adverse consequences from INs.
Most prior research finds PSU severity associated with higher levels of depression and anxiety symptoms (reviewed in Elhai, Dvorak, Levine, & Hall, 2017; Elhai, Levine, & Hall, 2019; Thomee, 2018; Vahedi & Saiphoo, 2018). Newer studies find PSU severity related to decreased ability to regulate emotion (Elhai, Levine, Dvorak, & Hall, 2016; Fırat et al., 2018; Gül et al., 2019). Emotion regulation is a psychological mechanism by which individuals effect the emotions they experience and conditions under which they are expressed (Gross, 1998a, 1998b). Poor emotion regulation skill is associated with mental health problems such as depression and anxiety (reviewed in Aldao, Nolen-Hoeksema, & Schweizer, 2010; Tull & Aldao, 2015). A related construct is distress tolerance, involving the ability to bear negative emotion (Leyro, Zvolensky, & Bernstein, 2010; Simons & Gaher, 2005). Distress tolerance is negatively correlated with PSU severity and mediated relations between anxiety and PSU severity (Elhai, Levine, O’Brien, & Armour, 2018).
Finally, boredom proneness is relevant to PSU and IN consequences. Boredom proneness is a trait-based tendency to experience boredom (Mercer-Lynn, Bar, & Eastwood, 2014), involving attentional and disinhibition difficulties, and is connected with anxiety and depression (Struk, Carriere, Cheyne, & Danckert, 2017). Boredom proneness is related to PSU severity (Elhai, Vasquez, Lustgarten, Levine, & Hall, 2018; Lepp, Barkley, & Li, 2017) as well as problematic Internet use (PIU) in general (Skues, Williams, Oldmeadow, & Wise, 2016; Wegmann, Ostendorf, & Brand, 2018). One study found that boredom proneness mediated relations between both depression and anxiety with PSU severity (Elhai, Vasquez, et al., 2018).
Aims
Depression and anxiety are related to PSU severity. Distress tolerance and boredom proneness were recently found to mediate these relationships. Because adverse consequences of INs are central to PSU, these mental health constructs are reasonable to investigate in relation to IN’s consequences. Our aim was to test a research model exploring distress tolerance and boredom proneness as mediators between both depression and anxiety with adverse consequences from INs. We measured adverse IN consequences by self-reported frequency of resulting disruptions in various activities from participants’ daily lives.
Theory
We draw on several theories to conceptualize our study. First, cognitive models can explain why INs interfere with daily activities. For example, the limited capacity model of mediated message processing (LCM; Lang, 2000) suggests that people have finite cognitive resources in processing information. Increased resource demand from media and incoming information will therefore result in worse task performance. This model has been supported for many years across the literature (reviewed in Fisher, Keene, Huskey, & Weber, 2018). Thus, INs can interfere with task performance needed to engage in daily activities.
Furthermore, the threaded cognition model (TCM; Salvucci & Taatgen, 2008) is also relevant. This model suggests that people have cognitive, perceptual, and motor resource “threads” assigned to different cognitive tasks. However, a task may switch threads during execution, resulting in switching costs in task productivity. Alternatively, two competing tasks from the same thread may decrease productivity. For example, INs representing one thread (cognitive, e.g., reading an incoming IN) may conflict and interfere with daily activities of that same thread (cognitive, e.g., reading study materials). TCM has been supported in several studies on interruptions (e.g., Örün & Akbulut, 2019; Wilson, Farrell, Visser, & Loft, 2018).
Theory on flow experiences is also pertinent here. The state of “flow” has been described as the experience individuals have when fully consumed by specific tasks in which they are engaged, losing track of time and space around them, and being more productive and happy in the moment (Csikszentmihályi, 2013). On the one hand, using a smartphone could result in a flow experience from the pleasurable features of the phone with which the individual is interacting. However, when an individual attempts to work on specific tasks (e.g., work, schoolwork), smartphone INs can disrupt one’s flow state previously experienced during the task, making the task less enjoyable and more difficult to complete (Montag & Diefenbach, 2018). Even using one’s smartphone simply as a clock or alarm to observe the time can induce additional unplanned smartphone interactions and thus can result in disruptions in activities (Montag, Kannen, et al., 2015).
Also relevant is theory on how PIU and PSU develop. The Interaction of Person-Affect-Cognitive-Execution model (I-PACE; Brand, Laier, & Young, 2014; Brand, Young, Laier, Wolfling, & Potenza, 2016) proposes that PIU is influenced by personal factors, which includes genomic, biological, temperament, cognition, psychopathology, and Internet use motivations. I-PACE also proposes that PIU is influenced by affective and cognitive reactions such as Internet use beliefs, cognitive and attention bias, disinhibition, coping, and craving. Importantly, in I-PACE, affective and cognitive reaction variables are theorized as intermediate variables or mechanisms accounting for relationships between personal factors and PIU. I-PACE has been supported in numerous studies modeling PIU/PSU (e.g., Dempsey, O’Brien, Tiamiyu, & Elhai, 2019; Lemenager et al., 2018; Oberst, Wegmann, Stodt, Brand, & Chamarro, 2017).
Hypotheses
Boredom drives people to use their smartphones in order to relieve their boredom (Wegmann et al., 2018). Boredom proneness correlates with PSU (Elhai, Vasquez, et al., 2018; Lepp et al., 2017) and PIU severity (Wegmann et al., 2018). Boredom proneness should correlate with increased IN-related activity disruption, which is an important aspect of PSU (Billieux et al., 2015; De-Sola Gutierrez et al., 2016). In I-PACE, boredom proneness would represent an attentional bias cognitive response related to PIU. In LCM and TCM, boredom proneness could represent an individual difference increasing the likelihood that greater cognitive resource demand from INs will result in task/activity interference. In short, people scoring high on boredom proneness should become more distracted during tasks in which they were engaged when receiving INs and should interact with these tasks more (to relieve boredom), thus resulting in greater activity disruptions. Therefore, we propose the following hypothesis:
Next, poor emotion regulation is conceptualized in I-PACE as an affective response influencing PIU. Distress tolerance represents adaptive emotion regulation skill and lower levels are associated with increased PSU (Elhai, Levine, et al., 2018) and should correlate with increased frequency of IN-related disruptions. In LCM and TCM, lower distress tolerance could represent an individual difference increasing the likelihood that greater cognitive resource demand from INs will result in task/activity interference. Therefore, we propose:
As stated in Hypothesis 1, boredom proneness is an attention bias cognitive response in I-PACE. According to I-PACE, cognitive responses can mediate relations between preexisting psychopathology (such as anxiety and depression) with PIU/PSU. In fact, Elhai, Vasquez, Lustgarten, Levine, and Hall (2018) discovered that boredom proneness mediated relations between both depression and anxiety severity with PSU severity. And Wegmann, Ostendorf, and Brand (2018) found that boredom proneness mediated relations between PIU and psychopathology (which included depression and anxiety). Boredom proneness should serve as such as mediator in the present study, where the dependent variable is IN-related activity disruptions. Depression and anxiety should set the stage for some individuals to exhibit more boredom (Eastwood, Frischen, Fenske, & Smilek, 2012), in turn leading to increased disruptions in activities from INs. We thus propose the following:
Finally, as stated in Hypothesis 2, in I-PACE, lower distress tolerance represents an affective response influencing PIU/PSU. Such affective response in I-PACE can mediate relations between predisposition (anxiety and depression) with PSU. Elhai, Levine, O’Brien, and Armour (2018) discovered that lower distress tolerance mediated relations between anxiety and PSU severity. Distress tolerance should serve as a mediator in the present study, with IN-related activity disruptions as the dependent variable. For our final hypothesis, we therefore propose:
Research Model
Our research model is displayed in Figure 1. Depression and anxiety are conceptualized to predict boredom proneness and lower distress tolerance. Boredom proneness and lower distress tolerance in turn are conceptualized to predict IN-related disruption frequency. We included sex and age as covariates of disruption frequency because younger people (Lu et al., 2011; van Deursen et al., 2015) and women (Jeong, Kim, Yum, & Hwang, 2016; Wang, Wang, Gaskin, & Wang, 2015) engage in higher PSU severity. We discuss the use of latent versus observed variables in the Results section.

Hypothesized model. DEP = depression; ANX = anxiety; BP = boredom proneness; DT = distress tolerance; DA = daily activities; IN = interruptive notifications. Circles represent latent variables, while squares and rectangles represent observed variables. For improved visual simplicity, factor loading paths from latent variables are not displayed.
Method
Participants and Procedure
We recruited undergraduate participants in fall 2018 from the psychology department research pool of a large Midwestern U.S. university. Students (all reporting smartphone ownership) located our study on the department’s Sona Systems web portal, displaying available studies for course research points. The study was approved by the university’s Institutional Review Board. Students were presented an online consent statement and those enrolling were routed to a web survey on Psychdata.com.
Among the 329 individuals who participated, 13 participants did not complete or continue past the first (demographic) questions and were excluded. Among the remaining, effective sample (N = 316), average age was 19.21 years (SD = 1.74). A majority of participants were women (n = 211, 66.8%). Most were Caucasian (n = 238, 75.3%), with some racial/ethnic minority representation from African American (n = 60, 19.0%), Latinx (n = 15, 4.7%), and Asian (n = 15, 4.7%) backgrounds (designations were not mutually exclusive). Most participants were freshman (n = 188, 59.5%) or sophomores (n = 79, 25.0%). A slight majority were working part-time (n = 164, 51.9%) or full-time (n = 32, 10.1%).
Instruments
After the demographic items mentioned above (age, sex, race, ethnicity, school, and work status), participants were presented the following measures.
Depression Anxiety Stress Scale-21 (DASS-21)
The DASS-21 (Lovibond & Lovibond, 1995) measures depression, anxiety, and stress symptoms over the past week. The scale uses Likert-type response options from “0 = did not apply to me at all” to “3 = applied to me very much or most of the time.” We used the depression and anxiety subscales (7 items each), demonstrating reliability and validity (Antony, Bieling, Cox, Enns, & Swinson, 1998; Brown, Chorpita, Korotitsch, & Barlow, 1997). Coefficient α in our sample was .91 for depression and .84 for anxiety.
Distress Tolerance Scale (DTS)
The DTS (Simons & Gaher, 2005) is a 15-item scale querying ability to endure emotional distress, with Likert-type response options from “1 = strongly agree” to “5 = strongly disagree.” Internal consistency is adequate; scores negatively correlate with negative affect and substance use (reviewed in Leyro et al., 2010). Internal consistency was .93 in our sample.
Boredom Proneness Scale–Short Form (BPS-SF)
The BPS-SF (Struk et al., 2017) is an 8-item scale of trait boredom. Response options are Likert-type from “1 = highly disagree” to “7 = highly agree” regarding present experiences. The BPS-SF is reliable and valid, converging with scales of inattention, mind-wandering, anxiety, and depression (Struk et al., 2017). Coefficient α in this sample was .91.
IN-Related Daily Activity Disruptions
We used a list of 20 leisure and work activities based on items developed by Kahneman, Krueger, Schkade, Schwarz, and Stone (2004), adding several student-focused activities incorporated by Kushlev et al. (2016; Table 1). Similar to Paul, Komlodi, and Lutters (2015), we asked participants “How often do you stop or pause the following activities when you receive a pop-up notification on your (or smartwatch)?”
Means and Standard Deviations for Interruptive Notifications–Related Disrupted Daily Activities.

Note. The actual range of item endorsements for all items was from one to six.
We defined “pop-up notifications” for participants as information alerts that intend to actively draw your attention in order to inform you of a new event or information, such as a new chat message, system update/alert, etc. They appear prominently on-screen as a pop-up alert or banner in the foreground; not just as a number indicator in the background. (adapted from Paul et al., 2015)
Analysis
We used R software Version 3.5.2 (R Core Team, 2019) for descriptive and correlational analyses, using the fmsb (internal consistency), pastecs (descriptives), and corrplot (correlations) packages. We used R’s mice package to estimate small amounts of missing item-level data within a scale for conducting measurement models and computing total scores.
We used Mplus Version 8.2 (Muthén & Muthén, 1998–2019) for confirmatory factor analysis (CFA) and structural equation modeling (SEM). We first conducted CFAs for each scale in Figure 1. Boredom proneness items have seven response options, so we treated them as continuously scaled, using a Pearson covariance matrix, linear regression factor loadings, and maximum likelihood estimation with robust standard errors (MLR, robust to non-normality; Yuan & Bentler, 2000). We treated depression, anxiety, and distress tolerance items as ordinal (having less than five response options), using a polychoric covariance matrix, probit loadings, and weighted least squares estimation with a mean- and variance-adjusted (WLSMV) χ2 (DiStefano & Morgan, 2014). All residual covariances were fixed to zero. Fit indices included the comparative fit index (CFI) and Tucker–Lewis Index (TLI; excellent fit > .94), standardized root mean residual (SRMR; excellent fit < .09), and root mean square error of approximation (excellent fit < .07; Hu & Bentler, 1999).
We tested Figure 1’s model using WLSMV estimation. The path from boredom proneness to IN-related disruptions tests Hypothesis 1. The path from distress tolerance to IN-related disruptions tests Hypothesis 2.
We tested mediation/indirect effects by multiplying together two pairs of direct path coefficients. We estimated standard errors for mediation effects using the Delta method with 1,000 nonparametric bootstrapped replications (Hayes, 2017).
Results
Descriptive and Correlational Findings
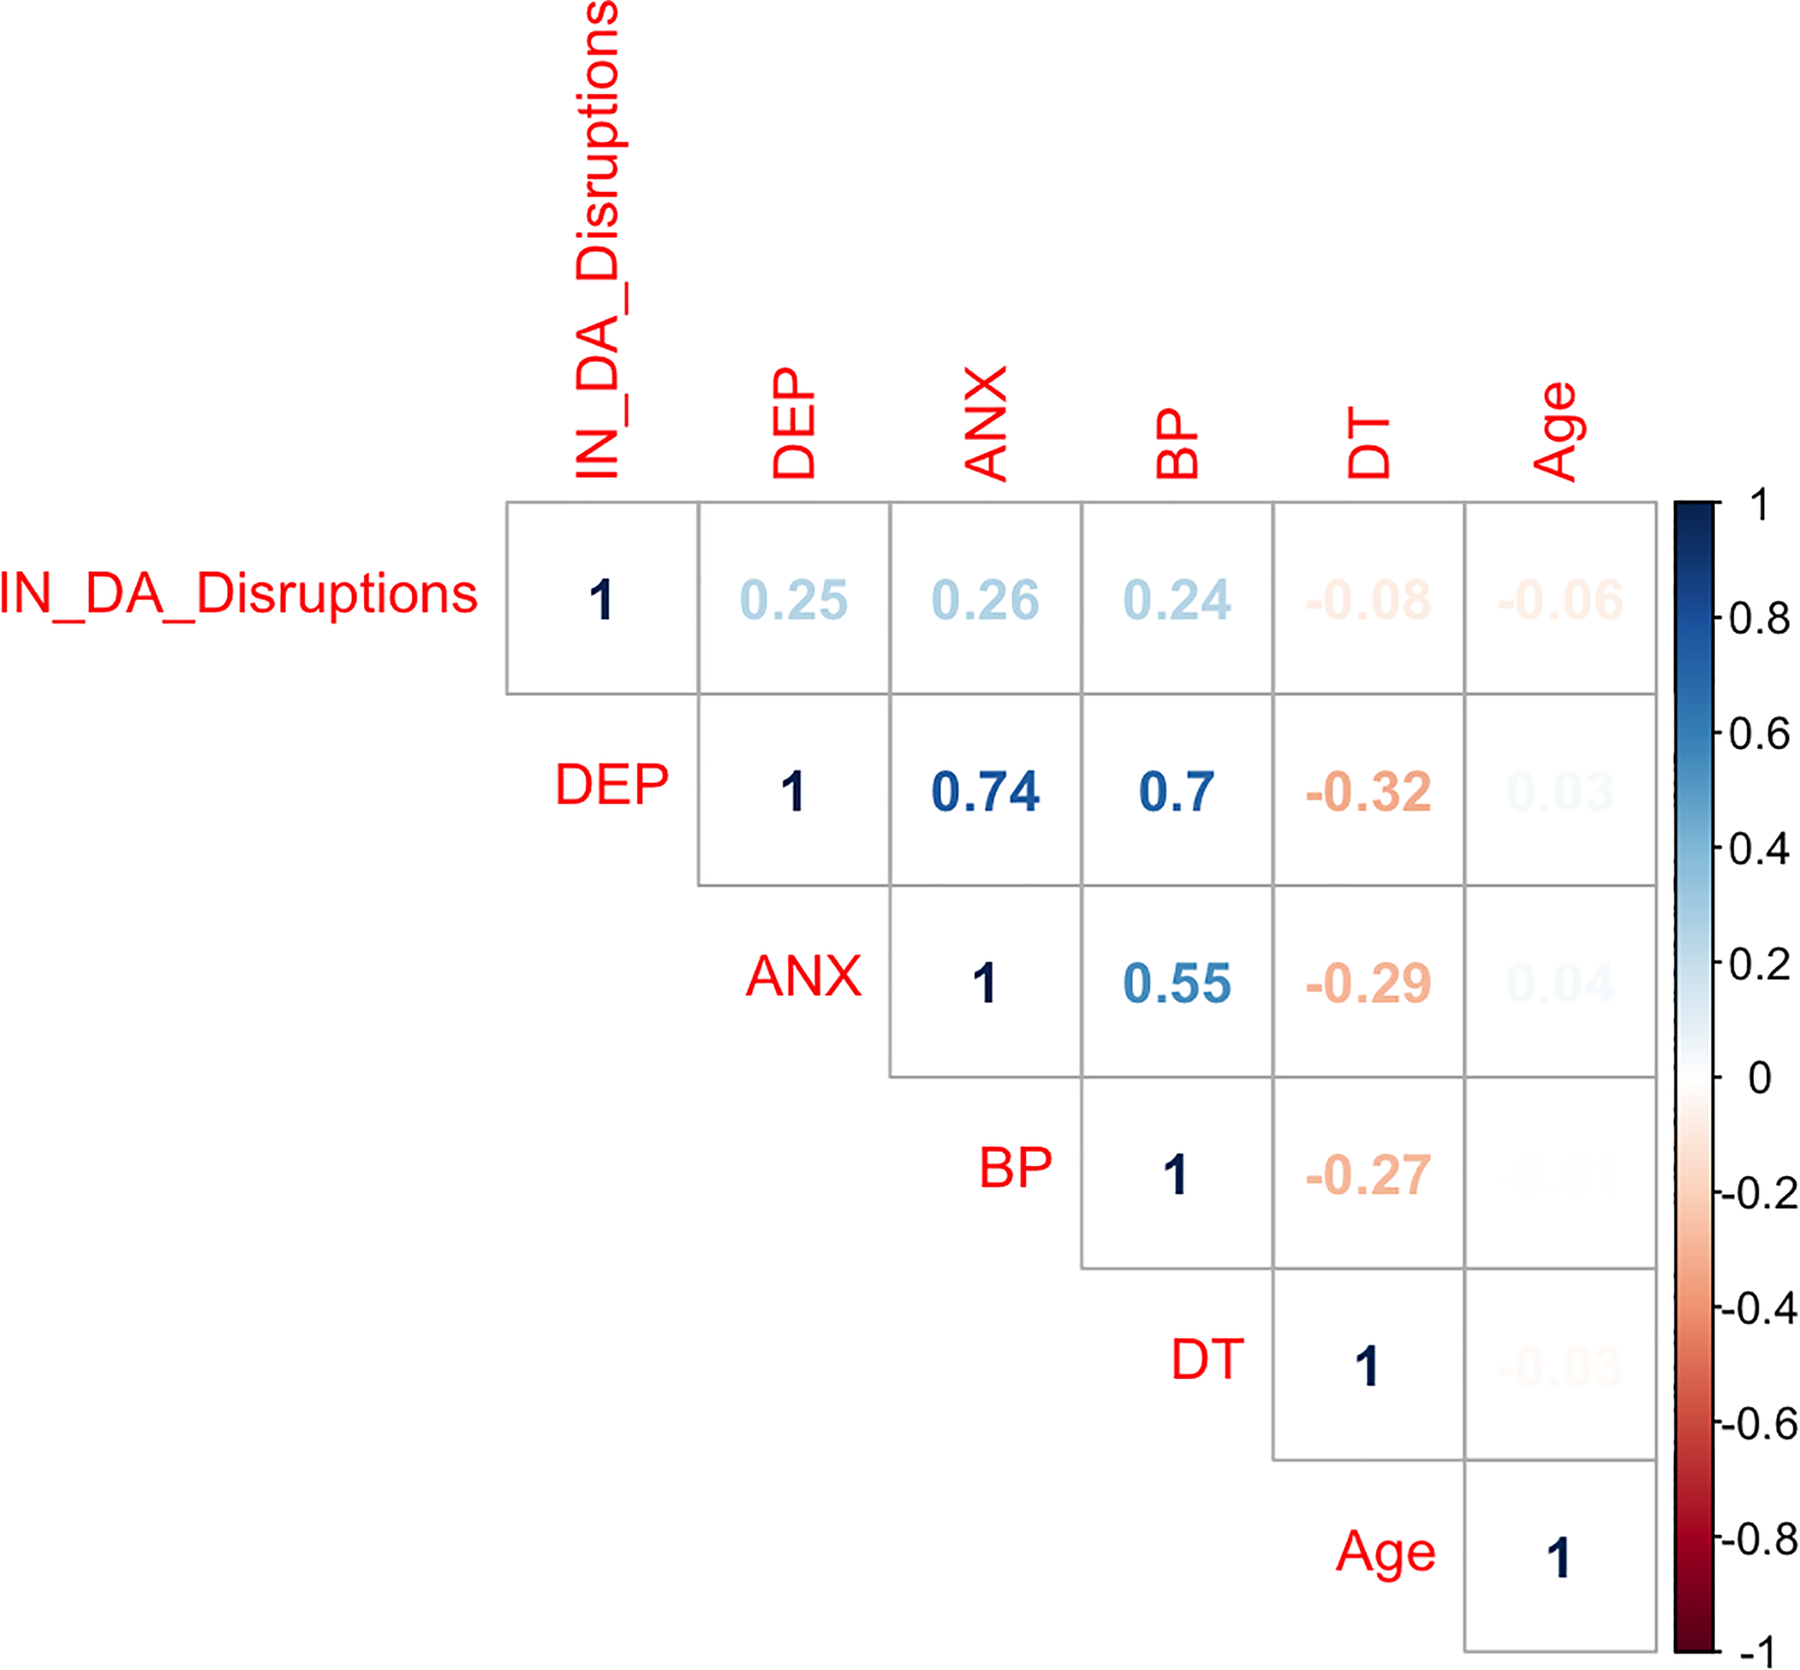
Descriptive statistics for IN-related activity disruptions are displayed in Table 1. Descriptive statistics for primary scales and age are presented in Table 2, with sex differences on the scale scores presented. Scale scores and age intercorrelations are displayed in Figure 2. We also present intercorrelations separately for men (Figure 3) and women (Figure 4). Figure 2 shows that for the full sample, IN-related disruptions were moderately related to depression, anxiety, and boredom proneness (testing Hypothesis 1) but not distress tolerance (testing Hypothesis 2).
Means and Standard Deviations for Primary Study Variable Total Scores and Effects of Sex.

Note. The only between-sex statistically significant difference in scale score was for distress tolerance, where women scored higher than men.
Correlations among primary study variable total scores and age.
Correlations among primary study variable total scores and age among the men participants. Note. DEP = depression; ANX = anxiety; BP = boredom proneness; DT = distress tolerance; IN_DA_Disruptions = frequency of disrupted daily activities from interruptive notifications. All correlations are significant (p < .001) except between DT and IN_DA_Disruptions (p > .05) and between age and all other variables (ps > .05). Correlations with a darker shade indicate stronger correlations in absolute magnitude.

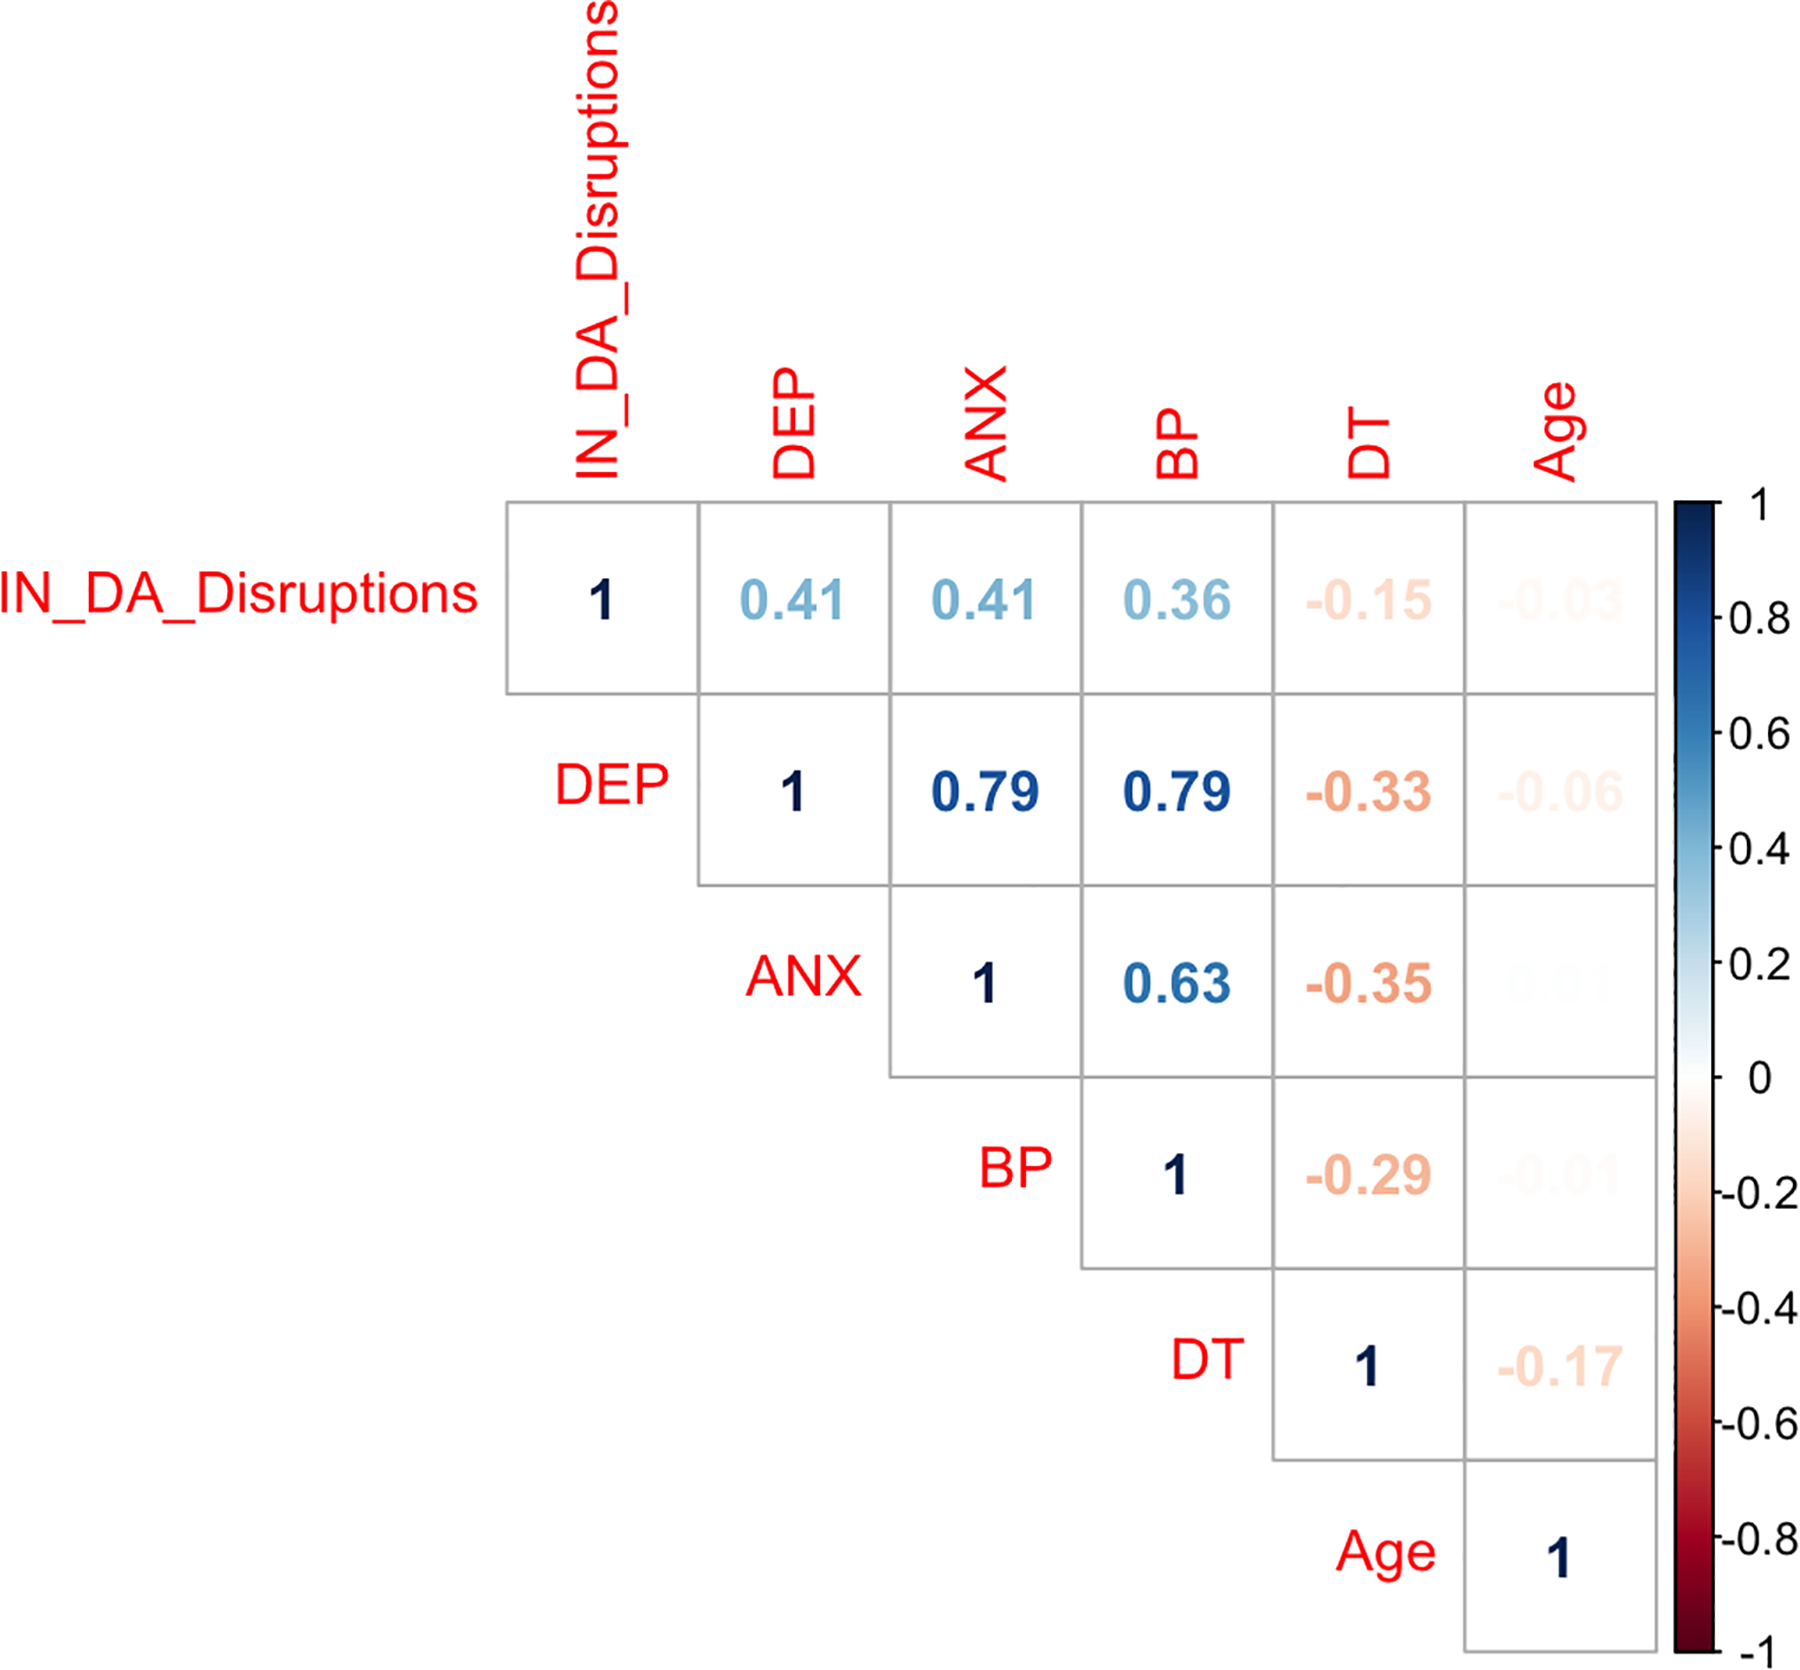
Correlations among primary study variable total scores and age among the women participants.
Because we inquired about activity disruptions from smartphone and smartwatch INs, we tested whether smartwatch INs played a role in activity disruptions. However, a majority of participants reported not owning a smartwatch (n = 223, 70.6%) with relatively few wearing one “often” or “very often” (n = 57, 18.0%). IN-related activity disruptions were not related to smartwatch ownership versus nonownership, F(1, 314) = 1.48, p = .23 (
Primary Results
The depression CFA model resulted in good fit, WLSMV χ2(14, N = 316) = 29.30, p = .01, CFI = .997, TLI = .995, SRMR = .02, RMSEA = .06 (90% CI [.03, .09]). Standardized factor loadings were uniformly high, mostly in the .80–.90 range (factor loadings available upon request from the first author). The anxiety CFA model also resulted in good fit, WLSMV χ2 (14, N = 316) = 43.73, p < .001, CFI = .98, TLI = .97, SRMR = .04, RMSEA = .08 (90% CI [.06, .11]), with factor loadings in the .70–.80 range.
The distress tolerance CFA showed some evidence for adequate fit, WLSMV χ2(90, N = 316) = 656.23, p < .001, CFI = .93, TLI = .92, SRMR = .05, RMSEA = .14 (90% CI [.13, .15]), with factor loadings in the .60–.80 range. The boredom proneness CFA fit well, MLR χ2(20, N = 316) = 46.55, p = .0001, CFI = .97, TLI = .96, SRMR = .03, RMSEA = .07 (90% CI [.04, .09]), with factor loadings mostly in the .70–.80 range.
The CFA for IN-related activity disruptions did not fit well, WLSMV χ2(170, N = 316) = 1391.59, p < .001, CFI = .80, TLI = .78, SRMR = .10, RMSEA = .15 (90% CI [.14, .16]). Consequently, we modeled this variable in SEM as an observed, summed score of IN activity disruptions.
The full SEM model from Figure 1 was tested next. This model fit well, WLSMV χ2(733, N = 316) = 1246.21, p < .001, CFI = .95, TLI = .95, SRMR = .10, RMSEA = .05 (90% CI [.04, .05]). Standardized path coefficients are displayed in Figure 5. Adjusting for age, sex, and distress tolerance, boredom proneness was related to IN-related disruptions (Hypothesis 1). Adjusting for age, sex, and boredom proneness, distress tolerance was not related to IN-related disruptions (rejecting Hypothesis 2).
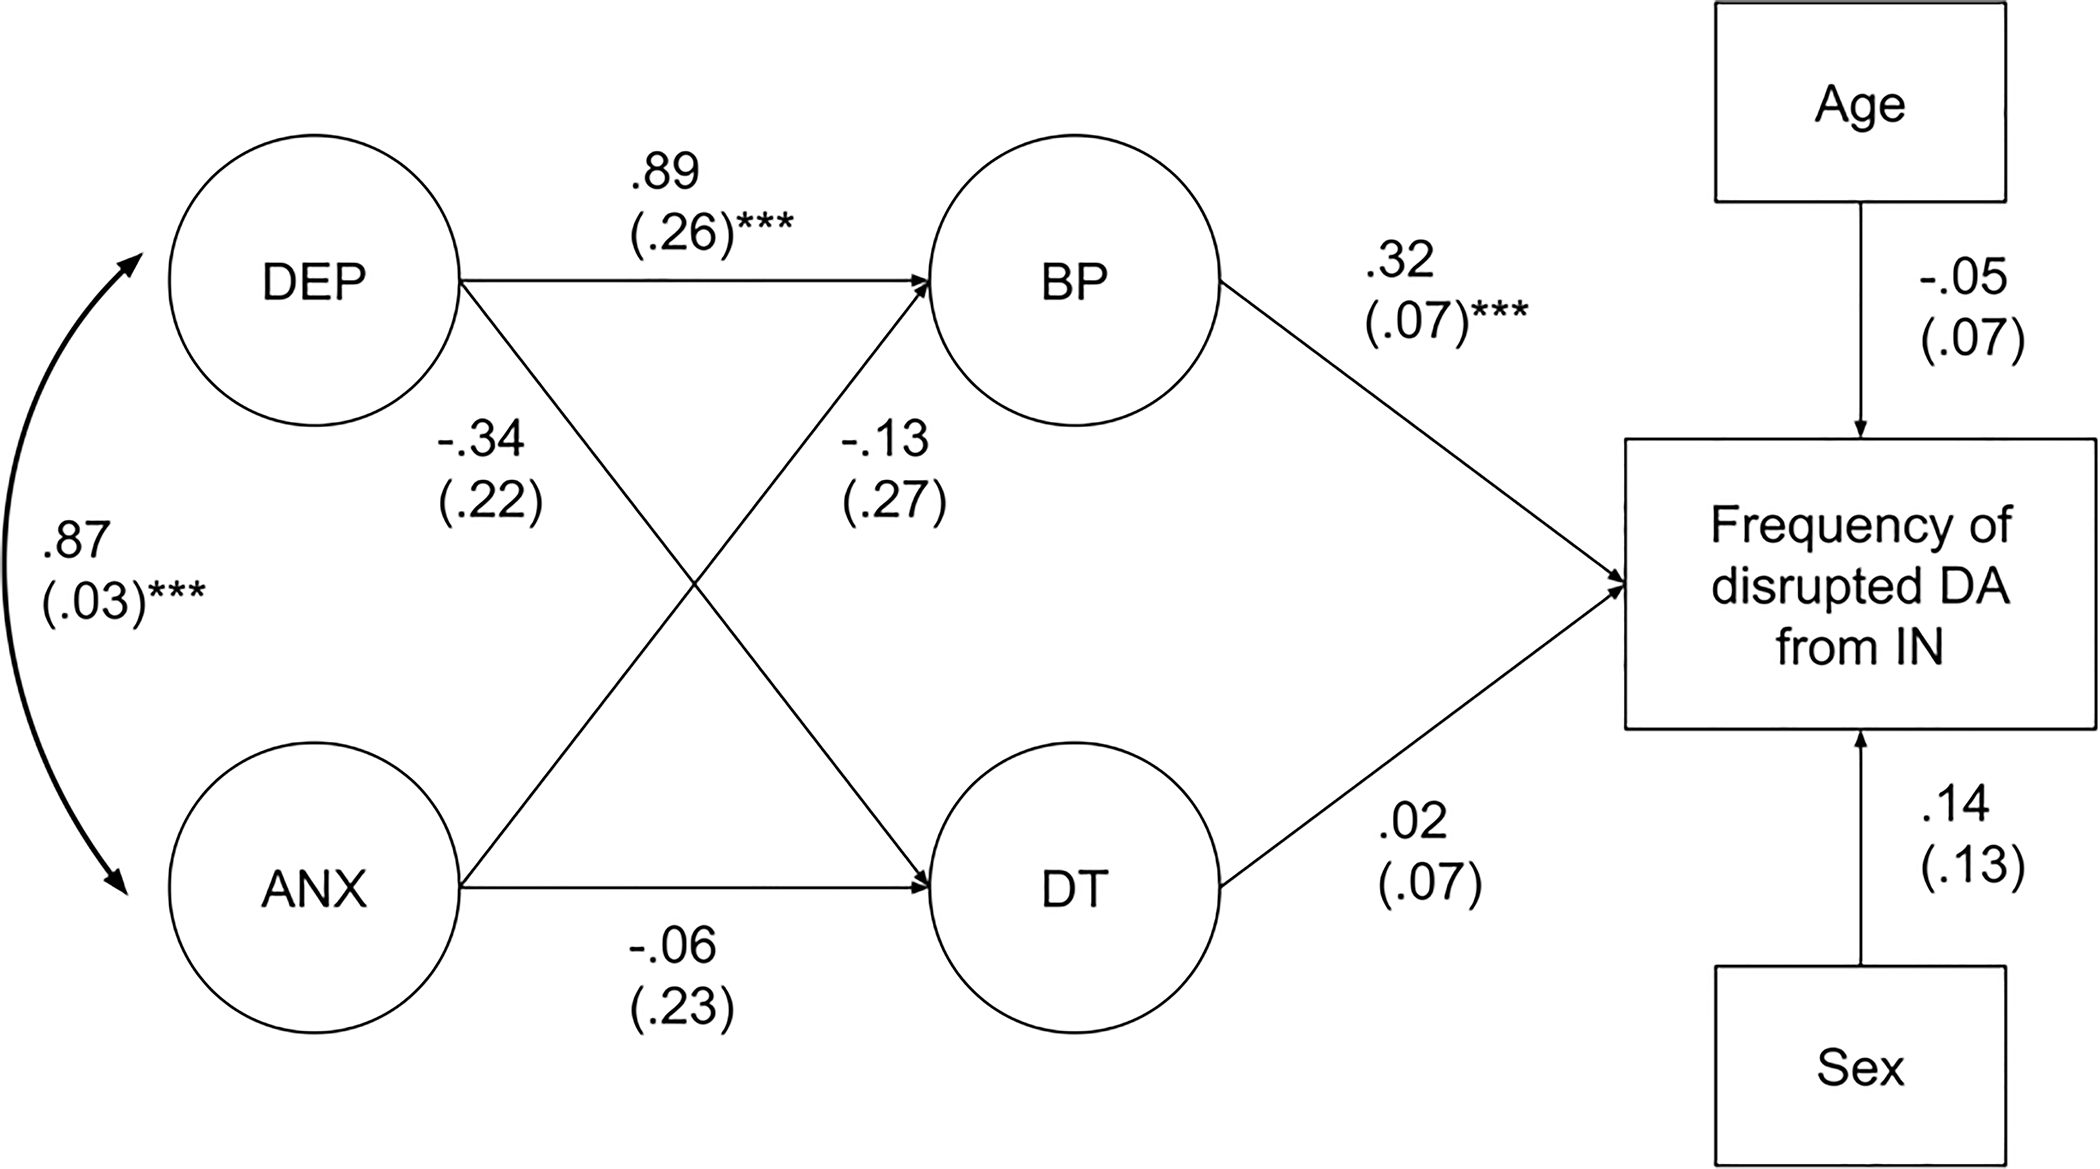
Standardized path coefficients for the SEM model.
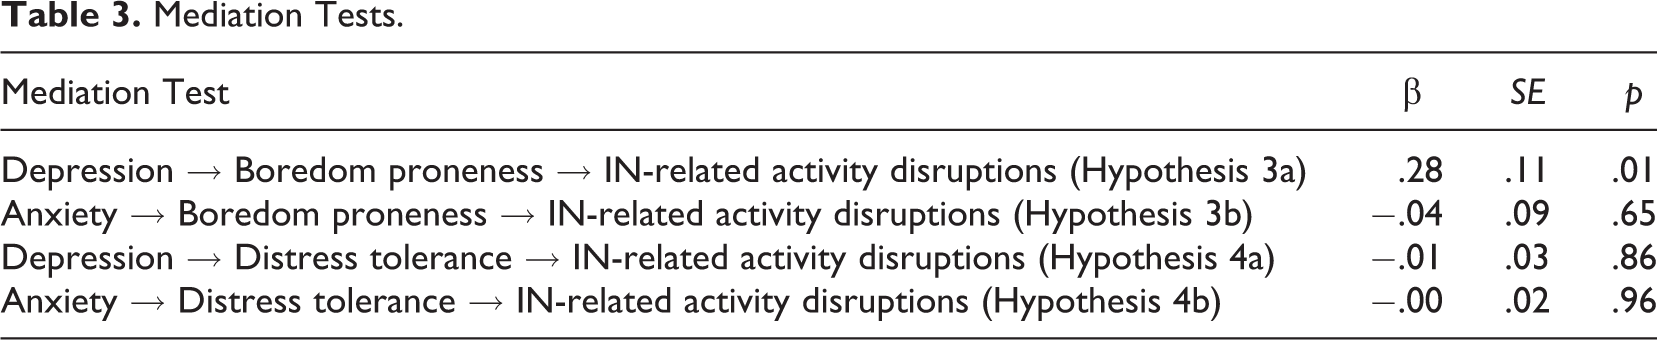
We tested four mediation effects specified in Hypotheses 3a, 3b, 4a, and 4b. Only one mediation effect was significant; boredom proneness mediated relations between depression severity and IN-related disruptions (Hypothesis 3a; see Table 3).
Mediation Tests.
Finally, we tested a variation of Figure 1’s model, adding paths from depression and anxiety to IN-related activity disruptions. However, this modification did not enhance model fit as depression and anxiety were not related to IN disruptions after accounting for the covariates.
Discussion
Little prior work has investigated psychological constructs associated with adverse consequences from INs. This research is important in order to understand and manage deficits in school/work productivity from INs. Based on bivariate correlations, we found that depression, anxiety, and boredom proneness severity were individually related to increased disruptions in activities from smartphone INs. We next discuss the results in context of our hypotheses.
We found support for Hypothesis 1 in that boredom proneness was related to increased IN-related disruptions, in bivariate analysis and in multivariate models adjusting for covariates. Boredom proneness is related to PSU (Elhai, Vasquez, et al., 2018; Lepp et al., 2017) and PIU severity (Wegmann et al., 2018). In fact, IN-related disruptions are important to PSU, representing PSU’s functional impairment in daily life and dangerous use dimensions (Billieux et al., 2015; De-Sola Gutierrez et al., 2016). Boredom proneness represents an attentional cognitive response in I-PACE that can influence excessive Internet and smartphone use. People who score high on boredom proneness may experience boredom and negative affect when working on necessary tasks (e.g., school and/or work) resulting in their pausing (and delaying continuance of) such tasks when experiencing IN-related disruptions. Boredom proneness involves dysfunctional attentional bias and is related to impulsivity (Eastwood et al., 2012), an important aspect of addictive behaviors (Brand et al., 2016); impulsivity would naturally cause disruption in activities and tasks and difficulties in resuming them—especially when the individual is already experiencing boredom. Of course, disruption in such activities is a problem because of switching costs to productivity when attempting to resume them (Salvucci & Taatgen, 2008).
We did not find support for Hypothesis 2, as distress tolerance was not associated with IN-related activity disruptions in bivariate analysis, nor in multivariate models when adjusting for other predictor variables. A possible explanation lies in the fact that distress tolerance is an affective rather than cognitive process (Leyro et al., 2010), but INs often involve cognitive interference. Associations for anxiety, depression, and boredom proneness with activity disruptions were significant perhaps because these constructs involve not only affective but also cognitive deficits (Castaneda, Tuulio-Henriksson, Marttunen, Suvisaari, & Lonnqvist, 2008; Struk et al., 2017). Thus perhaps the affective function of distress tolerance did not compete with the cognitive thread of INs as in TCM (Salvucci & Taatgen, 2008).
We found evidence supporting Hypothesis 3a in that boredom proneness mediated relations between depression severity and IN-related disruptions. Boredom proneness is an attentional cognitive response in I-PACE, representing a mechanism explaining relations between predispositional psychopathology and excessive Internet use (Brand et al., 2016)—in this case, increased IN-related disruptions. This finding is relevant to prior work on boredom proneness mediating relations between depression and PSU severity (Elhai, Vasquez, et al., 2018). However, we did not find support for Hypothesis 3b; boredom proneness did not mediate relations between anxiety and IN-activity disruptions. Finally, Hypothesis 4 was not supported; distress tolerance was not a significant mediator—perhaps again because of distress tolerance’s affective rather than cognitive function.
In more recent years, smartwatches have become increasingly popular and accepted (Hsiao & Chen, 2018). In our sample of college students, we found a low prevalence of smartwatch ownership and wearing frequency, and smartwatch wearing was not associated with IN disruptions. This finding corroborates research that the smartphone is the preferred way to receive notifications (Weber et al., 2016). Nonetheless, smartwatch INs can impact consequences of smartphone INs (Visuri et al., 2017; Voit, Henze, & Weber, 2018) and should be studied in the future.
We acknowledge that our study was limited by its self-report methodology. We did not have objective data on smartphone use or smartphone INs received, and such objective data would be more accurate in assessing smartphone use (Montag, Blaszkiewicz, et al., 2015; Rozgonjuk, Levine, Hall, & Elhai, 2018). Furthermore, causal interpretation should be made with caution, as our design was cross-sectional. Additionally, we only included depression, anxiety, boredom proneness, and distress tolerance as psychopathology-related variables; other variables may also be important in studying IN’s adverse consequences. Finally, our sample was a convenience sample of college students which may not generalize to the overall population.
Nonetheless, results have implications for the role of smartphone INs in daily life activities. Future research should examine additional psychological constructs that may exacerbate the impact of INs on daily life. Although distress tolerance was not related to IN-related disruptions in this study, future studies could examine the similar construct of emotion regulation to assess its relationship with such disruptions. Personality variables associated with excessive smartphone use (Kim et al., 2016; Lachmann, Duke, Sariyska, & Montag, 2019; Pearson & Hussain, 2015) could also be examined in conjunction with the impact of INs.
Footnotes
Authors’ Note
The authors thank the Deanship of Scientific Research and RSSU at King Saud University for their technical support. Reprints from this article can be requested from Jon Elhai through his website, ![]() , or by email,
, or by email,
Declaration of Conflicting Interests
The authors declared no potential conflicts of interest with respect to the research, authorship, and/or publication of this article.
Funding
The authors disclosed receipt of the following financial support for the research, authorship, and/or publication of this article: The authors extend their appreciation to the International Scientific Partnership Program (ISPP) at King Saud University for funding this research work through ISPP# 114. ISPP had no influence on the study described here nor on the writing of this manuscript.