
Abstract
The increasing availability of data, along with sophisticated computational methods for analyzing them, presents researchers with new opportunities and challenges. In this article, we address both by describing computational and network methods that can be used to identify cases of rare phenomena. We evaluate each method’s relative utility in the identification of a specific rare phenomenon of interest to social movement researchers: the spillover of social movement claims from one movement to another. We identify and test five different approaches to detecting cases of spillover in the largest data set of protest events currently available, finding that an ensemble approach that combines clique and correspondence analysis and an ensemble approach combining all methods perform considerably better than others. Our approach is preferable to other ways of analyzing such cases; compared to qualitative approaches, our computational process identifies many more cases of spillover—some of which are surprising and would likely not be otherwise investigated. At the same time, compared to crude quantitative measures, our approach substantially reduces the “noise,” or identification of false-positive cases, of movement spillover. We argue that this technique, which can be adapted to other research topics, is a good illustration of how the thoughtful implementation of computational methods can allow for the efficient identification of rare events and also bridge deductive and inductive approaches to scientific inquiry.
Big data and computational methods have generated significant opportunities and also important challenges for the social sciences (boyd & Crawford, 2012; Hesse et al., 2015). On the one hand, researchers have the opportunity to study and analyze relatively rare phenomena in more formal ways and to use computational methods to identify phenomena within data that were hard to identify a priori and hence have been understudied (and, when studied, have been examined almost exclusively qualitatively). On the other hand, as the size of data sets rise, it is also important to realize that the so-called noise in data may complicate efforts to study rarer events and/or phenomena that are not readily and obviously identifiable. Even if error is relatively constant between larger and smaller data sets, larger and larger sets necessarily have more absolute errors, and this can be consequential when studying rare or difficult-to-identify phenomena. Moreover, differentiating between meaningful “signals” and extraneous “noise” in data can also be difficult. We argue for a way of wedding computational and network techniques to theory and empirically vetting alternatives that offer researchers an opportunity to both enjoy the benefits of studying rarer and/or harder-to-identify phenomena in more formal ways while also being thoughtful about the noise that exists in data sets, particularly as they grow larger.
In a “play within a play” format, we develop an illustrative example throughout this article that is focused on social movement scholarship—the examination of social movement spillover—to demonstrate a generalizable approach to maximizing the benefits of computational and network methods and improving our research practices beyond what would be possible with more traditional techniques. Although we discuss this in much more depth below, we examine a kind of spillover that occurs when one existing social movement affects another movement by diffusing claims such that the claims or concerns of the first movement come to also be sought by other movements. For instance, several previous civil rights movements affected how claims-making for gay rights occurred (Meyer & Boutcher, 2007). Almost all prior research on spillover, whether on the variety we examine or other forms of spillover, uses case studies in which spillover between specific movements was expected (e.g., McKee Hurwitz, 2018) since there has been no way to identify instances of spillover that are unexpected or to identify meaningful spillover “in the wild.” The small amount of quantitative research on the topic has had to rely on crude assumptions about the importance of any reported overlap between two movements, which both opens these methods up to analyzing false positives produced by the error in the data set and also theoretically inconsequential overlaps that are not lasting or influential (i.e., that match the data definition of spillover being used but do not match the animating theoretical concept of spillover).
In its most basic form, we argue for using theory to define a conceptual target for computational techniques, adapting and comparing known methodologies that might be used to identify both expected and unexpected instances of the phenomenon from the ground up, and then using these inductive identifications in deductive analyses explaining the causes or consequences of the identified phenomenon. Identified conceptual targets, instances of spillover in our case, are both at once theoretically meaningful and make data more amenable to deductive research on the causes or consequences of the target but also deliver on the promise of computational social science by allowing us to find in data something we could not locate without computational tools and while better sorting signal from noise compared to other more traditional methods. In our conclusion, we also connect this to underlying epistemological debates about computational methods and their use.
Agenda-Setting Spillover in Social Movements
Meyer and Whittier (1994) introduced the idea of social movement spillover, which at the most general level suggests that social movements affect one another. Minkoff (1997) soon followed, examining whether high protest levels or increasing organizational density in civil rights led to increases in women’s movement organizing, categorizing both of these potential relationships as spillover effects. She found that both organizational and protest dynamics of the civil rights movement impacted the organizational density and protest activity of the women’s movement, due to several mechanisms including the sharing of organizational templates, information, and resources. Other researchers subsequently documented spillover from the civil rights movement to several other movements, including the revitalization of the labor movement (Isaac & Christiansen, 2002) and the development of the gay marriage movement (Meyer & Boutcher, 2007). Research has also demonstrated spillover from the women’s movement to the peace movement (Meyer & Whittier, 1994) and to new social movements more broadly (Olzak & Uhrig, 2001). Research on spillover has been particularly relevant to the growing literature on social movement outcomes since these effects represent key mobilization outcomes (Staggenborg, 1986) or what have also been called intramovement outcomes (Earl, 2000).
Prior research conceptualizes the spillover process in a variety of manners. Meyer and Boutcher (2007) examined spillover of both framing—or the way movements discuss a social problem, propose solutions, and allocate blame—and tactics. Specifically, they investigate whether the victory in Brown vs. Board of Education had spillover effects on the gay marriage movement, casting both the use of litigation as a tactic and the prevalence of the rights frame as spillover effects (see also Boutcher & McCammon, 2019). Similarly, Olzak and Uhrig (2001) studied the impact of tactical overlap on mobilization levels. They argued tactical overlaps could be seen as a kind of spillover that might spur future mobilization. Isaac and Christianson (2002) echoed the interest of Minkoff (1997) in measuring spillover through mobilization effects and organizational effects. Others have combined the literature on spillover and the role of movements in agenda setting to consider how movements can induce spillover of their fundamental claims into other movements (Earl, 2010; Earl & Ring-Ramirez, 2015). In this line of work, for instance, environmental concerns taken up by civil rights activists or feminists would constitute spillover. 1
In this article, we focus on this claim-based view of spillover, seeking to study when movements are able to set the agenda for, or insert their claims into, other movements. There are a number of reasons to believe that movements may influence the concerns of other movements (many of which are quite similar to the mechanisms already identified as being involved in spillover). First, activists may be part of two or more movements and serve as a direct link between movements. For instance, it is unlikely that environmental activists check their environmental concerns at the door when they participate in other movements. Rather, these concerns are probably imported into other movements, raising the likelihood that other movements add environmental concerns to their agenda (e.g., by adopting more environmentally friendly practices; championing claims that represent a nexus of the movement’s primary concerns and environmental concerns).
Second, large mobilizations often create cross-movement coalitions that educate movement leaders about the primary concerns of other social movements (Mische, 2008). It is likely that some of the time that education affects how each actor moves forward in subsequent activity.
Third, the complex social issues that social movements address tend to impact multiple constituencies, which in turn may have ties and concerns connected to multiple social movements. Movements may also benefit from integrating resonant claims from other movements into their own agenda (e.g., taking feminism seriously within other movements).
Finally, as certain social movements successfully gain coveted media attention, other movements may incorporate the same claims into their own agenda in the hopes of sharing the spotlight. That is, even if shared personnel, experiences, or complex claims don’t result in intermovement agenda setting, the desire to connect one’s movement to popular media themes may still drive spillover in agenda setting.
Given the high likelihood of this form of the spillover, it is unfortunate that it has been difficult to study it, and as is true of other forms of spillover, has proven almost impossible to study outside of case studies. Indeed, existing research on spillover (with very few exceptions) has examined only pairs of movements that researchers expect may have experienced spillover. This work then uses ethnographic fieldwork, archival work, interviews, network diagrams, and so on to determine whether spillover did, in fact, occur.
This familiar and well-honed design is adequate if (1) the researcher has an a priori reason to focus on a movement pair; and (2) the researcher is not interested in the more general prevalence of agenda-setting spillover among movements, its predictors, or its consequences. However, if researchers want to take a more inductive approach—not identifying in advance where potential agenda-setting effects might be found among a broad array of movements but rather locating instances of agenda setting from within the data—then this approach will not work. Moreover, if a researcher is interested in the general prevalence of spillover effects among movements, and the determinants of those effects across a wide range of cases of spillover, then this case-driven approach will also be inappropriate because it will only capture spillover in cases that can be anticipated. At a minimum, we argue this set of practices limits our ability to consider spillover in broad contexts, but it may also lead scholars to overlook real and important cases of cross-movement spillover simply because they do not expect spillover and therefore do not look for it.
Unfortunately, in the exceedingly rare cases when researchers have tried to more organically identify spillover, measures have been coarse and prone to error. Olzak and Uhrig (2001) examined spillover between tactics using simple proportion-based measures that require larger surges and/or are sensitive to low initial values (e.g., when small Ns are involved, small absolute changes can cause large proportionate changes). We argue that while the impulse to let instances of spillover emerge is a good one, these coarse measures, at least without strong testing, are insufficient. For instance, in the data set we introduce and analyze below, using such a simple co-occurrence measure for spillover would indicate that movements were constantly changing one another’s agenda, as treating any co-occurrence of claims as spillover would net thousands of instances of spillover (a more precise version of this calculation is described more below). We argue that such identifications are both error-prone (e.g., a reported overlap between senior rights and animal rights movements might be the simple result of a coding or reporting error but is treated as real) and, even when factually accurate, vastly overstate the more enduring, deeper, and rarer connections between movements that spillover is meant to capture.
Developing a Method for Empirically Identifying Instances of Spillover
In this section, we outline an approach that blends inductive and deductive practices and illustrate it using our theoretical target—social movement spillover. In doing so, we demonstrate a generalizable method for using computational and network techniques to identify rarer and/or hard-to-identify phenomena while not assuming that all potential data points identified represent meaningful theoretical signals.
Reconceptualizing the Phenomenon
When existing methods are unable to be used or adapted, as is the case here, we argue that researchers should reconceptualize the phenomenon of interest so that basic properties of the phenomenon (i.e., a bare-bones theoretical definition of the target phenomenon) are unencumbered by expectations about where it would be found. In other words, based on theory, what would have to be true to identify “a case of” that phenomenon without any specific prior expectations about where to look? Once the target is outlined, it is possible to design and compare different computational techniques in terms of their ability to find the target in unexpected places in the data.
In our case, the bare-bones theoretical definition of a case of issue spillover is the adoption of new, external claims into the claims made by a movement (e.g., claims made at movement events). For example, in 1991, environmental activists partnered with members of the Cree tribe to protest the building of a hydroelectric dam in New York, making claims based on environmental impact and on the sanctity of tribal land (Dynamics of Collective Action [DoCA] event ID #9110007). In this instance, the co-occurrence of claims from two different movements is evident, quantifiable, easily observable, and meaningfully represents on-the-ground spillover. However, it is also important that methods recognize that error exists (whether from reporting or data coding) and that one-off or limited collaborations don’t represent theoretically meaningful “agenda setting,” leading us to turn to computational and network techniques that hunt for spillover but over enough of a threshold that error and theoretically meaningless instances can be vetted.
Enough Data Versus Big Data: Locating Unexpected Cases
Although many think of big data as at a petabyte scale, it is clear that even moderately sized data sets can yield important new insights using computational techniques and can, in the social sciences, raise problems associated with big data (White & Breckenridge, 2014). Gaining these new insights, though, involves sifting through enough data to “find” unexpected instances of one’s phenomenon of interest. While one does not necessarily require a huge amount of the data for this, it certainly must go beyond the case studies or small-N comparisons encumbered by researchers’ expectations about where spillover may be occurring.
In this article, we use the DoCA data set, consisting of 23,616 protest events covered in the New York Times between 1960 and 1995. These data represent the largest data set of its kind—tracking individual protest events for 35 years—and contain exactly the kind of data we need to determine when and where overlapping claims across movements may occur. While large for social movement scholars, this is not petabyte data.
In this data set, each case represents a single protest event, with details on that event including the concerns voiced and whether or not there was an organizational presence at the event. Every record also includes other details about the protest event that may become relevant in predicting the likelihood that spillover occurs at any given event or across events associated with pairs of movements across time. Up to four of 170 specific claims representing major movement issues could be coded for each event.
In order to prepare our data, we extract the claims, aggregating them to one of the 29 top-level “movement” claims. In the original codebook, these claims were already grouped under broad social movement categories and coded with an orientation to those social movement broad categories (with two exceptions discussed shortly). For example, there were 12 specific claim codes available under a larger environmental movement category, including “soil protection,” “limiting waste/recycling,” and “rainforest protection.” In our analysis, instead of analyzing the 12 different detail claim codes for the environmental movement, which would produce very spare matrices and a weak signal of how far broader environment claims have reached into other movements, we analyze the overall environmental movement, which is switched on by any of the 12 related detail codes being used or by a general environmental code being used, which occurred when a claim could not be classified more specifically among the 12 detail codes. There were two categories, however, that were not oriented toward a single social movement and instead represented a broad array of topics that were not elsewhere classified. We handled these differently. One represented practical policy issues such as tax reductions, NIMBY claims, and so on. The other represented broad ideological claims. We used our knowledge of these detailed claims to lump together detail claims into broader clusters representing social movements analogous to other groupings, where possible. 2 To be clear, moving forward we use the term “movement” to refer to these 29 broad categories of claims motivating protest activity rather than to social movement organizations, which were only present at a minority of protest events.
At its most basic level, one could simply define spillover in these data by the co-occurrence of two different movements’ claims at the same event, mimicking the approach used in the small number of quantitative studies on spillover (e.g., Olzak & Uhrig, 2001’s study of tactical spillover). But, as we began to argue above, we think such approaches are too coarse. First, this approach treats all co-occurrences as true signals of real connections. It doesn’t allow for error or noise in the data. In our data, there are 2,960 movement-year dyads that represent a co-occurrence between two different movements in a particular year. Investigating each of these occurrences would be theoretically misleading if we are interested in real instances of spillover; formal examinations of correlates of these instances would not teach us much about more enduring crossovers. Second, using the traditional method of treating all co-occurrences as meaningful assumes that rare occurrences are theoretically similar to more common occurrences. For example, perhaps two different movements’ claims are employed once or twice in the same protests—it seems hard to consider this as an indicator of deeper spillover between the two movements, reflecting real shifts or inclusivity in movement agendas (e.g., Fisher et al., 2017, examined different causes at the same event but not as an indicator of enduring spillover). Thus, our methods are designed to examine different views of the rates or ways in which overlaps happen to hone our identifications down into more meaningful, even if otherwise unexpected, instances of spillover.
In our search for more sensitive methods, we dig deeper, which requires some data set cleaning. To mitigate issues of location-based selection bias in newspaper data (Earl et al., 2004), we limit our analyses to those events that took place in New York state, so that our final analysis is on 8,638 events. From these data, we construct event-by-claim matrices, in which a cell in the matrix is coded 1 if the given claim appeared in a reported protest event, and 0 otherwise. We construct such matrices for each year from 1960 to 1995. Our event-by-claim matrices have, therefore, rows equal to the number of events in that year and 29 columns, one for each movement claim. The Whitehead and correspondence analysis methods, discussed in more detail below, use these event-by-claim matrices. We also use these matrices and matrix multiplication to construct adjacency matrices of claims to claims, which we use in the remaining methods we describe below. The claim-by-claim matrices that are derived from the event-by-claim matrices are 29 rows by 29 columns. In these matrices, the diagonal represents the total number of times a claim was used in a given year, and the off-diagonal values are sums of the number of times the row and column claims appeared together at a protest event in that year. The frequency, clique, and degree methods use these matrices in their classification of spillover, while the clique and degree methods dichotomize the counts as explained below.
Candidate Methods for Bottom-Up Identification
The next step in our process is to translate the conceptual definition of the phenomenon into a set of candidate computational methods that could be used on the selected data. We argue that it is important to identify and compare multiple methods, as we do here, as one does not want to risk misidentification because of a peculiarity of a single technique. This is also critical to the inductive element of this work—we are connecting theory and computational and social network techniques and will test the strength of those connections by examining the results—but we are not presuming a singular specific way to measure our target a priori.
For spillover, we identified five different methods that could be reappropriated from other settings to identify spillover and discuss them in turn. As we elaborate on below, we consider (1) a frequency-based approach that identifies statistically noticeable increases in the frequency with which two claims appear together in protest events over time; (2) an asymmetric measure of association, referred to as the Whitehead method, which examines the ratio of events in which two entities interact to the total number of events in which either of the two entities participate; (3) a clustering-based view of spillover analyzed using correspondence analysis; (4) an even stricter clustering measure that examines clique formation between different claims; and (5) a measure that uses network degree to identify claims that are increasingly associated with larger numbers of other claims. As will become clearer in our discussion of these five methods, they represent broadly related but distinct ways of understanding how to identify rare instances of real spillover in a larger trove of data.
But, despite their differences, most of these techniques are drawn from social network analysis, an analytic family well suited for this sort of problem since it tends to center on the inductive discovery of patterns of relationships among cases and has developed a number of techniques to measure the nature of these patterns. These techniques can also be classified as unsupervised learning algorithms, one of two broad categories of machine learning algorithms. Unsupervised learning algorithms inductively discover patterns in data without knowing the true answer. A subclass of these algorithms is concerned with clustering or classification of cases, which we use here. 3
Frequency
We begin with the most intuitively straightforward method for measuring spillover, an increase in the frequency with which two claims appear together in protest events over time. This borrows from Olzak and Uhrig’s (2001) study of tactical diffusion, but we develop it into a less coarse measure. This kind of measure of spillover captures those instances in which two claims become more associated over time. When one movement adopts the agenda of another, we would expect claims from both to appear together more often than in previous years.
To identify candidate instances of spillover according to this method, in each year, we constructed a claim-by-claim matrix in which the cell contained the number of events the row and column claims appeared together during that year. To normalize these values, we divided the counts by the sum of all counts for the year. For each year except the first, we subtracted the previous year’s value from the current in each cell. This gives us an indication of whether, in a given year, the co-occurrence of claims has increased in the past year. For each year, we calculate a mean and standard deviation of the cell values of the difference in frequency. We use these statistics to identify claim pairs with values that are at least two standard deviations above the mean value for the year. These steps are meant to acknowledge both error and that rare instances of spillover are not the same as more common instances of spillover (i.e., the co-occurrence of two claims once is not really agenda setting, but the common co-occurrence of those two claims is).
A distinct characteristic of this method is that spillover is identified by the frequency that two claims appear together regardless of how often the two claims appear separately. For instance, if two pairs of claims both had the same number of events in common, but for one pair, they only ever appeared together, while for the other pair, the common events only represented a quarter of the total number of events they appeared in, this method would identify both pairs as experiencing the same spillover.
Whitehead
The Whitehead (2008) method, named after Hal Whitehead (its inventor) and originally developed to study animal interactions and their clustering into social structures, attempts to address this limitation of the frequency method but not by directly calculating asymmetric connections. This method develops association rates based on a ratio of events in which two entities interact to the total number of events in which either of the two entities participate. 4 This method, then, captures instances of spillover in which two claims frequently appear together and infrequently appear alone. This would indicate a kind of bridging effect in which two claims become linked in a way that encourages their use together and discourages their use alone. For example, one can imagine periods in which abortion becomes highly salient as an issue, and so feminism claims frequently appear together with claims about reproductive rights and infrequently appear without such claims. On the other hand, there may be periods in which environmental claims appear frequently with anti-nuclear claims but also appear frequently without these claims as well. The Whitehead method would be able to distinguish between these two, identifying the first as an instance of agenda-setting spillover, while not necessarily identifying the second.
Strictly speaking, though, this method is not sensitive to the relative share each movement contributes to the association rate; instead, it treats overlapping relationships symmetrically. As stated above, it represents a ratio of events in which two entities interact with the total number of events in which either of the two entities participate. That is, the case of two movement claims that appear together 50% of the time and on their own 50% of the time is treated identically to the case of two movement claims where one appears on its own 0% of the time and the other appears on its own 75% of the time since in both cases the association rate will be .5. But, the calculation takes into account the joint frequency of both claims. Additionally, the association rate is a proportion, which, as we discussed previously, has some limitations.
We begin by calculating association rates (Ginsberg & Young, 1992) for each claim pair. The association rate is the proportion of time that both claims are observed divided by the time where either claim was observed. More formally, this can be expressed as:
where x is the number of events where both claims appear, N is the total number of events, and D is the number of events where neither claim appears. An association rate of 1 indicates that two claims are always seen together and never seen apart. The association rate is a specific application of the Jaccard Index, which, in set theoretical terms, is the ratio of the intersection to the union.
To deal with our concerns about error and co-occurrences too rare to constitute actual spillover, we assess whether these association rates are significantly higher than what we would expect from chance by generating random data conditioned on the row and column margins of the original data set (Bejder et al., 1998). For each data set, we generate 5,000 random graphs and calculate association rates for each. We count as spillover observed association rates that are greater than 90% of the association rates generated from the random graphs.
Correspondence analysis
The Whitehead method was, at a fundamental level, looking for not just co-occurrence, but some form of clustering in the data. While the Whitehead method measures how two specific movement claims interact, an argument can also be made for considering the relative position of claims within the field of all movement claims, treating overlapping relations among claims asymmetrically. Correspondence analysis does just this; it is a technique for analyzing associations between two categorical variables (Blasius & Greenacre, 1994) and involves a singular value decomposition of a two-way table of values. We use the χ2 distances from a correspondence analysis to compare similarities of claims based on the common events they appear in. Conceptually, two claims will have smaller (i.e., closer) χ2 distances if they similarly relate to other claims via protest events. Thus, claims will have small distances between them if they tend to appear in the same events together and tend not to appear in any events the other does not also appear in, much like the association rates calculated for the Whitehead method. In certain instances, agenda-setting spillover might result in two claims becoming so linked that they no longer are used alone. For example, current discussions around Black Lives Matter tightly link discussions of the civil rights of Black Americans with issues of criminal justice, such that one is rarely mentioned without the other. Correspondence analysis would capture such an instance of spillover.
To calculate χ2 distances, we use the yearly event-by-claim matrices described above. We remove claims that do not appear in any event and events that do not contain any claims from the matrix before performing a correspondence analysis, as correspondence analysis cannot be performed on matrices containing empty rows or columns. Because correspondence analysis also calculates a small χ2 distance between any claims that only act alone, we limit this analysis to claims that appeared in at least one dyad pair. χ2 distance between two rows is a measure of how similar the two rows are in terms of their column values—the more similar they are, the smaller their χ2 distance. We use this property to derive χ2 distances between claims based on their similarity of copresence in events. We calculate a χ2 distance between each claim pair, constructing a claim-by-claim matrix of χ2 distances.
To address our concerns about error and about ties so rare as to not meaningfully represent spillover, we use a χ2 distribution to identify significantly small χ2 distances. For each year, we use a distribution with degrees of freedom equal to the number of claims that get included in the correspondence analysis. If the distance falls within the first 5% of the cumulative distribution function, meaning they are closer than 95% of the distances in the distribution, we code the two claims as experiencing spillover in that year. We emphasize that we use the χ2 distribution as a means of detecting cases with unusually low distances as a strictly descriptive, rather than inferential, convention.
Cliques
Our fourth method involves identifying cliques in the network of copresent claims. While both the Whitehead and correspondence analysis methods were oriented toward clustering as evidence of spillover, focusing on relationships that go beyond merely having a high number of events in common to claims that do not often occur without one another, clique analysis even more heavily and explicitly focuses on clustering. Cliques in network analysis are groups of nodes in which all nodes in the group are tied to all other nodes in the group (Wasserman & Faust, 1994). Spillover in this context moves beyond the dyad, requiring at least three movements to experience spillover together. Clique analysis looks for and identifies a specific type of clusters in a network, shedding light on the network structure itself and, often, on factors creating that structure. In a workplace network, for example, identifying cliques of coworkers might lead us to the conclusion that proximity, department, status, or any number of demographic characteristics drives interaction.
Returning to our case of networks of social movement claims, this method is likely to identify instances of spillover resulting from broader coalitions of movements or broader issue orientations that might define a particular period of protest, similar to Snow and colleagues’ master frame (Snow & Benford, 1992). For example, concerns around women’s rights, lesbian, gay, bisexual, transgender, and queer rights, and poverty are often connected to issues of global justice, and so may all appear together in protests about global justice. A clique analysis of spillover would identify such co-occurrence while avoiding instances in which only two movement claims are co-occurring.
We begin with the adjacency matrices of claim co-occurrence. A tie exists between any claims that appeared together in at least one protest during the year. We search for all maximal cliques of at least size 3. Maximal cliques are cliques that are not themselves a part of a larger clique. In other words, there is no larger clique that contains the same nodes as the identified clique. We convert these cliques into a comembership claim-by-claim matrix, where a cell is coded 1 if the corresponding row and column claims were in at least one clique together, and 0 otherwise. We make this conversion to better compare these results to the results from other methods of identifying spillover. In order to deal with error and rarity, we counted as spillover any two claims that appeared in a clique together for at least two consecutive years to capture more stable associations. It is important to note that clique identification is already a very strong test of relationship, and so, we regard persistence of that identification alone as an indicator of real spillover.
Degree
Our final method takes a node-centered, instead of network-centered, approach to identify claims that have a high number of ties, measured by degree, in the claim-by-claim network. Degree refers to the total number of ties a node has to other nodes in a network (Wasserman & Faust, 1994). This conceptualization of spillover is more limited than the others, as it does not identify claim pairs that are experiencing spillover. Rather, it identifies a single claim that is spilling over as shown by a large number of connections to other claims. This method could be seen as identifying master claims around which several other movements mobilize during a particular period. For example, many movements organized around anti-war claims during the late 1960s and early 1970s.
Since we define a tie as two claims appearing in the same protest event, a claim’s degree is the total number of other claims with which the claim has appeared in events. To deal with concerns for error and rarity, we identified instances of spillover by comparing the degree of a claim to a binomial distribution with number of trials equal to the number of claims appearing in the year and the probability of success at .5. If the degree of a claim fell into the upper 5% of the binomial distribution function, we counted it as spillover.
Empirically Comparing Potential Methods
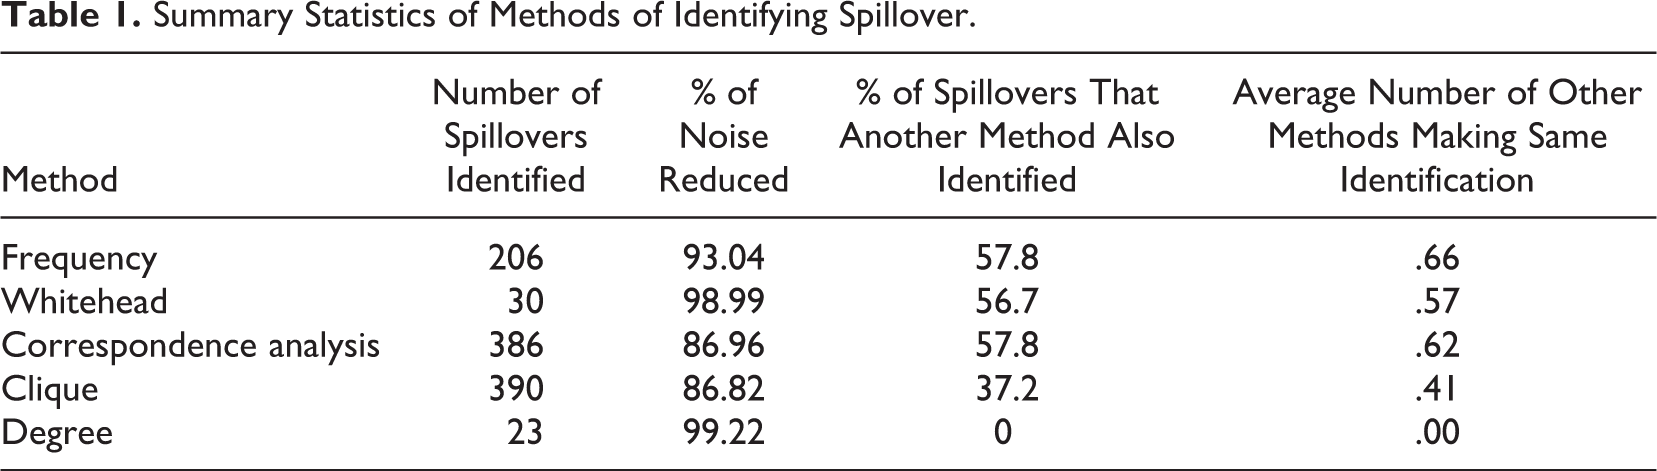
An important presumption of our approach is that one should not assume that any given method of identification a priori will be superior. In this section, we investigate how well each method reduces the noise in the data, in other words, the percentage reduction in the number of potential instances of spillover one would have to investigate using the method compared to investigating every co-occurrence of two movements in any given year (see Table 1, Column 2). Ideally, a method would remove the true noise of the data, whether that noise be introduced by error or ephemeral instances of spillover, without removing true instances of sustained spillover. Thus, we balance the reduction in noise by also comparing how often a given method identifies candidate instances of spillover (see Table 1, Column 1), whether methods tend to identify unique instances of spillover versus instances of spillover also identified by other methods (see Table 1, Column 3), and which methods had the most and least similar identification patterns (see Table 2). Although above we introduced the methods according to a theoretical ordering, here we switch the ordering to start with the worst performing method moving toward the best performing method.
Summary Statistics of Methods of Identifying Spillover.
Correlation of Spillover Identification Among Methods.
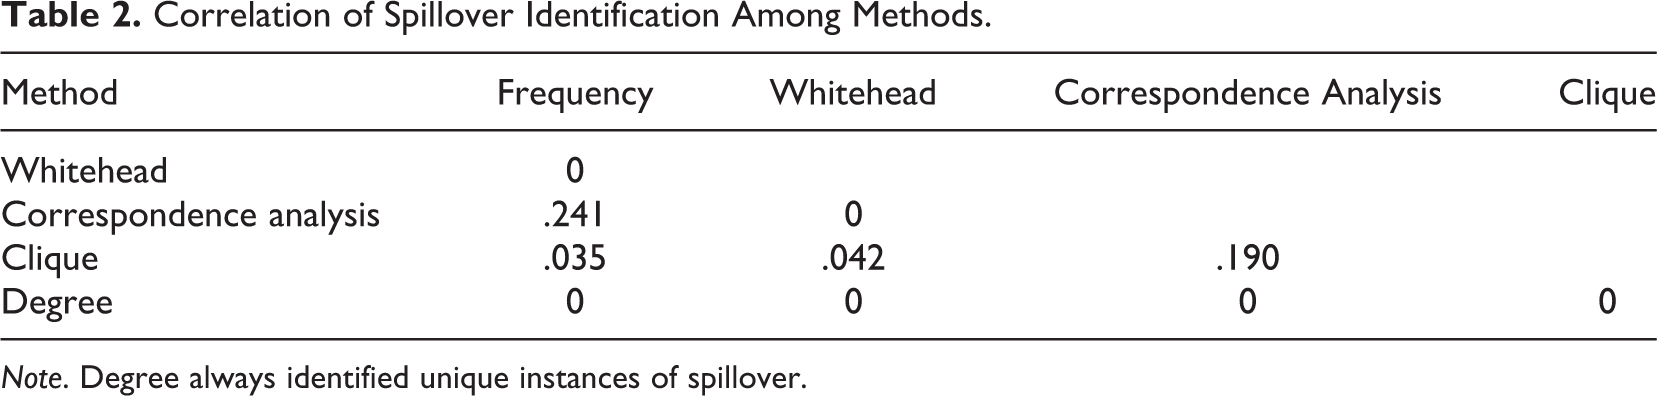
Note. Degree always identified unique instances of spillover.
Degree
Degree was the most conservative measure of any of the five methods we used to identify spillover (see Table 1). While the method does reduce the noise of the data by over 99%, by only identifying 23 separate instances of spillover, we consider this to be too conservative. Put more bluntly, it is likely that this method threw the baby out with the bathwater. It identified at least one movement in 22 years in our time frame but did not identify any cases of spillover at all in the remaining 14 years. When the method did identify at least one instance of spillover, it identified a single movement in every year except 1963, when the degree approach identified two separate movements. In nearly every year in which this method identified spillover, it pointed to the exact same movement grouping, which was a catchall category for “other social issue” (a coding category meant to capture not elsewhere classified issues). Since this is not an informative category, and even if it was, would be more akin to identifying agenda setting that was so powerful as to be considered a master frame, this method proved relatively unhelpful in studying spillover agenda setting.
Whitehead
The Whitehead method was one of the clustering-oriented methods we considered and is based on association rates and identified instances of spillover where two claims frequently appeared together and infrequently appeared alone. This method was the second most conservative of the methods identifying spillover dyads, marking only 30 dyad pairs as experiencing spillover throughout the entire 36-year period (see Table 1). Using the Whitehead method reduces the number of potential instances of spillover one would investigate by 98.99% compared to investigating any co-occurrence, which is likely to be overly aggressive. The most similar method was the clique method, though even this was not very similar: When either method identified spillover, only 4.2% of the time did both identify the dyad pair as experiencing spillover (see Table 2).
A common instance of spillover for the Whitehead method to identify was the peace and African American civil rights movements. In some cases, these were articles describing rallies in which both peace and civil rights groups were protesting without drawing direct connections between them (DoCA event ID # 6704018 and DoCA event ID # 6005051). In other cases, civil rights groups in the late 1960s described why opposing the Vietnam War was important for the civil rights movement (DoCA event ID # 6708098). Scholars have documented this case of agenda-setting spillover, as Martin Luther King, Jr., was a well-known critic of the war, as were activists affiliated with the Student Non-Violence Coordinating Committee (SNCC) and the Congress of Racial Equality (CORE) (Harrison, 1996). Put differently, this method was so conservative in its identifications, it could only find associations so obvious as to already be expected, and even studied, in the case-based literature on spillover.
Frequency
Frequency conceptualizes spillover as simple co-occurrence, looking for increasing co-occurrence from the prior year. Because of this, we cannot provide findings in 1960 because we lack a prior year from which to compare. Looking at results from 1961 through 1995, though, this method was a middle-of-the-road approach to identifying spillover (see Table 1). Compared to counting any co-occurrence as spillover, by limiting it to instances of statistically notable co-occurrence, we reduce the noise by 93% so that a researcher would only need to investigate 206 rather than over 2,000 possible instances of spillover. This is a level of noise reduction that is substantial but not likely to be so aggressive that it misses real trends in the data. In terms of actual dyad pairs that each method identifies, this approach is most similar to correspondence analysis, with 24.1% overlap across the dyad pairs (see Table 2). That is, when either frequency or correspondence analysis identifies spillover occurring from one movement to another, there is a 24% chance that both will identify the movement pair as experiencing spillover. More generally, 58% of the time frequency identifies spillover, so does at least one other method (see Table 1).
Importantly, though, even when frequency identifies a unique dyad pair, it appears to be identifying real cases of different movements sharing claims, not errors. For example, in 1968, this method was the only one to identify spillover across the environmental and peace movements. One of the events that triggered that identification involved a protest that included demands to preserve a neighborhood park and a call to immediately end the Vietnam War, which seems to be an unexpected—but legitimate—case of two disparate movements aligning at an event (DoCA event ID # 6803003). The Whitehead and correspondence analysis approaches did not identify this case of spillover because both the peace and environmental movements each frequently work independently. Clique analysis did not identify this pair because in this year, the environmental claim movement was never used with any other claim, so no movement claims other than peace have a direct connection to the environmental movement claim in 1968. Finally, the degree approach did not identify either of these movement claims as especially likely to experience spillover because other claims—especially the catch-all “other” category and African American civil rights—are invoked more frequently than either peace or environmental claims in this year. This case highlights how the different methods detect candidates for spillover in distinct ways and the importance of defining ahead of time the type of spillover most relevant to a specific research question, phenomenon, and data.
Clique analysis
This method is a theoretically stringent test, conceptualizing spillover as agenda setting that involves three or more movements rather than a dyad pair. As with frequency, clique analysis depended on patterns from previous years; thus, there are no results from clique analysis for 1960. Despite its theoretical stringency, empirically it was more prolific: Clique analysis identified more dyad pairs overall as experiencing spillover than any other method. This method also reduces the number of potential instances of spillover by 87% compared to investigating every co-occurrence, which represents a helpful reduction without being too aggressive at filtering out noise (see Table 1), presenting the researcher with 390 possible instances of spillover to investigate. Clique analysis is also the method that is most likely to identify unique dyad pairs experiencing spillover. Only 37% of the time that clique identifies spillover does another method also identify spillover. Clique had the most overlap with correspondence analysis; 19% of the time when either clique or correspondence analysis identified spillover, both identified spillover (see Table 2).
Along with other methods, clique analysis identified cases of spillover across the peace and civil rights movements in 1967, when Dr. Martin Luther King, Jr., called for a boycott of the war in Vietnam, arguing that poor people and racial minorities were paying the heaviest price for U.S. involvement (DoCA event ID # 6704012). That same year, a coalition of peace, civil rights, and antipoverty activists launched a program to oppose the renomination of President Johnson (DoCA event ID # 6704018). The clique analysis method also solely identified agenda-setting spillover occurring between the environmental movement and poverty and welfare movement, including protests of the expansion of Columbia University into a neighboring community in Harlem (DoCA event ID # 6711031), and a group of local citizens protesting the proposed building of a shopping center on a historical site on Long Island (DoCA event ID # 7107026).
Correspondence analysis
Correspondence analysis is based on χ2 distances of columns in the event-by-claim matrices, identifying instances of spillover, like the Whitehead method, in which two claims appeared frequently together and infrequently alone. While having some conceptual similarity to the Whitehead method, the results couldn’t be more starkly different. While the Whitehead method was the second most conservative estimator of spillover, correspondence analysis was the second most liberal method for identifying spillover (see Table 1). Similar to clique analysis, correspondence analysis reduced the potential instances of spillover to investigate by 87%, identifying only 386 possible instances of spillover. Furthermore, correspondence analysis was tied with frequency for the percentage of its spillover that other methods also identified. This is because correspondence analysis relaxes the clique requirement of having connections among 3+ movement claims, although it is still based on claims’ positions in the entire field of claims like other clustering algorithms such as clique analysis and the Whitehead method.
One example of spillover identified by correspondence analysis, as well as the frequency and clique methods, discussed a coalition created to advocate for more construction job opportunities in New York City for minorities. The coalition included organizations from the Black Civil Rights and Latinx Civil Rights, bridging these movements (DoCA event ID # 7208013).
Checking Validity
It is also important to evaluate whether the method returns true instances of spillover, which is often thought of as measuring validity, but in machine learning methods, it is commonly assessed through precision, recall, and F1 scores (see below for an explanation of how these are calculated). As discussed below, precision measures the rate of true positive identifications and recall focuses on false negatives; F1 evaluates the balance between these scores. We will use these scores, in addition to measuring noise reduction, to evaluate our measures, but first we’ll need a list of true instances of spillover.
To construct this list, a coder reviewed and manually checked each of the instances of spillover identified by the frequency, clique, correspondence analysis, or Whitehead method. To remove noise, we did not include spillover cases that involved one of the three catch-all categories (government, n.e.c; other misc. social issues; and other, n.e.c); since this includes the only potential spillover the degree method identified, we do not consider its validity having already judged the method theoretically uninformative. For each year-movement dyad predicted to have experienced spillover, we identified events that took place in that year and in which claims of the two movements were copresent.
We provided a coder with a list of the 717 events containing predicted instances of spillover, along with information about newspaper articles recording an instance of spillover across two claims. The coder located the original article and assessed whether two or more different movements’ claims were represented, with the following considered as valid instances: two or more movements planned and/or participated in a single event jointly; an affiliate of one social movement voiced concerns from another movement; activists or leaders of one movement were also involved in other movements, as in cross-movement coalitions; or a movement protested something or voiced concerns about a topic not typically in a movement’s wheelhouse. 5 Intercoder reliability tests showed an S score of 0.938 for this item (see more on reliability below).
For valid cases, the coder also recorded basic information about the files used (S = 1.0), whether there were additional candidate cases of spillover beyond the dyad pair (S = 0.925), and what the claims involved in any additional candidate for spillover were (S = 0.750). 6 Several other notes fields not used in these analyses were also coded. The overall intercoder reliability was strong (S = 0.919, N = 20 reliability cases). 7 In total, the coder determined that 636 of the 717 (89%) identified events with spillover were legitimate cases of spillover. 8 This means that the rate of error from the original data was about 4 times the rate of error from our methods overdetecting spillover.
We use the results of this coding as ground truth for evaluating the validity of our methods. Using the manually verified data, we consider our algorithms to have correctly identified a true instance of spillover for a year-movement dyad if any event associated with that year-movement dyad was manually verified to have had both movements copresent. To measure whether real instances of spillover were identified, we calculate precision, recall, and the F1 score (Ting, 2017) for each method as well as for combinations of methods. Precision is calculated as the percentage of cases predicted to have spillover that, in fact, do experience spillover. In other words, it is the percentage of predicted true cases the method correctly identified and is related to the false-positive rate of the method. Recall is calculated as the percentage of cases of real spillover the method identified as spillover 9 and is related to the false-negative rate of the method. The F1 score is the harmonic mean of precision and recall and is commonly used as a summary measure of the validity of data science algorithms.
Precision, Recall, and F1 Scores.
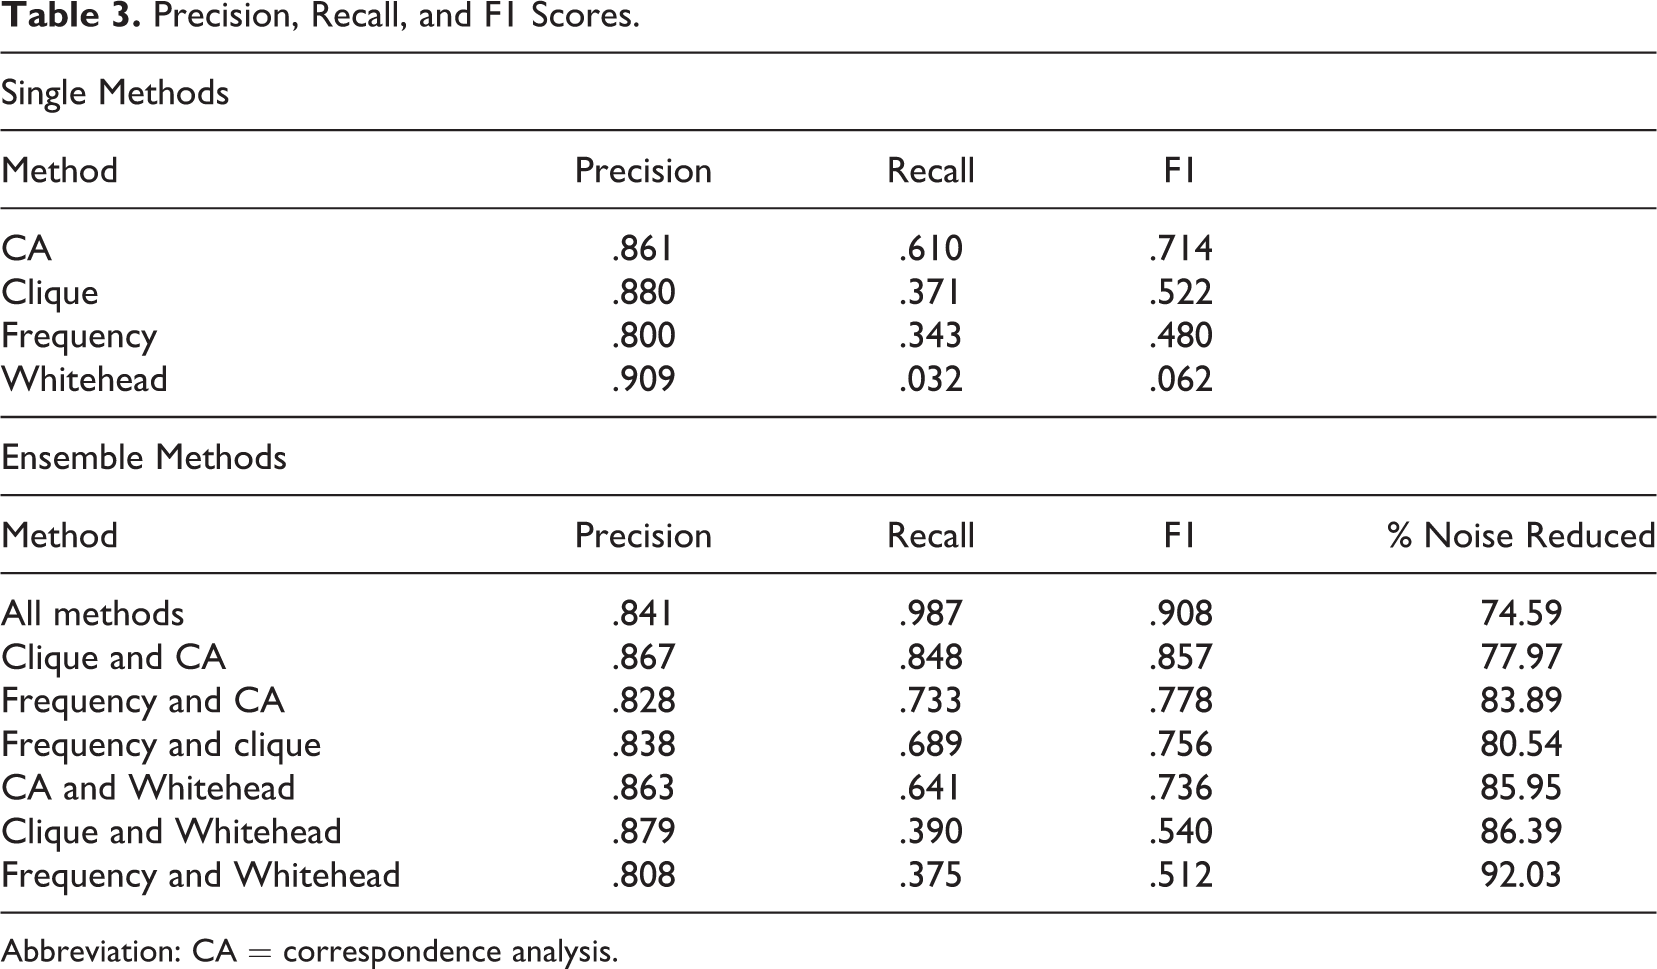
Abbreviation: CA = correspondence analysis.
Whitehead
Our analyses suggest that the Whitehead method is relatively unhelpful compared to other alternatives. While it had a slightly higher precision score of 0.909, it had the lowest recall score of 0.032. This gives Whitehead the lowest F1 score of all the methods we evaluated, 0.062. In terms of its poor recall score, it identified only 30 dyad pairs in the entire time period, averaging less than one instance of spillover per year. This may be due to the low association rates in the data we were working with: the average association rate across all years was 0.0037. With such low association rates, it is easy for the randomly generated data to produce higher association rates than those observed, with a correspondingly lower likelihood of marking observed association rates as significant. This implies that the Whitehead method is likely to perform better where observed association rates are higher, which makes it a less optimal method for studying rarer phenomena.
Frequency
Frequency was also a problematic measure. Frequency had the lowest precision of any method, 0.800, and its recall was only 0.343, meaning that it only identified about one third of the dyads that actually experienced spillover. This results in the second lowest F1 score, at 0.480. Like the Whitehead method, while our analyses show frequency is not a good measure for spillover, it might be useful in other studies. For instance, if one were interested in identifying overlaps without any consideration of how often either of those pairs also acts independently or with other movements, this is the only method we tested that would be tenable. Correspondence analysis and the Whitehead method both identify spillover among dyads that collaborate frequently and operate independently infrequently, and clique analysis identifies cliques of at least three movements that share concerns. Also, our specification privileged new associations, as we looked for significant increases in frequency of interaction between movements from one year to the next. However, researchers less focused on year-to-year change could entertain other specifications that would consider time in different ways, or not at all, since this method is fairly flexible.
Clique analysis
Clique analysis is the only approach that identifies dyad pairs via larger clusters of movements, which makes this method uniquely suited for identifying social phenomena that involve larger cliques of entities with shared characteristics. The clique method has the second highest precision score, 0.880, indicating that about 88% of the cases clique identifies as spillover are real cases of spillover. But, its recall is low at 0.371. This means that the clique method only identifies about 37% of real cases of spillover. This gives clique an F1 score of 0.522.
While not performing well enough on its own for our use, clique analysis, or a looser variation of cluster analysis, may still be a very useful method if a researcher has a working definition of a phenomenon that extends to “friends of friends:” that is, investigators may use this or a similar approach to identify several movements as belonging together if they don’t directly associate, but they do both associate with a third “mutual friend.”
Correspondence analysis
Like clique analysis, correspondence analysis takes into account the structure of the network beyond the dyad. Correspondence analysis measures how structurally similar two movement claims are within the entire network, and it achieved a similar precision score to clique: 0.861. Its recall score, though, is by far the highest at 0.610, indicating that identifies about 61% of real cases of spillover. This much higher recall with a still adequate precision gave correspondence analysis the highest F1 score of all the single methods, at 0.714.
Ensemble methods
In addition to calculating the precision, recall, and F1 scores for each method, we also consider each combination of two methods, a technique commonly called ensemble methods in machine learning. We also consider an “All Methods” ensemble that combines all of our approaches. Ensemble methods typically involve training two or more individual models and classifying data based on a (possibly weighted) vote of the models (Dietterich, 2000). For example, we can combine the clique and correspondence analysis methods and consider this ensemble to predict spillover if either method predicts spillover or only if both methods predict spillover. Ensemble methods can often perform better than single methods, as they allow multiple methods to overcome the limitations of any single method. Here, we count an ensemble method as predicting spillover if any of the constituent methods predict spillover.
While we calculated noise reduction, precision, recall, and F1 scores for all combinations of two methods (see Table 3), we only discuss the two highest performing ensembles as defined by F1 scores, which are the ensemble method containing all techniques and the ensemble method containing both clique and correspondence analysis. For the latter, readers will recall that clique and correspondence analysis both did a good job of reducing likely noise in the data but did so less aggressively than other methods. It appears from the ensemble results that using these two together is useful in threading the methodological needle such that there is ample noise reduction but meaningful signal is not as likely to be disregarded as with other methods. The ensemble reduced the noise by 78% compared to using all instances of overlap, representing significant noise reduction but not being so aggressive as to remove the signal. While not as high as the Whitehead method’s precision, the clique and correspondence analysis ensemble’s precision score is still quite good, at 0.867. But, the real benefit is in improving recall; using both clique and correspondence analysis raises the recall to 0.848, yielding an F1 score of 0.857. Interestingly, these two methods are also the two methods that take into account information beyond the specific movement dyad, which would have seemed to be a stricter theoretical test, and yet, as an ensemble they do very well. The clique method considers the way movements cluster in groups of three or more, while correspondence analysis considers the structural similarity of movements within the network as a whole. Combining them seems to have allowed the strengths of one to overcome the weakness of the other.
Another alternative is to use an ensemble where spillover is identified if any of our methods identify spillover, which given that recall was much lower than precision across measures, may be a wise decision. Of course, this slightly reduces precision—it has the third lowest precision score, of 0.841, of the ensembles we examined, but it gains substantially in recall, at 0.987. This gives a very strong F1 score of 0.908. The noise reduction was 75%, which, like the combination of clique and correspondence analysis, represents a significant reduction in noise without being overly aggressive.
Discussion and Conclusion
Big data and computational techniques are creating new research opportunities and challenges. In this article, we focus on a specific set of challenges—how can new techniques be used to study relatively rare and/or hard-to-identify phenomena? Often, these kinds of phenomena are understudied, and when studied, tend to be studied almost exclusively using qualitative methods that depend on the prior selection of cases. When studied quantitatively, studies have often used very coarse, and we argue error-prone, ways of identifying such phenomena. For instance, in our illustrative example of the examining of social movement spillover, what little quantitative research that does exist has examined any instance of co-occurrence instead of trying to sort between the noise of error and one-off collaborations and the signal of more enduring connections and influence.
Our approach, which we argue can be generalized to a wider variety of research topics, included a number of steps. First, we suggested that researchers review existing methods, both to enumerate disadvantages of existing methods and illuminate potential features to look for in new methods to overcome these disadvantages. In our example, we argued that existing methods overlooked too much potential spillover, don’t allow researchers to find unexpected cases, and limited researchers’ ability to understand how often spillover occurs.
Once existing methods have been reviewed, we recommend reconceptualizing the phenomenon such that theoretical properties can be identified. We recommend looking for “bottom-up” conceptualizations of the phenomenon, as these are likely to be easier to identify inductively from a large data set. In our example, this involved looking at the use of a claim at a movement event not indigenous to that movement, with the expectation that there is also some level of error in all data and that one-off or otherwise rare instances of potential spillover between two or more claims is less theoretically interesting than levels of occurrence that seem to go beyond thresholds of chance.
When using computational and social network methods to inductively identify cases, one needs data that are not necessarily “big” but large enough to find unexpected cases and also candidate methods that can locate instances of potential theoretical interest. In our example, we used data on protest events from DoCA and examined five techniques and ensembles of those techniques. Our case involved relational data, so many of our candidate methods were drawn from social network analysis. Other families of methods may be more appropriate for other types of data, such as machine learning classifiers for inductively identifying clustering in nonrelational data.
Part of pairing inductive identification with theory requires evaluating competing methods since each may assess aspects of a theoretical target differently and be better or worse at sorting through the noise of the data to find the signal of true, enduring instances of the phenomenon. Balancing noise reduction with preservation of true instances of the phenomenon, and on the fit between the theoretical processes generating the phenomenon and the methodological algorithm, is important for choosing the best method for the researcher’s case. In our case, some of the methods were far too conservative in identifying instances of spillover, greatly reducing the noise but at the expense of too few cases to study, which suggests they likely threw out signal alongside noise. We balanced the noise reduction of our methods with the number of instances of spillover identified, overlap with other candidate methods, and measures of validity to choose appropriate methods. In the end, our analysis suggested that two of the five methods were much better than the alternatives and that when these methods were used in an ensemble, results were even better. Even stronger results came from an ensemble that combined all techniques.
An unanticipated advantage of our work was also the identification of coding procedures that reduced the usability of the data we analyzed. Specifically, the data set we used allowed coders to assign a catchall category “1330 other” that includes a number of “miscellaneous social issues,” as diverse as tax increases, homelessness, and healthy school lunches. There is also a code for other claims that are not social issues such as concerns about historic preservation or infrastructure. Many protest events are coded with one of these claims, but this coding is not very informative. While this was likely done in the original coding because not all issues could be anticipated and longer lists of coding categories may influence training, coding time, and reliability, there may be ways to preserve later use for secondary users such as allowing a free text description when “not elsewhere classified” coding categories are used. If fed back into research, this could make computational research even more useful to the research process. Similarly, when considering using this method to analyze secondary data, it is important to consider whether the data are precisely coded or relatively unclassified, and what implications that will have for the utility of this method.
We argue there is also a larger debate that our work bears on—the simmering debate over the implications of big data and computational methods for theory in social science research. The rise of big data, and the development of sophisticated computational tools more generally (Earl, 2018), has led to concerns about the demise of theory and deductive research. Chris Anderson’s Wired article, “The End of Theory” sounded an alarm bell inside and outside of the academy about the potential implications of the “petabyte age” (Anderson, 2008), claiming that hypothesis-driven research would be unnecessary with enough data. Whether in the physical sciences (Mazzocchi, 2015) or social sciences (boyd & Crawford, 2012), diverse commentators have alternatively worried (boyd & Crawford, 2012) and relished (Hesse et al., 2015) the changes big data could bring to the role of theory. At its heart, much of data science is about applying inductive reasoning (through machine learning or other techniques) in hopes of extracting insights from large troves of data. For many, this sits in fundamental contrast to the scientific method’s focus on deductive reasoning and hypothesis testing. While contesting the inevitability of the decline of theory and hypothesis-driven research, Mazzocchi (2015) articulates concerns similar to Anderson’s: Big Data science renews the primacy of inductive reasoning in the form of technology-based empiricism and has inspired a view of the future in which automated data mining will lead directly to new discoveries. According to this view, the new “hypothesis-neutral” way of creating knowledge will replace traditional hypothesis-driven research (p. 1250).
Reactions to this growing contest between inductive and deductive reasoning, and between data science and the classic scientific method, have varied from critiques of theory-less data science (boyd & Crawford, 2012), to arguments about how data science can be used in ways that support theory (Rojas, 2015; Sandra, 2013), such as through better visualization of complex ideas and data (Williamson, 2014). Indeed, while Anderson positioned his concerns as stemming from the “petabyte age,” one may be concerned that data of much smaller scales (see White & Breckenridge, 2014, for a sense of scales more common in the social sciences) may still be approached with computational tools that provoke many of the same concerns about the role of theory (Oboler, 2012).
It is important to note, though, that this is not the first time the social sciences, and sociology particularly, have seen unnecessarily adversarial portrayals of methodological approaches. Quantitative/qualitative divides have animated divisions among some in the social sciences for decades, sometimes in quite hyperbolic ways (Bryman, 1984; Smith & Heshusius, 1986; Wilson, 1986) even though many have come to see this alleged division as unnecessary, not inherent, and/or irrelevant.
We see the debate about inductive versus deductive computational approaches as analogous and also as ultimately counterproductive. We argue that research designs that couple theory with inductive elements can be very scientifically productive, allowing theoretically meaningful targets to be located in unanticipated places in data sets (which is more inductive) and then deductively studied. Just as most scholars have moved past seeing quantitative and qualitative traditions as in opposition, often instead productively using these methods side by side within the same project, we argue that inductive and deductive reasoning are not oppositional enterprises, and computationally intensive research can draw on both inductive and deductive elements within the same larger project, just as quantitative and qualitative methods often are codeployed.
At the broadest level, we argue that much promise lays in not seeing inductive and deductive techniques as in opposition but rather as in collaboration using computational methods guided by theory. Thus, while many have argued about either the peril or promise of the move to more inductive research, we approach this debate differently. Indeed, while we focused on empirically uncovering instances of agenda-setting spillover across social movements—some expected, others surprising, the general approach we describe could be employed to investigate a wide array of social phenomena and bridge the gap between inductive and deductive research while also facilitating formal analyses of rare and/or hard-to-identify phenomena. For example, we can imagine researchers using a similar approach to uncover communities of individuals or organizations linked to common themes via social media or blog posts, where the starting data set is a matrix of actors to keywords or topic codes that express a concern of interest, whether or not the actors are actually connected to one another. Another possible application would be to look for the diffusion of ideas across organizational bodies without precisely being able to define or measure a tie of interest, which can be truly problematic in incomplete networks, massive networks, dark networks that intentionally obfuscate connections, or networks where multiplex ties are common and it is unclear which type of ties are most meaningful for a particular problem. Future research can undoubtedly reveal more possible applications.
We hope, however, that the general research process we describe—one that blends inductive and deductive approaches instead of seeing them as oppositional and focuses on identifying rare events through winnowing noise and maximizing signal detection—is useful to an even larger array of research. Although there may be instances in which purely inductive techniques on large data sets may be appropriate, we suspect that there are far more cases in which theoretically informed but still ground-up and relative inductive computational hunts can yield the identification of unexpected cases that then become available for deductive analysis.
Footnotes
Authors’ Note
We would like to thank Heidi Reynolds-Stenson for her research assistance on this article; Ron Breiger, Joe Galaskiewicz, and David Tindall for comments and conversations about this project; and the participants of three workshops who provided feedback on earlier versions of this project: The Collective Action Network Between Online and Offline Interactions Workshop held at the University of Trento in Trento, Italy, in March 2015; the MoveOut Workshop on Movement Outcomes held at Uppsala University in Uppsala, Sweden, in September 2012; and the MOVEOUT Workshop held at the University of Geneva in Geneva, Switzerland, in February, 2010.
Declaration of Conflicting Interests
The authors declared no potential conflicts of interest with respect to the research, authorship, and/or publication of this article.
Funding
The authors received no financial support for the research, authorship, and/or publication of this article.
Software Information
The analysis in this article was performed in R using the network, igraph, and ca packages available on CRAN, and the whassocr package available at ![]() . To identify cliques, we used the max_cliques function from the igraph package. To calculate the degree of movements, we used the degree function from the igraph package. We use the ca function from the ca package to perform correspondence analysis on the data. We use the makeAssociation function from the whassocr package to calculate association rates between movements for the Whitehead method and the randomGraphs function from the same package to generate random graphs to use in determining association rate thresholds for identifying spillover.
. To identify cliques, we used the max_cliques function from the igraph package. To calculate the degree of movements, we used the degree function from the igraph package. We use the ca function from the ca package to perform correspondence analysis on the data. We use the makeAssociation function from the whassocr package to calculate association rates between movements for the Whitehead method and the randomGraphs function from the same package to generate random graphs to use in determining association rate thresholds for identifying spillover.