



Abstract
We explore data collected as an administrative by-product of an online job advertisement portal with dominant market coverage in Slovakia. Specifically, we process information on the aggregate quarterly registered number of online job vacancies. We assess the potential of this information in predicting official vacancy, employment and unemployment statistics. We compare the characteristics of the online job posting data with those reported in comparable studies conducted for the Netherlands and Italy. Several differences are identified; most notably, our data are more persistent and stationary around a linear time trend. Additionally, we assess the predictive potential of the online job posting data by comparing in- and out-of-sample estimates of three regression models that predict job vacancy statistics and employment and unemployment levels one to four quarters ahead. Irrespective of the predictive horizon and labour market indicator, the online job posting data always provide a statistically significant predictor. These results are further solidified in an out-of-sample study that shows that forecast errors are lowest for predictions generated by models incorporating online job posting data. In general, the usefulness of the data seems best for longer forecast horizons.
Introduction
As our everyday activities are increasingly conducted online, ever larger bodies of data are collected behind the scenes. These data are alluring for scientists in various fields. This paper explores data collected as an administrative by-product of an online job advertisement portal. We aim to assess whether information retrieved from such a dataset, specifically the aggregate quarterly registered number of online job vacancy (OJV) postings, has the ability to predict labour market development captured by official job vacancy statistics together with selected key labour market indicators. Accurate and timely predictions of labour market development are of interest to policymakers as they allow them to prepare and implement proper policy actions. Current models tend to rely on data that are reported with considerable time lags. For example, the official number of job vacancies for the first quarter is known only later in the second quarter. OJV data are not subject to these shortcomings and are known in real-time.
Job-filling (on the side of the employer) and job-searching (potential employee) behaviour differs across labour market participants. For example, an employer might use internal resources (e.g. employee referrals and internal databases) or information from labour offices to find suitable employees. However, a recently popular alternative is to post open job vacancies on a specialized web-based portal (Kuhn, 2014), with larger numbers of such open positions being associated with higher labour demand. If these positions are eventually filled, employment might increase and unemployment decrease. As the development of the labour market is persistent, it is likely that, if such job vacancies are also reported to labour offices, we might observe an increase in official job vacancy statistics in the upcoming quarters (Cedefop, 2019). Depending on the labour market conditions, information about online job vacancies might be helpful in the short- or long-term. For example, when demand for labour is higher, it might take longer for employers to find suitable employees; thus, employment and unemployment statistics might lag behind online job vacancies by several quarters.
We see our main contribution in two ways. First, we join an emerging stream of case studies offering evidence on the relationship between the number of OJVs and official job vacancy statistics (De Pedraza et al., 2019; Lovaglio et al., 2020). We bring new data from Slovakia, and our methodology differs from previous studies as we control for seasonality and, most notably, explore out-of-sample usefulness of OJV data. Second, we extend the attention from predicting future realizations of official job vacancy statistics to predicting future values of other labour market–relevant indicators, such as employment and unemployment rates; this has not been done before in the context of OJV data. While the potential of other online data, such as trends in internet searches or social networks, in predicting unemployment was explored in the past (e.g. Askitas & Zimmermann, 2009; Bokányi et al., 2017; Caperna et al., 2020; Fondeur & Karamé, 2013; Tuhkuri, 2016), we are not aware of any study exploring trends in the total number of OJVs specifically to predict unemployment or employment.
The following section provides an overview of studies dealing with online data and specifically OJV data. We describe the data used in the empirical part of the study in the Data section. The methodology and our empirical strategy are explained next. In the Results section, we first characterise our data and compare their characteristics with those reported in other studies. Second, we provide in-sample and out-of-sample evidence on the usefulness of OJV for the purpose of predicting future realizations of official job vacancy statistics. Third, we discuss our results. The final section concludes.
Online data in labour market analysis
With the internet penetrating everyday life, new, big-data sources have emerged to be explored for potential uses (Askitas & Zimmermann, 2015). Among the studies covering internet data, we distinguish those covering the internet as a data source by itself and those using the internet to collect research data (Hooley, Marriott, and Wellens 2012). Examples of the latter are current web-based surveys such as Glassdoor or WageIndicator, designed to collect wage information from internet users 1 . The research presented here can be classified as the first type; we explore internet data collected as a by-product of the internet’s everyday operation.
Empirical studies exploring internet-based nonjob-vacancy data
Among studies exploring the internet as a data source, the pioneering stream of studies explored trends in online search data to forecast labour market development. For example, Choi and Varian (2012) and Schmidt and Vosen (2013) predict the development of the economic cycle. For the purpose of predicting unemployment, online search data are explored at the European level by Tuhkuri (2016), at the country level by Askitas and Zimmermann (2009) and Fondeur and Karamé (2013) and specifically in the context of the COVID-19 pandemic by Caperna et al. (2020).
Another, more recent, stream of studies utilises data collected by social networks. For example, Twitter data have become popular because of their high frequency and rich content; for example, Barberá and Rivero (2015), Blank (2017), and Rafail (2018). Antenucci et al. (2014) use Twitter data to create indices of job search, job loss and job postings in the US with references to the positioning of the Beveridge curve. Bokányi and coauthors (2017) explore workday Twitter activity to predict US country-level unemployment and employment. An overview of the studies employing nonvacancy data for labour market analysis has been prepared by Lenaerts et al. (2016).
More recently, with the expansion of platform work, internet data have gained additional momentum in labour market analyses. Data from online platforms have been used to create the Online Labour Index as a measure of online labour demand 2 . Moreover, the complexity of these data offers the opportunity to perform advanced structural analysis, for example, in terms of skills demanded online (Stephany, 2020). In this aspect, online platform data are compared to online job vacancy data.
Utilisation of online job vacancy data in labour market analysis
Online job vacancy data are created as a by-product of an online job search. Although commercial providers dominate the OJV market (Cedefop, 2019), examples of data exported for research purposes are becoming more numerous. From the perspective of labour market analysis, OJV data present an even richer source of information than data acquired from online search (e.g. Google Trends) or social networks (e.g. Twitter) because they document a substantial share of the hiring process. Moreover, OJV data are specifically related to the labour market, while data from general search activity and social networks (although still useful) tend to be noisier. Additionally, Kuhn (2014) shows that the importance of the internet in job search is increasing over time, suggesting an increasing relevance of OJV data for labour market analysis.
As a result, a wide variety of OJV data-based studies have emerged in recent years, with references to classical concepts of economic theory. These studies explore the granularity of OJV postings as one of their main advantages over vacancy survey data. Turrell et al. (2019) show the potential of OJV data for explorations of regional labour markets by computing regional Beveridge curves for UK regions and detailed occupational groups. Extracting information on offered salaries allows us to plot the Phillips curves of regional and occupational labour market segments (Faryna et al., 2020) or estimate the Mincerian earnings equations complemented by unconventional explanatory variables of skill requirements as phrased in OJVs (Deming & Kahn, 2018). Hershbein and Kahn (2018) provide evidence in support of routine-biased technological change by exploring an increase in skill requirements as phrased in OJVs at detailed regional and occupational levels.
The rich granularity of OJV data is attractive for explorations of occupational segmentation. Marinescu and Wolthoff (2016) claim that job titles explain more than 90% of the variance in offered wages. Rather than the top-down occupational classifications used by official statistics, Turrell and coauthors apply empirically driven, bottom-up occupational clustering based on OJV skills descriptions to infer labour market segmentation and occupational dynamics in the UK (Turrell et al., 2018).
Additionally, the firm-level information embedded in OJVs has attracted recent attention. Using data on the ‘near-universe’ of US OJVs collected by an OJV aggregator, Azar and coauthors (2020) explore labour market concentration by calculating the Herfindahl-Hirschman index for recruiting employers (Azar et al., 2020). Deming and Kahn (2018) point to high within-occupational heterogeneity in skill requirements phrased in OJVs and show that variation in skill demands is positively correlated with measures of firm performance. Turrell, Speigner, et al. (2018) use counterfactual simulations to claim that regional skills mismatch, rather than occupational mismatch, limits growth in the UK’s productivity.
While high granularity is considered the main advantage of OJV data, questions over their representativeness seems to point to their main weakness. Kureková et al. (2015) provide an overview of studies exploring OJV data, listing their strategies to assess or increase the data representativeness. Although each OJV data source is specific, some common features can be identified. For example, jobs in the public sector or traditional occupations (e.g. clergy, medical doctor or teaching jobs) are often underrepresented among job postings. Available studies try to assess the data representativeness against the structure of employment known from official statistics. The revealed shortcomings are, in some cases, addressed by observation weighting. Alternatively, other studies pick a labour market segment, which is a less problematic approach from the perspective of representativeness (e.g. Fabo, et al., 2017).
Studies analysing trends in the aggregate number of online job vacancies
The issue of representativeness is less of a concern at the level of analysing aggregate trends in OJV data. This approach is taken, for example, by DePedraza et al. (2019) and Lovaglio et al. (2020), who explore the association of country-level OJV data and official vacancy statistics. They both use data from dominant commercial OJV providers in their countries and find a strong correlation between OJV and vacancy statistics over time. Additionally, Lovaglio et al. (2020) perform an analysis at the level of economic sectors, pointing out sectors where OJVs perform better than in others.
In this context, we present an additional case study exploring the potential of country-specific OJV statistics in predicting future realizations of official statistical indicators. We report evidence comparable to that in DePedraza et al. (2019) and Lovaglio et al. (2020). Relative to these authors, we go beyond comparing time series components and correlations and assess the predictive potential of OJV data by performing an in- and out-of-sample regression analysis.
While there is a rather larger stream of studies using search trends or social network data to predict unemployment (e.g. Askitas et al. 2009; Tuhkuri, 2016; Bokányi et al., 2017; or Caperna et al., 2020), studies exploring the potential of OJV data in predicting labour market indicators beyond official vacancy statistics remain limited. We contribute to this relatively undernourished stream by exploring the potential for prediction of job vacancy statistics and official statistics on two key labour market indicators: employment and unemployment.
Data
We aim to assess the ability of OJV postings to capture and predict the development of official job vacancy, employment and unemployment statistics, which we jointly refer to as key labour market indicators. In this section, we describe the data used in the empirical part of the study. Our analysis is based on data at quarterly frequency starting at the beginning of 2010 and ending at the end of 2020. The specific nature of our OJV data source limits the geographical scope of our study to a particular European Union (EU) member country. The start date of the sample is determined by the earliest availability of online job vacancy data from the focal online job advertisement portal in Slovakia (profesia.sk).
Dependent variables: Job vacancy, employment and unemployment statistics
Job vacancy statistics (JVSs) represent the number of vacancies in the stock of jobs at the end of each quarter. The corresponding data are available from Eurostat (table ‘jvs_q_nace2’), the statistical office of the European Union. The data collection covers employers of all sizes in all economic sectors. Different countries across the EU use various data collection techniques; in the case of Slovakia, JVSs are collected via an electronic reporting system covering all employers with more than 100 employees, and a sampling survey collects information from smaller employers Eurostat (2021a).
The number of employed persons (EM) and the number of unemployed persons (UN) are acquired from the European Union Labour Force Survey (LFS) Eurostat (2021b).
Independent variables: Online job vacancies, inflow into registered unemployment
In the case of OJVs, the number of vacancies is a flow measure recorded at monthly frequency since each vacancy (posted by employers) has to be renewed after one month if it remains open. Data were provided by the private company Profesia a.s., which administers a commercial job advertisement portal at https://www.profesia.sk/en/. A vacancy open through the whole quarter is, therefore, counted three times. Because of the monthly frequency of observations, the quarterly OJV figure is comparable to the sum of three stock observations. In fact, the number of OJVs is approximately three times higher than the corresponding JVS figure. Using the web-based platform, job seekers scan through open job vacancies. If the job vacancy is no longer available, employers can retract it from being active.
There are other web-based services that compete with profesia.sk, most notably kariera.sk, istp.sk and ponuky.sk. Nevertheless, the dominant position of profesia.sk is implied by a comparison of the search volume indices from Google searches, which potentially serve as a proxy for market share. Search volume indices are normalised indices that range from 0 to 100 (the maximum search volume over the given period). Out of the four search terms, ‘profesia.sk’ is searched the most. On average, 77.21% of searches in the sample period went to profesia.sk, 13.43% to kariera.sk, 6.60% to istp.sk and 2.76% to ponuky.sk.
Even though profesia.sk has a dominant market position, one might question the representativeness of OJV data in general. Earlier studies (Beblavý et al., 2016; Fabo et al., 2017; M. iroslav. Štefánik 2012) explore the representativeness of these particular OJV data. The issue appears to be most pronounced in terms of economic sectors. M. iroslav. Štefánik (2012) finds that while 54% of the surveyed labour force works in the public sector, only 7.6% of the advertisements published by profesia.sk were related to the public sector. This suggests that vacancies within public services are likely to be filled through channels other than OJV postings. On the other hand, private services and sales appear to be overrepresented in the OJV data. The implication for our study is that OJVs likely offer a noisy approximation of true labour demand. However, despite this shortcoming, the question of whether OJVs are still useful in predicting JVSs and employment and unemployment levels is an empirical one, and it is the purpose of this study to answer it.
Finally, in our specification, we also consider as an additional variable the number of persons flowing into registered unemployment (UI), which is a close analogue to initial claims for unemployment benefits in the US. In our case, we use the number of persons registered as unemployed by the Slovak public employment service during the respective quarter. Importantly, claims for unemployment benefits are known only two weeks after the reporting period. Therefore, similar to OJVs, they can be used as a proxy for as yet unknown job vacancy statistics (which are reported only much later).
Methodology
Predictive regressions
We assess the OJV time series as a potential predictor of the indicators of interest in a linear regression framework. Our assessment is based on a comparison of predictions acquired from three models. Model 1, our benchmark, is an autoregressive model, where the most general form can be expressed as

Here, the dependent variable Y t+h is one of our key labour market indicators, job vacancy statistics (JVS), employment (EM) or unemployment (UN), at time t+h, where h = 1, 2, 3, 4. Thus, we are interested in predicting future realizations of labour market indicators in the next one to four quarters after time t. Multiple-horizon predictions are particularly useful in practice, as policymakers might require a longer response time to implement relevant policies. The autoregressive part does not include the first-order autoregressive term Y t , only the second-order autoregressive term Yt-1. This is motivated by the fact that all three labour market indicators are reported with a considerable delay, unlike online job posting data and claims for unemployment benefits. Therefore, for the practical purposes of this ‘nowcasting’ exercise, we use only data known at time t when the prediction is made.
Our baseline specifications include a linear time trend t, which we deem needed based on the KPSS unit root test (see the Results section) of Sul et al. (2005). 3 We allow seasonal dummy variables in the interaction form Qi,t+hYt-1, where Qi,t+h is an indicator variable taking 1 if t+h corresponds to the ith quarter and 0 otherwise. Note that the baseline specification of Model 1 changes from one labour market variable to another. The reason is that the seasonality pattern differs for each labour variable. Therefore, we consider all combinations of seasonality patterns and select the one preferred based on the Bayesian information criterion of Schwarz (1978).
A popular model in the existing literature is the autoregressive integrated moving average model with exogenous variables (ARIMAX), as in, for example, Anvik and Gjelstad (2010), D'Amuri (2009), D'Amuri and Marcucci (2010) and (Vicente et al., 2015). However, this specification is not feasible in our context. First, the ARIMAX models are estimated via maximum likelihood, which requires a large sample size, while instead of monthly data, we have a sample at quarterly frequency, with considerably fewer observations. Second, with ARIMAX, the author(s) assume that the series is integrated of order one, that is, that the original time series (level of JVS) has a stochastic trend (unit root). This is not true in our case, as we identify, after accounting for linear time trends, that the series does not contain a unit root. Therefore, the proper handling of this series is not differencing, which would introduce a unit root into the moving average representation (see Hamilton, 1994, p.444). Additionally, one could perceive our baseline specification as a restriction of an ARIMAX model, specifically as an ARX model, that is, an autoregressive model with exogenous variables, estimated via ordinary least squares. Finally, Caperna et al. (2020) have recently used a simple autoregressive model as the benchmark in their out-of-sample study (see Table F2 in Caperna et al., 2020).
We consider two alternative model specifications. Model 2 enhances the baseline model by including data from online job vacancies. The most general representation of Model 2 is

Here, we use the OJV t variable for time period t, that is, the time period when the ‘prediction’ is made, as opposed to t-1 for the lagged labour market variable, which is known only later. If the λ1 coefficient is statistically significant, the online job vacancy data contain relevant information for predicting future levels of the given key labour market indicator.
The third competing model, Model 3, enhances the previous model by adding data on the inflow to registered unemployment

The inflow of unemployed persons registered by the Slovak public employment service presents the closest possible analogue of claims for unemployment benefits published in the US. In Slovakia, the number of unemployment claims is not published and therefore is not as important a policy indicator as in the US. Nevertheless, the UI t variable is added to Model 3 to provide an idea of the explanatory power of early information about unemployment dynamics. In estimating Model 3, we are interested not only in the significance and role of the unemployment inflow but also in whether the size and significance of the λ1 coefficient changes. As before, we use the UI t variable for time t, as claims for unemployment benefits are known two weeks after the reporting period.
All models are estimated via ordinary least squares. Given the time series nature of our model, coefficient significances are estimated with a bootstrap procedure, where random blocks of data are drawn from the initial dataset, with variable block lengths. The block lengths are randomly drawn from a geometric distribution, with an expected value estimated as suggested by Politis and White (2004) and Patton et al. (2009), and the implementation in R of Hayfield and Racine (2008).
Out-of-sample prediction procedure and evaluation
We perform an assessment of the predictive potential of OJV data by generating out-of-sample predictions of Yt+h for the period starting from the first quarter of 2013 until the end of our observation period (the fourth quarter of 2020). After each quarter, we re-estimate our model by adding additional observations, that is, expanding the estimation window. Forecasts are generated based on the three model specifications described in the previous section.
The out-of-sample predictions are assessed based on absolute and mean square error loss functions. Specifically, let Yt+h
Model
denote the predicted labour market indicator based on a given model. The absolute error is defined as

The square error is

The two loss functions are widely used, with the latter giving higher weight to larger forecast errors. We report the average mean and square errors, denoted as MAE and MSE, and percentage differences with respect to the baseline Model 1.
To assess whether competing Models 2 and 3 offer statistically relevant forecast improvements upon Model 1, we rely on the model confidence set (MCS) approach of Hansen et al. (2011). The MCS approach is an algorithm that, given a certain confidence level, iteratively eliminates the worst models until a superior set of models is identified, where all models provide statistically indistinguishable forecast errors. Our initial set of models consists of Models 1, 2 and 3, and we are interested in whether Model 2 or 3 is part of the superior set of models. If so, it suggests that models that use OJV data provide superior forecasting accuracy, that is, OJV data are useful in an out-of-sample context. Our implementation is based on the procedures of Bernardi and Catania (2018).
Results
We first present the baseline results, with the aim of comparing our data, specifically the JVS and OJV data, with those of DePedraza et al. (2019) and Lovaglio et al. (2020). Both studies limit their attention to the comparison of OJV data with JVS data produced by Eurostat. In this paper, additionally, we explore the predictive potential of the total number of OJVs for selected key labour market indicators. Therefore, the second section describes our in-sample analysis based on linear regression models, where we predict not only JVS but also employment and unemployment statistics. This section provides additional insight through an out-of-sample study.
Data characteristics: Comparison to previous studies
Our observation period covers a relatively homogeneous period of steady development in the wake of the 2009 economic crisis, disrupted by the massive shock of the COVID-19 pandemic. The number of vacancies jointly grew for both indicators (JVS and OJV) until the end of 2019. The impact of the COVID-19 pandemic can be spotted at the very end of the observation period (see Figure 1), starting with the second quarter of 2020. The end of our observation period is the fourth quarter of 2020. OJV and JVS time series.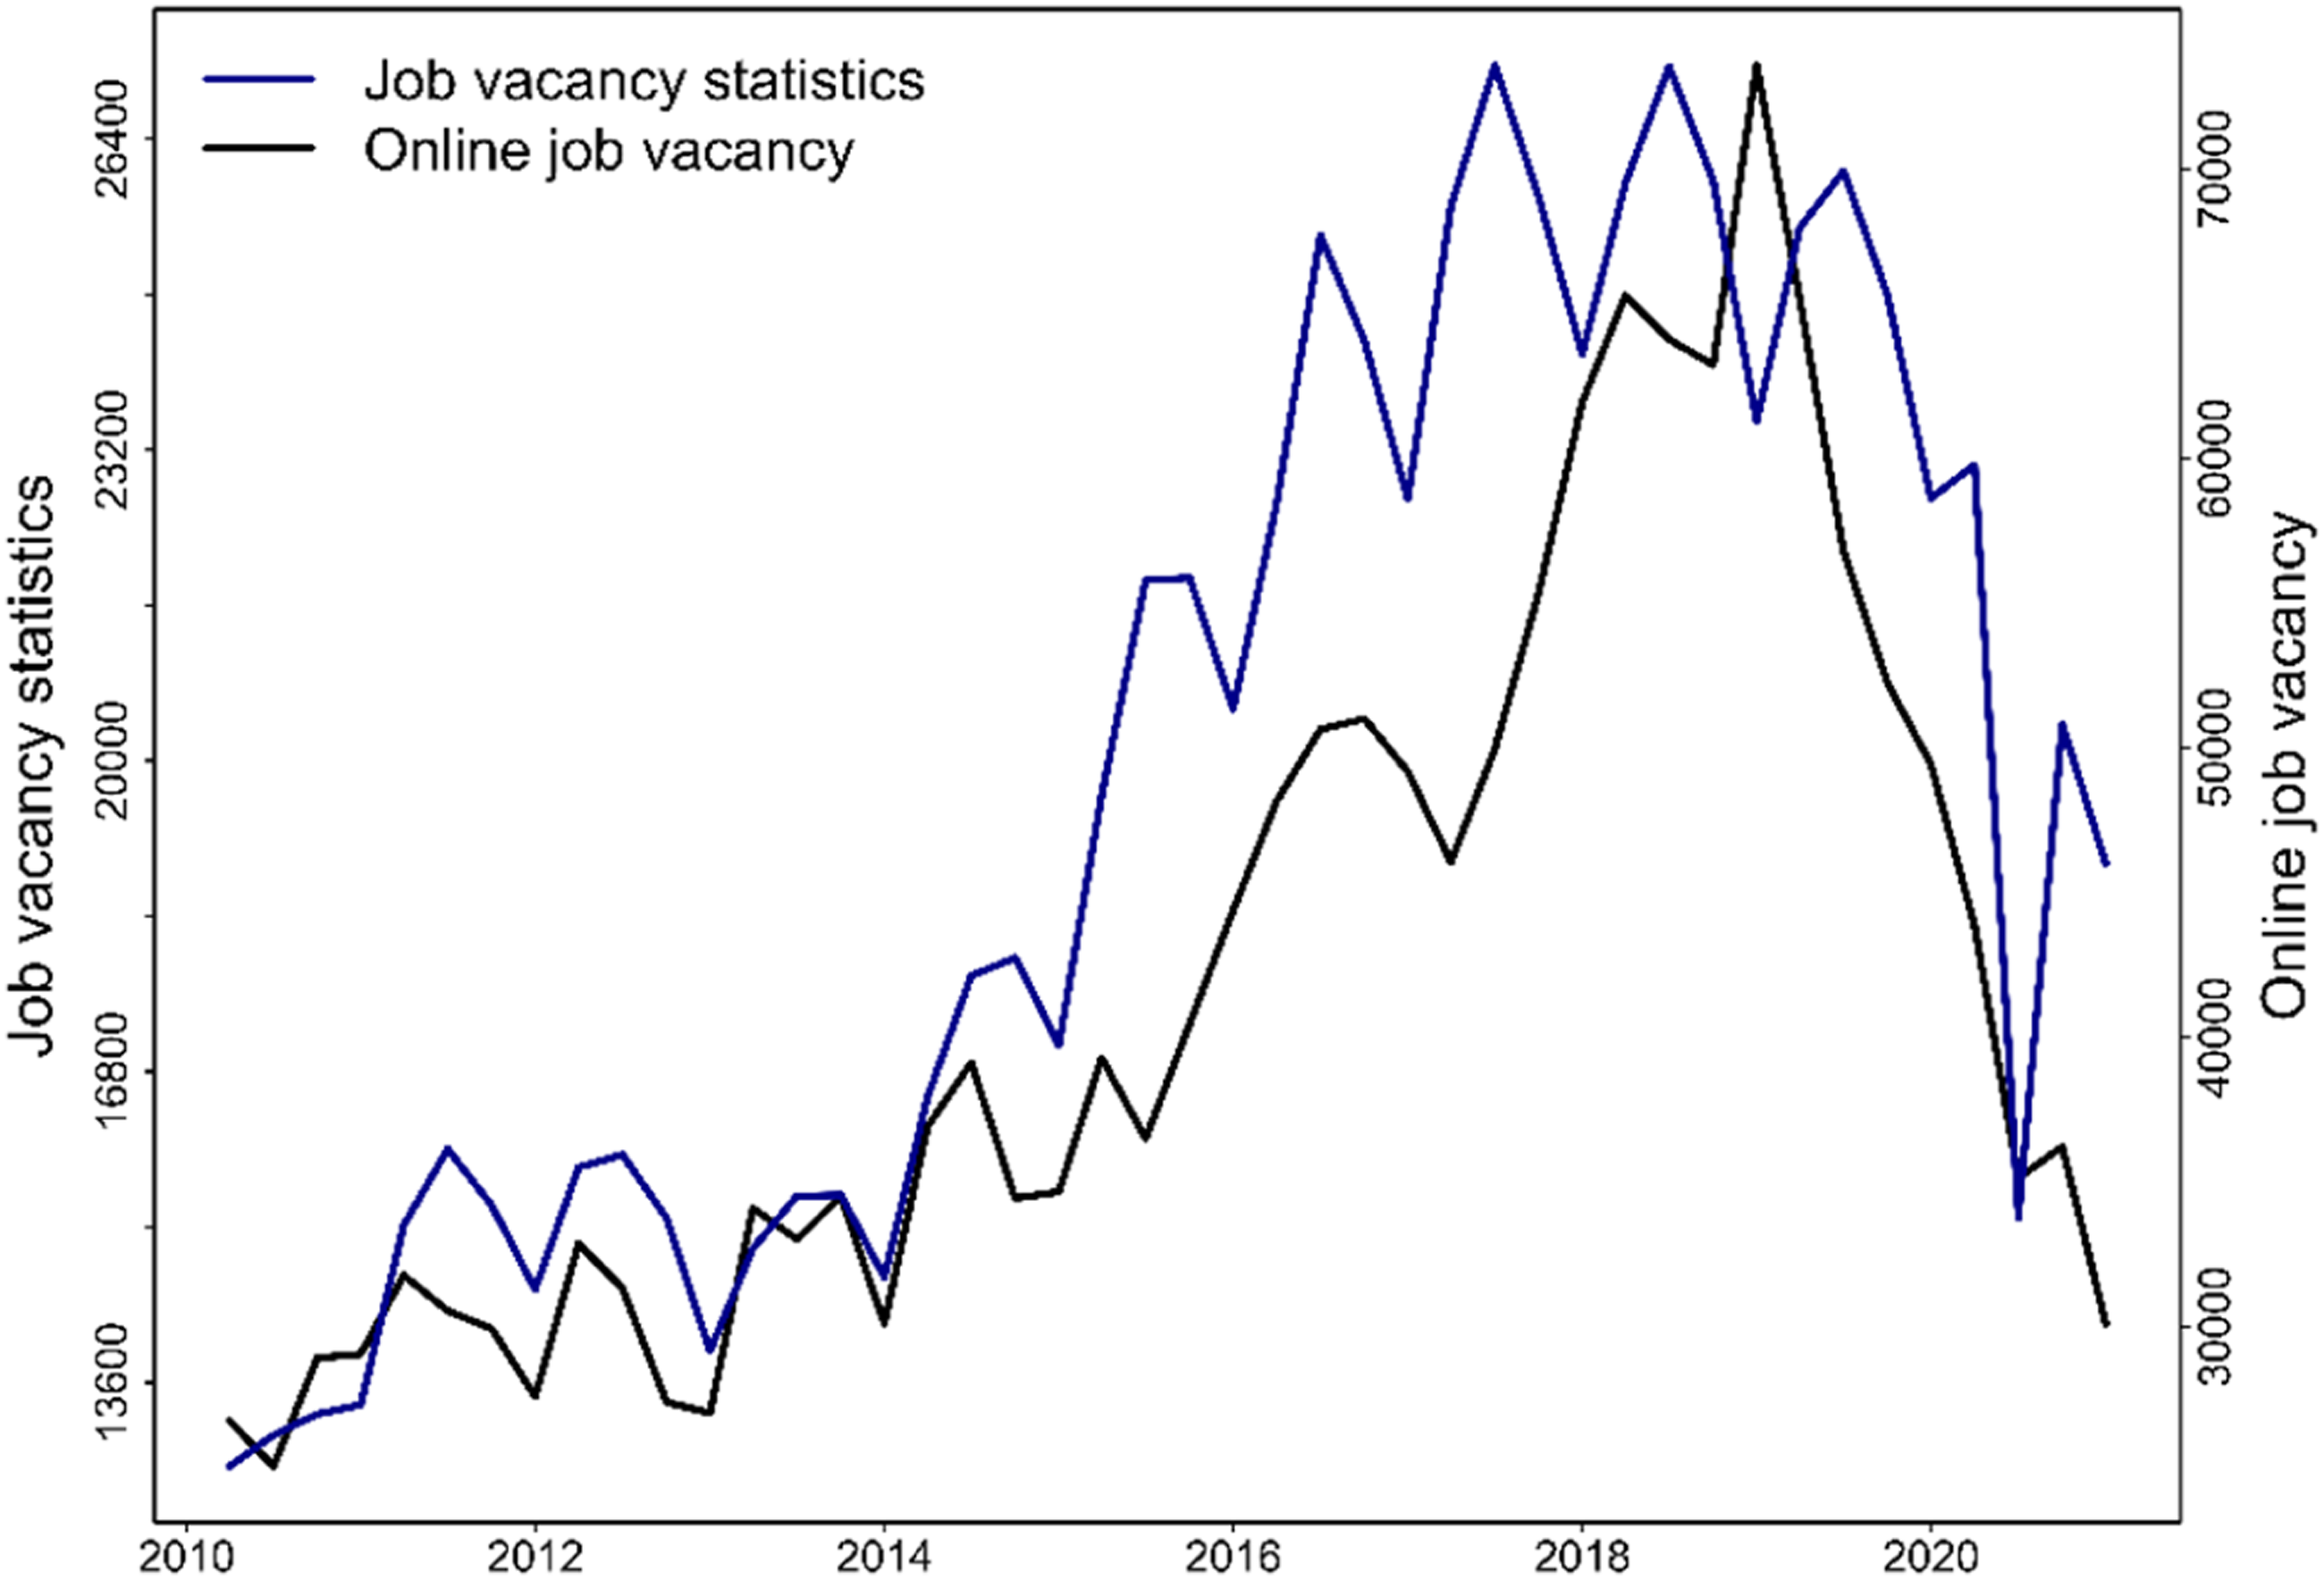
Figure 1 reveals an increasing time trend and suggests a seasonal component in the series. Following both De Pedraza et al. (2019) and Lovaglio et al. (2020), we decompose the time series of interest into its three main components, the trend-cycle, seasonal and irregular components, using the locally weighted scatterplot smoothing algorithm of Cleveland et al. (1990), as implemented in the ‘stats’ package from R Core Team (R Core Team, 2016). The three components can be found in Figure 2. Both series show a stable linear time trend disrupted at the end of our series. Like De Pedraza et al. (2019) and Lovaglio et al. (2020), we observe quarterly seasonality in our data. However, the similarities appear to end here. For Italy, the two time series appear to have a synchronized seasonal component (see Figure 3 in Lovaglio et al., 2020). For the Netherlands, the OJV data seem to lead official JVS statistics by one quarter. For Slovakia, the seasonal component is more complex (see Figure 2), as the lowest values are found in the 4th quarter in both the OJV and JVS series but the highest is observed in the 2nd quarter in the OJV and already in the 1st quarter in the JVS series. Finally, the remainder term does not seem to be particularly persistent. For example, the shock from the outbreak of the COVID-19 pandemic was short lived (lower panel in Figure 2). All these results suggest that our series show considerable trend and seasonality components; thus, both should be included in JVS predictions. Decomposition of JVS and OJV time series. Autocorrelation and partial autocorrelation of JVS and OJV time series.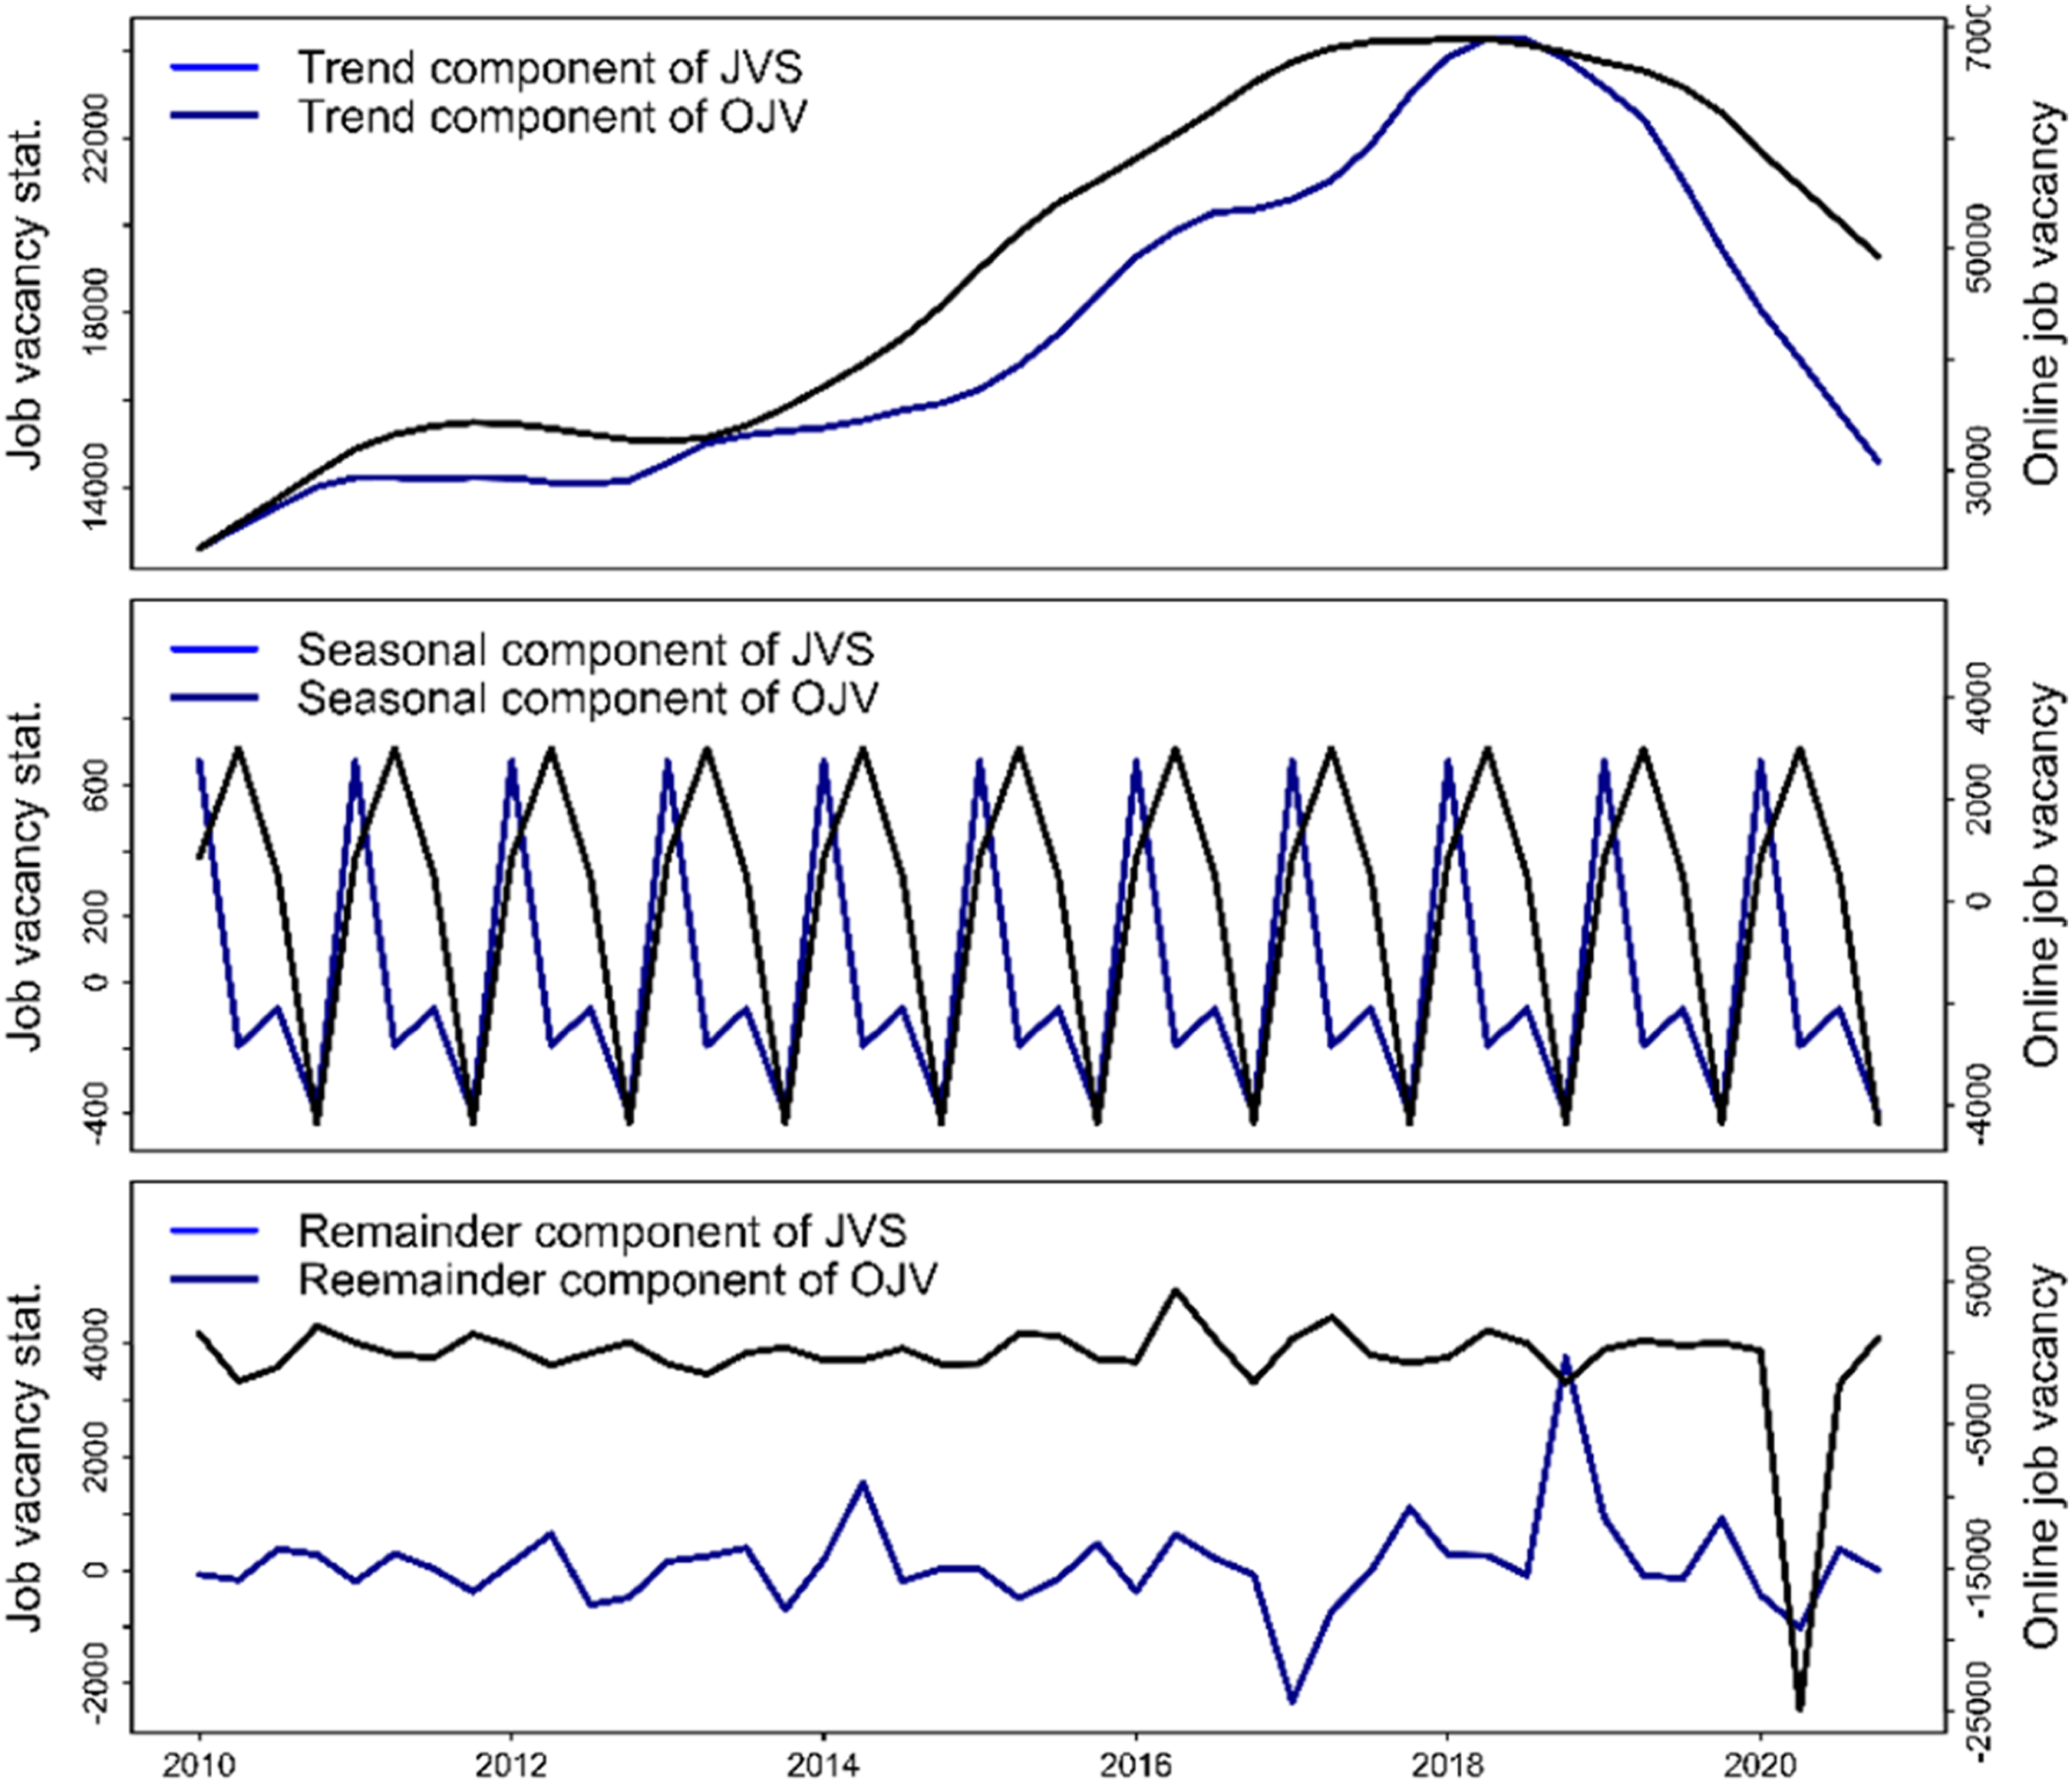
Overview of the key labour market and online job vacancy data.
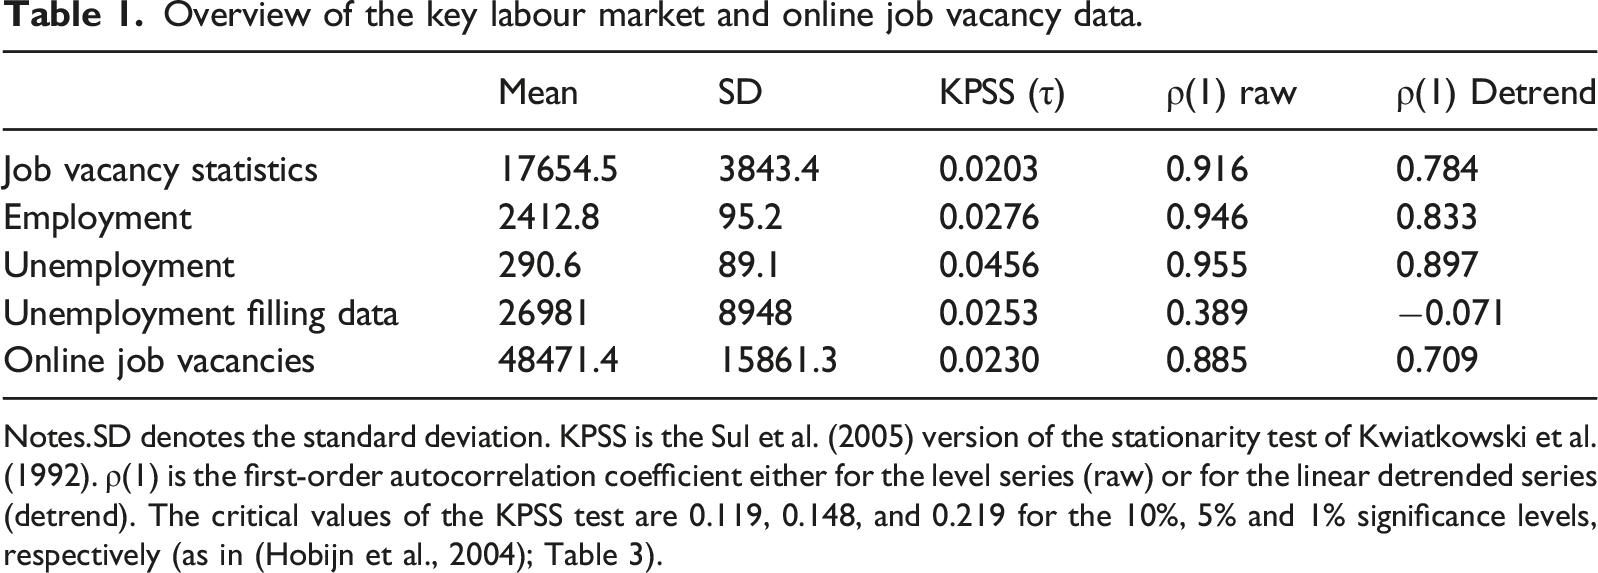
Notes.SD denotes the standard deviation. KPSS is the Sul et al. (2005) version of the stationarity test of Kwiatkowski et al. (1992). ρ(1) is the first-order autocorrelation coefficient either for the level series (raw) or for the linear detrended series (detrend). The critical values of the KPSS test are 0.119, 0.148, and 0.219 for the 10%, 5% and 1% significance levels, respectively (as in (Hobijn et al., 2004); Table 3).
This outcome is different from that in De Pedraza et al. (2019) and Lovaglio et al. (2020). De Pedraza et al. (2019) considers multiple unit root tests, including one that accounts for a possible structural break in the deterministic component (constant and trend) in the series. The standard tests suggest nonstationary behaviour, but the latter suggests stationarity around the deterministic component. Motivated by these conflicting results, De Pedraza et al. (2019) run their analysis on the raw and differenced time series. On the other hand, Lovaglio et al. (2020) identify a long-run (cointegration) relationship between both series, suggesting that subsequent analysis of the raw series should not lead to spurious results. In our case, the results provide unambiguous evidence favouring stationary trend behaviour; thus, we run our analysis only on the raw series, but a linear time trend is included.
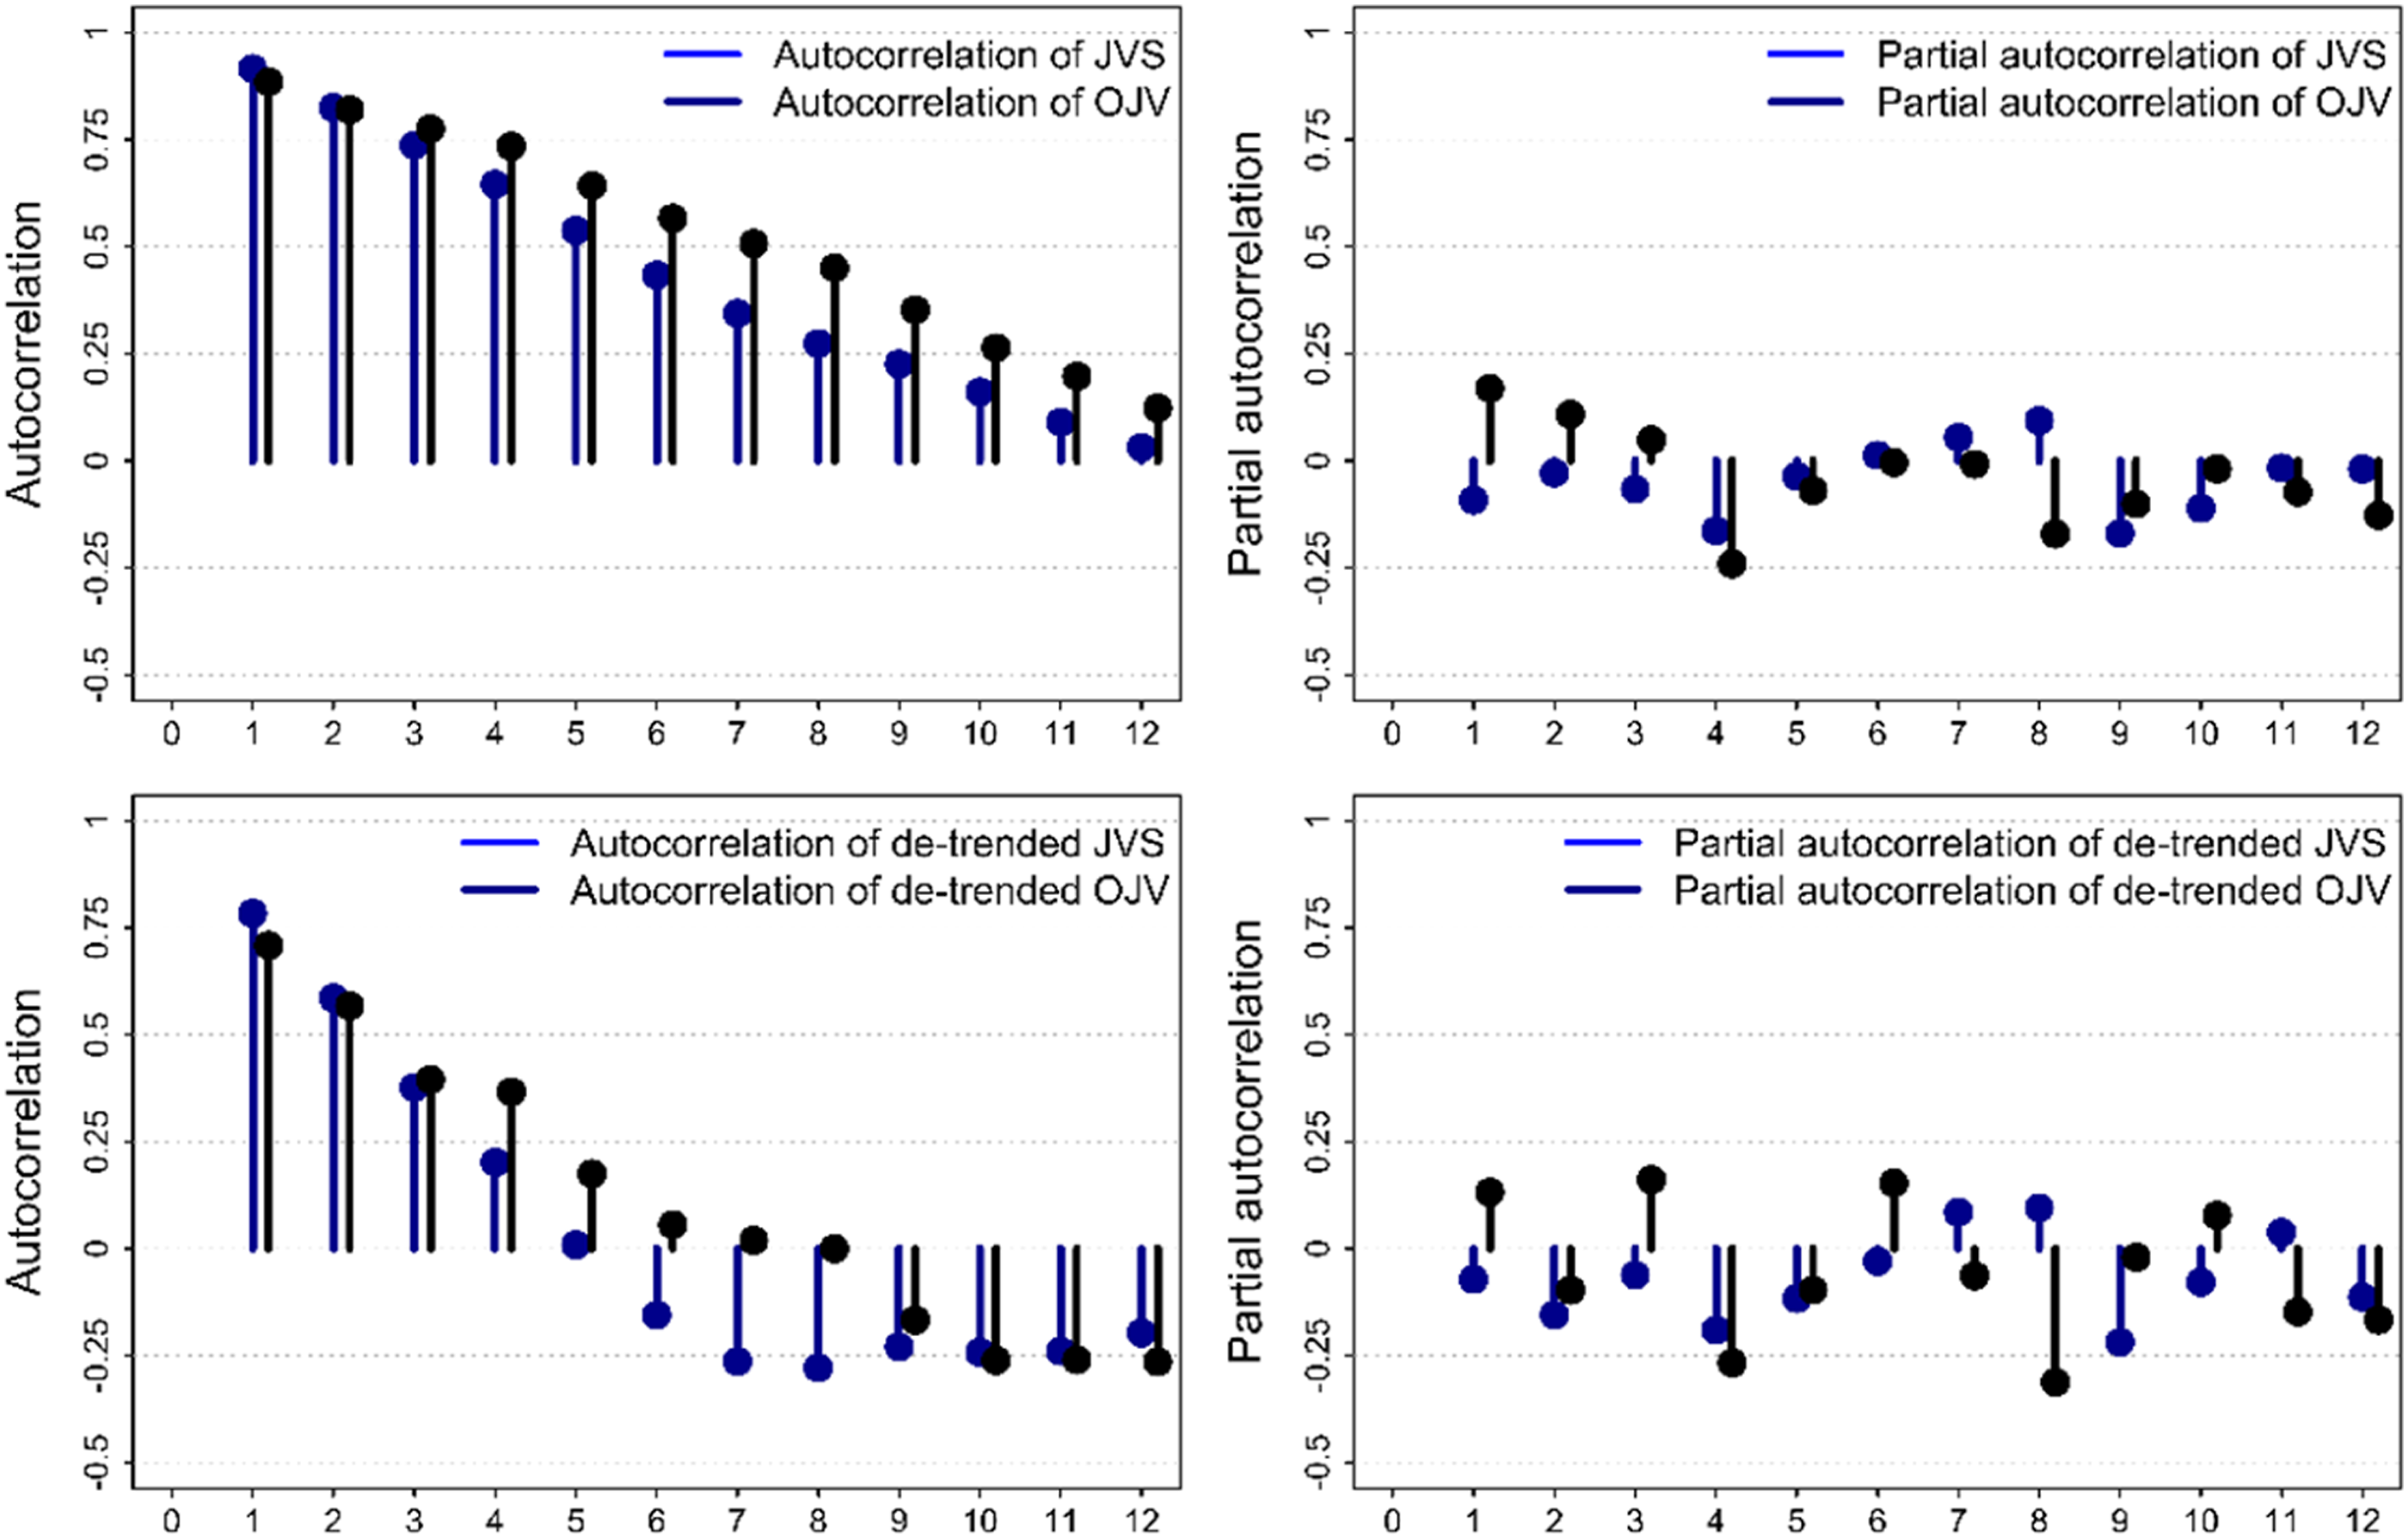
Next, we graphically explore the (partial) autocorrelation function for the OJV and JVS data. Unlike DePedraza et al. (2019) and Lovaglio et al. (2020), we do not report the cross-correlation; instead, we refer to an in-sample regression analysis, which provides a much more accurate analysis of the dependence between the two series. An autocorrelation function is plotted through variable lags and reported for the raw data, enabling references to the two empirical case studies (Dutch and Italian), but is also reported for the detrended data. We hope that this approach, together with the two earlier case studies, reveals potential repeating patterns in the time series development and helps identify the best specification of a prediction model.
As reported in Table 1 and shown in Figure 3, both series are subject to considerable persistence, which declines more slowly for the OJV data; that is, this series has larger memory (upper left panel in Figure 3). This is a very different result from that of De Pedraza et al. (2019), who report much shorter memory in the OJV data that ‘dies’ after two quarters. After the detrending (lower left panel in Figure 3), persistence declines, as is expected if the series has a linear time trend. Finally, we also report partial autocorrelations (right panels in Figure 3). What we find is that most of the persistence is driven through first-order autocorrelation, as after we remove that, the remaining dependence is much smaller. This is useful, as it shows that any JVS prediction model that does not use the latest JVS values will not be as accurate; however, as we argue, because JVS data are released only long after the reporting period, we cannot actually use the latest known JVS values. A suitable proxy is therefore needed. In this paper, we argue that data from an OJV platform can be used for this purpose.
Predicting job vacancy and (un)employment statistics with online job postings
Regression results from models predicting job vacancy statistics.
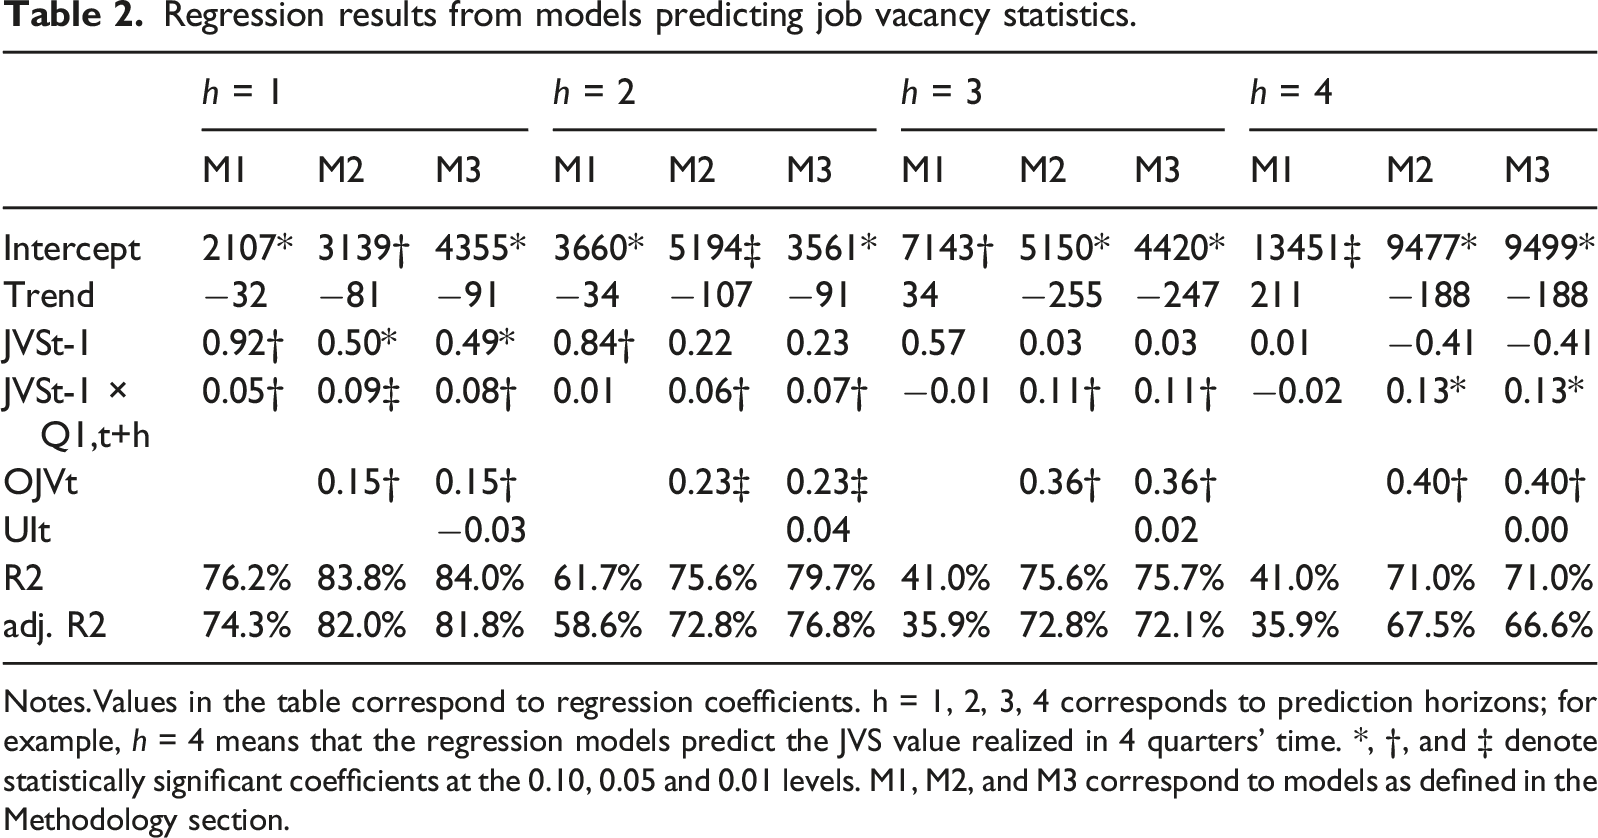
Notes.Values in the table correspond to regression coefficients. h = 1, 2, 3, 4 corresponds to prediction horizons; for example, h = 4 means that the regression models predict the JVS value realized in 4 quarters’ time. *, †, and ‡ denote statistically significant coefficients at the 0.10, 0.05 and 0.01 levels. M1, M2, and M3 correspond to models as defined in the Methodology section.
Regression results from models predicting unemployment.
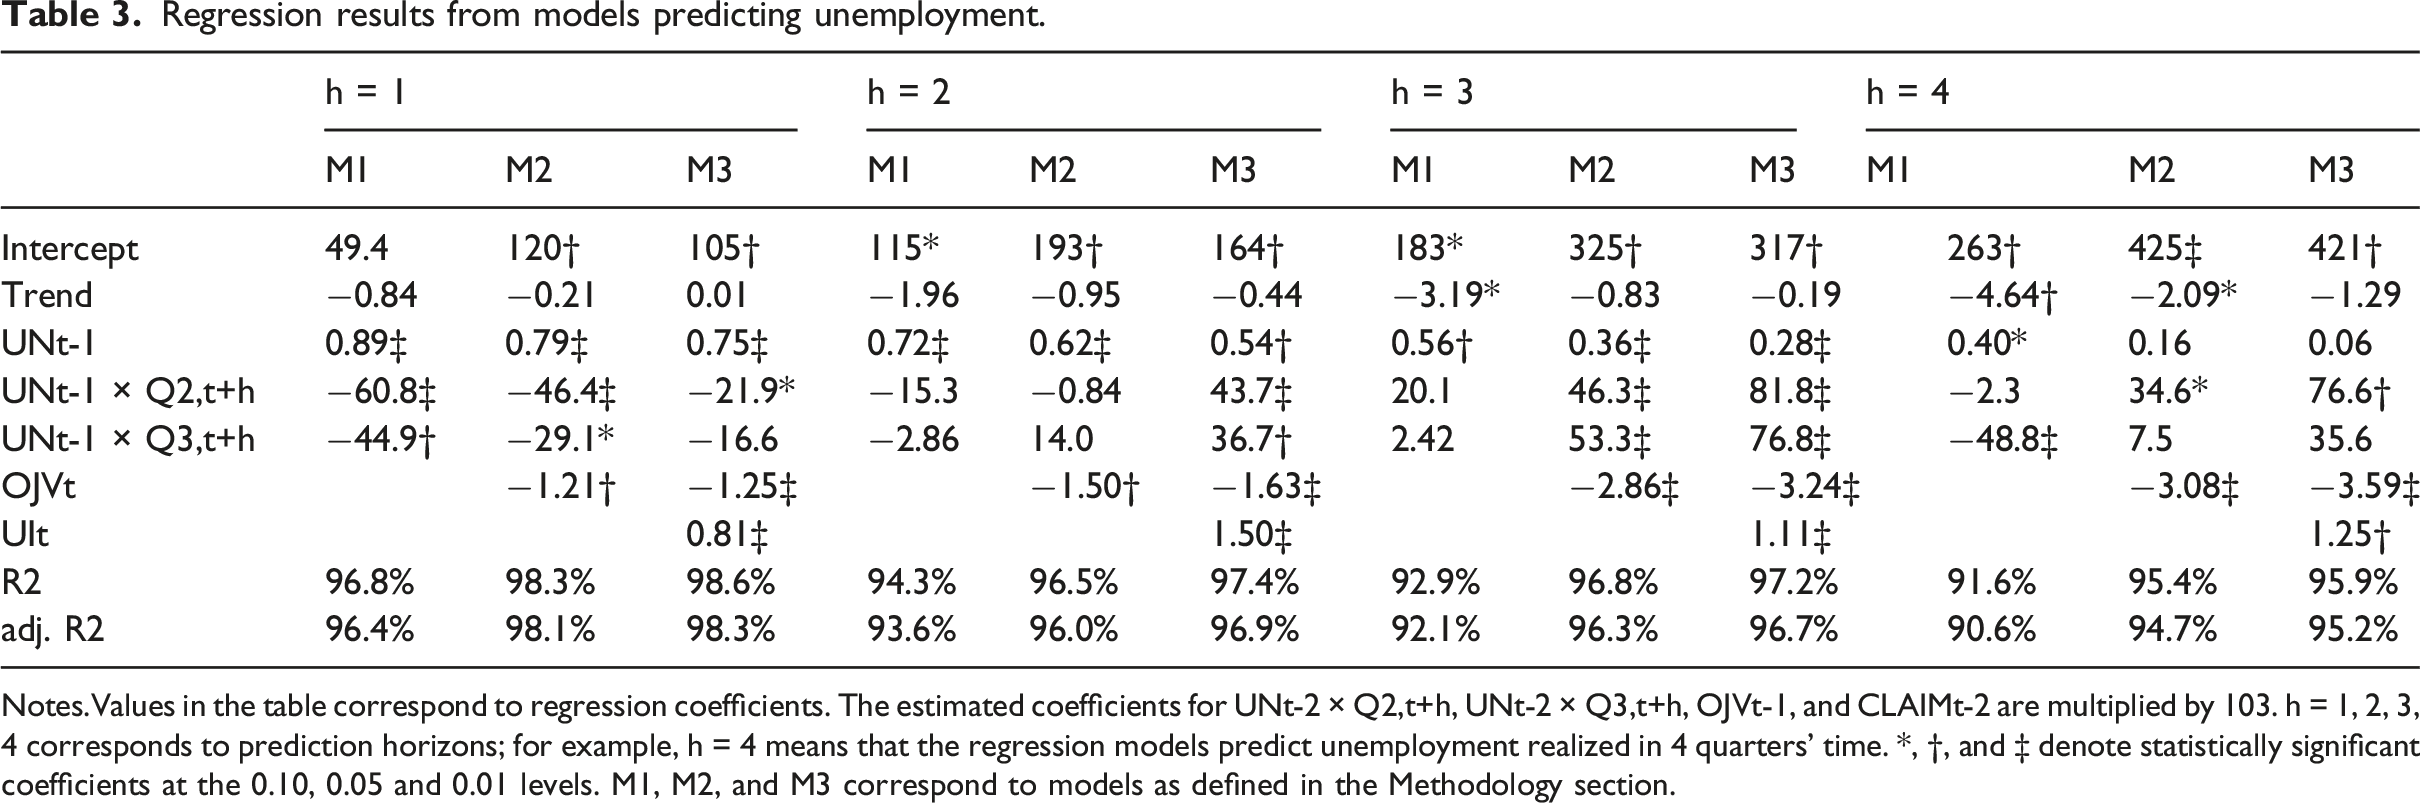
Notes.Values in the table correspond to regression coefficients. The estimated coefficients for UNt-2 × Q2,t+h, UNt-2 × Q3,t+h, OJVt-1, and CLAIMt-2 are multiplied by 103. h = 1, 2, 3, 4 corresponds to prediction horizons; for example, h = 4 means that the regression models predict unemployment realized in 4 quarters’ time. *, †, and ‡ denote statistically significant coefficients at the 0.10, 0.05 and 0.01 levels. M1, M2, and M3 correspond to models as defined in the Methodology section.
Regression results from models predicting employment.
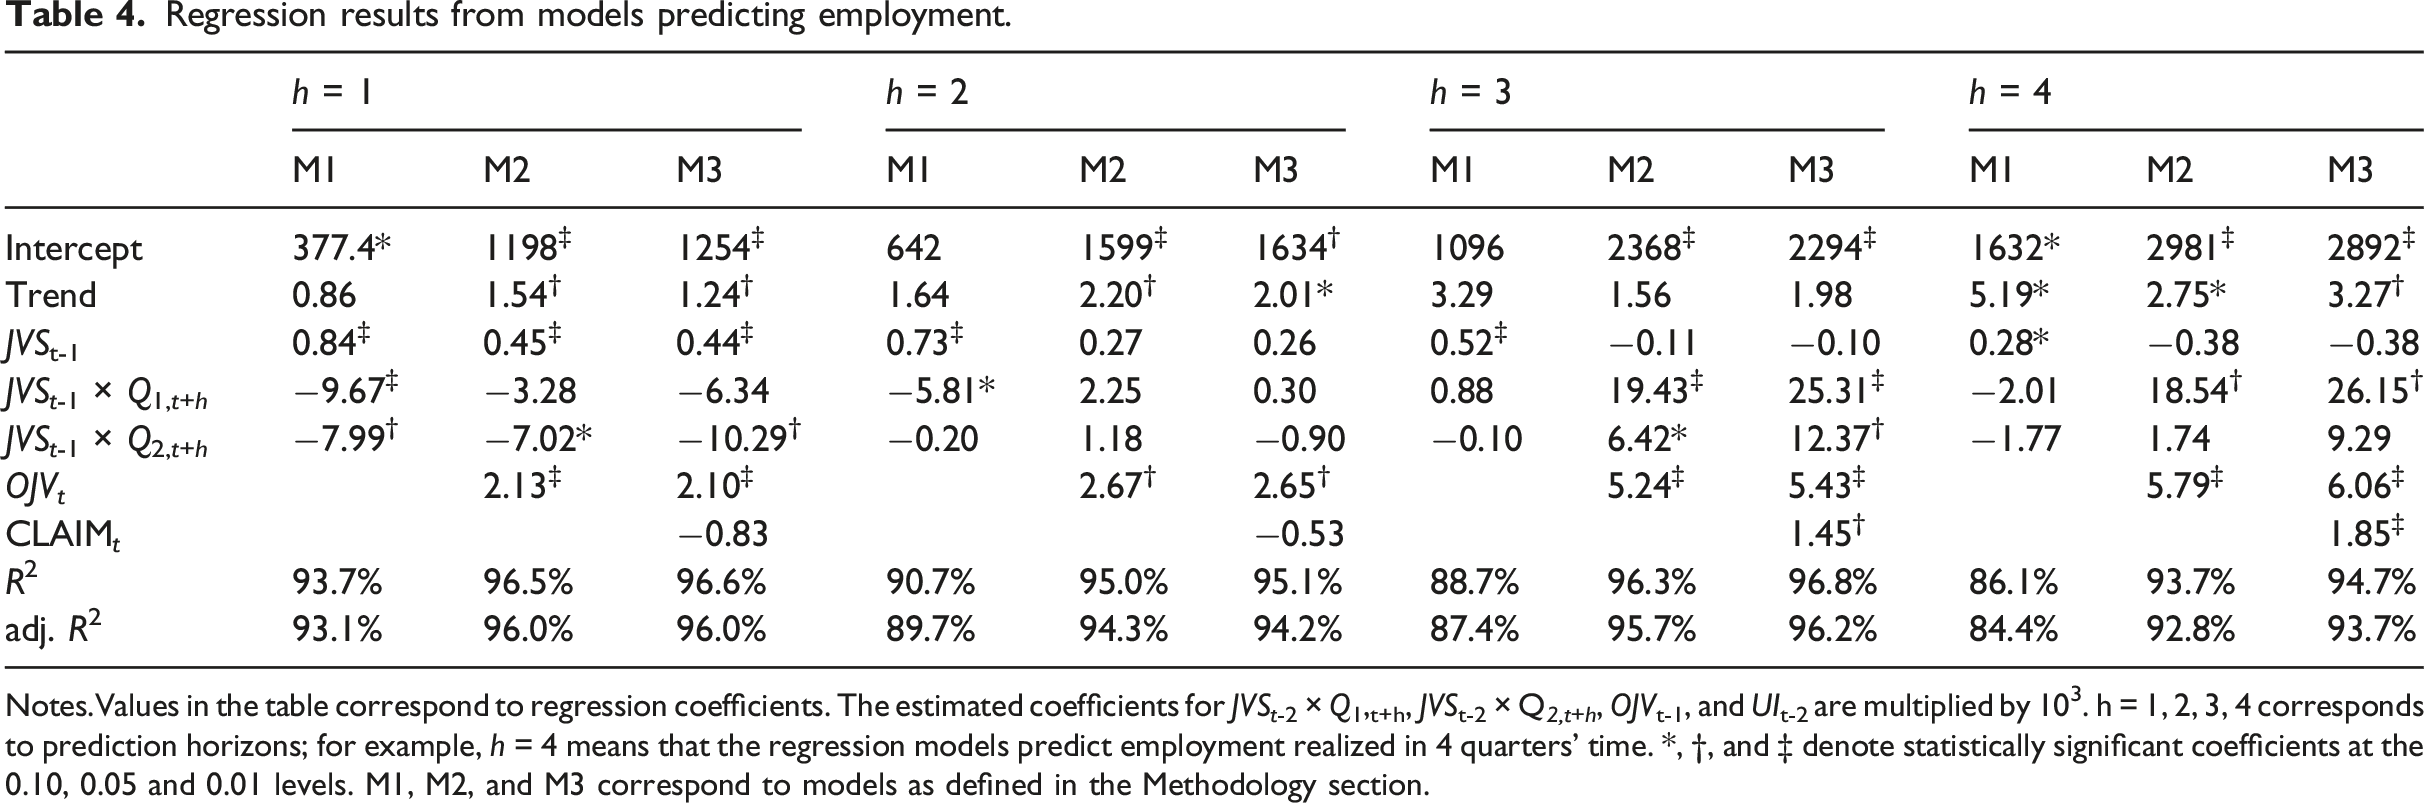
Notes.Values in the table correspond to regression coefficients. The estimated coefficients for JVSt-2 × Q1,t+h, JVSt-2 × Q 2,t+h , OJVt-1, and UIt-2 are multiplied by 103. h = 1, 2, 3, 4 corresponds to prediction horizons; for example, h = 4 means that the regression models predict employment realized in 4 quarters’ time. *, †, and ‡ denote statistically significant coefficients at the 0.10, 0.05 and 0.01 levels. M1, M2, and M3 correspond to models as defined in the Methodology section.
In Table 3, we report the results for the level of unemployment. Here, the baseline model specification preferred based on the Bayesian information criterion consists of two seasonal terms that control for the second and third quarters. Enhancing the baseline model with online job vacancy data improves the model fit, and the coefficient is consistently estimated with a negative sign and is statistically significant. Thus, with an increase in online job vacancies, unemployment in the next period declines. The effect is stronger for longer prediction horizons. Interestingly, augmenting the model with inflow to unemployment (UI) improves the model fit (adj. R2) only slightly, and the coefficient is also positive and significant for all prediction horizons; thus, higher inflows to unemployment lead to a higher stock of unemployment in the next period. This result is partially expected, as unemployment is persistent (see the results in Table 1 and the coefficient loaded on UNt-1); therefore, inflow into registered unemployment is likely a good proxy for the missing one-quarter lagged observation on unemployment.
Finally, a similar pattern is found for the employment analysis reported in Table 4. First, the baseline model consists of two seasonal terms, but now we control for the 1st and 2nd quarters. Adding online job vacancy data improves the model fit, and the coefficient is statistically significant and positive; an increase in online job vacancies is followed by increased employment. As before, the size of the effect increases with the predictive horizon. Adding information about the inflow to registered unemployment does not alter our conclusions. The inflow to registered unemployment, by itself, shows a negative association for one to two quarters ahead of the predictions but is not statistically significant. On the other hand, the three- and four-quarter-ahead predictions have statistically significant positive coefficients, a somewhat surprising result. It appears that generally, within approximately three or more quarters, increased inflow to unemployment transforms into employment growth. This points to supply-side limitations of employment growth in the Slovak labour market during a dominant part of the observation period (Štefánik & Miklošovič, 2020).
Out-of-sample evidence on the usefulness of online job postings
Mean forecast errors of reported OLS models.
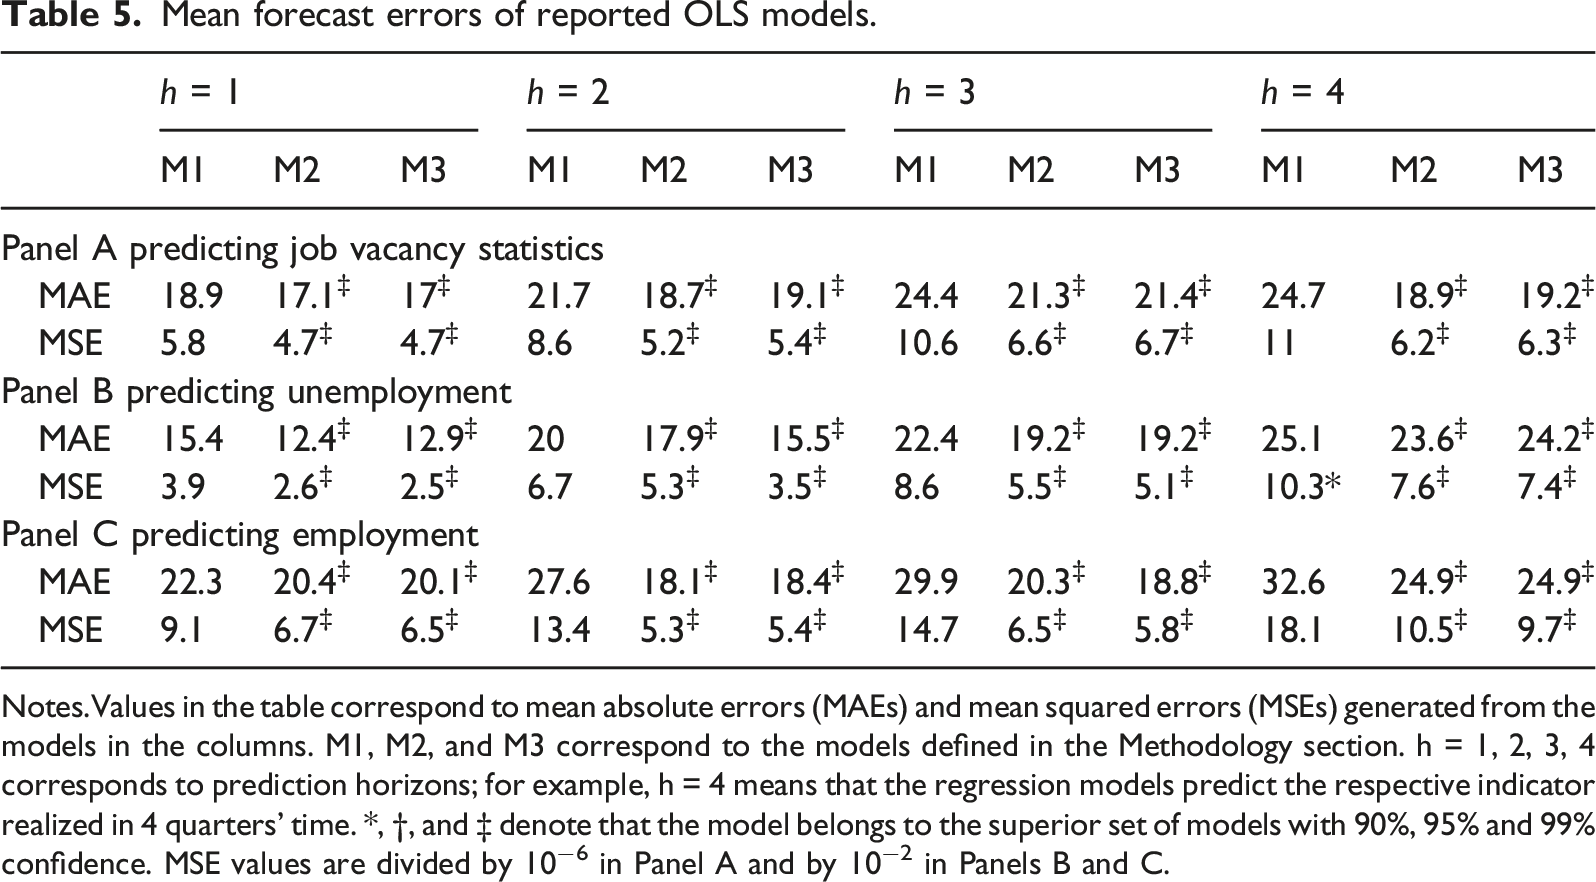
Notes.Values in the table correspond to mean absolute errors (MAEs) and mean squared errors (MSEs) generated from the models in the columns. M1, M2, and M3 correspond to the models defined in the Methodology section. h = 1, 2, 3, 4 corresponds to prediction horizons; for example, h = 4 means that the regression models predict the respective indicator realized in 4 quarters’ time. *, †, and ‡ denote that the model belongs to the superior set of models with 90%, 95% and 99% confidence. MSE values are divided by 10−6 in Panel A and by 10−2 in Panels B and C.
Overall, the results in Table 5 provide additional evidence in favour of the usefulness of online job vacancy data for predicting key labour market indicators. Models 2 and 3 are almost always in the set of superior models, while Model 1, the baseline, is excluded. An exception is found for the four-quarter-ahead prediction of unemployment, for which all models provide similar predictive accuracy, as judged by the mean square error.
These improvements are not only statistically significant but also suggest considerable gains in forecasting accuracy. For example, comparing the average mean or square forecast errors between Model 1 and Model 2, we observe that the MAE improvements for JVS predictions are smallest for one-quarter-ahead predictions (9.42%) and largest for four-quarter-ahead predictions (23.35%). These improvements are further amplified when we look at the MSE, where even the lowest improvement in the forecast error is 21.02% (for the quarter-ahead prediction) and is as large as 43.94% (for the four-quarter-ahead prediction). As our previous analysis has already suggested, the forecast improvement varies with respect to the labour indicator and forecasting horizon, but the overall message is very consistent: online job vacancy data seem to be helpful for predicting key labour market indicators.
Concluding remarks and discussion
The potential of big data collected in the administration of online services is alluring for multiple scientific fields. This paper documents one case study employing information from such data to improve the potential predictions of official labour market statistics. We look at online job vacancy data collected while running a job advertisement web portal with dominant market coverage in one country: Slovakia. Our analysis explores time variation in the aggregate number of vacancies collected by the web portal. First, we study the properties of online job vacancy data and compare our results with those of previous studies using similar data for Italy and the Netherlands. Later, we demonstrate the attractiveness of employing online job vacancy for predicting key labour market indicators, such as job vacancy statistics and the number of employed or unemployed persons. Our empirical results are consistent: online job vacancy statistics are always statistically significant predictors of labour market indicators one to four quarters ahead. Moreover, we are able to show that these conclusions hold even in an out-of-sample exercise.
We are aware of two studies exploring comparable data for the Netherlands (DePedraza et al. 2019) and Italy (Lovaglio, et al., 2020). Both document the association between online job vacancy data and official job vacancy statistics. Although the methodologies across these studies slightly differ (see Table A1 in the Annexe), the results suggest that OJV data are potentially helpful for prediction purposes. As opposed to those studies, we are interested in the predictive power of OJV data with respect to JVS as well as to other key labour market indicators. Moreover, in our study, we go one-step further to show that OJVs are useful even in an out-of-sample context for longer predictive horizons. De Pedraza et al. (2019) was interested in bi-variate cross-lagged correlations between JVS and OJV time series, that is, unconditional dependence between future (present) values of JVS and past (future) values of OJV, which is similar to our predictive regressions. However, we could not use correlation as our series were trend stationary.
In reference to the Italian and Dutch case studies, we add another example of a country-specific seasonality pattern and underline the importance of adding trends into autoregression-based modelling specifications. Moreover, regression allows us to control for seasonal patterns and also for the inflow of unemployed. Therefore, our approach might be viewed as a conditional alternative to the unconditional association (cross-lagged correlation) analysis applied in DePedraza et al. (2019). Additionally, we document the predictive potential of OJV data for predicting JVS values in an out-of-sample exercise; the out-of-sample study has a similar purpose as the in-sample analysis, with the possibility of strengthening our earlier findings.
Another stream of earlier studies has explored the potential of online search data in predicting unemployment (Askitas & Zimmermann, 2009; Caperna et al., 2020; Fondeur & Karamé, 2013; Tuhkuri, 2016). We contribute to this literature by exploring the potential of OJV data in predicting labour market–relevant indicators other than JVSs. Our findings point to the potential of OJV data in predicting the employment and unemployment series. In this respect, the online search data present a well-documented benchmark and thus offer options for further comparison to help assess the power of OJV data in predicting unemployment. Based on the comparison of the forecasting errors of M2 and M3 reported in Table 5, the OJV data appear to be an even stronger predictor of unemployment than the inflow into registered unemployment (detailed results available upon request).
Aware of the limitations of generalizing from a case study based on evidence for one country, we stress the relevance of our approach in other European contexts by relying on indicators collected and methodologies applied by Eurostat in practically all European countries. It is reasonable to assume that substantial coverage of the OJV data source is a necessary precondition to capture the dependence of OJV data on country-level values of indicators collected by official statistics. Especially for larger countries, instead of data provided by one particular job advertisement provider, data may be available from online job vacancy aggregators (like the one explored in the Netherlands case study of DePedraza et al., 2019). Based on the evidence described here, we claim that comparable cases could be revealed where online job advertisement providers or aggregators do not focus on a particular labour market segment and still are able to maintain a relatively dominant market share. Such instances might be more frequent in smaller countries, where national language dominates the recruiting process, which is the case for a number of EU member states.
Additionally, our comparison strategy shows that OJV data tend to be useful for predictions at longer forecast horizons, which is encouraging given that policymakers are interested in horizons long enough to give them time to prepare and implement policy actions. We believe our evidence is relevant for macroeconomic modellers supporting decision making with macroeconomic predictions, such as banking or public policy and administration.
Footnotes
Acknowledgments

Declaration of Conflicting Interests
The author(s) declared no potential conflicts of interest with respect to the research, authorship, and/or publication of this article.
Funding
The author(s) disclosed receipt of the following financial support for the research, authorship, and/or publication of this article: This work was supported by the Vedecká Grantová Agentúra MŠVVaŠ SR a SAV, (VEGA 2/0150/21), Agentúra na Podporu Výskumu a Vývoja, (APVV-17-0329), European Commission; Diskow project, (2018-1-DE02-KA202-005215)