
Abstract
Qualitative data analysis software (QDAS) packages that support live data extraction are a relatively recent innovation. Little has been written concerning the research implications of differences in such QDAS packages’ functionalities, and how such disparities might contribute to contrasting analytical opportunities. Consequently, early-stage researchers may experience difficulties in choosing an apt QDAS for Twitter analysis. In response to both methodological gaps, this paper presents a software comparison across the four QDAS tools that support live Twitter data imports, namely, ATLAS.ti™, NVivo™, MAXQDA™ and QDA Miner™. The authors’ QDAS features checklist for these tools spotlights many differences in their functionalities. These disparities were tested through data imports and thematic coding that was derived from the same queries and codebook. The authors’ resultant QDAS experiences were compared during the first activity of a broad qualitative analysis process, ‘organising data’. Notwithstanding large difference in QDAS pricing, it was surprising how much the tools varied for aspects of qualitative research organisation. Notably, the quantum of data extracted for the same query differed, largely due to contrasts in the types and amount of data that the four QDAS could extract. Variations in how each supported visual organisation also shaped researchers’ opportunities for becoming familiar with Twitter users and their tweet content. Such disparities suggest that choosing a suitable QDAS for organising live Twitter data must dovetail with a researcher’s focus: ATLAS.ti accommodates scholars focused on wrangling unstructured data for personal meaning-making, while MAXQDA suits the mixed-methods researcher. QDA Miner’s easy-to-learn user interface suits a highly efficient implementation of methods, whilst NVivo supports relatively rapid analysis of tweet content. Such findings may help guide Twitter social science researchers and others in QDAS tool selection. Future research can explore disparities in other qualitative research phases, or contrast data extraction routes for a variety of microblogging services.
Keywords
Introduction
Twitter has emerged as an important object of study in the social sciences (McCormick et al., 2017). Researchers have studied access to Twitter data via low cost and free software (Yu & Muñoz-Justicia, 2022), but little has been written about such access via qualitative data analysis software (QDAS) tools. This is unsurprising as QDAS tools that support live data extraction are a relatively recent innovation. QDAS, QDA or ‘computer assisted QDAS’ (CAQDAS) (Lewins, 2015) emerged in the 1980s as a novel genre of software specifically designed to support qualitative research. QDAS packages commonly serve as tools that researchers can use for four broad activities in the qualitative analysis process (Gilbert et al., 2014). These are (a) organising – coding sets, families and hyperlinking; (b) exploring – models, maps, networks, coding and text searches; (c) reflecting – through memoing, annotating and mapping and (d) integrating qualitative data through memoing with hyperlinks and merging projects (Davidson & di Gregorio, 2011; Di Gregorio, 2010; Lewins & Silver, 2007). There are four software packages that have arisen as the prominent QDAS options for exploring live Twitter data: In 2012, NVivo first offered support for Twitter data via a dedicated plugin. MAXQDA 11 did likewise in 2013, and ATLAS.ti™ version 7.5 also provided support. QDA Miner’s version 5, released in 2016, included Twitter imports.
Little is known regarding how researchers use different QDAS to achieve methodological goals, despite them being well-established research tools (Woods et al., 2016). In response, Woods, Paulus, Atkins and Macklin did a content analysis of Scopus articles in which researchers described using two popular QDAS, ATLAS.ti™ or NVivo™. Although most researchers provided few details of their QDAS use beyond naming the program, some authors’ detailed accounts gave valuable insights into how QDAS programs are used for supporting data analysis and the reporting of research outcomes (Paulus et al., 2017). A salient finding from their content analysis of 763 empirical papers was that most researchers described using ATLAS.ti™ or NVivo™ for data management and analysis, the ‘organisational phase’ of research that this paper focuses on.
Checklist Comparison of Common Twitter Import Features Described in QDAS Guidelines.

Legend (Y = yes, N = no, (A) = can be auto-encoded. Grey highlights indicate disparities).
This paper was inspired by the authors’ involvement in the Academic Free Speech and Digital Voices (AFSDV) research project (The Noakes Foundation, 2022). In researching the value of qualitative research for analysing the Twitter shares of a scientific research article (Noakes et al., 2023), the authors’ contrasted static versus live Twitter data import routes. Noticing many differences between ATLAS.ti’s and NVivo’s approaches, this paper’s authors decided to explore other QDAS tools. The authors’ literature review on the topic of live Twitter data imports identified many gaps. As a first step, the researchers decided to do pathfinder research into these disparities for answering the question:
How do QDAS packages differ in what they offer for live Twitter data research during the organisational stage of qualitative analysis?
The authors could find no specific comparison on live data, nor regarding organising Twitter data via QDAS. They combined these concerns in the research question, then selected a popular Twitter topic in South Africa, energy ‘load-shedding’ as a purposive and convenient sample for cross-comparison. The writers focused on extracting and organising communiqués from the national electrical company, the Electricity Supply Commission (Eskom). ‘Load-shedding’ is the Pan South African Language Board’s word of the year for 2022 (PanSALB, 2022), due to it most frequent use in credible print, broadcast and online media. Invented as a euphemism by Eskom’s public-relations team, load-shedding describes electricity blackouts. Since 2007, planned rolling blackouts have been used in a rotating schedule for periods ‘where short supply threatens the integrity of the grid’ (McGregor & Nuttal, 2013). In the weeks before the researchers’ fieldwork, Eskom and the different stages of load-shedding strongly trended on Twitter. These tweets reflected the depth of public disapproval, discontent, anger, frustration and general concern.
Background Literature
The authors’ literature review followed the narrative review method (Bourhis, 2017) in exploring QDAS software comparisons and qualitative research with live Twitter data. The review confirmed an opportunity for their novel contribution regarding software comparisons between QDAS tools supporting live Twitter imports:
At the time of writing, there are many QDAS options that researchers can choose from (Silver & Lewins, 2014): Weitzman and Miles’ book ‘Computer programs for qualitative data analysis’ catalogued 24 QDAS software programs (1995). Two decades later, there has only been a slight decrease, with the CAQDAS Networking Project listing 21 packages available (2022). Popular packages, such as ATLAS.ti, NVivo and MAXQDA, support the import of data from a broad range of media (Davidson & di Gregorio, 2011). Contemporary QDAS packages also offer support for data sources from web2.0 technologies, such as live social media entries. This data is organised in complex data fields that can include diverse media formats. Such data may be imported live into QDAS from a social media service’s database or as ‘static’ data via exported spreadsheets.
This paper focuses on the live Twitter data extraction route that is used within QDAS at no additional cost to the end-user. Microblogging researchers have several options to acquire Twitter data for analysis, which vary in complexity and cost (Littman, 2017). These range from the nine different free-of-charge and low-cost software tools that Jingyuan Yu and Juan Muñoz-Justicia have reviewed (2022), to the most expensive in which scholars may access the full data stream of Twitter data via the Firehose method (Choo et al., 2022). While this technique provides comprehensive coverage for all historical tweets matching researchers’ queries, its prohibitively high cost serves as a gatekeeper to many researchers (Liu & Young, 2018).
Very few studies have directly contrasted the QDAS packages that this paper focuses on. The comparisons that have been done typically address the respective strengths of QDAS packages, comparing their feature sets: A comparative review of ATLAS.ti (version 5.0) and NVivo 2.0 was written to assist decisions of prospective new users as to which product might best suit their contemplated research tasks (Lewis, 2004). A comparison of major features reviewed the strengths and weaknesses of both programs covering: ease of installation, help for novices, interface design, inputting and managing data, coding, searches and other queries, and creating models of data relationships.
Kirsten Pellegrino compared seven QDAS tools that might be used in research supporting music teaching and learning (2014). She focused on operating system support (Windows/Mac), cost and basic functionality. Her paper motivated for more extensive use of QDAS by music education researchers, spotlighting practical educational strengths of these tools.
Yanto Chandra and Laing Shang compared proprietary QDAS ATLAS.ti, NVivo, MAXQDA tools and RQDA, a free, open-source option (2019). As the authors’ aim was to assist readers with making an intelligent choice, they focused on three aspects: technical specifications, computing capabilities and methodological orientation. Based on these differences, readers were urged to select a QDAS that suits their budget, needs and goals. In comparing capabilities, social media data import functionalities were excluded.
By contrast to the concise literature review’s preceding examples, this paper’s software comparison focuses on disparities in the functionalities that QDAS offer researchers for their organisation of live Twitter data.
Method
Following the example of Chandra and Shang (2019), the authors conducted a comparative review of ATLAS.ti, MAXQDA, NVivo and QDA Miner. The comparative review method is a research technique in which varied evidence is compared and contrasted to detect disparities. Its purpose is to synthesise evidence from several sources and provide ample understanding of a specific topic. This method seemed apt for focussing on how the four QDAS tools differ in supporting the aforementioned organisational phase of research with live Twitter data.
The interdisciplinary team’s review of software compared the four applications in terms of their contrasting functionalities with Twitter data for individual users. Each author chose a QDAS package that suited his or her research disposition. For example, the statistician chose MAXQDA Analytics Pro for its more quantitative focus.
The researchers compiled a comparative checklist for the four QDAS in Table 1. It was based on the QDAS tools’ respective online user manuals. These are the main communication method with end-users (Freitas et al., 2018) and the functions the manuals described provided the initial source for comparison. Since this checklist confirmed marked contrasts, the researchers tested organisation of Twitter data via each QDAS. The authors met bi-weekly to discuss, contrast and document their experiences in applying the software as part of their research methods. These meetings supported a focus on applied methodological analysis using QDAS tools, which was important to ensure the reviewers shared a critical stance. By contrast, narrowly focussing on practical concerns and technological innovations would tend to assume that QDAS tool use must improve research (MacMillan & Koenig, 2004). The researchers’ focus on the initial phase of qualitative research and related methodological issues served as a necessary counterweight to such positivist assumptions.
Selection of Qualitative Data Analysis Software Tools and Their Comparison
The team of three authors, the AFSDV research project’s principal investigator, its statistician and its qualitative data analyst, did the testing and comparison. While there were wide differences in the researchers’ analytical interests and perspectives, they were united around a common goal. This was to better understand what contemporary QDAS supports for live Twitter data analysis. As discussed earlier, only four common QDAS packages (Guest et al., 2012) support live Twitter data imports. Table 1 shows discrepancies in the Twitter functionalities from each. This checklist was sourced from QDAS developers’ descriptions for live Twitter data importing (ATLAS.ti, 2022; MAXQDA, 2022; Provalis Research, 2023; QSR International, 2022).
Each author chose a QDAS they were familiar with or wanted to learn. Two authors used PC platforms, which QDAS was originally developed for (Guest et al., 2012). PC versions generally seem to support the most functionality, due to their lengthier histories of development. NVivo was tested on Mac for convenience, noting a constraint that the PC version (20) supports more functions than the NVivo for Mac, version 1 (QSR International, 2020).
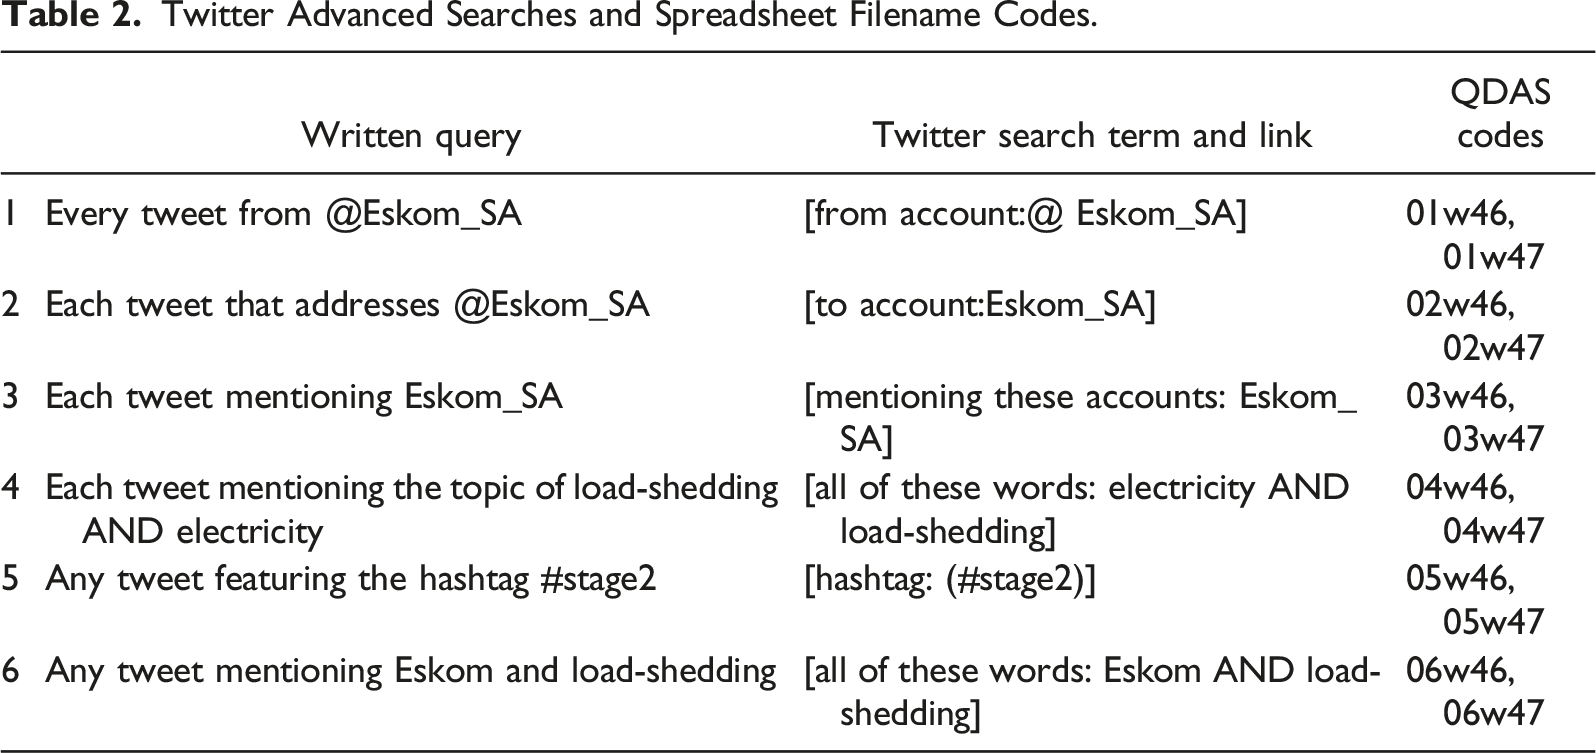
Twitter Advanced Searches and Spreadsheet Filename Codes.
While the latter three stages of exploring, reflecting and integrating could be compared, organising data provided ample content for just one article. The authors met every two weeks to contrast their respective processes, analyses and findings after organising similar data. Such reflection helped develop understandings for where QDAS helped, or hindered, Twitter data’s organisation for analysis.
Organising the Qualitative Data Analysis Software Packages
ATLAS.ti 22 was a low-cost QDAS option, since the software was licensed by the Cape Peninsular University of Technology (CPUT), enabling its CPUT staff member to do ‘free’ Twitter imports in 2022. The standard commercial (non-academic) individual licence to use ATLAS.ti is $600 for a year’s use. The AFSDV’s principal investigator purchased NVivo for Mac. Its standard permanent licence costs $ 1,250. A permanent licence for MAXQDA Analytics Pro (which includes Quantitative Text Analysis with ‘MAXDictio’ and Statistical Data Analysis with ‘Stats’) was bought for the statistician. MAXQDA Analytics Pro’s standard commercial licence is $1,174. For the social media qualitative data analyst, QDAMiner 6 was purchased as part of Provalis Research’s ProSuite package. It includes WordStat 10 and Simstat with a standard commercial licence for one year’s use costing $3,650. The wide range of pricing for the QDAS tools, from $600 to $3,650, suggested that the packages would differ widely in affordable function they support.
Developing a Features Checklist
The analysis started by developing an overview for the Twitter live data import features that ‘common QDAS software packages’ (Guest et al., 2012) support. The authors contrasted what each QDAS tool offered for live data across seven aspects: (i) extraction frequency, (ii) type of extraction, (iii) Twitter analysis tools, (iv) Twitter interlocutors’ data, (v) types of tweet, (vi) modes in a tweet and the (vii) amplification of tweets. A head-to-head checklist (see Table 1) was tabulated for these aspects with reference to their online guides and support forum feedback. Table 1’s grey colours spotlight the key disparities to be expected between the QDAS tools’ feature sets. The many discrepancies highlighted in that checklist confirmed the research question’s viability.
Load-Shedding as the Data Extraction Focus
To test the QDAS tools data extraction capabilities, the researchers collected datasets up to the seven days history limit that Twitter applies for live data extraction. The authors chose a widely unpopular South African topic, ‘load-shedding’. As the most intensive year for load-shedding, 2022 saw its national electricity supplier, Eskom, cut 2,276 GWh of electricity in the first six months – more than 90% of the 2,521 GWh it shed in 2021 (Council for Scientific and Industrial Research, 2022).
Since disruptions to the national electrical supply have a wide social impact, load-shedding is a popular trending Twitter topic in South Africa. It seemed germane for testing QDAS with large datasets, since even according to Eskom’s optimistic projections, South Africans faced rolling electricity blackouts until August, 2023 (BusinessTech, 2022).
Query Definition for Data Selection
Each research translated Table 2’s specific written queries to run via their QDAS Twitter query extractor. These queries did not apply filters (by date, type of reply or link-sharing or levels of engagement).
A Thematic Analysis of Eskom_SA’s Twitter Conversations
The authors did a thematic content analysis focused on question 1 in Table 2. Each researcher coded original tweets from @Eskom_SA, including replies, in a ‘bottom-up’ way. The thematic content analyses included: (A) auto-coding with QDAS, (B1) themes addressed in @Eskom_SA’s original deliberations and (B2) its tweet replies, (C1) multimodal content, (D1) language and translation and (E1) Twitter users’ self-presentation choices.
Qualitative Data Analysis Software Reviews and Discrepancies
In bi-weekly meetings, each QDAS user reported on their research experiences in organising the content thematic analysis. While the authors could have focused on the four broad activities of quantitative analysis; organising, exploring, reflecting and integrating, the first phase was chosen as a concise starting point. Organising data is an important activity whereby a qualitative study’s large amounts of unstructured information and data are managed (Gilbert et al., 2014). Organising data is both a mechanical activity and an analytical one. Data, codes, variables and concepts all need to be organised in meaningful ways (such as by data type, source or chronology). Data that is related to other data was connected via codes, folders, links or sets. These connections may be data-driven, thematic or theory-driven. This iterative, connective process should enable researchers to see data more clearly by assigning it to a flexible framework.
The researchers met between October, 2022 and June, 2023 to discuss their research progress. These discussions explored discrepancies between their QDAS tools’ support for organising live Twitter data. The authors also contrasted differences in the time taken for the same functions, since time-saving via organisational efficiency is an important benefit for QDAS users (Smith & Hesse-Biber, 1996).
Ethical Considerations
In comparing software for Twitter data extraction, the primary ethical considerations related to users’ privacy, and making software comparisons that were accurate and fair:
We do not quote Twitter posts in this article, nor are any individual Twitter users’ personal details shared. The research team follows the ‘Ethical decision-making and internet research (version 2.0) recommendations of the American Association of Internet Researchers’ (AAoIR) Ethics Working Committee’(Markham et al., 2012) and AAoIR’s initial guidance (Ess & Jones, 2004). In researching with Twitter data, the authors follow its developer agreement and policy (Twitter, 2022). It is not possible to share our data, since sharing QDAS project files must include individual Twitter user’s profile information and tweets. Although these are public, many Twitter users have information flow solipsism (Proferes, 2017). They are unlikely to expect their tweets to be captured and reshared in other publication contexts, such as in scholarly databases. In addition, republishing users’ data creates a legal risk for this paper’s authors, who may be in breach of Twitter’s terms of use and research data access undertakings.
For a fair software comparison, experienced QDAS users reviewed their use of these tools with live Twitter data in the organisational research phase. This process’ credibility is well-supported by a comparative checklist and organisational comparisons with the same queries.
Findings
In the organisational stage of research, key disparities emerged in four parts, namely: Twitter data extraction (Part 1); supporting familiarity with data (Part 2); functionalities for thematic analysis (Part 3) and visual organisation for small data analysis (Part 4).
Part 1. Disparities in Twitter data Extraction
In November and December, the authors ran queries and extracted different amounts of data.
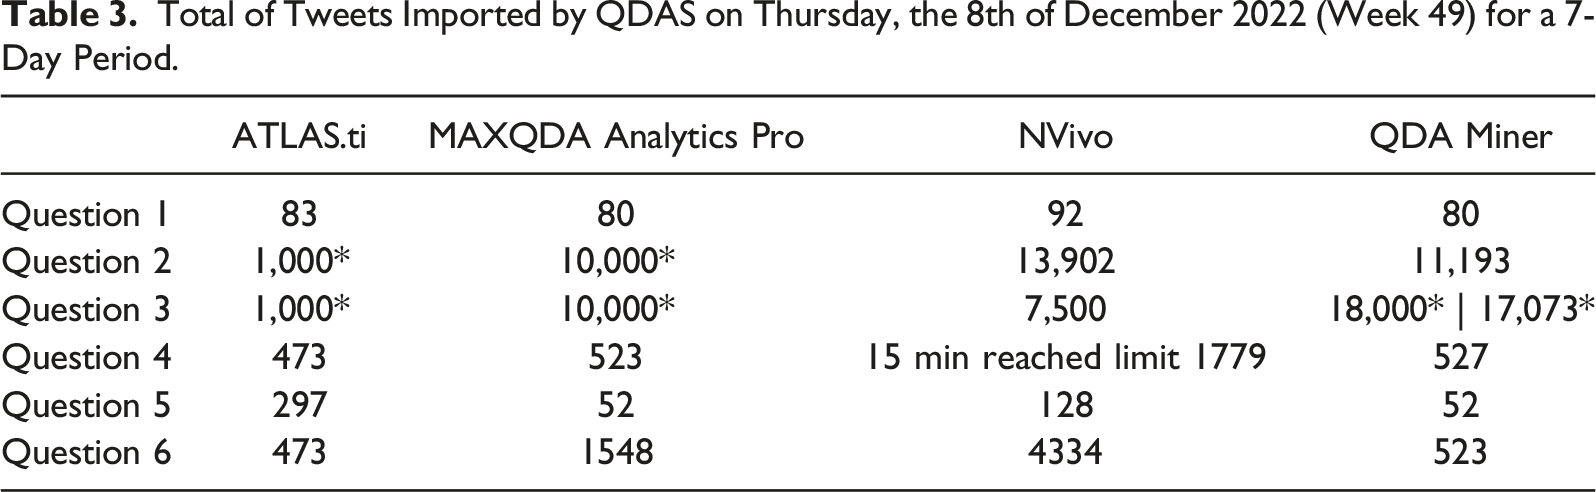
Total of Tweets Imported by QDAS on Thursday, the 8th of December 2022 (Week 49) for a 7-Day Period.
Total of Tweets Imported by QDAS on the 13th of December 2022 Querying a 24-Hour Period.
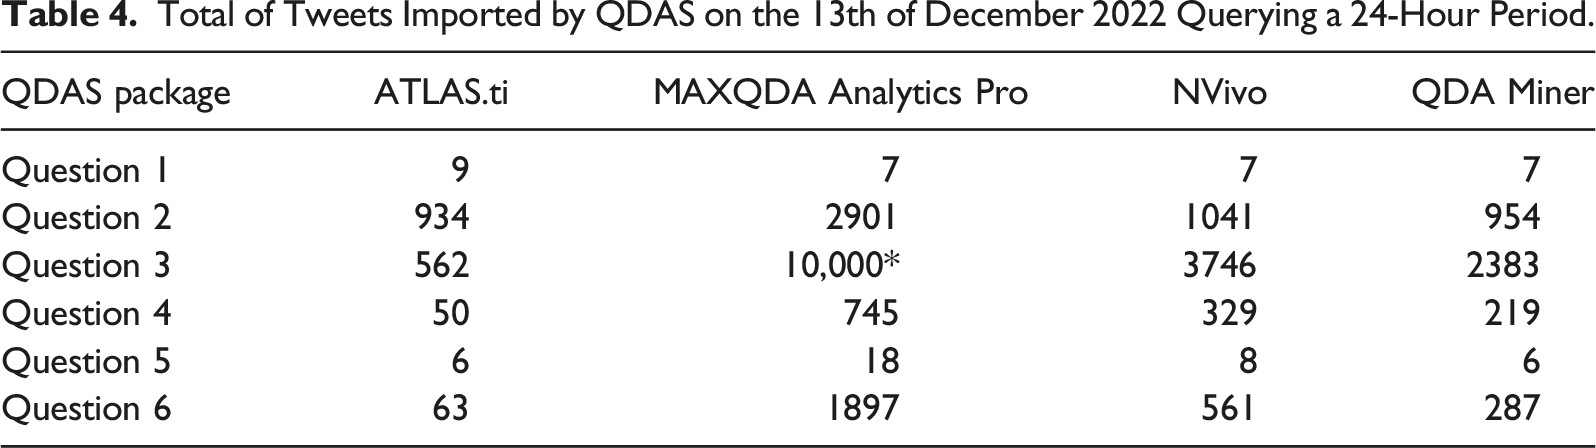
Surprisingly, the time periods that the extractions ran over differed. Less unexpected were the differences in the types of tweets that the QDAS tools imported: In the first place, the research team’s shared assumption that QDAS tools would import for the same time windows proved incorrect. ATLAS.ti, MAXQDA and QDA Miner’s queries stretched over the most recent 24-hour period (e.g. 12th of December, 12:59 to the 13th at 12:51). However, the same query translated in NVivo NCapture covered the previous day (12th of December, 00:04:13 to 23:53:31).
The differences in the types of tweets that each package imports were evident: In addition to MAXQDA having a relatively high tweet import limit, it was unique in automatically importing both original tweets and the replies to them. NVivo is also only governed by Twitter’s rate limit but did not import replies. The replies that MAXQDA imported outnumbered the tweets in each spreadsheet. This explained why MAXQDA’s aggregates were often twice that of NVivo’s.
ATLAS.ti imported the least tweets of all QDAS. This is likely due to it having the most restrictive limit per query of 1000 tweets. However, ATLAS.ti indicates the limits are guided by Twitter constraints. Furthermore, download volumes may vary according to hardware, time of day and the number of requests already made (ATLAS.ti, 2022).
Qualitative data analysis Miner extracted less data than NVivo. Its owner, Lumivero, may be paying Twitter more to secure a more robust integration with Twitter’s API. Lumivero’s higher tier of API access would support NVivo’s users with extracting a larger volume of data.
In addition to variations in the types of tweet that can be extracted, it is also worthwhile to contrast differences in the Twitter interlocutors’ information that QDAS can extract. Table 1 shows how QDA Miner, NVivo and MAXQDA all support extracting data on the (i) authors account, (ii) their profile and (iii) followers/following. ATLAS.ti v9.1 does not support the import of (i) or (ii). This constraint makes it challenging for its users to extract profile data. Without its access, researchers would struggle to address Twitter users’ self-presentation choices. For example, scholars could not tackle how Twitter supports users’ ‘identity play’ (Phillips & Milner, 2018), signalling their social identity in complex ways through their Twitter biographies.
Part 2. Disparities in How Qualitative Data Analysis Software Support Familiarity With Data
It is very difficult to become familiar with Twitter data due to the complex rhizomatic nature of its structures (Grellier, 2013). A rhizome is a distributed, non-hierarchical networked system which can connect any point to any other (Deleuze & Guattari, 2004). A vigorous and complex rhizomatic network is conceptualised as a means of describing contemporary cultural activity (Adkins, 2014). When considered in relation to each other, a researcher must negotiate and explore the ‘rhizomatic’ aspect of Twitter conversational threads as ‘assemblages’: This analytical focus for culture spotlights the concept of a planar (non-hierarchical) network of connections. This lens supplants the hierarchical network structure that is typically prioritised through a traditional view of linear pathways and critical incidents. Individual tweets may spread out like the roots of a rhizome.
Twitter conversation threads can grow unpredictably via amplification (retweets and quotes) and/or in receiving replies at different times and threads of conversation. A researcher using inductive and/or qualitative methods confronts the challenge of bounding each conversation as a ‘rhizomatic assemblage’. Assemblages are a gathering and grouping of things (bodies, discourses, affects and other elements) (Roberts, 2021). As an analytic tool, the concept of assemblages supports researchers who describe the world as a complex and vibrant system of interconnected elements.
To familiarise themselves with the tweet content and users, the researchers chose to do a thematic content analysis of tweets from @Eskom_SA. The choice to analyse less than 100 tweets in each QDAS was intended to make data familiarisation easy. However, the researchers agreed that trying to develop familiarity with non-linear tweets across a spreadsheet was akin to following headlines across very different publications – or worse, listening to broken conversations between many individuals! Such an interpretative challenge links to tweets being small fragments that are not presented as meaningful wholes within wider communication (Sadler, 2021).
It was not possible for any of this paper’s authors to sort the tweets via QDAS into assemblages resembling a continuous, more conventional text. Instead, thematic coding proved necessary for each researcher to become familiar with the tweeted texts. The researchers applied manual and auto-coding to attain an aggregated overview of communications, which supported isolating similar tweets for comparison. The achievement of familiarity with the tweets was thus contingent on researchers’ applying codes for thematic analysis. The authors’ familiarity with the Twitter data was also shaped by differences in the information that QDAS tools make available with tweets, and regarding Twitter deliberators:
There were interesting discrepancies in terms of display of tweets that supported familiarity, or made the process more arduous: By default, ATLAS.ti and QDA Miner display data for each tweet on one screen. The ATLAS.ti and QDA Miner user endeavoured to organise new views that could better support familiarity with @Eskom_SA’s tweets. Both proved to be strenuous activities. By contrast, NVivo’s display of the data in 100 rows per spreadsheet supported quickly scrolling down tweets or user details. MAXQDA also provided a spreadsheet view, but its user could scroll through up to a thousand tweets on one sheet.
ATLAS.ti, MAXQDA, NVivo and QDA Miner also provide quite different options for researchers’ use of auto-coding, which could also impact their efficacy: QDA Miner supports auto-coding for author accounts, their profiles, number of followers/follows and locations. NVivo for Mac provides auto-coding for usernames, and the codes: hashtags, mentions, tweet type (tweet/retweet) and location. ATLAS.ti is like NVivo, but also offers auto-coding for languages, and adding links between authors and locations, or authors and @mentions. MAXQDA offers the most extensive auto-coding functionality. Its covers: tweets, types of tweet, words, hashtags, authors, mentioned accounts, languages and authors (by number of tweets and/or followers). Sophisticated auto-coding functionalities can save Twitter researchers a lot of time, particularly with large datasets where auto-coding expedites pattern identification. These functionalities can also be used for data validation, enabling researchers to compare their automatically generated codes versus manually assigned ones. Such comparisons may also be used to double check a codebook’s entries.
Qualitative data analysis software tools also differ widely in the modes they extract for tweet content. For example, QDA Miner provides the least information, as it excludes data for @mentions, hashtags, videos or images. This omission highlights the importance of researchers being able to check tweets in their original Twitter context, where the audio, emoji, font, image and video modes, plus original URL links can be sourced. As Stuart Shulman explains in his ‘The Case Against Spreadsheets’ video; ‘It is the interactional, evolving, multimodal media content and distinctive, colour-rich look and feel that makes Twitter a quintessential early 21st century social media platform’ (Shulman, 2021). Since QDAS spreadsheets do not capture Twitter’s multimodal aspects, spreadsheets cannot support reliable and authentic interpretation practices for tweets. Shulman argues that studying tweet content in spreadsheets is akin to ‘studying polar bears in a zoo to explain their fate on the melting ice caps’. He recommends that scholars using qualitative methods must consider how tweets shown in spreadsheets are fundamentally different from their display on Twitter. No QDAS tool offers a seamless option for native views of ‘live’ Twitter data. Only NVivo supports automatic look-up for tweets, which makes it a less inefficient choice for multimodal content analysis versus ATLAS.ti, MAXQDA or QDA Miner.
Part 3. Disparities in Qualitative Data Analysis Software Tools’ Support for Thematic Analysis
The authors’ thematic content analysis followed an inductive approach that developed themes from @Eskom_SA’s original tweets and replies. The research team applied the same codebook and noted only minor differences between the support of ATLAS.ti, NVivo, QDA Miner and MAXQDA for coding. Whilst the researchers noted limited differences in manual coding functionalities, they each shared advantages experienced with particular packages. For example, on review evidence of similar colour coding shortcuts emerged. With respect to thematic analysis, the researchers expressed disparate preferences, particularly with regard to effectiveness and efficiency. In contrast to the ATLAS.ti and QDA Miner user, the MAXQDA and NVivo users preferred to view many tweets on the screen for data familiarity and efficient manual coding.
Part 4. Disparities in Visual Organisation for Efficient Small Data Analysis
The checklist comparison of common Twitter import features (Table 1) shows that large differences exist in QDAS tools’ support for efficient small data analysis. Their options related to visual organisation differed widely:
While ATLAS.ti offers basic visualisation capabilities, these are not extensive. Its visualisation functionalities primarily focus on displaying coded data, creating charts and network diagrams to represent qualitative findings, whilst visualising the relationships between codes and categories. MAXQDA also offers just a few data visualisation options, such as document and profile comparison charts, heat maps, word trees and word frequencies. Both MAXQDA and ATLAS.ti provide support for sentiment analysis through artificial intelligence tools that automatically evaluate web-based snippets for defining positive, negative and neutral sentiments.
NVivo supports the widest range of data visualisation options. Its text search and word frequency visualisation options support the organisation of tweets into broad categories. Searching their text using Boolean operators was easy, as was speedily generating tables and tag cloud graphics to spot the most popular tweeted words. Text search queries supported a Word Tree diagram that assisted the researcher with viewing the relationships between selected words and phrases. He also used cluster analysis to see when similar topics were covered across different weeks.
Familiarity with patterns in the data was supported by matrix coding queries. For example, the researcher could explore which weeks featured humorous replies to @Eskom_SA’s load-shedding notices. The functionalities of ‘explore diagram’, ‘chart’ and matrix coding also helped the researcher become more familiar with Twitter users’ attitudes and experiences – the explore diagram showed the codes used for a Tweeter’s case, while chart showed coding frequency. Several of NVivo’s data visualisation options listed in Table 1 were only supported in the PC version, though. The researcher using NVivo for Mac could not test the data visualisation functions for ‘maps (geo-visualise)’, ‘infrastructure sources’, ‘sentiment’, ‘sociogram’ and ‘time chart’.
While QDA Miner was less extensive than NVivo, it did offer several data visualisation options that the other QDAS tools did not. These were heatmaps, bubble charts and a deviation table. For Twitter analysis, these charts are useful for qualitative researchers who may design: a heatmap to develop familiarity with the frequency of tweets about a particular topic; a bubble map for tracking the geographic spread of information via a social network and identifying tweets that are outliers or deviate from the norm using a deviation table.
Discussion
This pathfinder study’s comparative review uncovers how the ‘same’ route for live Twitter data analysis via four different QDAS tools not only could involve very different functionalities but also contrasting experiences for researchers in their organisational phase of qualitative analysis:
From the start, the selection of Twitter live imports via QDAS might seem efficient and low cost for staff at licence-holding universities. However, this route places many constraints on researchers linked to querying Twitter’s Public API. Notably, scholars must focus on trending tweets (from the last seven days), versus historical ones. Large differences in live Twitter data import functionalities had important ramifications for the organisational phase. Although the QDAS were similar in their support for thematic analysis, wide disparities existed in their support for data extraction and how researchers could familiarise themselves with tweets:
A surprising finding lay in the disparities between the quantum of tweets that were extracted while each QDAS ran the ‘same’ query. These large differences stemmed from QDAS’ contrasting, Twitter API permissions, internal tweet import limits, import start times and the types of tweets automatically imported. Difference in the Twitter data types that QDAS excluded had important ramifications for scholars’ organisation of data for analysis:
MAXQDA and QDAMiner are best placed for qualitative researchers interested in studying amplification, since both QDAS import information on retweets and tweets’ likes. Only QDAMiner imports replies and quotes to support potential conversational thread organisation. However, it does not support Twitter modes, such as hashtags, which NVivo does.
There were also marked contrasts in how the QDAS tools supported familiarity with data, linked to differences in their support for visual organisation: ATLAS.ti assists researcher productivity by presenting network diagrams linked to codes and themes, expressing relationships and patterns well-suited to qualitative projects. NVivo’s data visualisations and coding views support quick familiarity with tweet text content, codes applied to individual users and patterns in the data. QDA Miner facilitates several Twitter-associated data analysis tasks. These include data import and organisation, coding and categorisation, text retrieval and exploration and content analysis. MAXQDA offers the most extensive auto-coding functionalities and is particularly well-suited to mixed-methods research, both in the statistical analyses and efficient data visualisations. Code, word and document frequencies can be charted in various ways via MAXQDA. Downloaded Twitter data are expressed in variables which can be analysed using descriptive statistics, and MAXQDA also makes comparison between groups possible.
Conclusions
This pathfinder study has addressed two important gaps. The first concerned live Twitter data organisation via state-of-the-art QDAS functionalities. The second concerned QDAS use with Twitter data for the organisational phase of qualitative research. Key disparities between QDAS functionalities, and researchers’ related experiences in organising data, were described. These covered the phases of (i) live Twitter data extraction, support for (ii) researchers’ familiarity with data, (iii) its thematic analysis and (iv) visual organisation for efficient analysis:
It was unsurprising that there were big discrepancies between QDAS tools whose subscriptions differed widely in price. Nevertheless, the authors were surprised at just how widely the QDAS packages could differ across each aspect of qualitative research organisation. For efficiency and cost, each author had previously used their institution’s licensed QDAS by default for every research project. However, after this rare opportunity to use different QDAS options, the researchers would consider using other packages where the additional costs justified the improved functionalities for the researcher’s preferred methods.
The choice of QDAS for research organisation depends on the task at hand with live Twitter data: For those researchers focused on their own wrangling of unstructured data where personal opinions are most valued, then ATLAS.ti would seem to be their tool of choice. ATLAS.ti is valuable in prioritising manual coding but gives the narrowest window when querying sizable tweeting activity. Overall, the short individual tweet genre made familiarity with its data challenging for the ATLAS.ti user.
Whilst QDA Miner offers most of the features of other QDAS tools, it has an easy-to-learn graphic user interface (GUI) that proved most advantageous. This made it far more efficient for its user to implement her methods versus ATLAS.ti’s complex rhizomatic GUI’s environment.
For studies requiring the extraction of Twitter data for content analysis, NVivo would seem to be their best choice. Its auto-coding options and wide range of data visualisations support deriving speedy familiarity with tweet content, codes applied for users and exploration with data patterns. Unlike the other three QDAS tools, NVivo also supports direct linking to original tweets. Its user can check each tweet’s original context less inefficiently.
Researchers keen to focus on mixed methods with a more statistical bent, would benefit from the use of MAXQDA as the most suitable tool. Results of qualitative analyses can be quantified in MAXQDA by creating frequency counts or crosstabulations to compare groups or apply more sophisticated statistical analyses. For example, combining the frequencies from the codes ‘event escalation’ and ‘outages, faults, restoration and maintenance’ can be statistically analysed in a crosstabulation table to determine when and how often they coincide. The most extensive auto-coding functionalities of MAXQDA can also support more efficient data validation and pattern identification in large Twitter datasets.
Strengths and Weaknesses
A strength of this paper’s research is that it focused on all four QDAS tools that support live Twitter data. A holistic overview of their related functionalities is presented for three researchers in organising their qualitative analysis. To minimise the researchers’ biases influencing the evaluation process and results of the review, each investigator chose QDAS to suit his or her dispositions. The statistician selected MAXQDA with its statistics plugin, the qualitative analyst selected ATLAS.ti and QDA Miner and the pragmatist selected NVivo.
They also met regularly to double check and question each other’s feedback.
The authors’ pathfinder exploration was an organic process that was iterative and evolutionary. As such, its QDAS software comparisons are not generalisable. However, this paper is transparent about its evaluation process. Such detail should support the credibility of this article’s findings.
A major challenge in comparative research with software is that the versions described may quickly become outdated as new functionalities are made available. This is somewhat mitigated through this paper’s focus on specific live Twitter data functionalities and their support of the initial phase of qualitative research. Given the complexity of coding such functionalities in new software, it seems unlikely that the Twitter functionalities will change significantly for several years after this paper’s publication.
That said, an important issue for QDAS Twitter import functionalities emerged in 2023. Twitter curtailed researchers’ accounts access to the formerly free API on the 1st of February. Since then researchers must pay $100 a month for Basic access (Twitter, 2023). QDAS companies may also be precluded from extracting data depending on their commercial relationship with Twitter. Subsequently, MAXQDA announced that it ‘will no longer be able to import Twitter data going forward’ (MAXQDA, 2023). Tweets imported into MAXQDA projects can still be analysed in its ‘Analyse Tweets’ workspace, though.
Although the study focuses on the qualitative research organisation of live Twitter data, it has academic value for qualitative researchers using QDAS tools to organise data imported from other social media platforms. Scholars ranging from the purely qualitative to those favouring strongly mixed methods are likely to face similar enablers and constraints when organising say, Reddit forum discussions or YouTube video commentary.
Recommendations
This paper spotlights major disparities in organising live Twitter data for qualitative research via QDAS tools. These disparities have important implications for educators, qualitative researchers and developers who use QDAS:
Educators can consider addressing the key capabilities that their prescribed QDAS support for qualitative research organisation of live Twitter data. In turn, lecturers can then address how particular capabilities and limitations of QDAS might potentially influence research outcomes. Limitations in data extraction will hamper a scholar in researching aspects of live Twitter data. For example, the exclusion of user profile data in ATLAS.ti will require lengthy workarounds for social science scholars keen to explore users’ self-presentation choices.
In their publications, academic users can explicitly address the implications of their QDAS tool’s strengths and weaknesses in supporting qualitative research. While this paper provides examples for familiarity with data, functionalities for thematic analysis and visual organisation, scholars should also consider adding aspects from the closing phases of their research.
Our software comparison also uncovered several suggestions for QDAS developers (Noakes, 2023). Notably research into conversations is poorly supported by all four QDAS tools. Each presented a myriad of isolated tweets in one document, creating a barrier to the original conversational context. Researchers would benefit from being able to order and sort tweets by conversation, and to link to these original threads on Twitter for greater context. Twitter has prioritised increasing the collective health, openness, and civility of the dialogue on its service (Gadde & Gasca, 2018). A useful step towards increased research into healthy Twitter conversations, or otherwise, could be QDAS GUIs that can support the efficient display of Twitter’s conversational threads.
Future Research
There are many opportunities to build on this paper’s QDAS software review. Researchers might continue exploring major disparities between QDAS tools’ support for the other qualitative research phases; exploring, reflecting and integrating data. Scholars can also make comparisons between other Twitter data routes in QDAS. There are research gaps on routes ranging from the static imports of advanced Twitter searches, to the costly purchase of data from commercial organisations.
Researchers might also explore cross-QDAS analysis routes (such as exporting data from ATLAS.ti to QDA Miner). The fast-changing software development environments of QDAS software and microblogging platforms also present many opportunities to update our understanding for new QDAS versions’ functionalities. Notably, QDAS tools are changing to address Artificial Intelligence, such as ATLAS.ti’s AI Coding Beta version (ATLAS.ti, 2023). QDAS teamwork collaboration is also a neglected area of QDAS research (Sin, 2008). Future research in this area could contrast Twitter research collaborations in particular analytical phases. Such diverse types of research contributions could help Twitter researchers better appreciate the merits and drawbacks of QDAS tools for diverse analytical approaches.
While we have focussed on QDAS for Twitter, there is also a broader opportunity for researchers to compare routes and tools for other microblogging platforms, such as Koo from India or Weibo from China. Comparing how QDAS handle other types of live data, such as from Reddit or YouTube, is also underexplored.
Finally, there is a big research gap for scholars to contribute a strong rationale for software comparisons in qualitative contexts. At the time of writing, little had been written on this topic and their rationales seemed under-developed. Even though this study addressed noteworthy disparities between four CAQDAS tools, the researchers also noted differences between personal QDAS preferences. These partialities highlight a need for further research that explores an important insight regarding the usability (UI) and user experience (UX) of QDAS tools.
Footnotes
Declaration of Conflicting Interests
The author(s) declared no potential conflicts of interest with respect to the research, authorship, and/or publication of this article.
Funding
The author(s) disclosed receipt of the following financial support for the research, authorship, and/or publication of this article: The researchers would like to thank the Noakes Foundation (TNF) for its continued support of the Academic Free Speech and Digital Voices research theme. TNF provided funding to cover subscriptions to MAXQDA Analytics Pro and QDA Miner.