
Abstract
The most important national surveys of the general population for creating official statistics or public policymaking in many countries, including South Korea, are still conducted using face-to-face interviews with household members. Recently face-to-face surveys have faced threats to data quality from decreasing response rates and rising costs of in-person visits. The COVID-19 pandemic and associated lockdown exacerbated the situation for face-to-face surveys. Survey organizations suspended fieldwork or began to explore alternate means of collecting data. One alternative was a shift to telephone surveys; however, telephone interviews have encountered similar difficulties with declining response rates and increasing costs. Could a self-administered web survey be a viable alternative to interviewer-administered modes such as telephone interviews (CATI) or face-to-face interviews (CAPI)? Smartphones may offer opportunities not offered by other modes. We conducted a smartphone web survey using SMS invitations where a sample of cell phone numbers was selected by random digit dialing (RDD) and compared it with a large-scale national face-to-face survey (CAPI) where a sample of households was selected by stratified cluster sampling. The two surveys were conducted during the COVID pandemic in the second half of 2020. The coverage and sample representation of the smartphone web survey were comparable to that of the face-to-face survey. Despite the relatively small number of respondents, the quality of the smartphone web survey was sufficient to provide accurate data and compared favorably with the CAPI survey. The smartphone web survey yielded more reports of socially undesirable attitudes and behavior than the CAPI survey. The findings will guide researchers to explore new opportunities in establishing a web survey methodology that obtains data more conveniently, efficiently, accurately, and with less cost.
Keywords
Introduction
The last half-century has seen the rapid rise and subsequent decline of telephone surveys. A key attraction of telephone surveys was being able to use random digit dialing (RDD) methods, which provide a sample of households or persons through a random selection of telephone numbers, and to conduct inexpensive interviews via telephone. Given the recent precipitous decline in telephone survey response rates, and the rising costs of face-to-face data collection, researchers have been looking for alternative ways to conduct surveys among randomly selected samples representative of national populations (AAPOR, 2019). Web surveys offer a cost-effective alternative to interviewer-administered surveys, but no list or procedures exist for sampling directly into web surveys; alternatives such as address-based sampling (ABS) are needed. The recent COVID-19 pandemic and lockdown accelerated the need to find alternative methods for sampling and surveying general populations.
The rapid rise in the use of smartphones worldwide offers a potential solution. RDD methods could be used to sample mobile telephone numbers and invite users via SMS (short message service) or text message to complete a survey online. To be effective, the selection properties of the proposed solution need to be similar to those of the face-to-face “gold standard” (i.e., coverage bias should be minimized) and the measurement properties of the two approaches should be similar (i.e., mode effects should be minimized). In this paper we explore a smartphone web survey using RDD sampling and an invitation sent as a text message via SMS (i.e., an SMS invitation) to compare data quality and estimates to a traditional face-to-face survey in South Korea, focusing on health.
Background and Relevant Literature
We review the literature and related evidence regarding two features necessary for a smartphone web survey to be effective. First, we look at smartphone coverage (a necessary requirement for RDD sampling to be effective) and the use of SMS as a mode of invitation to a web survey (a necessary requirement to reach sample persons for a web survey). Second, we look at relevant mode comparisons of web and face-to-face surveys, focusing on probability samples of the general population.
RDD Sampling of Mobile Phone Numbers and SMS Invitations
Several features are necessary for this approach to be effective. First, there needs to be sufficiently high coverage of the population using mobile phones and low coverage bias. The Pew Research Center (2019) estimated that 95% of adults in South Korea owned a smartphone in 2018, compared to a median of 76% across 18 advanced economies (e.g., Netherlands 87%, U.S. 81%, and UK 76%). Thus, not only is mobile phone coverage relatively high (paralleling the heyday of RDD telephone surveys in the U.S.; see Groves et al., 1988; Lepkowski et al., 2007), but the vast majority of these are smartphones, enabling users to access the Internet and complete web surveys. The coverage of subpopulations using smartphones in South Korea is also very high. For example, smartphone ownership by 10-year age groups was estimated to be 99.6% for 20s, 99.5% for 30s, 99.5% for 40s, 99.9% for 50s, 93.1% for 60s, and 53.8% for 70 or above (National Information Society Agency, 2021).
Second, a mechanism is needed for sampling mobile phone numbers. Since Kim and Lepkowski (2002) reported on the rise of cell phone-only households and the decline of landlines, the Survey and Health Policy Research Center (SHPRC) at Dongguk University established its own dual frame (landline and cell phone RDD) and has used it for national telephone surveys on a variety of topics (see e.g., Kim et al., 2012; Kim et al., 2014; Lepkowski et al., 2005; Park et al., 2012). A study by Kim et al. (2017) found that only 3% of adults in South Korea were landline-only, almost all adults (97%) owned a cell phone (smartphone 91% and feature phone 6%), and cell phone RDD samples were much more demographically representative than landline RDD samples. Subsequently, SHPRC dropped the landline RDD frame and adopted a cell phone RDD frame only. Similar trends toward the adoption of a single cell phone frame have occurred elsewhere (see Kennedy et al., 2018; Peytchev & Neely, 2013). As the AAPOR task force (AAPOR, 2017, p. 2) noted “For most surveys in the future that use a telephone frame to reach the general population of the United States, the cell phone RDD frame will be sufficient because it will not lead to a meaningful amount of unit-level coverage error.”
Third, text messaging or SMS is sufficiently widespread to be an accepted method of survey invitation. Text messaging in South Korea is a popular feature (see National Information Society Agency, 2021): 97.0% of South Koreans in 2020 used text messaging via smartphone or tablet. Similar high rates of use occur in the U.S. (see Smith, 2015) and elsewhere. Further, findings regarding the use of text messages to invite individuals could differ depending on whether the recipient or sender pays for the message (Andreadis, 2020). In South Korea, the cost of SMS is borne by the sender.
A final potential barrier to the use of SMS is legal restrictions on unsolicited text messages. In the U.S., the Telephone Consumer Protection Act (TCPA) prohibits text messages without the recipient’s prior expressed consent (see Dayton et al., 2020; Marlar & Hoover, 2019). In Europe, the General Data Protection Regulation (GDPR) prohibits SMS without prior consent for commercial purposes (see European Commission, 2022). While interpretations vary across countries, non-commercial actors such as researchers are often exempt from such restrictions (see Andreadis, 2020; Kongsgard et al., 2014). In South Korea, unsolicited text messages without prior consent are proscribed by the Information and Communication Network Act; however, this only applies to advertising information for commercial use. Text messages for non-commercial use by public offices or non-profit organizations are exempt (see Korea Communications Commission, 2020).
Given these requirements, there is relatively little research involving the use of RDD sampling and SMS for inviting the general population to complete a web survey. There are a few examples of using SMS in combination with other modes or to conduct SMS surveys. In an early study, Steeh et al. (2007) sent text messages to 1884 randomly sampled numbers from one mobile phone provider in the U.S., asking them to call a toll-free number to complete a short survey by telephone. They did not offer incentives. Response rates were 2.6% for those who received only a text message, compared with 24.2% for those who received a text message followed by a telephone call and 23.2% for those who received the call only. In another early example, Balabanis et al. (2007) conducted a small experiment (n = 200) among randomly dialed UK mobile phone numbers. They sent SMS messages inviting recipients to participate in a survey online or by telephone, varying topic salience and survey sponsorship, but without incentives. They reported an overall response rate of 36.5% after three contact attempts.
Kim and Couper (2021) demonstrated the feasibility of this approach in South Korea, drawing a national RDD cell phone sample to compare two modes: a smartphone web survey using SMS invitations and a cell phone survey using computer-assisted telephone interviewing (CATI). Incentives were offered in both modes. Response rates (AAPOR RR1) were 5.3% for the web survey and 10.6% for CATI. For some demographic variables (e.g., gender), the web survey estimate was closer to national benchmarks, while for others (e.g., age) the CATI estimate was closer. Weighted estimates on substantive measures (smoking behaviors and attitudes) suggested more socially undesirable reports in the web mode (e.g., higher rates of smoking).
Two more recent studies have used RDD for sampling and SMS for invitations to a web survey. Bucher and Sand (2022) drew a simple random sample of 30,102 cellphone numbers from a frame obtained by four providers in Germany. Home location register lookups, to reduce the proportion of unassigned numbers, were only possible for two of the four providers, leaving 13,338 numbers in the sample. Text messages were sent, providing a link to complete a web survey. No incentives were offered. Only 6016 of the SMS messages sent were successfully delivered. A total of 161 people answered at least one question, and 102 completed the 36-item survey, yielding a response rate (AAPOR RR1) of .8%. Younger persons and those with higher education were overrepresented among the respondents. They concluded that “although recruiting respondents for web surveys via text messaging to smartphones is feasible, this approach is hampered by considerable issues relating to its implementation and the resulting data” (Bucher & Sand, 2022, p. 893-894), and urged further research on this topic.
Kocar (2022) randomly generated a set of Australian mobile numbers, which were then matched to a database of known users to remove non-working numbers and append selected demographics (age and gender). About 7% of the numbers were matched. The resulting sample of 27,000 numbers was split into 48 experimental groups to test the effects of survey reminders, day of the week, and time of day of the initial SMS, different types of incentives, and invitation text. The overall response rate (AAPOR RR2; see AAPOR, 2016) was 1.6%. Respondent demographics were compared to census data. The survey overrepresented females, those aged 55–74, those with a college education, and those born in Australia.
A few studies have used SMS both for inviting participants and for conducting the survey. Hoe and Grunwald (2015) conducted a short SMS survey among a simple random sample of mobile numbers associated with six zip codes surrounding a park in Philadelphia. Of the 1000 SMS invitations where a raffle of iPads was offered as an incentive, a total of 70 (7%) began the survey and 36 (3.6%) completed it. Lau et al. (2019) report on SMS surveys in four African countries (Ghana, Kenya, Nigeria, and Uganda). Uganda requires prior consent to send SMS messages, but the other three countries permit SMS invitations without prior consent. Lists of active mobile phone numbers were obtained from mobile phone network operators. Response rates to the 16-item SMS survey ranged from .3% in Nigeria and .6% in Ghana, to 12.1% in Kenya. Lau and colleagues compared the estimates from these SMS surveys with benchmark data from face-to-face surveys conducted in these countries. After weighting on age and sex, they found that the SMS surveys significantly underrepresented those with low education and the self-employed, and overrepresented those with Internet access. Some of these differences were very large. Sending reminders improved representativeness, but offering shorter surveys or higher incentives did not. They conclude that “SMS cannot replace high-quality FTF surveys” (Lau et al., 2019, p. 325).
Web versus Face-To-Face Comparisons
We note that our design does not permit us to disentangle selection effects from mode effects. Rather, we are comparing two systems of survey design, where both the sampling mechanism and the mode of data collection are varied. Relatively few studies have explored differences in estimates between national face-to-face and web surveys.
Some examples of cross-sectional surveys comparing web to face-to-face data collection include the American National Election Studies (ANES; DeBell et al., 2018), the U.S. Residential Energy Consumption Survey (RECS; Biemer et al., 2018) and the European Values Survey (EVS; Wolf et al., 2021). Most of these used ABS and mailed invitations to complete a web survey.
Most relevant to our study are two recent health surveys. Braekman et al. (2022) conducted a web survey in parallel to the Belgian Health Interview Survey (conducted face-to-face) in 2018. The national population register was used as a sampling frame for both surveys, and the sampled individuals aged 16–85 for the web survey were invited by mail. The substitution was used to replace nonrespondents in both surveys. The web survey questionnaire was shorter than the face-to-face questionnaire. Among 6183 individuals invited to the web survey, 16.3% (1010) completed the survey, and among 7698 those invited to the face-to-face survey, 43.1% (3316) did. A lower response rate was observed for the web survey among all compared sociodemographic groups (especially, those aged 65 years and older, lower educated people, a non-Belgian nationality, and people living alone). The cost per completed questionnaire was €41 (US$48) for the web mode, compared with €111 (US$131) for the face-to-face mode. Braekman et al. (2022) did not report on differences in substantive estimates between the two surveys.
In 2021, the UK National Health Service conducted a feasibility study (FS) of converting the Health Survey for England (HSE) from face-to-face interviewing to self-completion modes (see NHS Digital, 2021). This was in response to the cessation of face-to-face interviewing in 2020 due to the COVID-19 pandemic. ABS was used to select addresses from the Postcode Address File (PAF). A stratified random sample of 19,500 unclustered addresses was selected, with up to two adults aged 16 or older per household invited to respond to the survey online. A paper questionnaire was sent to nonresponding households. Including paper questionnaire response, the adjusted (after removing ineligible addresses) address-level response rate was 25%, substantially lower than the equivalent rate of 60% obtained in the 2019 HSE. The adjusted individual-level response rate was 17%. Seventy percent of respondents completed the survey online.
In terms of demographic differences, both the web/paper and face-to-face surveys overrepresented women relative to the population. Similarly, in both surveys, younger age groups were underrepresented compared with older age groups. Responding adults in the web/paper survey were also more likely to be older, from white backgrounds, living in less deprived areas of the country, and less likely to be renting their homes compared with those in the face-to-face survey.
In terms of substantive differences, the report concluded: “…results across a number of questions suggest that the HSE FS may have missed less healthy individuals and individuals who had less healthy lifestyles.” The study concluded that “The HSE FS achieved a less representative sample of participants than the face-to-face surveys which weighting may not completely compensate for” (NHS Digital, 2021).
While there are many other experimental comparisons of mode effects between web and face-to-face surveys, most of these involve pre-recruited samples or panel studies, or mixed-mode designs (e.g., Bianchi et al., 2017; Biemer et al., 2022; Jäckle et al., 2015; McGonagle & Freedman, 2017; Ofstedal et al., 2022). We do not review these further as they do not directly pertain to our comparison.
With the critical requirements for conducting an RDD-based survey using SMS invitations to a web survey in place, we conducted a national RDD smartphone web survey to compare estimates with those from a face-to-face health survey in South Korea, the Korea Community Health Survey (KCHS) sponsored by the Korea Centers for Disease Control and Prevention.
Study Design, Implementation, and Data Analysis
There were several reasons for choosing the KCHS as a comparison target among many face-to-face household surveys conducted in 2020. First, to minimize temporal changes, we wanted a survey that was conducted in the same period. Second, we wanted a survey administered using computer-assisted personal interviewing (CAPI) rather than paper-and-pencil, making it more similar to the web-based survey. Third, we wanted a survey focusing on health issues of broad interest to the general population. Fourth, we wanted a large-scale household survey conducted or sponsored by a government agency that provides accurate data with a high response rate. The KCHS satisfied all these conditions (see Korea Centers for Disease Control and Prevention, 2020; 2021).
The national RDD smartphone web survey for this study, named the 2020 National Survey of Life and Health (NSLH), was conducted by the Survey and Health Policy Research Center (SHPRC) at Dongguk University. The sample design, implementation, and data analysis of the two surveys are described below.
NSLH
Sample Design
Since 2018, SHPRC has been using a cell phone-only RDD frame for two major reasons. First, cell phone RDD samples in South Korea were much more demographically representative than landline RDD samples. Second, interviewing and supervision costs in landline RDD surveys were three times more expensive than those in cell phone RDD surveys due to a large difference between the numbers of completed interviews per hour (.65 for landlines vs. 1.83 for cell phones in 2017). This differs from the U.S., where the costs of cell phone RDD surveys were reported to be substantially greater than those of landline RDD surveys (see AAPOR, 2010).
In general, survey organizations in South Korea use a cell phone RDD frame because public access to a comprehensive record of individual subscribers of cell phone numbers, such as the national directory databases owned by telecommunication companies, is strictly forbidden by telecommunications law. The cell phone RDD frame at the SHPRC has been constructed using active seven-digit cell phone number prefixes. Some seven-digit number prefixes used by specific businesses or public organizations have been identified and removed using publicly available information. All 10,000 possible suffixes from 0000 to 9999 are then appended to the remaining seven-digit prefixes to create an RDD frame of eleven-digit cell phone numbers. The cell phone RDD frame size consisted of 69,720,000 numbers. Considering that there are 55,857,980 individual cell phone subscribers (Ministry of Science and ICT, 2020), it is estimated that 80% of phone numbers in the cell phone RDD frame are used by the general population.
Sample size
We aimed to achieve about 1000 completed interviews as a final sample size, typically required for nationwide polls or social research. A previous study by Kim and Couper (2021) obtained a total of 537 completed interviews from a smartphone web survey using an initial sample of 15,900 RDD cell phone numbers. Assuming similar response rates, we decided to select an initial sample of 30,000 numbers, to achieve a sample size of 1000. A reserve sample was not considered.
Sampling Method
We used an unstratified and unclustered single-stage equal probability of selection method (EPSEM) to select an initial sample of 30,000 eleven-digit numbers from the cell phone RDD frame at the SHPRC. In South Korea, geographical stratification for eleven-digit cell phone numbers by area codes that match administrative divisions is not possible because they share a single mobile prefix “010” instead of area codes. The single-stage EPSEM provides equal probabilities of selection for all cell phone numbers in the frame, and hence the sample is self-weighted, that is, the reciprocal of the probability of selection of each cell phone number in the sample is the same. Self-weighting samples are often preferred for many surveys because they possess considerable advantages in reduced variances, simplicity, and robustness (see Kish, 1992, pp. 194-195).
Data Collection
Four sample replicates of 7500 numbers each were used to manage and monitor data collection and evaluate the consistency of outcomes. The web survey for each replicate was open for four weeks, with replicates released a week apart. Data collection lasted for a total of 7 weeks, from October 12 to November 28, 2020.
Survey Invitations
The design and content of the SMS text message invitation, which is the sample person’s first exposure to the study, are critical for maximizing the response rate. The invitation was written to engender trust and was limited to 135 words to be concise and to distinguish it from unwanted or unsolicited commercial text messages. It included a brief description of the university-based survey organization (SHPRC), the primary purpose and importance of the survey, a link to the university website with detailed information on the NSLH, requirements for participation (use of a smartphone), voluntary participation, explanation of the incentive, advance notice of screening questions at the beginning of the survey, expected survey duration, the method of selection (“We randomly selected your phone number by a computer, and do not have any of your personal information”), the statement “We are not advertising or selling anything,” and a unique short link to the survey. The invitation was sent on Mondays (weekdays) using an SMS text messaging service.
Reminders
Three follow-up SMS reminders were sent once a week for three weeks. The first reminders were sent on Mondays; the second and third reminders were sent on Sundays. In each reminder, the dates of the previous invitations were stated and the importance of voluntary participation was re-emphasized with the original invitation message.
SMS Text Messaging Service
In South Korea, many commercial SMS text messaging services can assist in sending out invitations and reminders to sample numbers in a batch process. We used Aligo (see https://smartsms.aligo.in/). It costs only a few cents per SMS message and provides real-time information on the delivery status and reasons for delivery failures when a message is queued, sent, delivered successfully, or not delivered by the carrier. We allowed recipients to refuse to receive SMS messages at any time by simply clicking the Refusal button at the bottom of the SMS message.
KCHS
Sample Design
Begun in 2008, the KCHS is a community (municipality)-based large annual health survey covering the adult household population. This survey was conducted by 255 community health centers located in cities and counties across the country, in cooperation with universities within the communities. A sample of households was selected by stratified two-stage cluster sampling in each community. All adults were selected (interviewed) within each sample household. A similar number of adults (about 900) were interviewed in each community, and about 230,000 adults nationally. Since all communities have different numbers of households, the selection probabilities of households vary, accordingly survey weights should be applied during the analysis to compensate for unequal selection probabilities.
Data Collection
The KCHS was conducted from August 16 to October 31, partially overlapping with the NSLH. The 2020 Population and Housing Census conducted by Statistics Korea, which provides detailed information on the demographic characteristics of the general population, was conducted from October 15 to November 18 in the same year. The demographic profiles from the Census data are useful for evaluating the quality of the NSLH and HCHS, as described later.
Survey Invitations
A one-page prenotification letter from the director of the community health center was sent via mail with a survey brochure to each sampled household (Korea Centers for Disease Control and Prevention, 2020, p. 29).
Reminders and Callbacks
The guidelines specified a minimum of three callbacks (attempts) to reach members of the sample household. In practice, interviewers often made more than three callbacks to reduce non-contacts or refusals (Korea Centers for Disease Control and Prevention, 2020, pp. 40-41).
Questionnaires
National Survey of Life and Health
The NSLH questionnaire consisted of 50 questions, divided into an introductory statement (similar to the invitation text message) and five sections. The survey specified that only smartphone users could participate in the survey, but did not specify which device (smartphones, PCs, or tablets) should be used to respond, and asked what device was used both at the beginning and end of the survey. The first section asked four screener questions (last 6 digits of the cell phone number; geographic location of residence; cell phone use; and age) to determine eligibility for the survey. The second section asked 4 subjective questions and 19 factual questions about key health topics, selected from 142 common questions at the national level from the KCHS questionnaire. The third section asked about the devices used for responding to the web surveys and the incentive (choice between a mobile coupon or cash). The fourth section asked 11 questions about various daily activities including smartphone use. The fifth section asked standard demographic questions (gender, education, employment, marital status, household size, and housing occupancy status), which replicated questions used in the Census and on the KCHS. The questionnaire was optimized for smartphone respondents. There were no grid or matrix questions. Each web page contained a single question, that is, one question per smartphone screen. Response options were displayed in a single vertical list to minimize the need for horizontal scrolling.
Excluding extremely high outliers (respondents could suspend and resume the survey), the NSLH took an average of 10.7 minutes (a median of 8.2 minutes) to complete. There were no extremely low outliers.
Korea Community Health Survey
The number of questions in the KCHS questionnaire varied depending on the community. The questionnaire covered a variety of topics on personal health practices and behaviors. The average completion time at the national level for the KCHS was 28 minutes (Korea Centers for Disease Control and Prevention, 2020).
Survey Software
For the NSLH, we used SurveyMonkey (see https://ko.surveymonkey.com). It is available in the Korean language and web surveys are automatically adapted for smartphones. We tested the instrument on various smartphones and operating systems (e.g., Samsung Galaxy and Apple iPhone). A user agent string (UAS) helps identify which browser is being used, what version, and on which operating system, according to the type of device used (smartphone, tablet, laptop, or desktop). However, SurveyMonkey does not make the UAS available to researchers, so we relied on self-reports of devices used at the beginning and end of the survey.
The KCHS was administered using CAPI software developed by a company in South Korea. The interview data was transferred to a central database and monitored in real-time (Korea Centers for Disease Control and Prevention, 2020, pp. 21-22).
Incentives
In the NSLH, offering a mobile coupon or cash as an incentive was mentioned in both the SMS text message invitation and the introductory statement of the questionnaire. The amount was not specified and was revealed only if there was a phone inquiry. Respondents were offered a 2000 KRW mobile coupon (worth about $1.74USD) or 2000 KRW in cash for completing the survey.
In the KCHS, the incentive amount was also not mentioned in the prenotification letter or the introductory statement of the questionnaire. A 10,000 KRW gift certificate (worth about $8.70USD) was offered for completing the survey (Korea Centers for Disease Control and Prevention, 2020, p. 44).
Weighting and Data Analysis
The KCHS is designed to produce separate estimates for each of the 255 community health centers. Reports and microdata (in the form of SAS files) can be downloaded by request from the KCHS website (https://chs.kdca.go.kr/chs/main.do) in Korean. Given the community focus of the KCHS, survey weights for calculating national estimates of population parameters are not available. The results of national-level analyses are officially reported as a median of 255 community-based weighted estimates. Thus, national-level survey weights are needed to compare the KCHS with the NSLH. In addition, the KCHS attempts to interview all adults from each sample household, whereas the NSLH was a sample of persons. Given this, we first randomly subsampled one person from each household in the KCHS, leaving us with 125,585 of the 229,269 respondents (55% of KCHS respondents). The base weight (the household weight in the sample) in the microdata was then multiplied by the number of adults in the household.
Poststratification was used to reduce sampling variance and nonresponse and noncoverage biases (see Kish, 1992, p. 187). We evaluated two forms of poststratification. For the first, the base weights were adjusted so that the weighted totals within each of 170 post-strata divided by the domains (17 administrative divisions of 8 cities and 9 provinces, 2 gender groups, and 5 age groups) equal the population totals in the 2020 Census. For the second, the base weights were adjusted using 40 post-strata divided by the domains (2 gender groups, 5 age groups, and 4 levels of education) in the same way as the first. The two forms of postratification yielded very similar results, so we present only the results from the second version here.
For the NSLH, the EPSEM RDD sample was self-weighted, so the base weight was the same for all cell phone numbers in the sample. We evaluated two forms of poststratification, similar to the KCHS. Again we only present the results from the second version.
Often called the unequal weighting effect (UWE), the design effects due to unequal weighting (Kish, 1992), indicating an increase in the variance of the survey estimates resulting from final weights, were 1.97 for the NSLH and 2.06 for the KCHS. These final weights in the two surveys were used to analyze survey results, described later.
Item Missing Data
The web survey for the NSLH was designed so that the respondents could change their responses to earlier questions but could not advance without answering a question, so item nonresponse was minimal among completed surveys. There was no explicit “Decline to Answer” response option such as “Refuse to Answer” or “Don’t Know.”
For the KCHS, which allowed an explicit “Decline to Answer” response option, most of the common questions used in the analysis had very little item missing data. Four questions (To what extent do you think the government’s ability to respond to COVID-19 is appropriate?; Do you know your blood pressure level?; Do you know your blood sugar level?; BMI) had higher item missing rates (1239 cases, 382 cases, 715 cases, and 3596 cases respectively), but still less than 3% of the sample (125,585). If there is missing data for a question, we analyzed the rest of the data excluding the missing data for that question.
Results
Distributions of Cell Phone Numbers in the Smartphone Web Survey
Distribution of Cell Phone Numbers and Potential Errors in Sampling and Data Collection of the NSLH
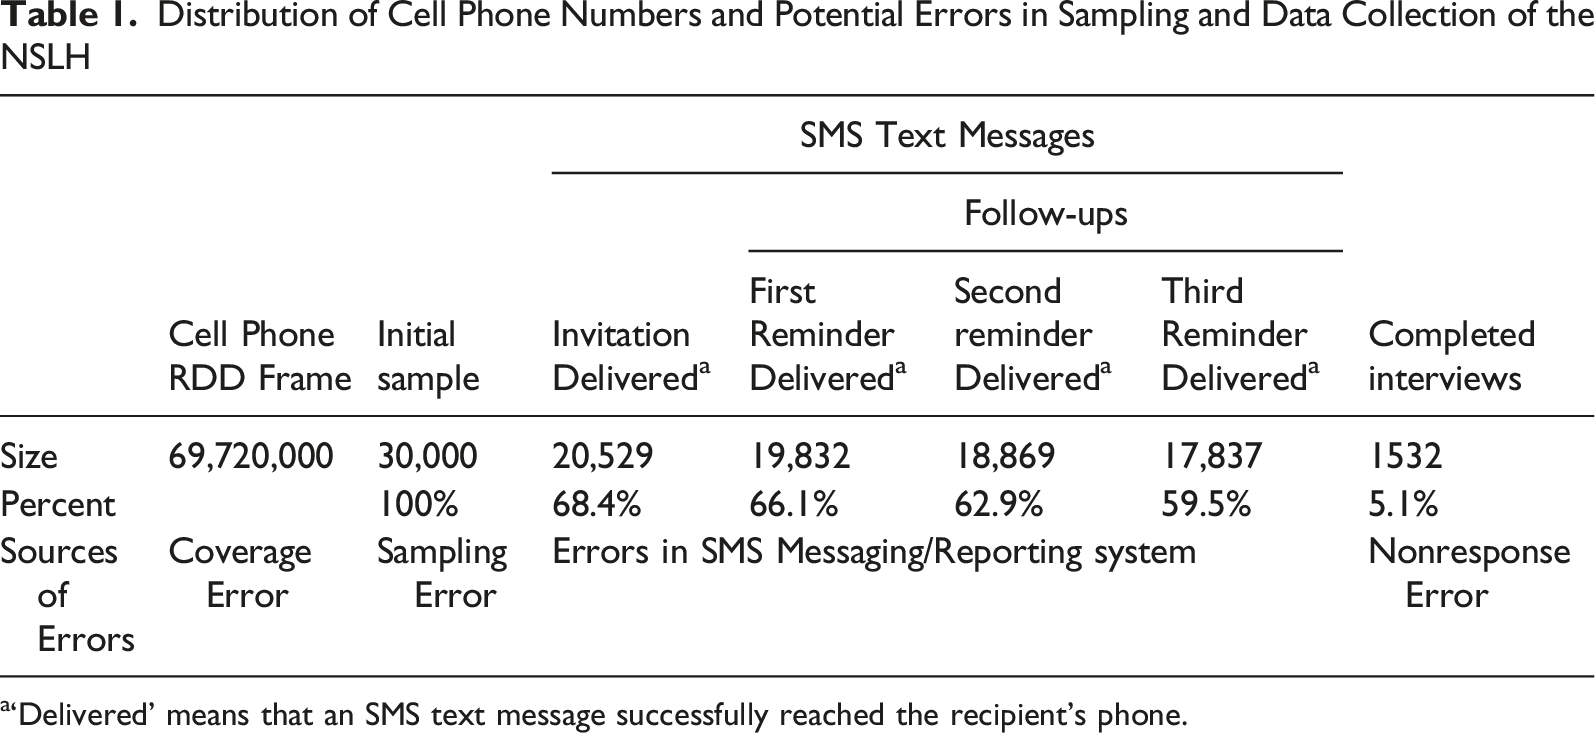
a‘Delivered’ means that an SMS text message successfully reached the recipient’s phone.
More than two-thirds (68.4%) of the SMS invitations were successfully delivered, with a declining percentage of reminders being delivered. Completed surveys were obtained from 5.1% of sampled numbers, and from 7.5% of numbers with a successful SMS invitation delivery. Appendix Table A1 shows the added yield with each successive reminder and additional details by sample replicate.
Efficiency of Screening the RDD Sample by SMS
Using the real-time delivery report of the SMS messaging system eliminated the need to screen the initial sample of 30,000 RDD cell phone numbers by trained operators or automatic systems to remove non-working numbers. The 68.4% delivery rate can be viewed as the working number rate in an RDD smartphone web survey. This was slightly lower than the working number rate of 75.4% obtained by Kim and Couper (2021, p. 1223) using trained operators to screen and remove non-working numbers. Using SMS, for which there is no charge for non-delivered SMS messages in South Korea, can help in reducing time, effort, and costs for smartphone web data collection.
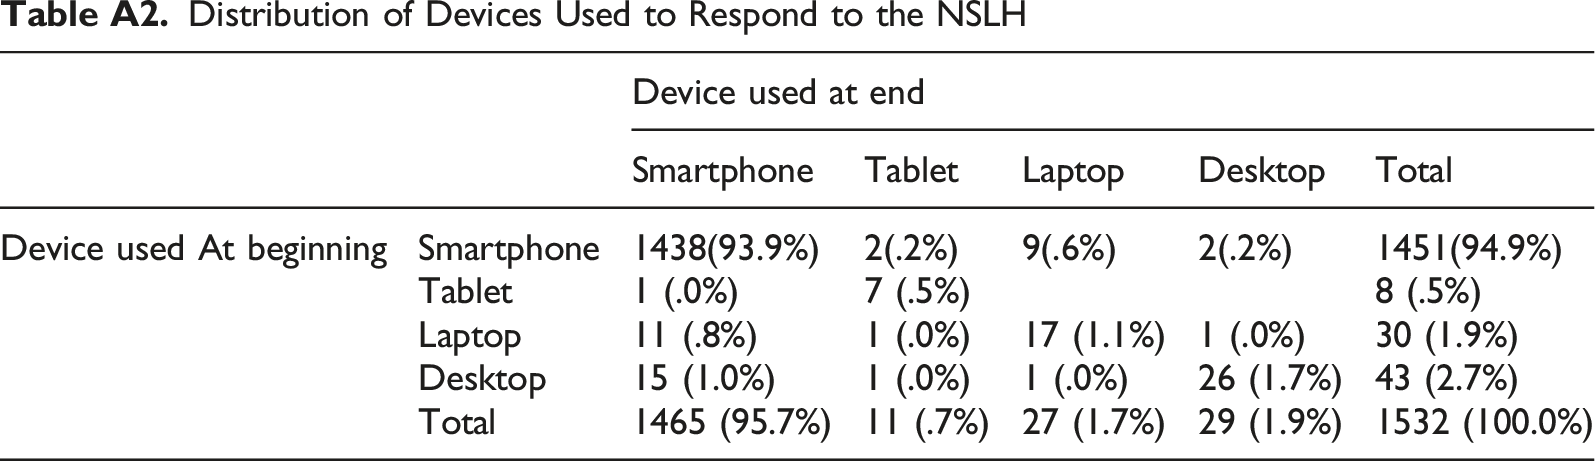
Self-Report of Device Used in the NSLH
We mentioned in the SMS message and the introductory statement of the questionnaire that the survey was restricted to smartphone owners. However, as noted earlier, we asked respondents what kind of device was used, both at the beginning and end of the survey. Appendix Table A2 shows the distribution of reported devices used. Most of the NSLH respondents (93.9%) reported using a smartphone both at the beginning and end of the survey. Given this, we based our analyses on all respondents, regardless of the device used.
Response Rates
Final Disposition Distributions and Response Rates in the NSLH
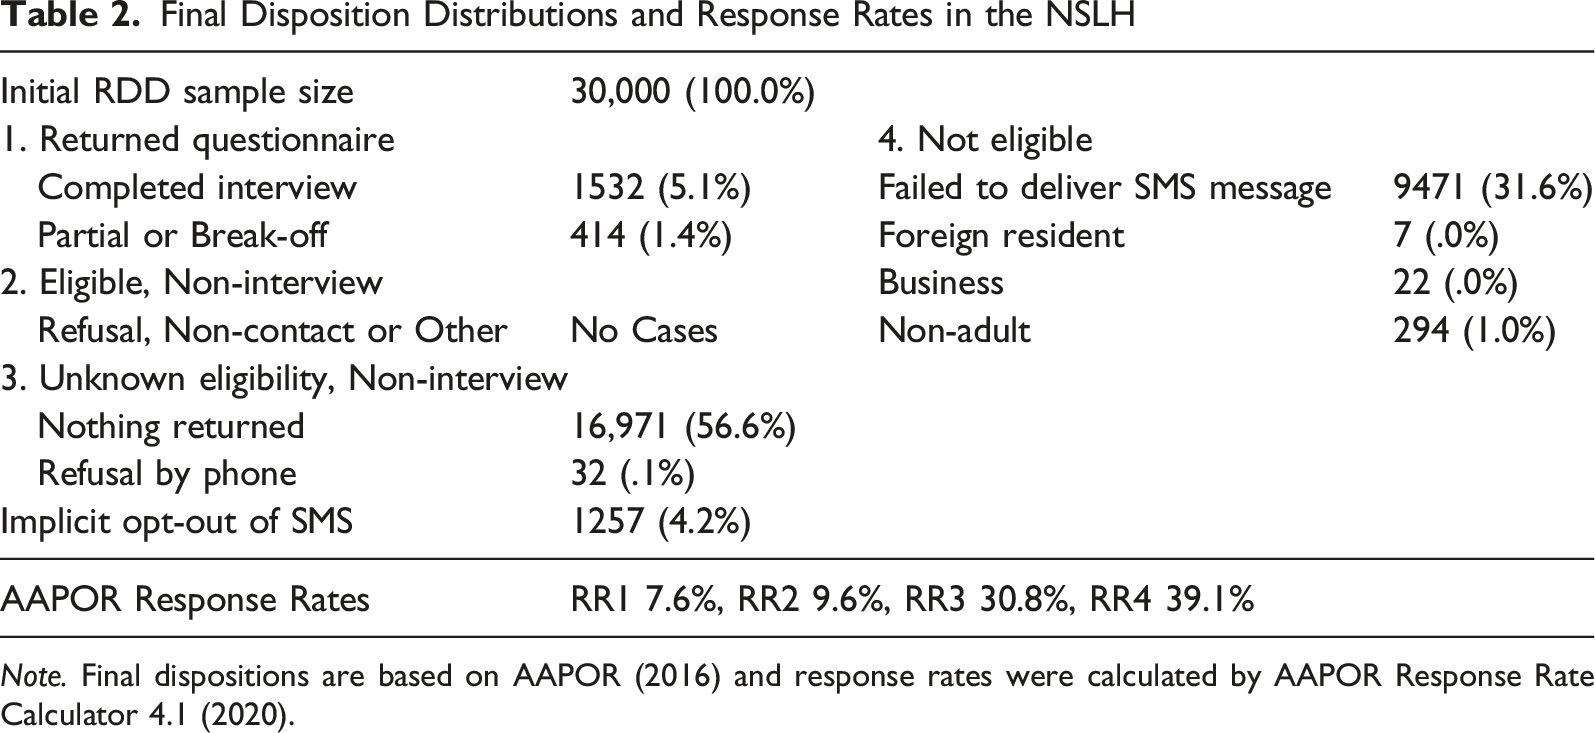
Note. Final dispositions are based on AAPOR (2016) and response rates were calculated by AAPOR Response Rate Calculator 4.1 (2020).
Response rate 1 (RR1) was 7.6%. This was slightly higher than the 5.3% RR1 obtained in a recent RDD smartphone web survey (Kim & Couper, 2021). RR2, which counts partial interviews as complete, was 9.6%. RR3 was 30.8%. This rate was calculated by using the estimated proportion of unknown eligibility cases that are eligible, often referred to as “e,” which was .166 (16.6%). This proportion is comparatively low due to a high number of cases being ineligible, such as non-adults or businesses. For example, the smartphone ownership rate among non-adults (ages 6–18) is about 95% (National Information Society Agency, 2021). About 15 million numbers out of a total of 70 million cell phone numbers are used for business and industrial purposes based on IoT technology (Ministry of Science and ICT, 2021). The RR3 (30.8%) was substantially higher than the corresponding rates (e.g., 6% in 2018) for RDD telephone surveys in the U.S. (Keeter et al., 2017; Kennedy & Hartig, 2019). RR4, which is similar to RR3 but includes partial interviews in the numerator, was 39.1%.
Directly comparable rates cannot be calculated for the KCHS. The household response rate (AAPOR RR6) at the national level is officially reported as an average and median of the 255 community-based rates. In the 2020 KCHS, these were 92.5% (average) and 94.4% (median) (see Korea Centers for Disease Control and Prevention, 2021). 1
Representation of Respondents Using Unweighted Estimates
Key Demographic Comparison Between Unweighted Sample Estimates and Adult Population Distributions.
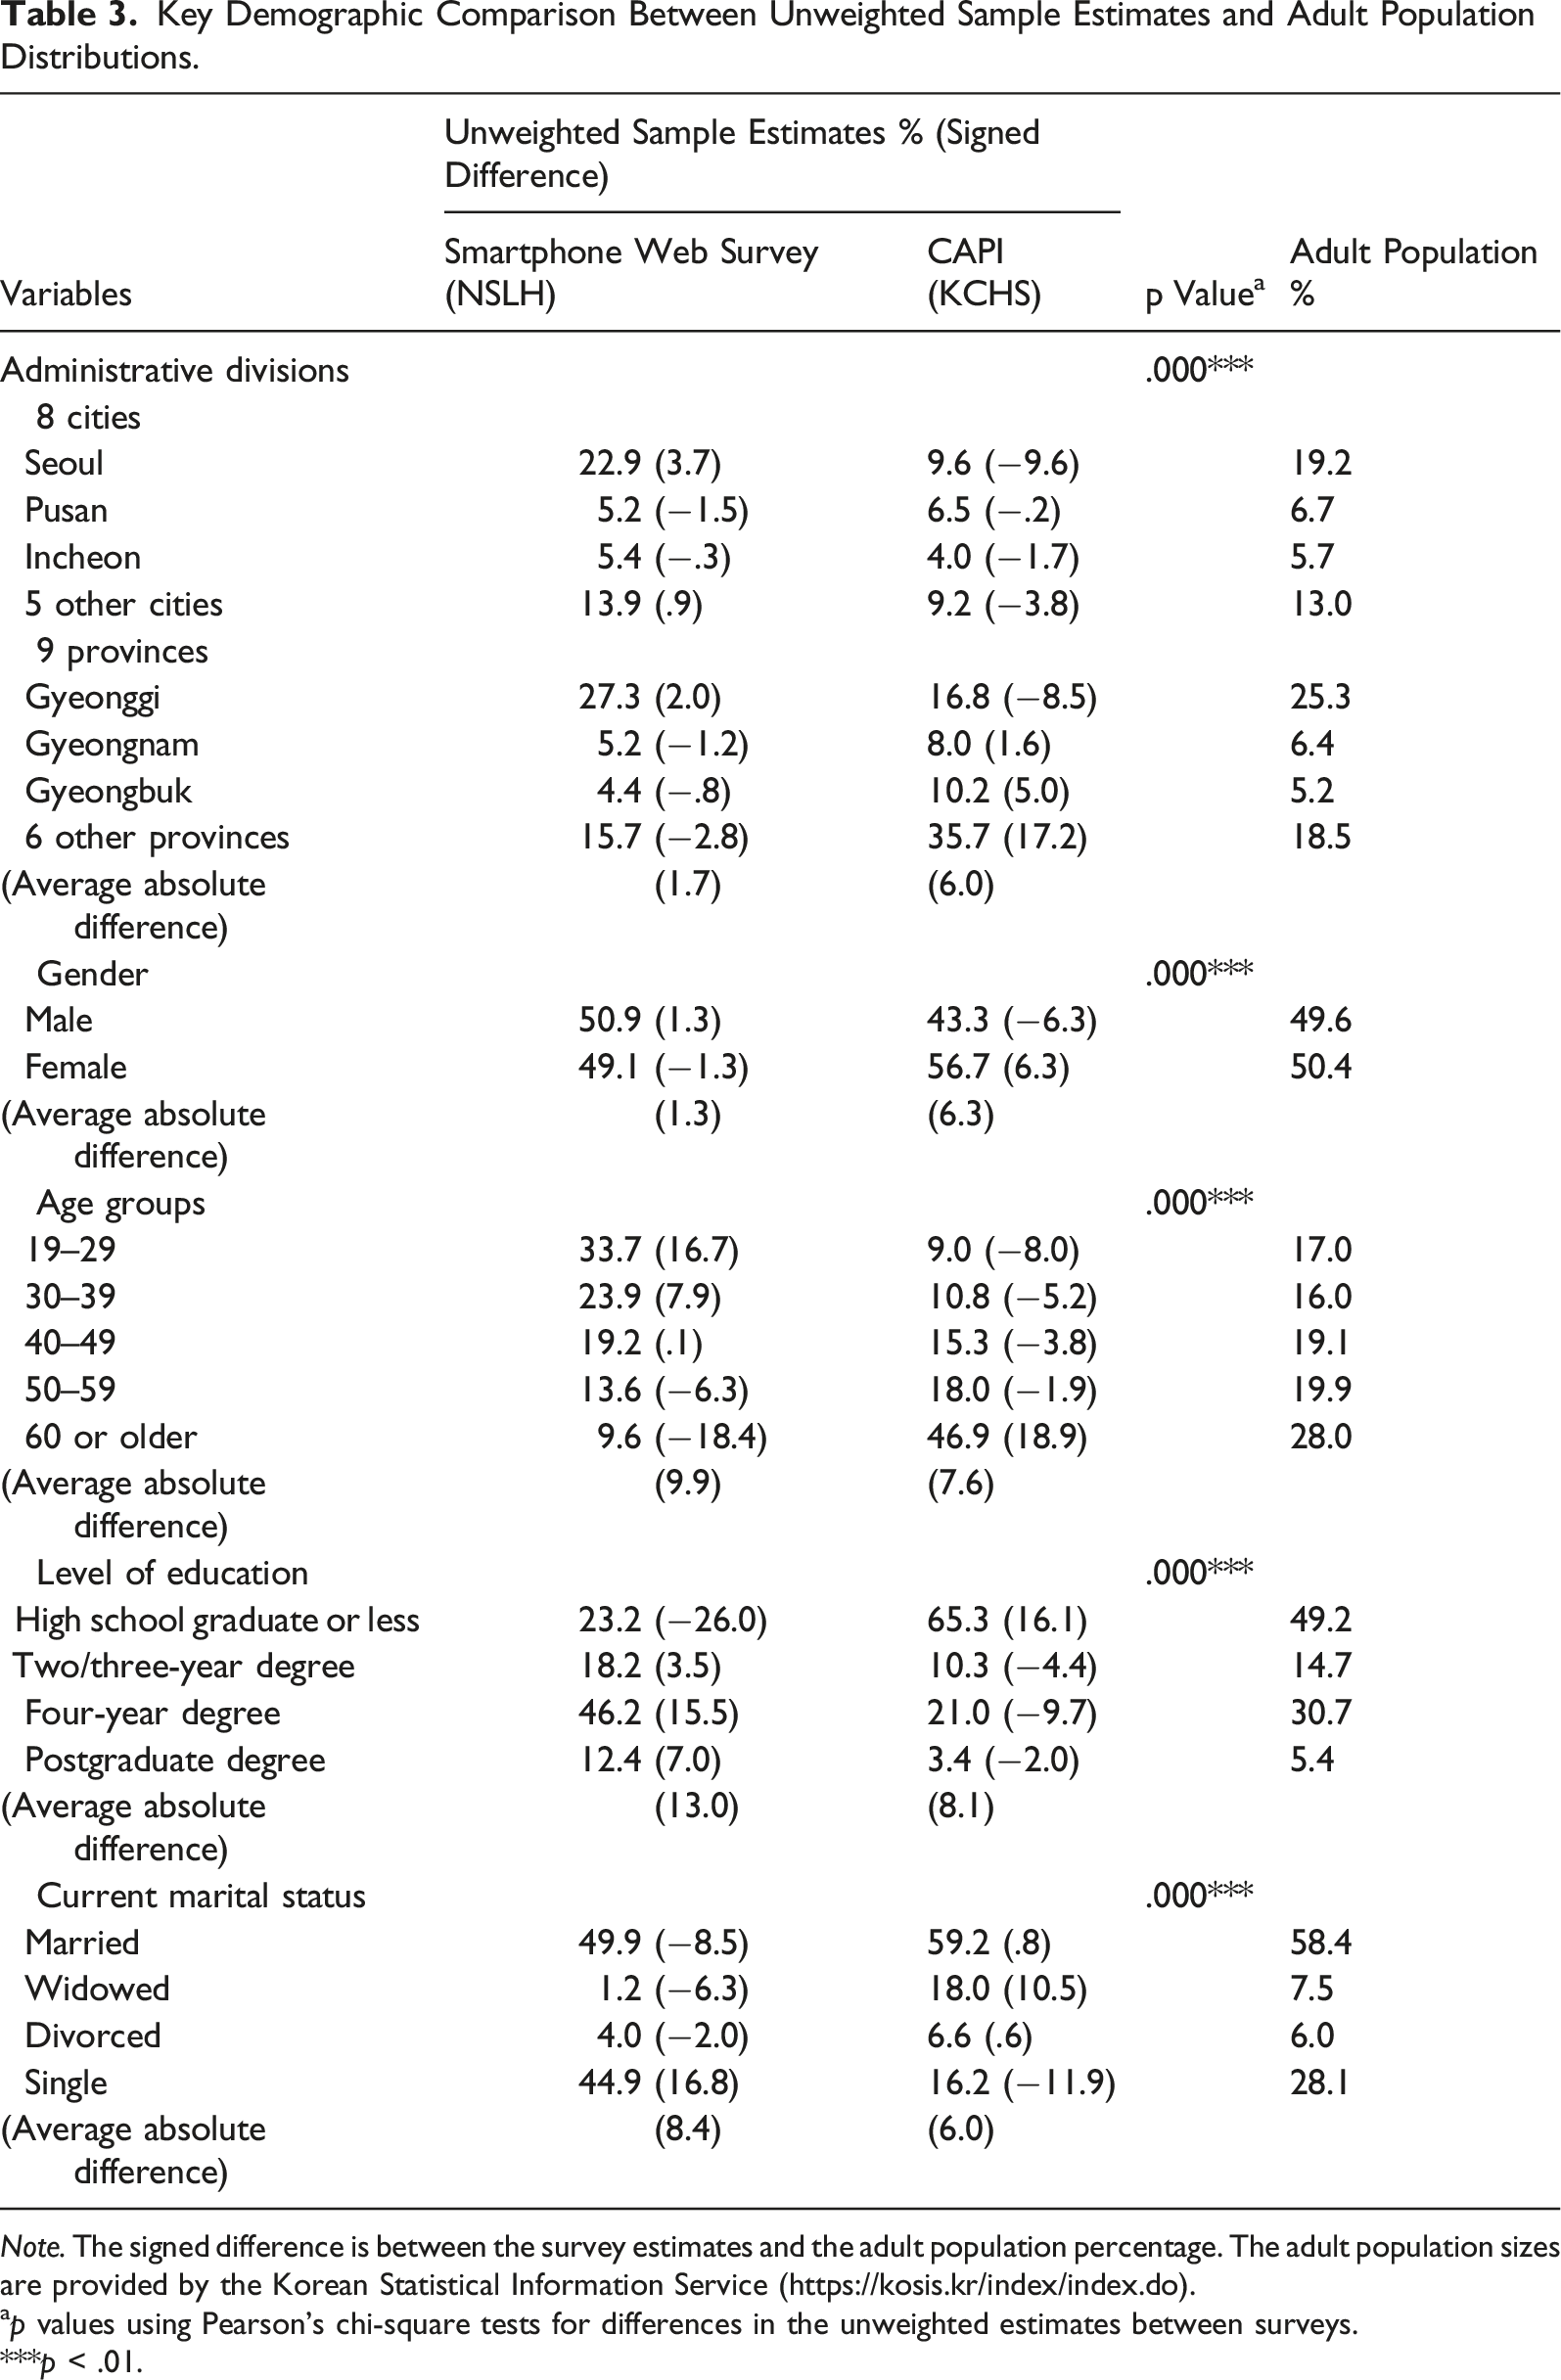
Note. The signed difference is between the survey estimates and the adult population percentage. The adult population sizes are provided by the Korean Statistical Information Service (https://kosis.kr/index/index.do).
ap values using Pearson’s chi-square tests for differences in the unweighted estimates between surveys.
***p < .01.
Table 3 shows the unweighted percentages of the respondent and adult population percentages for the five demographic variables in the two surveys, the signed differences between those percentages, and the p-values for the differences in the respondent percentages between the two surveys. Despite concerns about geographic representation by administrative division (area of residence) in the NSLH, the signed differences between the respondent and population percentages were relatively small (less than ±4 percentage points). In contrast, the signed differences in the KCHS were larger for administrative divisions, reflecting the fact that an equal number of adults (about 900) were surveyed in each of the 255 communities. Regarding gender, the NSLH distributions were closer to the population percentages. For age, the NSLH overrepresented (+16.7%) the youngest age group (19–29) and underrepresented (−18.4%) the oldest group (60+), whereas the KCHS underrepresented (−8.0%) the youngest age group (19-29) and overrepresented (+18.9%) the older group (60+). Two possible reasons account for this age discrepancy. One is that some older people may be less familiar with SMS and be not accustomed to using their smartphones for survey response (e.g., see Olmsted-Hawala et al., 2018). Another is undercoverage in smartphone ownership in old age groups. In 2020, only about half of those aged 70 and older (54%) had a smartphone, compared with at least 93% for younger age groups (National Information Society Agency, 2021).
The NSLH substantially underrepresented (−26.0%) those with the lowest level of education, whereas the KCHS overrepresented (16.1%) this group, resulting in significant differences in education (p < .01) between the two surveys. For marital status, the NSLH overrepresented the “single” category (16.8%), whereas the KCHS underrepresented this group (−11.9%), again yielding significant differences (p < .01) between surveys.
A comparison of the average absolute differences between the two surveys shows that for administrative division and gender, the NSLH respondents were more representative of the population than the KCHS. But for the remaining variables, the NSLH was slightly less representative of the population than the KCHS. This suggests that neither survey was superior in terms of these demographic variables.
In the NSLH, every individual has an equal chance of being selected, while in the KCHS the selection probabilities differ. To better understand the representation of respondents between the two surveys, it would be more beneficial to compare the unweighted percentages in the NSLH with the weighted percentages based on unequal selection probabilities in the KCHS. However, the KCHS website does not provide microdata on the selection probabilities.
Accuracy of Weighted Estimates
Key Demographic Comparison Between Respondents’ Weighted Estimates and Adult Population Distributions.

Note. The signed difference is between the survey estimates and the adult population percentage. The adult population sizes are provided by the Korean Statistical Information Service (https://kosis.kr/index/index.do).
ap values using Rao-Scott (1987)’s chi-square tests for differences in the weighted estimates between surveys.
**p < .05.
For the remaining two variables not used in poststratification (administrative divisions and marital status), the differences are still small (mostly within ±1.0 and some within ±2.5 for administrative divisions; all within ±2.5 for marital status) in the NSLH and small likewise (all within ±1.0; all within ±5.0) in the KCHS. In summary, poststratification markedly improved the accuracy of the estimates relative to population parameters.
Responses to Substantive Questions
Subjective Questions: Differences in Unweighted and Weighted Estimates Between Surveys.

Note. The ‘n’ represents the number responding to each question. For the unweighted estimates, the NSLH had a total of 1532 respondents, and the KCHS had a total of 125,585 respondents. For the weighted estimates, the NSLH had a total of 1532 respondents, and the KCHS had a total of 125,426 respondents due to 159 nonrespondents in the level of education.
ap Values in chi-square tests for differences between surveys. For the weighted estimates, the p values from Rao-Scott (1987)’s chi-square tests are given.
***p < .01.
**p < .05.
Factual and Behavioral Questions: Differences in Unweighted and Weighted Estimates Between Surveys.
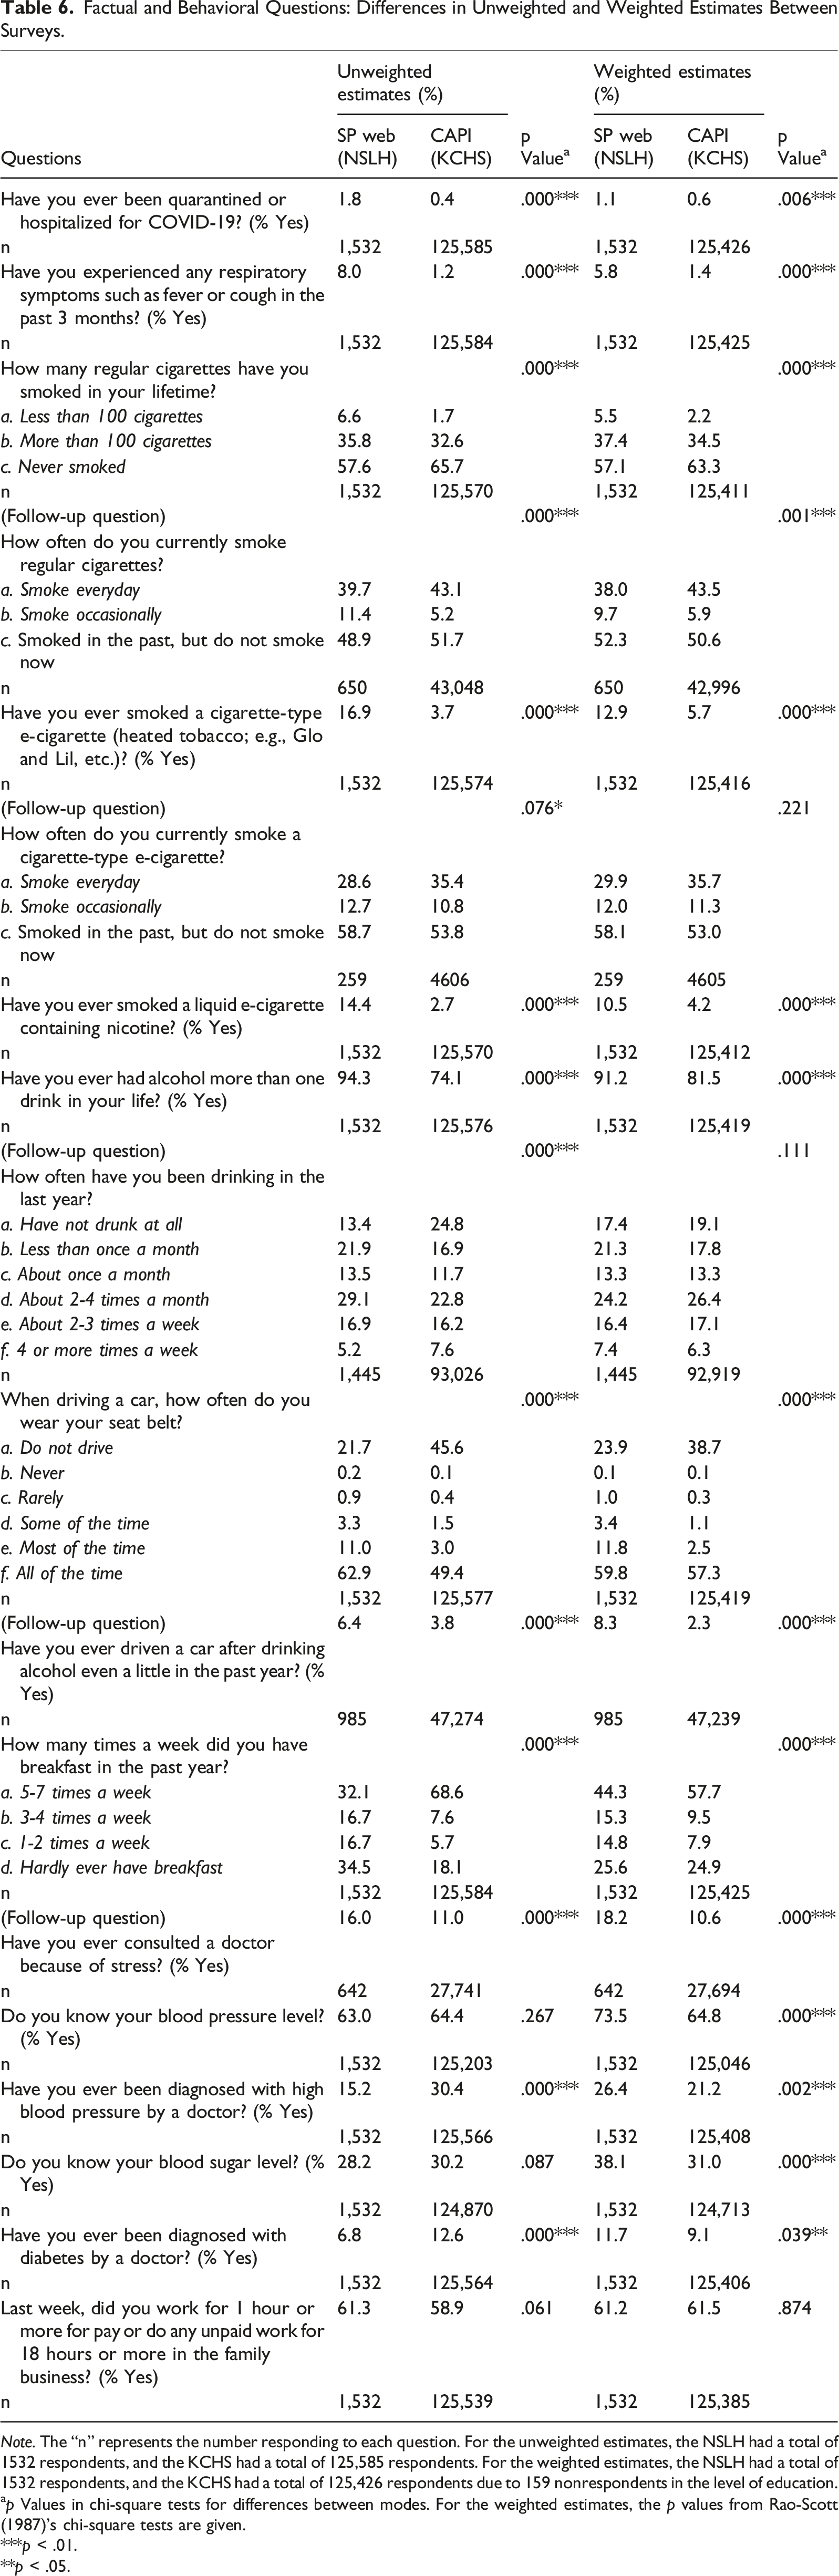
Note. The “n” represents the number responding to each question. For the unweighted estimates, the NSLH had a total of 1532 respondents, and the KCHS had a total of 125,585 respondents. For the weighted estimates, the NSLH had a total of 1532 respondents, and the KCHS had a total of 125,426 respondents due to 159 nonrespondents in the level of education.
ap Values in chi-square tests for differences between modes. For the weighted estimates, the p values from Rao-Scott (1987)’s chi-square tests are given.
***p < .01.
**p < .05.
As seen in Table 6, twelve of the 18 factual or behavioral questions show significant differences (p < .01) between the two surveys for both unweighted and weighted estimates and two questions show significant differences (p < .01) between the two surveys for weighted estimates only. The differences between the smartphone web survey and the CAPI survey are consistent with research on reporting socially undesirable behaviors by mode (see Kreuter et al., 2008; Tourangeau et al., 2000; Tourangeau & Yan, 2007), suggesting greater honesty of reporting in the web mode.
Finally, height and weight were asked as open questions of all respondents. The microdata in the CAPI survey (KCHS) is released as body mass index (BMI), defined as the weight (in kilograms) divided by the square of the height (in centimeters). The unweighted mean BMI in the smartphone web survey and CAPI survey was 23.60 and 23.56, respectively. The weighted mean BMI in the two surveys was 23.85 and 23.63, respectively. The unweighted and weighted means did not differ significantly (p > .05) between the two surveys.
Design Effects
The estimated design effect is the ratio of the variance of a weighted estimate relative to an unweighted estimate assuming the sample was selected using simple random sampling. The larger the design effect, the more sample required to obtain the same variance of an estimate as would have been obtained in simple random sampling (see Kish, 1995, pp. 257-259). For 27 variables (in Tables 4-6) in the smartphone web survey using a sample selected by single-stage RDD sampling, the mean (median) of the design effects for the variables was 1.84 (1.82). The mean (median) of the design effects for the same variables in the CAPI survey using a sample selected by stratified multi-stage cluster sampling was 2.18 (2.18). This suggests that if the smartphone web survey was conducted with the same sample size as the CAPI survey, the variance of the weighted estimates (or margin of error) on average for those variables would very likely be smaller than in the CAPI survey.
Survey Costs
KCHS
The costs for the CAPI survey, involving field supervisors and interviewers, programmers, laptops, and travel, are more varied, making it more difficult to calculate the data collection cost per respondent. However, the KCHS budget for each community is public, resulting in an approximate total cost (for 125,585 respondents) of about 8,790,950,000 KRW ($7,644,304) or an average of 70,000 KRW ($60.87) per respondent. This is about 10 times the per-respondent cost of the smartphone web survey, suggesting a much larger sample could be surveyed using the smartphone web survey to increase the precision of estimates.
Discussion
Face-to-face surveys have long been regarded as the “gold standard” for obtaining high-quality data, but have suffered recently due to rising costs of in-person visits and decreasing response rates. This threat to data quality has been exacerbated by the COVID-19 pandemic. These problems are likely to grow over time, necessitating the exploration of alternative approaches.
Web surveys have become a popular alternative because they do not require interviewers, and have low costs, speed of deployment, respondent convenience, and lower social desirability bias for sensitive topics. The COVID-19 pandemic and subsequent lockdown made self-administered web surveys even more attractive. However, web surveys of the general population still face significant methodological issues including undercoverage, lack of sample representativeness, and low response rates.
We conducted a national RDD smartphone web survey using SMS text message invitations, which combines telephone sampling and mobile technology, for comparison with a large-scale national CAPI survey during the COVID-19 pandemic. The results demonstrate the potential of this approach for yielding a probability sample of the general population in countries with high rates of smartphone use and literacy, and few restrictions on SMS messages.
While the response rate to the smartphone web survey (RR1 = 7.6%) was substantially lower than that for the CAPI survey (median RR6 = 94.4%), the costs per complete were also substantially lower (by a factor of 10) for the smartphone web survey. In terms of demographic comparisons in unweighted estimates, the smartphone web survey performed well relative to population benchmarks, being closer to those benchmarks for two variables (administrative division and gender) and only slightly higher for the other three (age, education, and marital status). Poststratification largely eliminated these demographic differences between the two surveys.
There were significant differences for several substantive variables, whether examining unweighted or weighted estimates. Without benchmark data, it is hard to determine which estimates are more “accurate”; however, the (self-administered) smartphone web survey mode tended to have fewer reports of socially desirable attitudes or behaviors and more reports of socially undesirable ones than the (interviewer-administered) CAPI survey, especially for sensitive questions. This suggests that data quality (accuracy) may be improved for such topics using a smartphone web survey. Further, given the relative costs, a substantially larger smartphone web survey could be conducted for the same or less money than the CAPI survey, yielding greater (statistical) precision of the estimates.
We hope that these findings will encourage researchers to explore alternative approaches to conducting web surveys using RDD sampling methods and smartphone technology. In countries such as the U.S., where there are legal constraints against unsolicited text messages, this approach may not be practical. In many other countries, there are no such restrictions, and this approach is a promising alternative. We encourage others to replicate and extend these findings to other countries with high rates of smartphone penetration.
Footnotes
Declaration of Conflicting Interests
The author(s) declared no potential conflicts of interest with respect to the research, authorship, and/or publication of this article.
Authors’ Note
The authors would like to sincerely thank Soohyun Oh for the meticulous data analysis, Jaehoon Kim for careful assistance in preparing and revising the manuscript, and Junbeom Ryu and Jeongbin Kim for collecting data during the problematic situation of the COVID-19 pandemic.
Funding
The SHPRC’s own funds were used for this study. The author(s) received no financial support for the research, authorship, and/or publication of this article.
Software Information
The analyses were conducted using SAS 9.4.
Note
Data Availability Statement
Appendix
Distribution of Devices Used to Respond to the NSLH
| Device used at end | ||||||
|---|---|---|---|---|---|---|
| Smartphone | Tablet | Laptop | Desktop | Total | ||
| Device used At beginning | Smartphone | 1438(93.9%) | 2(.2%) | 9(.6%) | 2(.2%) | 1451(94.9%) |
| Tablet | 1 (.0%) | 7 (.5%) | 8 (.5%) | |||
| Laptop | 11 (.8%) | 1 (.0%) | 17 (1.1%) | 1 (.0%) | 30 (1.9%) | |
| Desktop | 15 (1.0%) | 1 (.0%) | 1 (.0%) | 26 (1.7%) | 43 (2.7%) | |
| Total | 1465 (95.7%) | 11 (.7%) | 27 (1.7%) | 29 (1.9%) | 1532 (100.0%) | |