




Abstract
The research addresses the impact of long-term reward patterns on contents of personal work goals among young Finnish managers (N = 747). Reward patterns were formed on the basis of perceived and objective career rewards (i.e., career stability and promotions) across four measurements (years 2006–2012). Goals were measured in 2012 and classified into categories of competence, progression, well-being, job change, job security, organization, and financial goals. The factor mixture analysis identified a three-class solution as the best model of reward patterns: high rewards (77%), increasing rewards (17%), and reducing rewards (7%). Participants with reducing rewards reported more progression, well-being, job change, and financial goals than participants with high rewards as well as fewer competence and organizational goals than participants with increasing rewards. Workplace resources can be a key role in facilitating goals toward building competence and organizational performance.
Resources in the work environment are crucial factors in determining the positive employee and organizational outcomes (e.g., Halbesleben, Neveu, Paustian-Underdahl, & Westman, 2014; Hobfoll, 2011; Tsutsumi & Kawakami, 2004). Resources can be necessary in sustaining resilience and engagement of employees in modern work environments in which resource pools are often characterized by loss (Hobfoll, 2011). For instance, low resources in terms of rewards have been found to be particularly disadvantageous among managers (Peter & Siegrist, 1997). The present study utilizes the effort–reward imbalance model (the ERI model; Siegrist, 1996; Siegrist et al., 2004) to investigate the contribution of societal rewards in the work environment on pursuit of personal work goals. Personal work goals can provide a fresh perspective as an outcome of rewards since they describe employees’ future-oriented, work-related aspirations (e.g., Grant, Little, & Phillips, 2007; Hyvönen, Feldt, Salmela-Aro, Kinnunen, & Mäkikangas, 2009; Hyvönen, Feldt, Tolvanen, & Kinnunen, 2010). Personal work goals can give an indication as to how employees are adjusting to the changing work contexts that require greater individual agency, adaptability, and proactivity (e.g., Briscoe & Hall, 2006; Inkson, 2006).
The reward component of the ERI model, which describes employees’ perceptions of esteem, career opportunities, and job security at the workplace (Siegrist et al., 2004), has been shown to be a particularly significant contributor on the contents of personal work goals and more significant than the effort component (Hyvönen et al., 2010). Higher rewards associated with goals related to organizational performance (Hyvönen et al., 2010) and an increase in rewards associated with engaging with goals related to competence and organizational performance in a 2-year follow-up study (Hyvönen, Feldt, Kinnunen, & Tolvanen, 2011). A decrease in rewards, in turn, was associated with becoming engaged in goals related to finding a new job or disengaging from goals related to competence. For this reason, the present study focuses on the rewards of the ERI model.
The present four-wave, 6-year study adds to the previous research by investigating—in addition to the long-term contribution of perceived rewards— the objective self-reported career rewards (career stability and promotions). A further contribution of the research is that a mixed methods approach (e.g., Creswell & Plano Clark, 2007) is utilized including advanced statistical methods (person- and variable-centered analyses) and thematic categorization of participants’ responses to an open-ended question on their work goals. We examine the development of rewards during the study period in a general level and therefore factor mixture analysis (FMA) was chosen since the development in rewards is not assumed to follow a functional form with respect to time (see Lanza & Collins, 2006). Labor market changes can be reflected in the career line of the participants, and this approach can identify groups characterized by different perceived rewards and career events (i.e., the absence of events, the presence of events, and anything in between).
Societal Rewards in the Work Environment and Career Events
Siegrist (1996) developed the occupational stress model of ERI, which is based on reciprocal principles of costs and gains in the workplace. Employees invest effort in order to meet the demands and responsibilities at work, such as interruptions, workload, and overtime. In return of their efforts at work, employees expect rewards such as money, esteem, job security, and career opportunities. The lack of reciprocity is described by the imbalance in effort and reward at work. Detrimental imbalance (high effort with low reward) might occur in situations when employees have fewer employment options (e.g., due to skills deficits or a poor job market) but also when an employee has strategic ambitions, such as career progression (Siegrist et al., 2004). The present study focuses on the reward component of the ERI model since it has shown strongest relationship with changes in personal work goals (Hyvönen et al., 2011). Lower rewards have also been associated with lower professional autonomy (Siegrist et al., 2010), higher turnover intentions, and lower work engagement (Kinnunen, Feldt, & Mäkikangas, 2008).
A notable contribution of the present study is that self-reported, actual career rewards are taken into account which can also impact on personal work goals. For instance, participants with career disruptions (e.g., layoffs) were more likely to focus on personal work goals related to job security in a previous cross-sectional study (Hyvönen et al., 2009). Previous studies indicate that different types of career instability (e.g., unemployment spells, layoffs) relate negatively to employees’ health and well-being and may also bear negative consequences for career-related motivation (e.g., Friedland & Price, 2003; Mauno, Feldt, Tolvanen, Hyvönen, & Kinnunen, 2011). Furthermore, a lack of promotions might be crucial in managers, the group we study, because they are often highly committed to their work and career (Feldt, Hyvönen, Mäkikangas, Kinnunen, & Kokko, 2009). Because personal goals reflect contextual demands and an individual’s life situation, it is plausible that these career events are related to personal work goals. Thus, we extend the reward aspects of the ERI model by examining career stability and promotions in relation to personal work goals.
Theory and Research on the Contents of Personal Work Goals
The construct of personal work goals in this study is derived from previous research and theory on personal action constructs (see Little, 2007). In line with Little’s (2007) revised social ecological model of well-being, personal work goals can describe the employees continuous negotiation between their personal and contextual features in order to pursue the central goals of life. In line with Little’s model (2007), there is an indirect effect from personal and contextual features through personal goals on outcome measures such as well-being and adaptation in addition to the direct effect of personal and contextual features on well-being.
The present research describes a thorough analysis of the contents of personal goals related to the work context. In this 6-year follow-up study, we expect to find the same categories of personal work goals that were found in the baseline study in 2006 and 2 years later in 2008 with the same sample of managers (Hyvönen et al., 2009, 2011): competence (28%; professional development and training), career progression (21.7%; promotion and advancement), well-being (13.9%; self-concerns, managing stress, job satisfaction, motivation), and job change (12.6%; finding a new job or setting up a company). The less frequently mentioned goals related to job security (6.8%; continuing working, a permanent employment contract), organization (5.1%; success and performance of the project, team, department, or company), and finance (3.6%; pay rise, bonus). Similar goals have been found among higher level managers (N = 811) in addition to prestige/influence goals and career-ending goals, which described personal work goals that are typical among managers in higher management positions and older in age (Huhtala, Feldt, Hyvönen, & Mauno, 2013).
Unlike in previous studies in which only the most important goals have been analyzed, the present research takes into account three most important self-articulated goals of participants at the last measurement time in 2012. Considering an individual’s various goals can reveal the prevalence of the goals in the person’s goal hierarchy, which can be important in terms of the well-being of the employee as well as work performance (see Salmela-Aro & Nurmi, 2004). In the occupational domain, employees are navigating through changing work contexts that create various opportunities and demands during their career. That is, personal work goals can reflect managers’ adaptive strategies, choices, and development in meeting the challenges and unpredictability of the modern working life (Baard, Rench, & Kozlowski, 2013; Savickas et al., 2009).
Present Study and Hypotheses
In modern working life, employment opportunities are less bound to the organization, and job prospects can be unpredictable (Savickas et al., 2009). Savickas and colleagues (2009) distinguish the so-called core employees who work in the organization on a permanent basis. In contrast, the peripheral employees are managing multiple transitions in shorter term contracts. Marginalized employees have fewer career prospects due to barriers and constraints, and their opportunities might be restricted to only day labor. The study period of 6 years (years 2006–2012) has been a challenging time in the Finnish labour market. In 2006, the Finnish economy was still marked by strong growth, but by 2008, the labour market and economy were seen to have taken the turn to the worse (Lyly-Yrjänäinen, 2015). For instance, layoffs and redundancies became more common in 2009, and fewer employees believed that they would find a job that matches their skills and experience if they were made redundant. The rate of unemployment was the lowest in 2007 when it was 6.9% but had risen to 8.4% in 2010 and has remained high (Official Statistics of Finland, 2015). It is therefore possible that the participants—who at the study baseline in 2006 were all in employment—have experienced layoffs and unemployment during the 6-year study period.
The first research question relates to whether there are distinctive long-term patterns of rewards depicted through perceived rewards and career rewards (career stability and promotions) during the study (2006–2012). Due to the exploratory nature of the person-centered analyses, we cannot set firm hypotheses on the number of career patterns or the changes in mean levels of perceived rewards or career rewards in these patterns. However, we expect to find more than one long-term pattern of rewards that relate to differing levels of perceived rewards and career rewards because of the heterogeneity of the sample and long follow-up period. There could be a pattern that reflects unfavorable levels of perceived rewards and career rewards (less career stability and fewer promotions). It is also reasonable to assume that there will be a pattern that relates to favorable levels of perceived rewards and career rewards since managers generally are shown to have a good level of job resources (e.g., Feldt et al., 2009). Because we use a longitudinal design, we are also able to examine changes in reward patters and can expect that some reward patterns may reflect positive or negative development in this heterogeneous sample, for instance, due to labor market changes.
The second research question focuses on investigating whether the long-term patterns of rewards relate to contents of personal work goals that participants focus on at the last measurement in 2012. A cross-sectional study indicated that participants with lower rewards are more likely to focus on goals related to progression, well-being, job change, job security, or finance instead of organizational performance (Hyvönen et al., 2010). Job change or well-being goals also related to the lowest level of occupational well-being (Hyvönen et al., 2009, 2010). Further evidence was received from a 2-year follow-up study with this same data set, which showed that reducing rewards related to engaging in job change goals (Hyvönen et al., 2011). In turn, the highest level of reward and low ERI (Hyvönen et al., 2010) and better organizational culture (Huhtala et al., 2013) associated with focusing on organizational goals in cross-sectional studies. Similarly, in a 2-year follow-up study with this sample of managers, an increase in perceived rewards related to engaging in competence and organizational goals (Hyvönen et al., 2011).
Since favorable psychosocial work environments have been connected to higher occupational well-being (e.g., Kinnunen et al., 2008), it could be that these participants have better personal and work resources to focus on their leadership task and developing competence. This suggestion is also in line with the conservation resource (COR) theory by Hobfoll (2011), according to which organizational settings can create resource passageways through which organizational support, stability, and safety can be fostered and shared. These resource passageways can sustain, develop, and promote employees’ engagement and resilience. In turn, a threat of or an actual resource loss could instigate goal reconstruction or adjustment to new contextual demands. Based on theories by Hobfoll (2011) and Little (2007), as well as previous research (Hyvönen et al., 2010, 2011), we expect that the rewards—or lack of rewards—in the work context will be reflected in the contents of personal work goals:
Method
Participants and Procedure
The questionnaire study was conducted with four measuring points: spring 2006 (T1), spring 2008 (T2), spring 2010 (T3), and spring 2012 (T4). The sample was selected from the membership registers of two Finnish national trade unions. The original sample consisted of 1,904 members who were all younger than 36 years and whose professional title referred to management position. Questionnaires were sent to the home addresses of the participants and 933 questionnaires were returned. Of the respondents, 186 were not in management or in employment and therefore were excluded from the final sample (N = 747). The response rate was 43.4% in 2006 (for more detail and attrition analyses, see Hyvönen et al., 2009).
At T2 in 2008, the questionnaires could be sent to 621 participants who had participated at T1. At T1, 126 participants had indicated that they no longer wished to participate in the research, and therefore they were excluded from the follow-up study at T2. At T2, 433 questionnaires were returned, which resulted in a response rate of 69.7% of the available sample. That is, of the initial sample (N = 747) in 2006, 58.0% of participants also responded at T2. At T3 in 2010, the questionnaires could be sent to 595 participants since 26 further participants had declined from further participation at T2. At T3, 380 questionnaires were returned and the response rate was 63.9%. When compared to the initial sample (N = 747), 50.8% of participants responded at T3. At T4 in 2012, the questionnaire was sent to 575 participants since 20 further participants had indicated at T3 that they no longer wished to be contacted. At T4, 333 participants responded, yielding a response rate of 57.9%. That is, 44.6% of the initial participants (N = 747) responded still at T4. Of the 333 participants at T4, 17 participants had not named a goal. Participants’ age, gender, and managerial level at T1 are shown in Table 1.
Descriptive Statistics for Study Variables and Covariates.a

aMeans and standard deviations (in parentheses) are reported for continuous variables and percentages for categorical variables. bPromotions were not asked at T1.
Measures
Perceived reward was measured with the ERI Scale (Siegrist et al., 2004). The good construct and discriminant validity of the Finnish version of the scale has been reported previously by Kinnunen, Feldt, and Mäkikangas (2008). The factorial group and time invariance of the ERI Scale have been supported in the white-collar samples, including also the sample used in this study (Rantanen, Feldt, Hyvönen, Kinnunen, & Mäkikangas, 2013). Reward included 11 items describing esteem (5 items, e.g., “I receive the respect I deserve from my superiors”), career opportunities (4 items, e.g., “Considering all my efforts and achievements, my salary/income is adequate”), and job security (2 items, e.g., “My job security is poor”). If the respondent answered the question negatively (or affirmatively in the item of job security), they were asked to rate the degree of distress from “not at all distressed” to “very distressed.” The scale ranged from 1 to 5: (1) agree, (2) disagree, and I am not at all distressed, (3) disagree, and I am somewhat distressed, (4) disagree, and I am distressed, and (5) disagree, and I am very distressed. The items were recoded, so that a higher mean sum score of reward indicates more rewards perceived at work. The Cronbach’s αs for reward were .86 at T1, .90 at T2, .90 at T3, and .89 at T4. The means and standard deviations for reward at each measurement time are shown in Table 1.
Career stability was explored, with questions designed to gather information on participants’ experiences of unemployment or layoffs in this study. At T1, the participants were asked, “Have you been unemployed or laid off since your graduation?” The responses were given on a dichotomous scale (yes/no). At T2, T3, and T4, the participants were asked the same question again but now covering the subsequent study phases, “Have you been unemployed or laid off in the last 2 years (since spring 2006)?” Thus, four dichotomous variables (yes/no career stability) were formed on the basis of the four measurement points: career stability prior T1, career stability T1–T2, career stability T2–T3, and career stability T3–T4. The percentages of participants reporting career stability at each study phase are shown in Table 1.
Promotions were asked with the question designed for this study, “Have you been promoted in the last 2 years (since spring 2006)?” at T2. The same question was presented again at T3 and T4 covering the subsequent study phases. However, promotions were not asked at the study baseline at T1 and therefore three dichotomous variables (yes/no promotions) were formed on the basis of the four measurement points: promotions T1–T2, promotions T2–T3, and promotions T3–T4. The percentages of participants’ promotions are shown in Table 1.
Personal work goals at T4 were asked with an open-ended question, “Write down your personal goals that relate to your work or career in order of importance” (Hyvönen et al., 2009, 2010). The question was followed by three empty lines where participants could write down their responses for personal work goals. Two independent coders used the same seven categories of goals (competence, progression, well-being, job change, job security, organization, and finance) which have been used with this sample of participants in previous study phases (for further detail about the different stages of coding, see Hyvönen et al., 2009). Cohen’s κ coefficients were .94, .95, and .96 for the contents of the first, second, and third personal work goals categorized, respectively. These κ statistics indicated “almost perfect” strength of agreement between the coders (Landis & Koch, 1977). The same goal categories were also found in 2006 and 2008 (Hyvönen et al., 2009, 2011) and no new categories emerged. For each participant, a sum score of the number of mentions to a given goal category was computed. Theoretical range for each of the seven sum scores was 0–3 mentions. Distributions of sum scores for each goal category are presented in Table 2.
The Frequency of the Contents of Personal Work Goals (0, 1, 2, or 3 Times) Mentioned by Participants in Percentages.

Note. n = 316.
Background variables measured at T1 included gender (male/female), management level (upper/middle/lower), and age in years. On the basis of a previous longitudinal study with this sample of participants (Hyvönen et al., 2011) and with another managerial sample (Huhtala et al., 2013), these background variables related to the personal work goals and, therefore, were also controlled for in this study.
Analytical Strategy
The analyses were conducted in two phases. First, the long-term patterns of rewards were examined using a series of FMAs (Lubke & Muthén, 2005). In FMA, two types of latent variables are combined: a categorical latent variable indicating participants’ class membership and one or more continuous latent factors that capture the covariance between observed variables. In the FMA, a repeated measures latent class analysis model (RMLCA; Lanza & Collins, 2006) was combined with two continuous common factors (one factor for reward residuals, one factor for career rewards and promotions). RMLCA enables the identification of patterns of participants who are homogenous in their pattern of behavior over time in reward variables. Behavior is not assumed to follow any functional form, as for example in general growth curve mixture modeling.
A continuous measure of reward and categorical measures of career rewards (career stability and promotions) were used in the FMA. Four measurements (2006, 2008, 2010, and 2012) of each of these measures were included. The FMA was based on all available data (N = 747). The parameters of the RMLCA part of the FMA model are for proportions of participants within each of the reward patterns (i.e., reward pattern probabilities) and their distribution across the indicator variables in a reward pattern (i.e., means for continuous variables and conditional probabilities for categorical variables; Nylund, Asparouhov, & Muthen, 2007).
Three different criteria were used to decide the optimal number of latent classes (Marsh, Lüdtke, Trautwein, & Morin, 2009). First, practical usefulness (i.e., number of managers in each class) and theoretical interpretativeness of the solution was considered. In line with previous research (Marsh et al., 2009), groups comprising less than 5% of the managers were considered as too small. Second, the goodness of fit of the models were evaluated with the Bayesian information criterion (BIC; Schwartz, 1978), sample size adjusted BIC (aBIC; Yang, 2006), the parametric bootstrapped likelihood ratio test (BLRT; Nylund et al., 2007), and Vuong–Lo–Mendell–Rubin likelihood ratio (VLMR) test (Lo, Mendell, & Rubin, 2001). The lower values of the information criteria indices indicate better model fit. For BLRT and VLMR, the p values above .05 indicate a good fit of the FMA model, while values below .05 indicate that the number of classes should be increased by one.
The third criterion for optimal number of classes was the classification quality that can be determined by entropy and average latent class posterior probabilities (AvePP). The entropy illustrates the accuracy of the overall classification, whereas the AvePP evaluates how probably an observation ends up in a particular pattern. Values of entropy and AvePP range from 0 to 1, with values close to 1 indicating a distinct classification (Celeux & Soromenho, 1996). An AvePP greater than 0.7 for all groups is recommended (Nagin, 2005).
In the second phase, the personal work goals were classified on the basis of content on categories identified in the study baseline in 2006 (T1). At T1, the participants’ most important personal work goals were coded into one of the seven categories based on goal contents: competence, career progression, well-being, job change, job security, organization, and finance. The goals varied from shorter term (e.g., finishing a project) to long-term goals (e.g., getting promoted within the next 3 years).
To examine whether membership in the reward patterns relate to personal work goals, regression analyses were conducted. The seven goal outcomes were analyzed separately using the three-step procedure implemented in Mplus (Asparouhov & Muthén, 2014). The procedure takes into account the measurement error related to the classification of participants into the latent classes when examining the differences between reward patterns in the goal outcomes. We chose the manual of three steps instead of using the automatic version in conjunction with AUXILIARY function to control for gender, age, and management level. Each goal outcome was regressed on the most likely latent class variable while fixing the measurement error to the prespecified values determined from the FMA output. Poisson regression was used, as the outcomes were count variables. Poisson regression analysis models the log of the expected count of the mentions to a given goal category as a function of the independent variables. For the ease of interpretation, regression coefficients were presented as incident rate ratios (IRRs) which were obtained by exponentiating the Poisson regression coefficients. For example, for a dichotomous independent variable, the IRR represents change in the estimated rate of mentions to a given goal category when the value of the independent variable changes from 0 to 1. An IRR greater than 1 indicates how many times greater the expected rate of mentions to a given goal category is for those participants for whom the value of the independent variable is 0. In contrast, an IRR greater than 1 indicates that the expected rate of mentions to a given goal category is greater for those participants for whom the value of the independent variable is 1. Each pattern was set by turns as a reference group.
All analyses were conducted using the Mplus statistical package (Version 7.3; Muthén & Muthén, 1998–2012). The method of estimation was that of full information maximum likelihood with robust standard errors implemented in Mplus. The missing data analysis method (i.e., the standard missing at random approach) was used to utilize all available data.
Results
Long-Term Patterns of Rewards
Fit statistics for the estimated models of latent patterns showed that the two-, three-, and four-class models received some support (Table 3). However, none of these three solutions received consistent support from all of the fit indices. The two-class model was supported by VLMR, whereas BIC supported the three-class and aBIC the four-class models. As the BIC and aBIC have been shown to be among the most effective goodness-of-fit indexes in choosing the model that best recovers the sample’s true parameters in mixture models (e.g., Nylund et al., 2007; Yang, 2006), the final decision was made between three- and four-class models. When comparing the patterns of rewards across these two multiclass solutions, there were patterns that remained consistent across the solutions and were theoretically meaningful. First, we found a pattern that comprised the largest number of participants and who reported high and stable perceived rewards across three the multiclass solutions. Also, the second largest pattern in the three multiclass solutions was similar and described increasing perceived rewards with more career stability and promotions. Finally, there was a small pattern that comprised participants who had low and decreasing perceived rewards with less career stability and promotions (pattern covered 6.6% of all participants in the three-class model and 5.5% in the four-class model). In the four-class model, there was another small pattern that comprising participants (4.7% of all participants) whose perceived rewards and career stability seemed to be in a flux during the follow-up period. Since the three-class model comprised a pattern that described unfavorable trend in rewards but did not produce small patterns (comprising less than 5% of all participants; Marsh et al., 2009) as were observed in the four-class model, we concluded that the interpretability of the three-class model was better than that of the four-class model. Also the BIC value was the lowest for the three-class model. Therefore, we chose the more parsimonious three-class model as the final model (Marsh et al., 2009).
Fit Indexes for Alternative Reward Patterns.
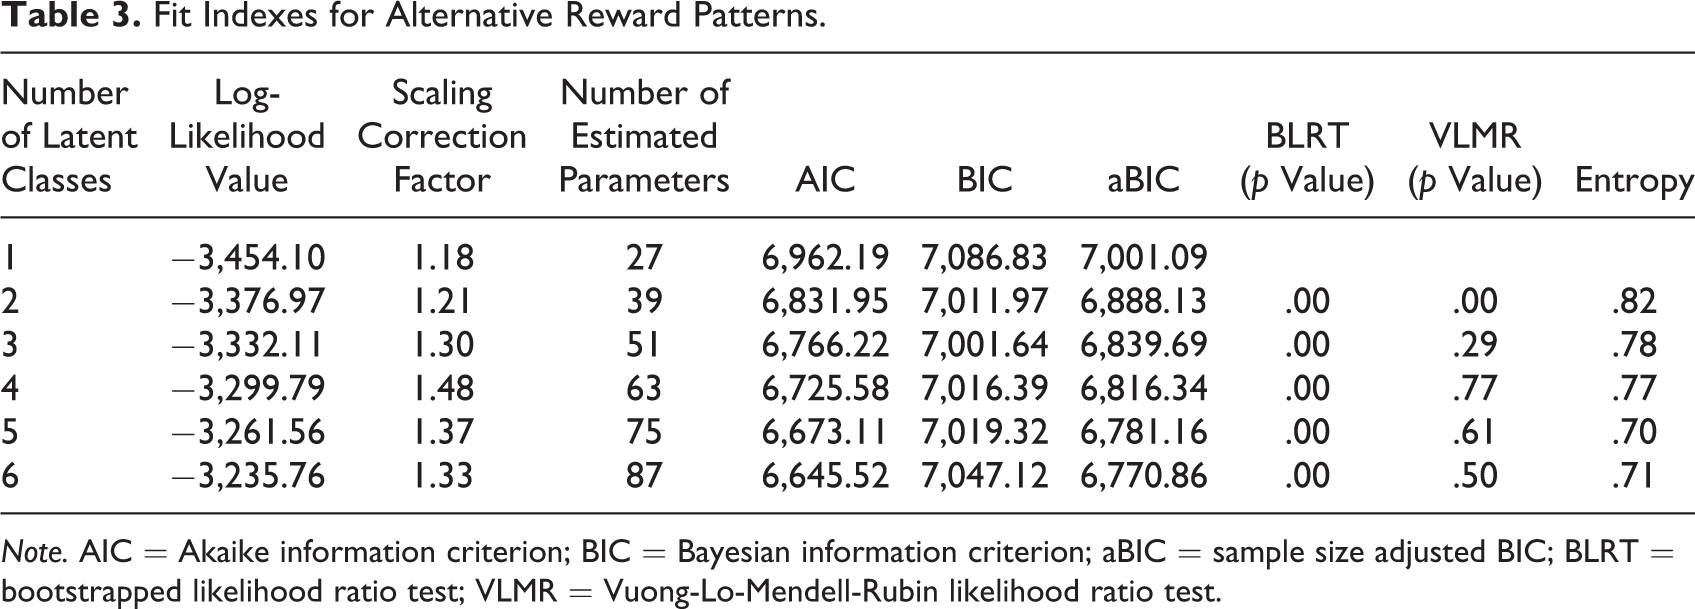
Note. AIC = Akaike information criterion; BIC = Bayesian information criterion; aBIC = sample size adjusted BIC; BLRT = bootstrapped likelihood ratio test; VLMR = Vuong-Lo-Mendell-Rubin likelihood ratio test.
Table 4 presents the latent patterns and the means and conditional probabilities of the chosen three-class model. Members of the largest pattern, high rewards (77%), represented a favorable pattern of rewards. These participants typically had high, stable levels of perceived rewards, and they were more likely to have promotions at T2–T4. Members of the second largest pattern, increasing rewards (17%), represented the increasing pattern of rewards: At T1, they had relatively low level of perceived rewards, but after that they seemed to reach the level of perceived rewards of those in high and stable rewards pattern. They had more career stability and were more likely to experience promotions between T2 and T4 than the members of the other patterns. Members of the smallest pattern, reducing rewards (7%), represented the unfavorable pattern of rewards. They typically had low, decreasing levels of perceived rewards throughout the study period. They had fewer promotions during the study than the members of the other two patterns.
Means, Conditional Probabilities, and Latent Class Probabilities.a
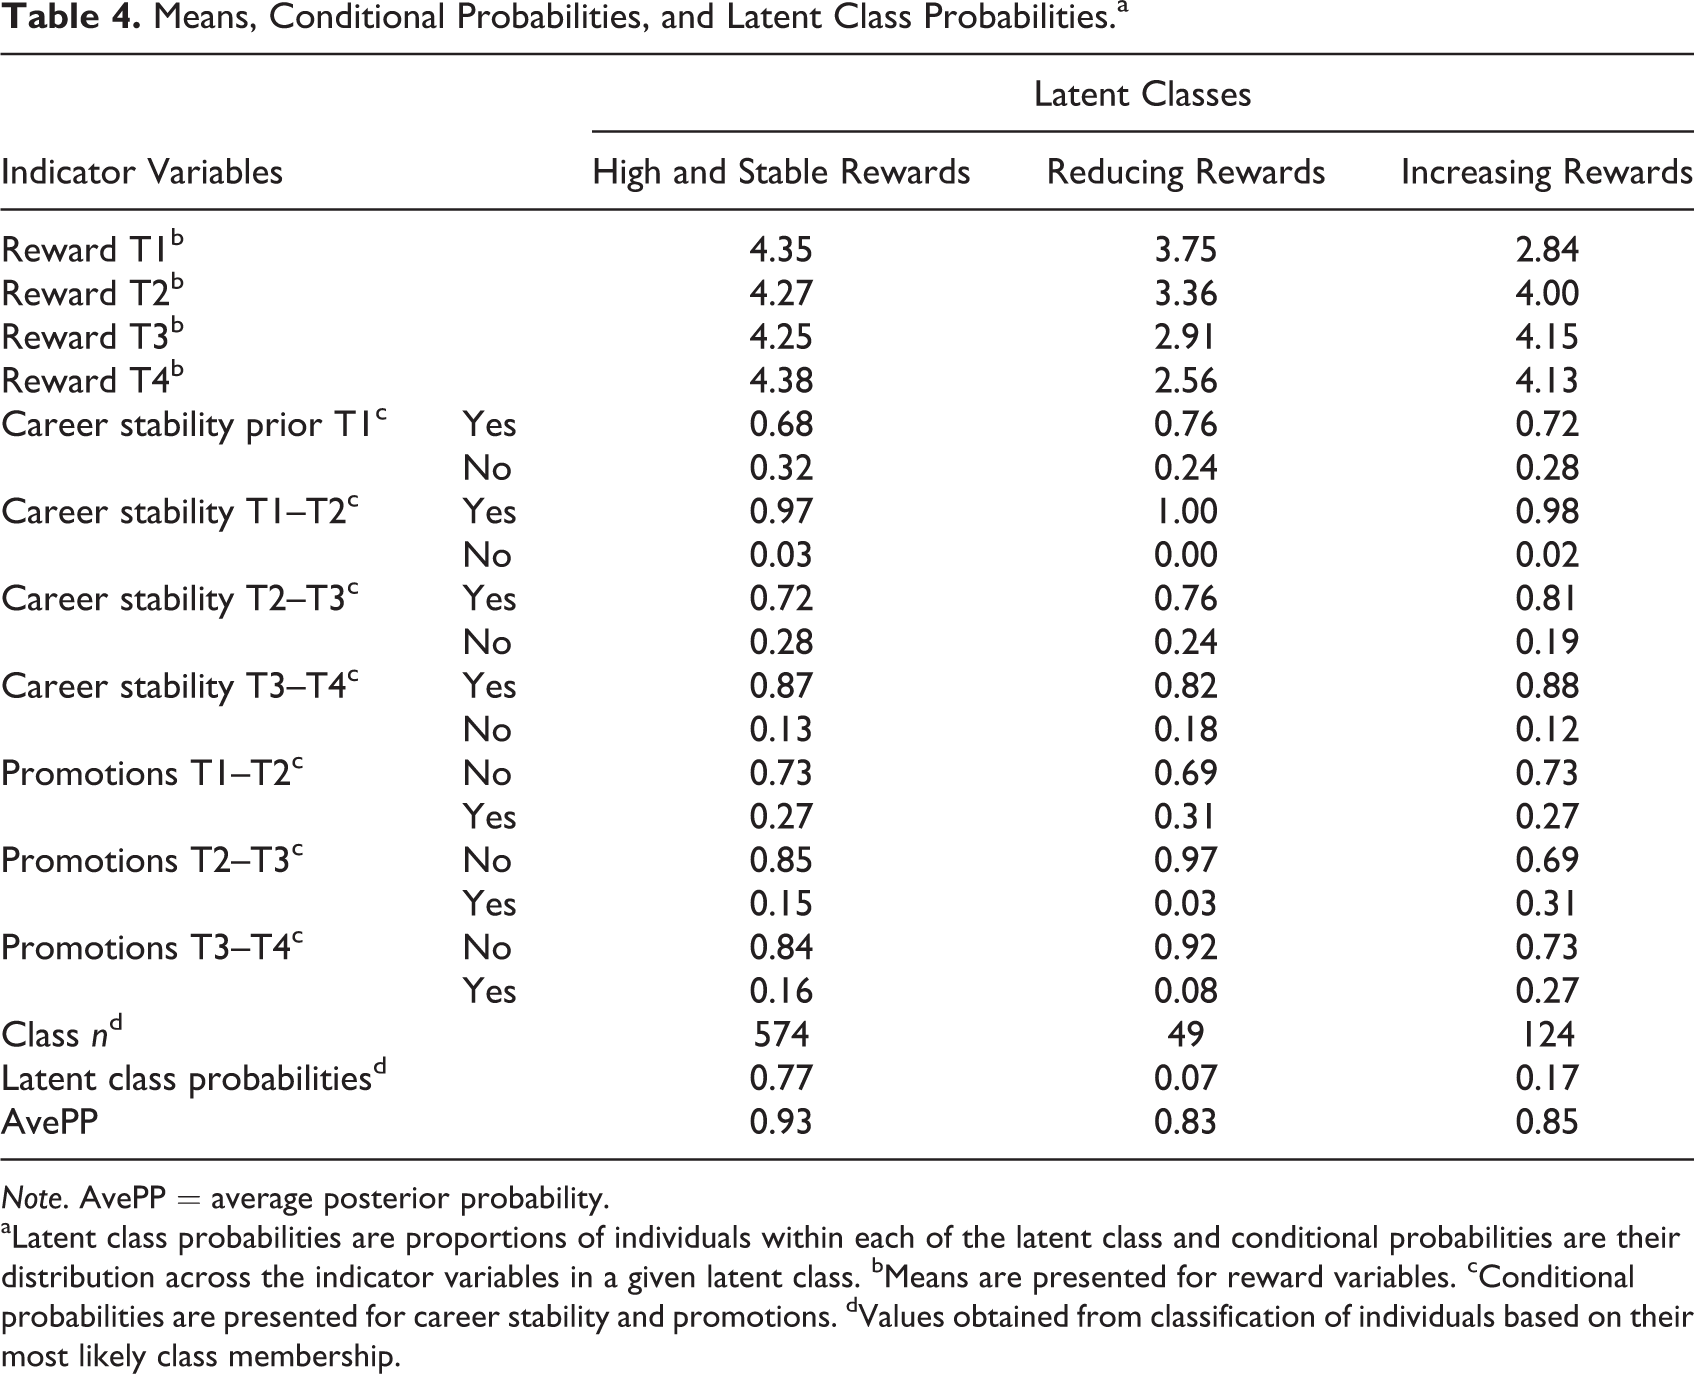
Note. AvePP = average posterior probability.
aLatent class probabilities are proportions of individuals within each of the latent class and conditional probabilities are their distribution across the indicator variables in a given latent class. bMeans are presented for reward variables. cConditional probabilities are presented for career stability and promotions. dValues obtained from classification of individuals based on their most likely class membership.
Results of multinomial logistic regression analysis for the association between reward patterns and covariates (gender, age, and management level) with the Mplus indicated that participants in the high rewards (odds ratio = 5.20, 95% confidence interval [2.18, 12.37]) and increasing rewards (odds ratio = 3.05, 95% confidence interval [1.15, 8.09]) patterns were more likely men than women, whereas participants in the reducing rewards pattern were more likely women than men. No differences between reward patterns were found in regard to management level and age.
Reward Patterns in Relation to Personal Work Goals
As seen in Table 5, participants in the high rewards pattern reported less goals related to progression, well-being, job change, and finance than participants in the reducing rewards pattern. In contrast, participants in the reducing rewards pattern reported less goals related to competence, job security, and organization than participants in the increasing rewards pattern. That is, the study hypotheses received some support since participants in the increasing rewards pattern reported more goals toward competence and organization than participants in the reducing rewards (Hypothesis 1), whereas participants in the reducing rewards pattern reported more goals toward job change than participants in the high rewards (Hypothesis 2).
Results of Poisson Regression Analysis for the Association Between Reward Patterns and Personal Goals.a
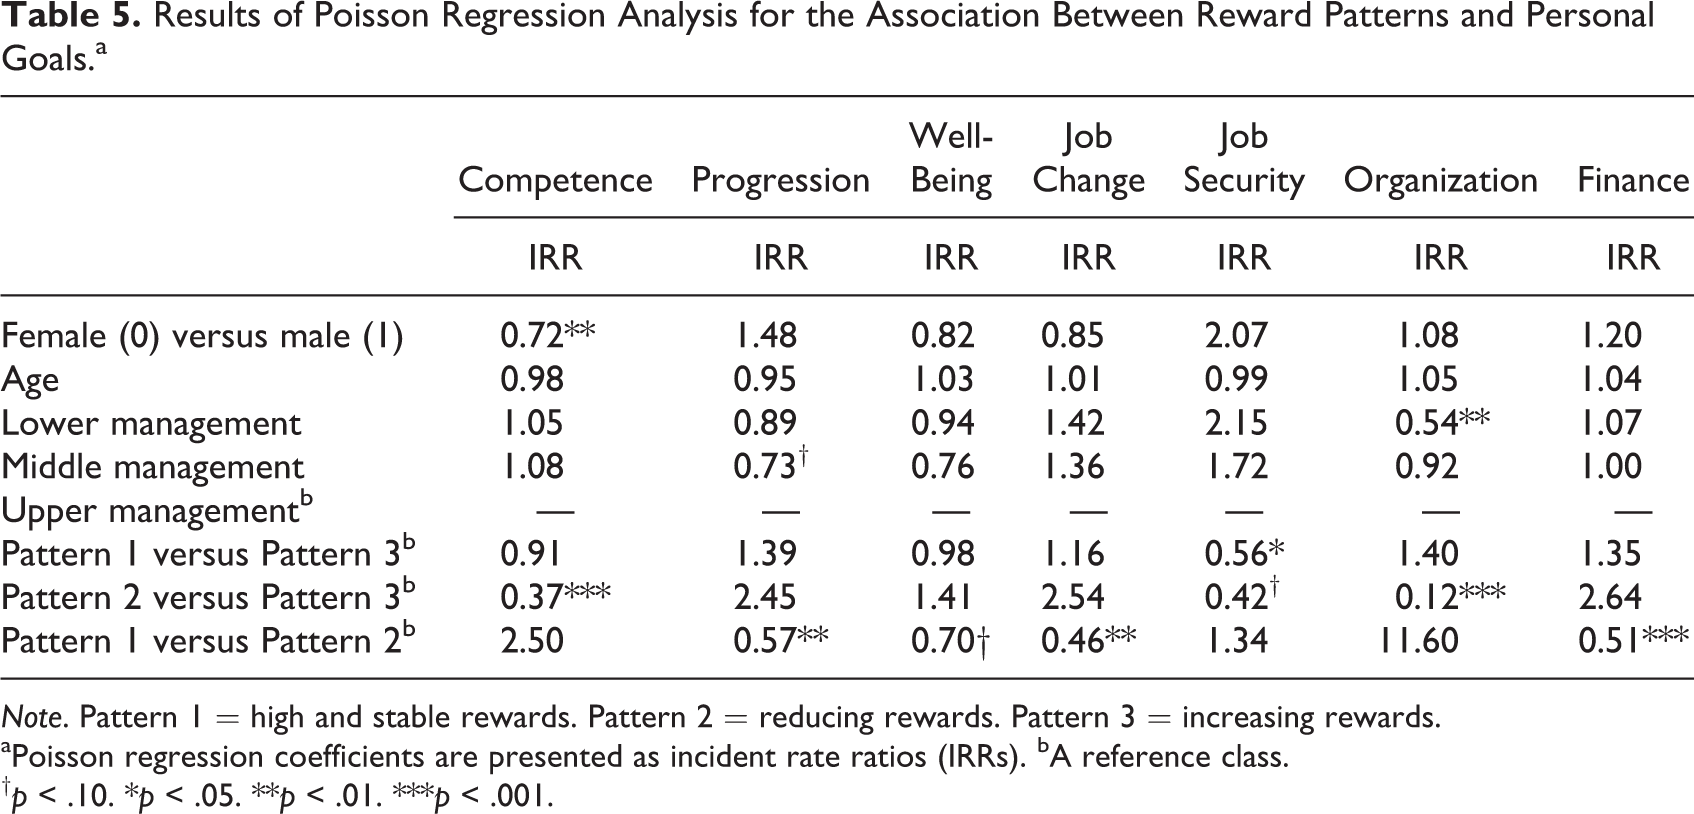
Note. Pattern 1 = high and stable rewards. Pattern 2 = reducing rewards. Pattern 3 = increasing rewards.
aPoisson regression coefficients are presented as incident rate ratios (IRRs). bA reference class.
† p < .10. *p < .05. **p < .01. ***p < .001.
Furthermore, participants in the high rewards pattern reported less goals related to job security than participants in the increasing rewards. The IRR for organization between participants in high and reducing rewards patterns was big, suggesting that participants in the high rewards pattern reported more goals related to organization than participants in the reducing rewards. However, the difference did not reach statistical significance since the standard error of the IRR was large. The large IRR was due to the low number of organizational goals among participants in the reducing rewards pattern.
Discussion
This research revealed the contribution of reward patterns on striving of personal work goals. Findings from this research offer a valuable step forward from previous studies on the relationship between career-related rewards and personal work goals by utilizing a person-centered approach in a 6-year, four-wave follow-up data among young Finnish professionals. As expected, there was heterogeneity over the follow-up period in the levels and changes in perceived rewards and prevalence of objective career rewards (career stability and promotions), which were represented as three long-term patterns of rewards.
Favorable Career-Related Resources
It is an encouraging finding that more than 90% of participants belonged to the reward patterns describing beneficial development of resources over the follow-up period. The resources in these patterns were characterized by rewards that were perceived as high and stable or increasing in esteem, professional status, salary, as well as offering good prospects for job security and promotion. This was coupled with actual promotions reported especially among participants with increasing rewards and fewer career disruptions during an unstable time in the national and global labor market. Participants in these reward patterns may represent the young managers in their early career who have reached a reasonably good labor market position and opportunities which can facilitate career stability and progression. The higher perceived rewards reported by the participants could be associated with better occupational well-being, professional autonomy, and physical and mental functioning as suggested by previous studies (Kinnunen et al., 2008; Siegrist et al., 2010). These psychological and social resources can accumulate and contribute toward “resource caravans” in line with the COR theory by Hobfoll (2011).
The finding regarding more personal work goals related to job security goals among participants with increasing rewards was intriguing. In a previous cross-sectional study, participants with job security goals as their most important personal goal reported favorable psychosocial work environment and the lowest level of burnout when compared to other participants in the study baseline (Hyvönen et al., 2010). The participants with increasing rewards in the present study had initially a low level of rewards, and through an increase of rewards, these participants may perceive that their expectation regarding career opportunities are met in the current work environment. Therefore, they may also consider employment in the current organization as advantageous and are aiming to sustain it.
Participants with increasing rewards also reported more competence goals which parallels the notion of the COR theory (Hobfoll, 2011) since individuals, who appear to have a good level of resources, set personal goals to further improve their competence and skills and meet the demands of the work tasks. The competence goals can also reflect the challenges faced by the so-called core employees who strive to sustain their position through adapting and developing of professional skills (Savickas et al., 2009). In addition, these participants had more goals toward organizational performance than participants with reducing rewards. These findings are in line with the previous 2-year follow-up study, in which an increase in perceived rewards, and particularly in the career opportunities subscale of rewards, was associated with engaging with competence and organizational goals as the most important personal work goal (Hyvönen et al., 2011). These goals have also been associated with better occupational well-being (Hyvönen et al., 2009). The present study gave further evidence with a person-centered analysis to support the contribution of the reward aspects of psychosocial work environment—as well as career rewards such as career stability and promotions—on the pursue of personal work goals. For the first time, multiple personal work goals were also investigated, highlighting the importance of favorable career-related resources in stronger orientation toward goals that can be beneficial for employee well-being as well as for the organization.
Unfavorable Changes in Career-Related Resources
Almost a fifth of the participants belonged to the reward pattern that reflected unfavorable development of resources during the study with reducing perceived rewards, fewer promotions, and more layoffs or unemployment particularly in the aftermath of the financial crisis in Europe. This combination of higher psychosocial stressors can be a notable strain in the long-term on the occupational health and well-being of these participants. Lacking rewards at work has been associated with negative well-being and health effects in previous studies (Kinnunen et al., 2008; Siegrist et al., 2010). Furthermore, many studies have confirmed that negative career events or unstable career are related to lowered well-being and health (e.g., Friedland & Price, 2003; Mauno et al., 2011). It could be that during unstable market conditions, the peripheral position of some employees (Savickas et al., 2009) becomes more apparent through career disruptions, for example, due to fixed-term contracts, and fewer possibilities to progress on career (see also Kallenberg, 2009).
Our present study adds to these consequences of personal work goals. As opposed to the participants with favorable reward patterns (high rewards and increasing rewards), the participants with reducing rewards had fewer personal work goals on competence, job security, and organization and in turn, had more goals toward progression, job change, finance, and well-being. These findings are also in line with previous research in which a decrease in perceived rewards related to engaging with job change goals (Hyvönen et al., 2011). Job change and well-being goals were also related to lower occupational well-being in the first study phase in 2006 with this sample of managers (Hyvönen et al., 2009).
These findings are interesting from the perspective of the COR theory (e.g., Hobfoll, 2011) since these goals can reflect the type of behaviors that managers engage in the face of perceived or actual resource loss. The higher prevalence of progression, job change, finance, and well-being goals can be seen as strategies to resolve and improve the person–environment interaction (e.g., Little, 2007). For some of these participants, there could be opportunities for progression within their current job, but also some might be more inclined to move to a better position in another company. That is, the participants’ goals reflected focus on improving one’s own labor market position and coping efforts an employee uptakes in order to manage and adjust situational career-related events.
In practice, some of these participants may have only few resources available or they could be using the available resources more appropriately in order to attain their salient goals (see Halbesleben et al., 2014). That is, in the present study, participants with reducing rewards may have fewer resources in personal life and at work to direct toward competence (e.g., training) or organizational performance. If resources are reducing, it may discourage further investment of resources in work-related pursuits and reinforce the loss spiral of resources. As suggested by the COR theory (e.g., Halbesleben et al., 2014; Hobfoll, 2011), management training and induction programs, especially in challenging labor market conditions, could be targeted to maximize the fit between the available resources and the environment. The interventions could be oriented toward providing tools and learning skills to prevent further losses occurring and building resilience to persist on personal goals through which participants’ can develop their skills as well as focus on the success and performance of their organization. In addition, rewards such as outlined in the ERI model (e.g., Siegrist, 1996) as well as opportunities for promotion and career stability can be important passageways through which resources can be distributed in organizations that facilitate focus on employee competence and organizational performance.
Limitations and Future Directions
Our study contains several limitations which should be acknowledged before making inferences based on these findings. First, owing to the relatively small sample size in the unfavorable reward pattern, our study may have suffered from limited statistical power. This may have resulted in an inability to detect subtle links between latent patterns and goal outcomes in Poisson regression analyses. Second, although RMLCA provides a tool for exploring the interconnections among a set of continuous and/or categorical variables, one should be cautious about attaching too much meaning to a latent class or to a label assigned to it. Third, reward patterns and personal goals should be investigated with a gender-balanced, larger range of employees from various fields to get a more representative picture of different career paths and their contribution on the contents of personal work goals also in other countries. Fourth, the study is based on questionnaire data, and, therefore, additional objective data (e.g., records of salary) should be collected in order to avoid the limitations of self-report data and same-source bias.
In conclusion, these findings highlight how participants’ rewards at work can contribute to their personal work goals. Optimally, good opportunities for perceived as well as objective career rewards, such as professional status, salary, job security, and promotion, can encourage engaging in developing professional competence and focus on organizational performance and success. These rewards can be seen as important resource passageways (Hobfoll, 2011), promoting beneficial goal pursuit in organization that could be utilized in organization when designing development and career programs for managers. In the long-term unfavorable reward, development can instigate goal striving for changing the situation better for oneself, for instance, through promotion, or in turn, seeking a new job opportunities elsewhere which can have detrimental outcomes on both organizational performance and employee well-being (Hyvönen et al., 2009, 2011).
Footnotes
Declaration of Conflicting Interests
The author(s) declared no potential conflicts of interest with respect to the research, authorship, and/or publication of this article.
Funding
The author(s) disclosed receipt of the following financial support for the research, authorship, and/or publication of this article: This article is based on the research supported by the Jenny and Antti Wihuri Foundation and by the Finnish Work Environment Fund (Grant no. 105363).