
Abstract
Background
Computed tomography (CT) is widely used in clinical diagnosis of lung diseases. The automatic segmentation of lesions in CT images aids in the development of intelligent lung disease diagnosis.
Objective
This study aims to address the issue of imprecise segmentation in CT images due to the blurred detailed features of lesions, which can easily be confused with surrounding tissues.
Methods
We proposed a promptable segmentation method based on an improved U-Net and Segment Anything model (SAM) to improve segmentation accuracy of lung lesions in CT images. The improved U-Net incorporates a multi-scale attention module based on a channel attention mechanism ECA (Efficient Channel Attention) to improve recognition of detailed feature information at edge of lesions; and a promptable clipping module to incorporate physicians’ prior knowledge into the model to reduce background interference. Segment Anything model (SAM) has a strong ability to recognize lesions and pulmonary atelectasis or organs. We combine the two to improve overall segmentation performances.
Results
On the LUAN16 dataset and a lung CT dataset provided by the Shanghai Chest Hospital, the proposed method achieves Dice coefficients of 80.12% and 92.06%, and Positive Predictive Values of 81.25% and 91.91%, which are superior to most existing mainstream segmentation methods.
Conclusion
The proposed method can be used to improve segmentation accuracy of lung lesions in CT images, enhance automation level of existing computer-aided diagnostic systems, and provide more effective assistance to radiologists in clinical practice.
Introduction
Data released by the American Cancer Center indicated that lung cancer currently has the highest incidence rate and the third highest mortality rate among malignant tumors. 1 Immune checkpoint inhibitors (PD-1/PD-L1) have been proven to be effective in the treatment of lung cancer. 2 However, there are still no absolutely accurate predictive markers for efficacy of PD-1/PD-L1 inhibitors in clinical practice. 3 Therefore, developing a scientific model to predict the outcome of immunotherapy is of significant importance for assisting the clinical use of PD-1/PD-L1 inhibitors. Adelsmayr et al. 4 and Wu et al. 5 have proposed that the segmentation results of pulmonary lesions in medical images directly impact the accuracy of lung cancer prognosis predictions. Therefore, the accuracy of pulmonary lesion segmentation algorithms is critically important.6,7
Olaf 8 et al. proposed a U-Net network, which pioneered a symmetric encoder-decoder structure that worked well in small sample datasets. Li et al. 9 (2024) proposed a UCFilTransNet network. The network redesigns the transformer architecture from the frequency domain perspective and develops a Residual Pyramid Squeeze Attention (RPSA) module at the bottleneck to enhance local information and establish long-range dependencies. The model performed pulmonary CT lesion segmentation on the NSCLC-Radiogenomics dataset, achieving a Dice Similarity Coefficient (DSC) of 62.99% and an Intersection over Union (IoU) of 52.23%. Riaz et al. 10 (2023) developed a hybrid model that integrates MobileNetV2 and U-Net architectures for the segmentation of lung tumors from CT images derived from the TCIA dataset. The proposed model achieved a dice score of 0.8793. The traditional deep learning models, represented by U-Net, have achieved commendable results in lung lesion segmentation. However, they also have notable limitations. Primarily, the datasets used are often simplified, focusing on isolated pulmonary nodule segmentation. The lack of quantity and diversity in the training datasets results in suboptimal performance when dealing with lesions that are adherent to organs or complicated by lung atelectasis.
Segment Anything model (SAM) proposed by Kirillov et al. 11 is a promptable segmentation model that was trained on 11 million images with more than 1 billion masks that achieves robust zero-sample generalization. Cheng 12 collected and organized the largest and most comprehensive medical image segmentation dataset to date. Based on this dataset, a model named SAM-Med2D was fine-tuned from SAM. It achieved good results on all 9 MICCAI 2023 datasets. For example, it obtained a 90.95% dice score on the FLARE2 13 organ segmentation dataset, proving feasibility of SAM's development towards medical image segmentation. Large parameter models, such as those represented by SAM has a higher ability to recognize different kinds of objects (in this study, we specifically refer to an ability to recognize lesions with lung atelectasis or organs) due to their extensive datasets. However, when dealing with some small lesions, these models can exhibit instability due to the inaccuracy in the placement of interaction points. As He et al. 14 mentioned in their paper, SAM was tested on 12 public medical image segmentation data sets involving 7451 subjects. The Dice coefficient of SAM was 0.1–0.5 different from that of five medical image-based algorithms such as U-net and U-net++.
Given the diversity of pulmonary lesions, which include small isolated nodules and larger lesions adhering to lung atelectasis, using either traditional deep learning networks such as U-Net or large parameter models like SAM alone cannot perfectly address the task of lung lesion segmentation. Therefore, we propose a lung segmentation method that combines SAM and an improved U-Net, aiming to leverage the strengths of both models to enhance the accuracy of lung lesion segmentation.
Methodology
Network architecture
We proposed a model fusion architecture (see Figure 1) and present a Dual Attention U-Net (see Figure 2), an improved network based on U-Net. After every two 3 × 3 convolutions, it incorporates an Efficient Channel Attention (ECA) module, which is based on a multi-scale attention module to enhance saliency of local feature information. Additionally, physicians’ prior knowledge is introduced into the model in form of mouse clicks, and CT images are clipped to reduce redundant information in images. Finally, the model fusion module is utilized to compute and generate the final result.

The workflow of the proposed method. (a)Cropping of CT image based on Interactive point reception from physician. (b) Simultaneous input of CT image into and SAM for training and prediction. (c) Prediction results of the 2 models are judged according to the model fusion mechanism to obtain final results. Calculation refers to computing two parameters based on the number of target pixels in the masks output by two models: Parameter 1: the difference between the two. Parameter 2: the maximum value between the two. Decision-making involves comparing Parameter 1 and Parameter 2 against experimentally determined thresholds. The decision rule is as follows: if Parameter 1 is less than Threshold 1 and Parameter 2 is greater than Threshold 2, the output from SAM is used as the final output. Otherwise, the output from DA-U-Net is used as the final output. Both Threshold 1 and Threshold 2 are determined experimentally.).
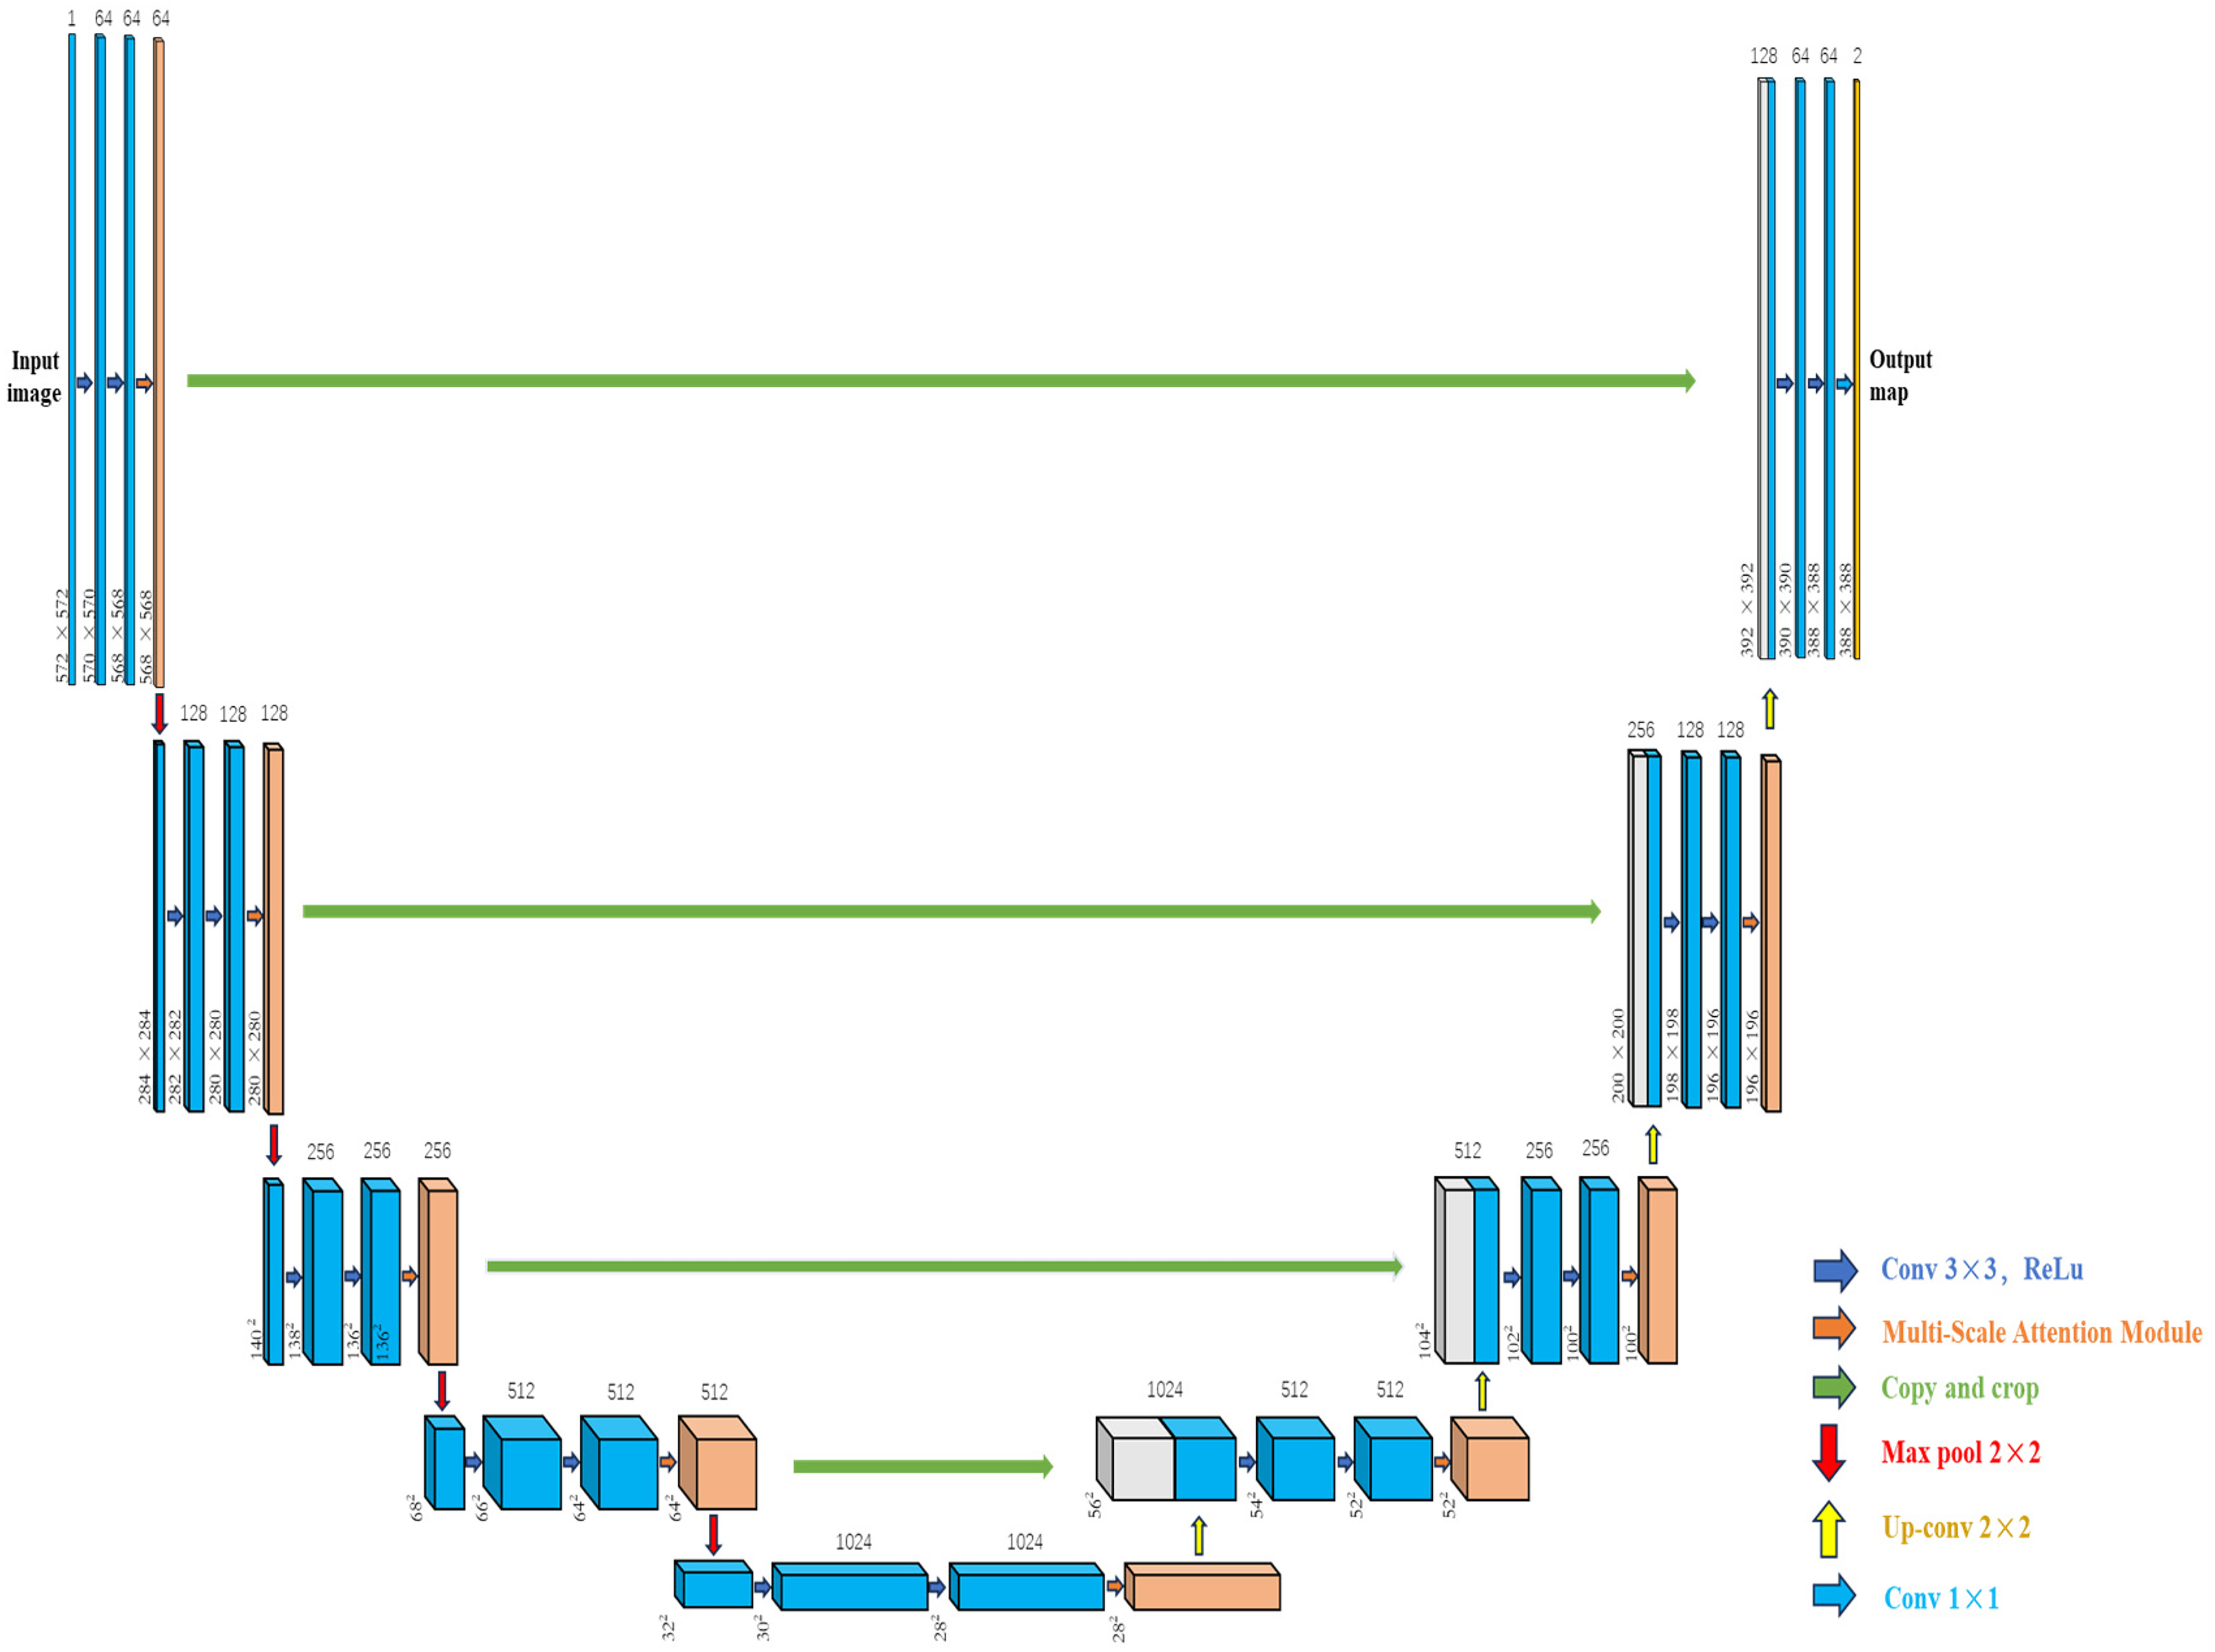
The architecture of the proposed dual attention U-Net. Each blue box corresponds to a multi-channel feature map. Orange boxes refer to feature maps processed by the multi-Scale Attention Module. White boxes represent copied feature maps. Arrows denote different operations. (The resizing rules for copy and crop operations in horizontal feature paths first calculate the height difference and width difference between the encoder's feature map and the decoder's feature map in the same hierarchy, then calculate the crop amount, and finally perform a center crop.).
Multi-scale attention module
We propose an attentional module applied to lung CT images, which aims to effectively enhance saliency of lesion features such as points and lines. Original feature map is first sliced to generate feature sub-maps of 1/2 size of the original map. These feature sub-maps are subsequently passed through a multi-head self-attention mechanism 15 to compute pixel correlation between local and global regions. The pixel features after the multi-head self-attention mechanism are then fed into the Efficient Channel Attention (ECA) 16 module. The processed feature subgraphs are spliced one by one and restored to the original size to get a weighted feature map, which is then sliced to generate feature subgraphs with a size of 1/4 of the original map, and the appeal operation is repeated to form final output. Its overall structure is shown in Figure 3.
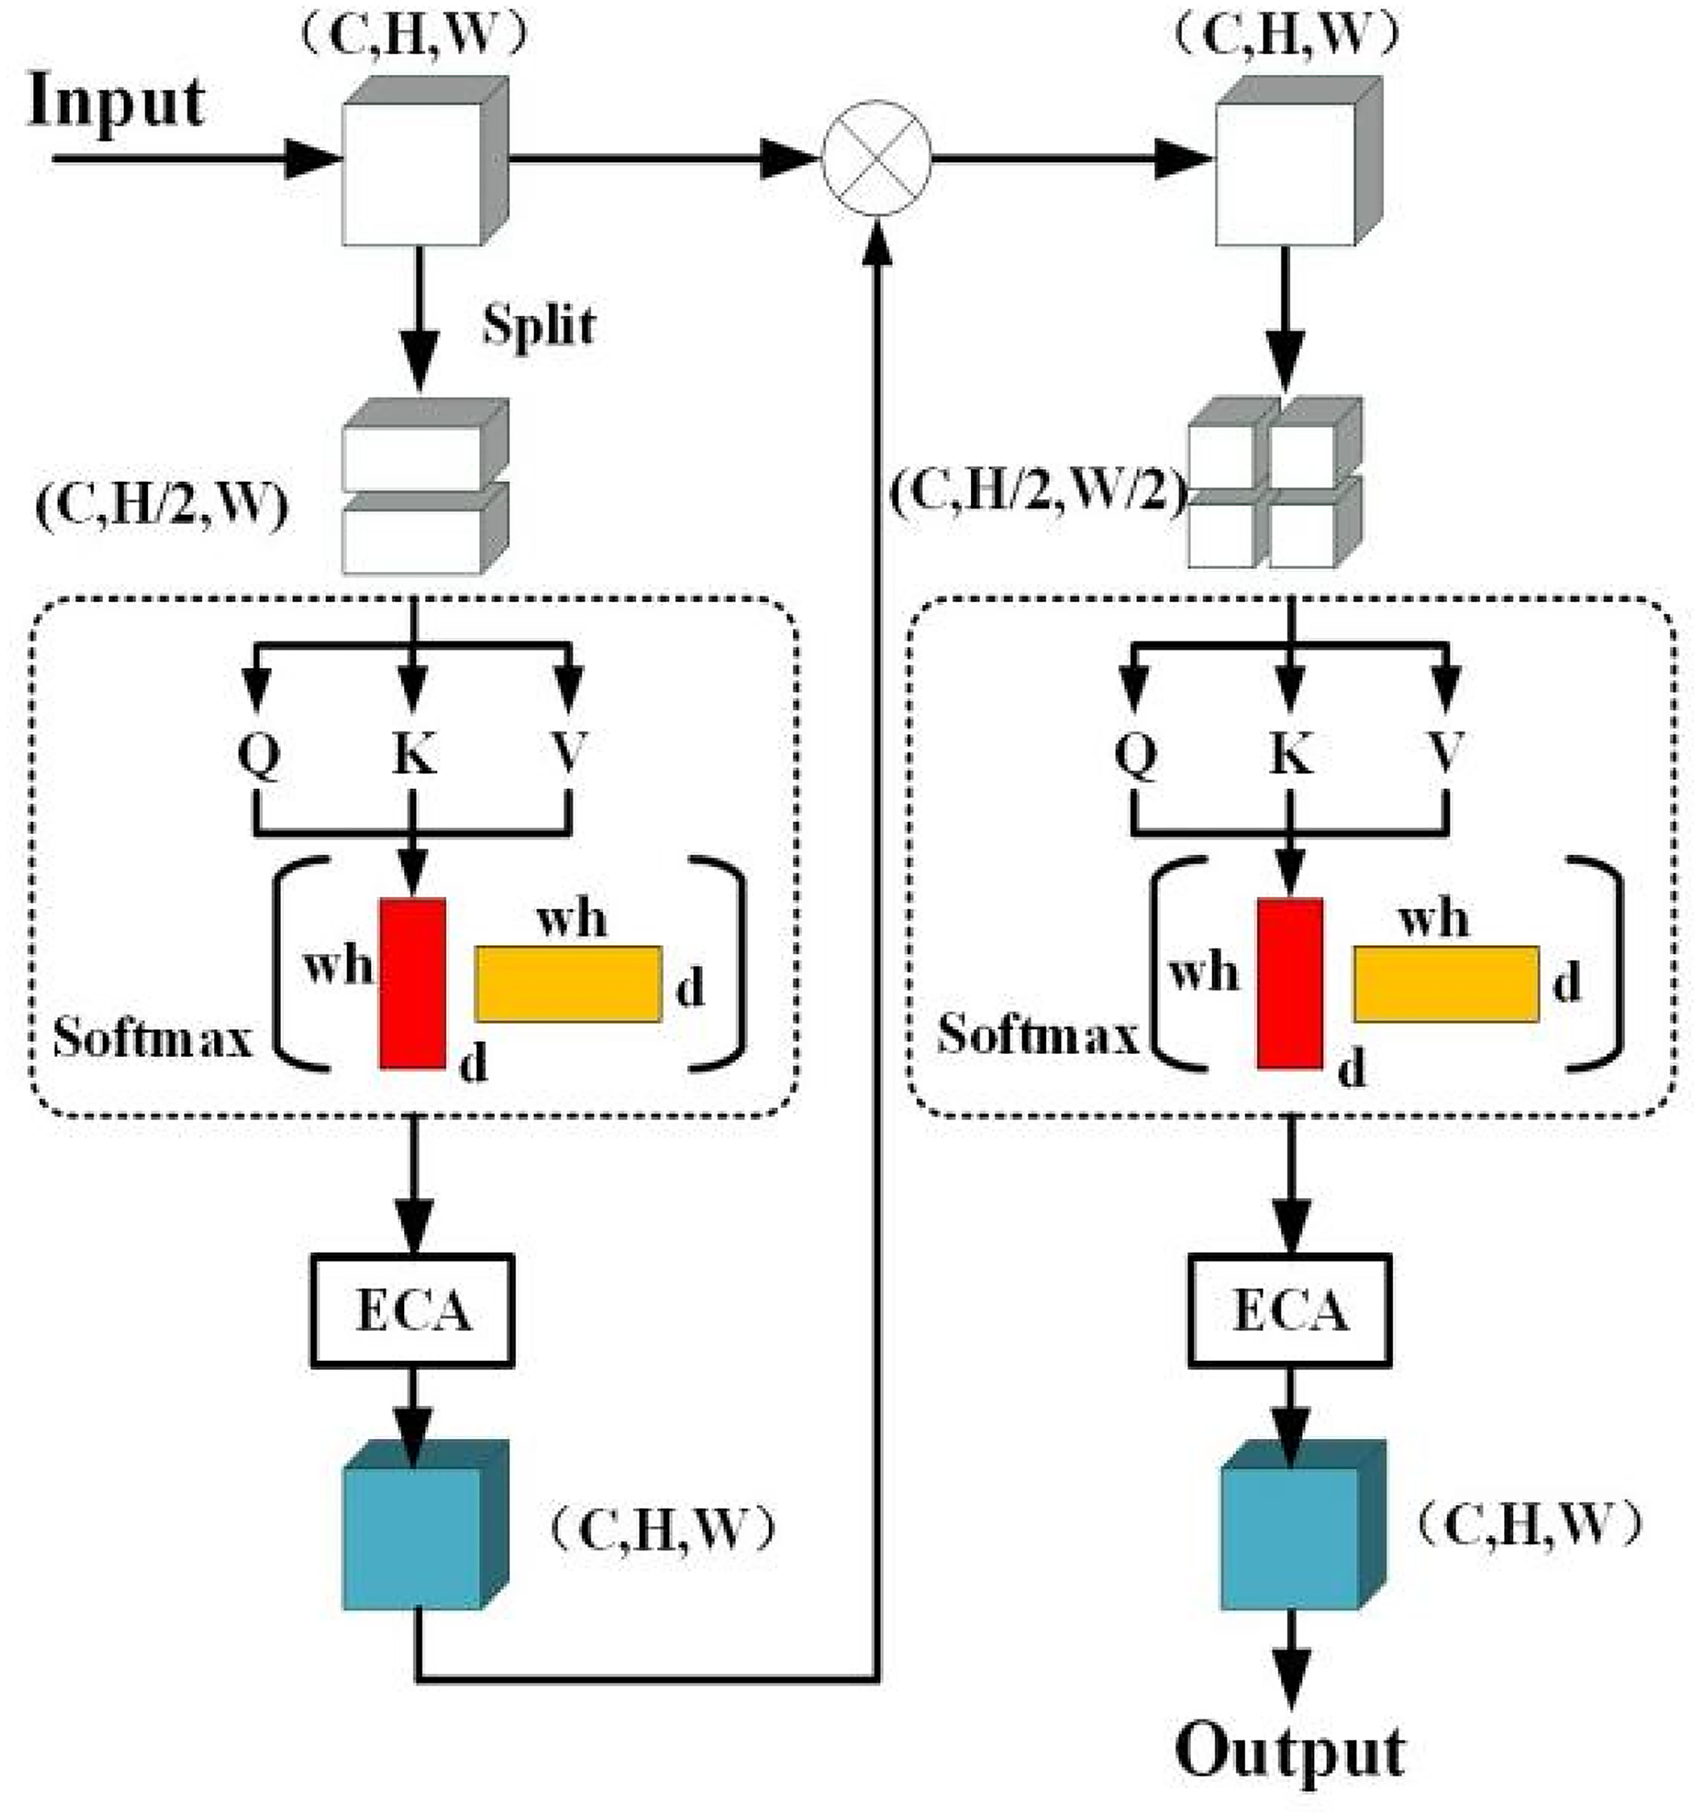
Illustration of the proposed multi-scale attention module.
Where C denotes a channel dimension of a feature map, H and W denote a height and width of the feature map respectively. The multi-head self-attention mechanism can generate weight matrices Wq, Wk and Wv based on a similarity relationship between pixels, and then query matrix Q, key-value matrix K and value matrix V are obtained from equation (1):
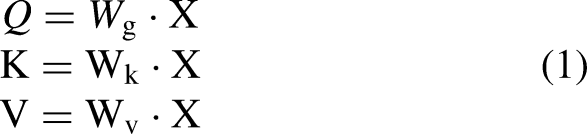
Where X represents a feature map matrix of size (C, H, W) and the resulting mathematical expression for the self-attention mechanism is:

Where N represents the maximum index value in the feature map matrix X. Softmax refers to the Softmax function. The exp function indicates performing exponentiation. The index i represents the outer summation and denotes the position of each pixel in X, while the index j represents the inner summation, indicating the position of every pixel in X except for i. The term Si denotes the similarity between the query matrix Q and the key matrix K; Vi represents the value at index i in the value matrix V; and d represents the dimension of the query matrix Q or the key matrix K.
Adding the ECA module after the self-attention mechanism with global average pooling and linear transformation is less computationally complex and more efficient compared to fully-connected operations of other attention mechanisms (e.g., SE module 17 ). It's principle is:
First, global average pooling is used to aggregate spatial information of each channel of input features (C, H, W) to obtain a 1 × 1 × C feature map. The global average pooling (GAP) operation is shown in equation (3):

Where GAP(X) denotes the result of applying Global Average Pooling to the input feature map matrix X, respectively. N represents the maximum index value in the feature map matrix X, which is the total number of pixels in X. The index i is used for summation and indicates the position of each pixel in X. Convolution operation is performed on GAP (X) using a dynamic one-dimensional convolution with a convolution kernel of size k. The convolution kernel adaptive function as well as the weights ω ∈ R1 × 1×C are defined as follows:
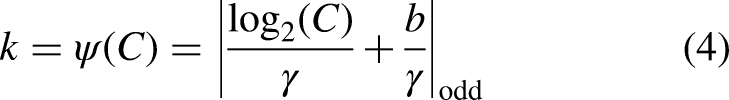

Where in equation (4) k denotes convolution kernel size, C denotes number of channels, ∣ ∣odd means that K can only take odd numbers, γ and b are used to change ratio between the number of channels C and the convolution kernel size. Vector ω in equation (5) is used to adjust attentional weight of each channel, and a Sigmoid function is used to calculate an activation value of one-dimensional convolutional output. Finally, each channel feature of U and ω is recoded and multiplied element by element to obtain a final feature map.
Promptable clipping module
End-to-end medical image segmentation models, represented by U-Net, are often referred to as “black boxes” mainly because of their low interpretability, which makes it difficult to provide physicians with intuitive explanations and understanding.18–21 So we proposed a promptable clipping module, which enables physicians to participate in the model prediction and give critical hints to improve segmentation efficiency and at the same time increase recognition of physicians. Implementation process: physicians provide a point of interaction on any slice in CT, and the CT image is cropped with this interaction point as center. Cropping process is as in equation (6), which changes size of CT pixels from (512, 512) to (128, 128).

Where (X, Y) are coordinates of interaction points provided by physicians. R is size of the Region of Interest (ROI) expected to be cropped. X1, X2, Y1, Y2 are horizontal and vertical coordinates of cropped images. Img is original CT map matrix, Img* denotes cropped CT matrix, and [ ] is a slicing operation in Python.
22
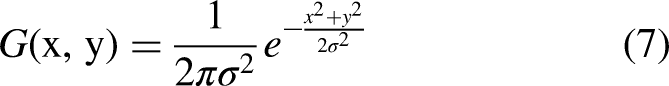
In training phase, interaction points are obtained based on mask images and gray scale mask maps represent smoothed using Gaussian filtering of equation (7):
Then Canny edge detection algorithm 23 is used to detect edges of images, gradient of images are calculated using Sobel operator, 24 gradient images are suppressed by non-maximization, and then double thresholding are used for edge detections to form complete edges. Finally, center coordinates of contour are obtained after determining the lesion contours and calculating moments of the contours using a find-Contours function in open-cv. 25
Model fusion mechanisms
Outputs were obtained by simultaneously inputting lung CT images and promptable points into the two models, and outputs of the two models were compared with two parameters based on the number of target pixels in the masks output by two models: Parameter 1: the difference between the two. Parameter 2: the maximum value between the two. If Parameter 1 is less than Threshold 1 and Parameter 2 is greater than Threshold 2, the output from SAM is used as the final output. Otherwise, the output from DA-U-Net is used as the final output. Both Threshold 1 and Threshold 2 are determined experimentally. Within the range of 50–3000 pixels, one value is taken for each parameter at every 50 pixels [50, 100, 150, … 2950, 3000] (60 in total). After combining the two parameters, exhaustive experiments were conducted, resulting in a total of 3600 sets of experimental data. Finally, values of the two parameters yielding the highest dice coefficient are selected as the two established thresholds.
The rationale for employing this fusion strategy is: we preliminarily assess the lesion size using Parameter 2, and apply Threshold 2 derived from experiments to distinguish the lesions. For larger lesions, we prefer to use the SAM model for segmentation, while for smaller lesions, we tend to use the modified U-net. However, due to the instability of the SAM model, we incorporate Parameter 1 to determine whether the outputs of the two models differ significantly. When Parameter 1 exceeds Threshold 1, it indicates that the number of target pixels in the outputs of the two models differs greatly. This is likely due to erroneous interactive points causing the SAM model to generate an overly large segmentation (incorrect target). In such cases, we choose the more stable modified U-net's result as the final segmentation outcome.
Experiment and result
Dataset and experimental platform
The aforementioned segmentation models were trained and tested on the LUNA16 dataset (https://luna16.grand-challenge.org) as well as a lung CT dataset provided by Shanghai Chest Hospital. The LUNA16 dataset is relatively large in number, containing CT lung image data from 888 patients (all lesions are larger than 3 as in diameter). The lung CT dataset provided by Shanghai Chest Hospital was relatively small, containing CT lung image data from 140 patients. The labeling of lesion locations was done by two physicians with more than 10 years of experience at Shanghai Chest Hospital. Most of patients were patients with advanced lung cancer, and overall lesion size was larger than that of the LUNA16 dataset. The dataset provided by Shanghai Chest Hospital was used as a supplement to the LUNA16 dataset to evaluate models’ segmentation performances more comprehensively.
All experiments were carried out on an Intel i12–12700KF processor and an NVIDIA GeForce GTX 3090 GPU with 16GB memory and trained 100 epochs for each model. We individually trained the segmentation models on a PyTorch 1.8 deep learning framework based on Windows operating system and Python 3.9. To train the segmentation models, the stochastic gradient descent (SGD) optimizer with a learning rate of 0.001 was used. The binary cross-entropy (BCE) and the L1 norm loss functions were used to train the segmentation models with a batch size of 9. Additionally, the momentum coefficient is set to 0.9. Evaluation of the models are performed using 5-fold cross-validation.
Evaluation indicators
Dice coefficient (DSC), intersection over union (IoU), Positive Predictive Value (PPV) and Hausdorff Distance at 95% (HD_95) are selected as evaluation indices for segmentation. DSC and IoU are capable of evaluating the degree of overlap between the model's segmentation results and the ground truth (i.e., the gold standard). These metrics can accurately reflect the model's ability to segment lesions, even under conditions where there is a significant disparity in the number of voxels between the foreground (lesion) and background. Furthermore, DSC and IoU complement each other when assessing samples with both small and large lesions. On the other hand, PPV can reflect the model's false positive rate, and HD_95 has the ability to assess the accuracy of boundary detection within the segmented regions. Therefore, using these four evaluation metrics in combination allows for a comprehensive assessment of the model's segmentation performance.26–28

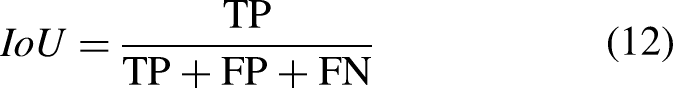
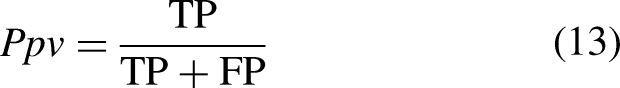

Where TP (True Positives) represents the number of true positive cases, FP (False Positives) represents the number of false positive cases, and FN (False Negatives) represents the number of false negative cases. hd(x, P) denotes the computation of the Hausdorff distance, which is the distance from point x in point set P to the nearest point in point set T. Here, T represents the set of boundary points of the mask, and P represents the set of boundary points from the model prediction results. The term Percentile (, 95%) refers to the calculation of the 95th percentile.
Model performance comparison and ablation experiments
Comparison with existing literature methods
In order to verify effectiveness of the proposed segmentation method for 2D slices of CT images, we compared it with popular open-source segmentation models, such as U-Net,
8
U-Net++,
29
Trans-U-Net,
30
Swin-U-Net,
26
and SAM.
11
Experiments were carried out on the two datasets and cross-validation experiments were performed on the two datasets (dataset provided by Shanghai Chest Hospital (dataset 1) and luna16 (dataset 2) public dataset). Fours experiments were carried out:
80% dataset 1 as training set and 20% dataset 1 as test set 80% dataset 2 as training set and 20% dataset 2 as test set 80% dataset 1 as training set and 100% dataset 2 as test set 80% dataset 2 as training set and 100% dataset 1 as test set
Figure 4. Comparative histograms composed of Dice, IoU, and Ppv scores for the proposed DA-U-Net and four other models at segmented lung lesion task weight on the four experiments mentioned above.
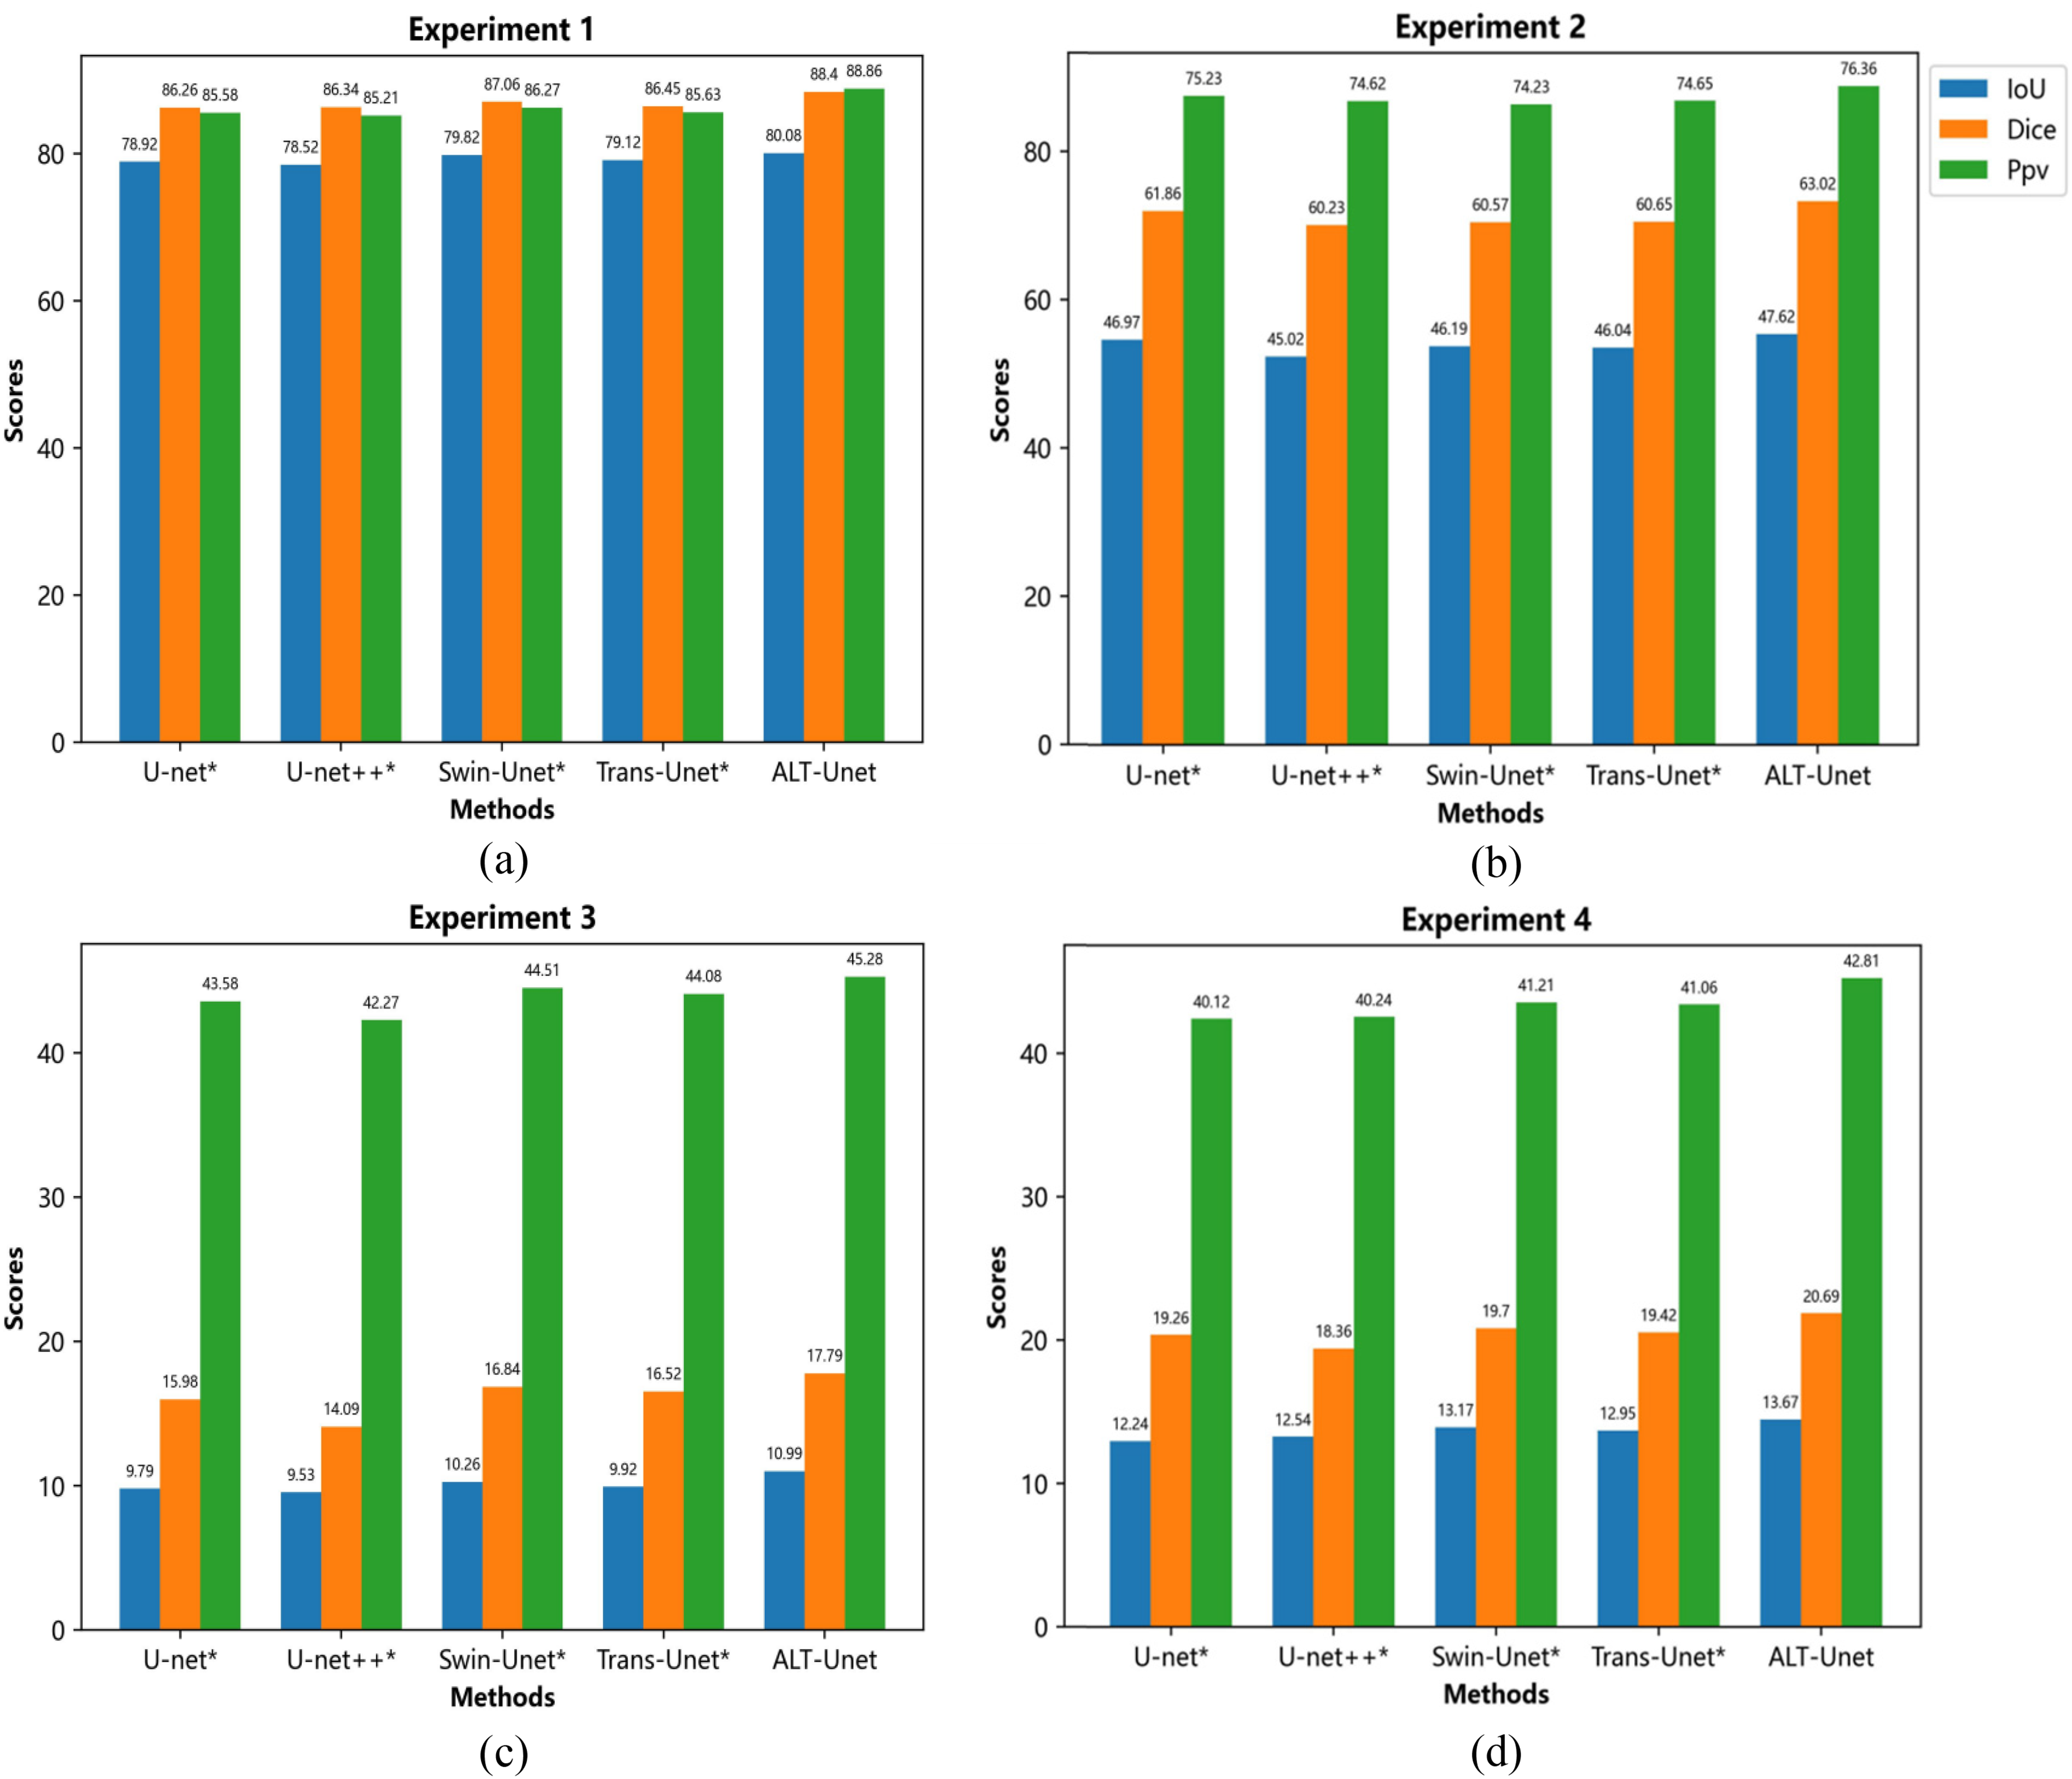
Shows performance of each model in task of lung lesion segmentation in 4 experiments. (* on the name of model indicates that the model is statistically different from the model in this paper with a P-value < 0.05, and * in the table afterward serves the same purpose.).
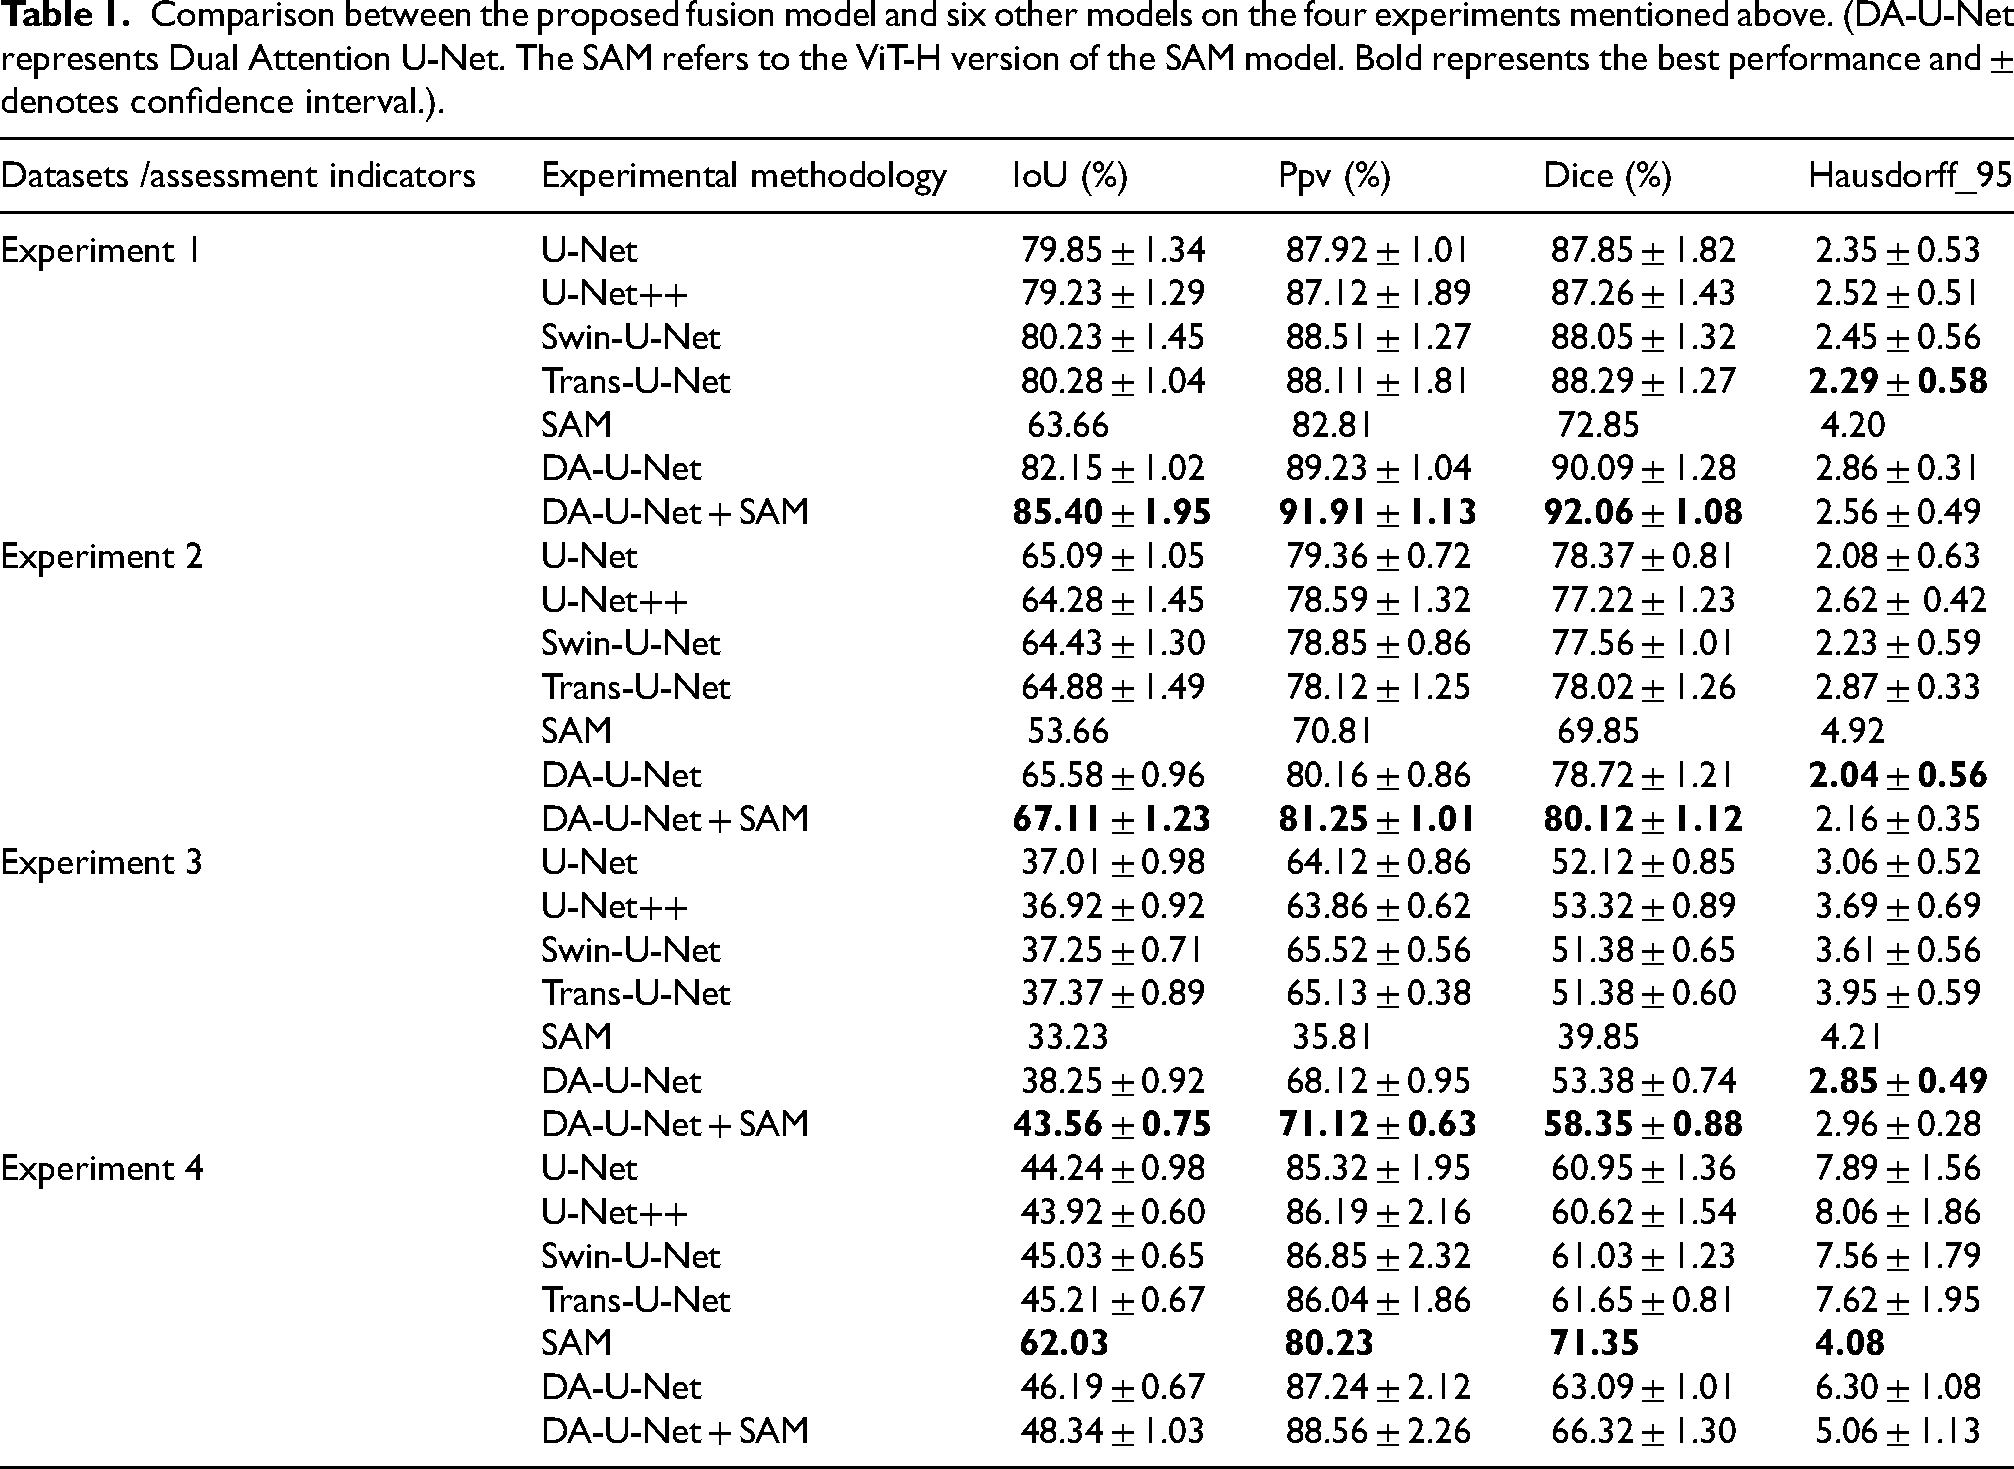
The best performing comparative models in experiments 1 and 2 are Swin-U-Net and U-Net, with Dice coefficients of 87.06% and 61.86%. The Dice coefficients of our proposed method, Dual Attention U-Net, reach 88.40% and 63.02% respectively, higher than Swin-U-Net and U-Net. The best results are also achieved in the other two metrics. In the other hand, experiments 3,4 showed that in the case where training set and test set belong to different datasets, our method remains obtains optimal results. Table 1 shows performance of each model after adding the promptable clipping module, and the Dice coefficient exhibits more than a 1% performance improvement. Notably,the fusion model of Dual Attention U-Net and SAM, achieves a Dice coefficient of 92.06%, which is 6.72% higher than that of the benchmark model, U-Net.
Comparison between the proposed fusion model and six other models on the four experiments mentioned above. (DA-U-Net represents Dual Attention U-Net. The SAM refers to the ViT-H version of the SAM model. Bold represents the best performance and ± denotes confidence interval.).
Ablation experiments
Table 2 presents segmentation performance comparison of the proposed model with different permutations of the two modules (module 1: multi-size Attention module and Module 2: Promptable Clipping Module) based on the U-Net network. Adding the Promptable Clipping Module improves the model's Dice coefficients in experiments on the four different datasets by 1.76%, 1.84%, 12.25%, and 11.68% respectively. Adding the multi-size attention Module results in an improvement of the model's Dice coefficients by 2.48%, 2.54%, 290.70%, and 162.32% in the experiments with four different datasets, respectively. However, adding both modules simultaneously enhances the Dice coefficients by 4.44%, 4.15%, 309.40%, and 216.23% respectively, confirming that both modules contribute to improving model performance.
Comparison of the proposed model with different permutations of the two modules (module 1: multi-size attention module and, module 2: promptable clipping module) based on the U-Net network. (The purpose of this experiment is to verify that module 1 and module2 have the ability to increase the performance of model segmentation, so this experiment does not involve the model fusion module, and is not the optimal experimental results in this study, the optimal experimental results are shown in Table 1 in DA-U-Net + SAM).

Experimental results of model fusion parameter selection
Outputs were obtained by simultaneously inputting lung CT images and promptable points into the two models, and outputs of the two models were compared with two parameters based on the number of target pixels in the masks output by two models: Parameter 1: the difference between the two. Parameter 2: the maximum value between the two. If Parameter 1 is less than Threshold 1 and Parameter 2 is greater than Threshold 2, the output from SAM is used as the final output. Otherwise, the output from DA-U-Net is used as the final output. Both Threshold 1 and Threshold 2 are determined experimentally. Within the range of 50–3000 pixels, one value is taken for each parameter at every 50 pixels [50, 100, 150, … 2950, 3000] (60 in total). After combining the two parameters, exhaustive experiments were conducted, resulting in a total of 3600 sets of experimental data. Finally, values of the two parameters yielding the highest dice coefficient are selected as the two established thresholds.
The final experiments, as shown in Figure 5, indicate that the highest Dice coefficient on the LUNA16 dataset was achieved at 80.12 when parameter 1 was set to 150 pixels and parameter 2 was set to 300 pixels. On the lung CT dataset provided by the Shanghai Chest Hospital, the highest Dice coefficient reached 92.06 when parameter 1 was set to 350 pixels and parameter 2 was set to 2300 pixels. The experimental results demonstrate that by optimizing these two parameters, the segmentation performance of the fusion model can be significantly improved.
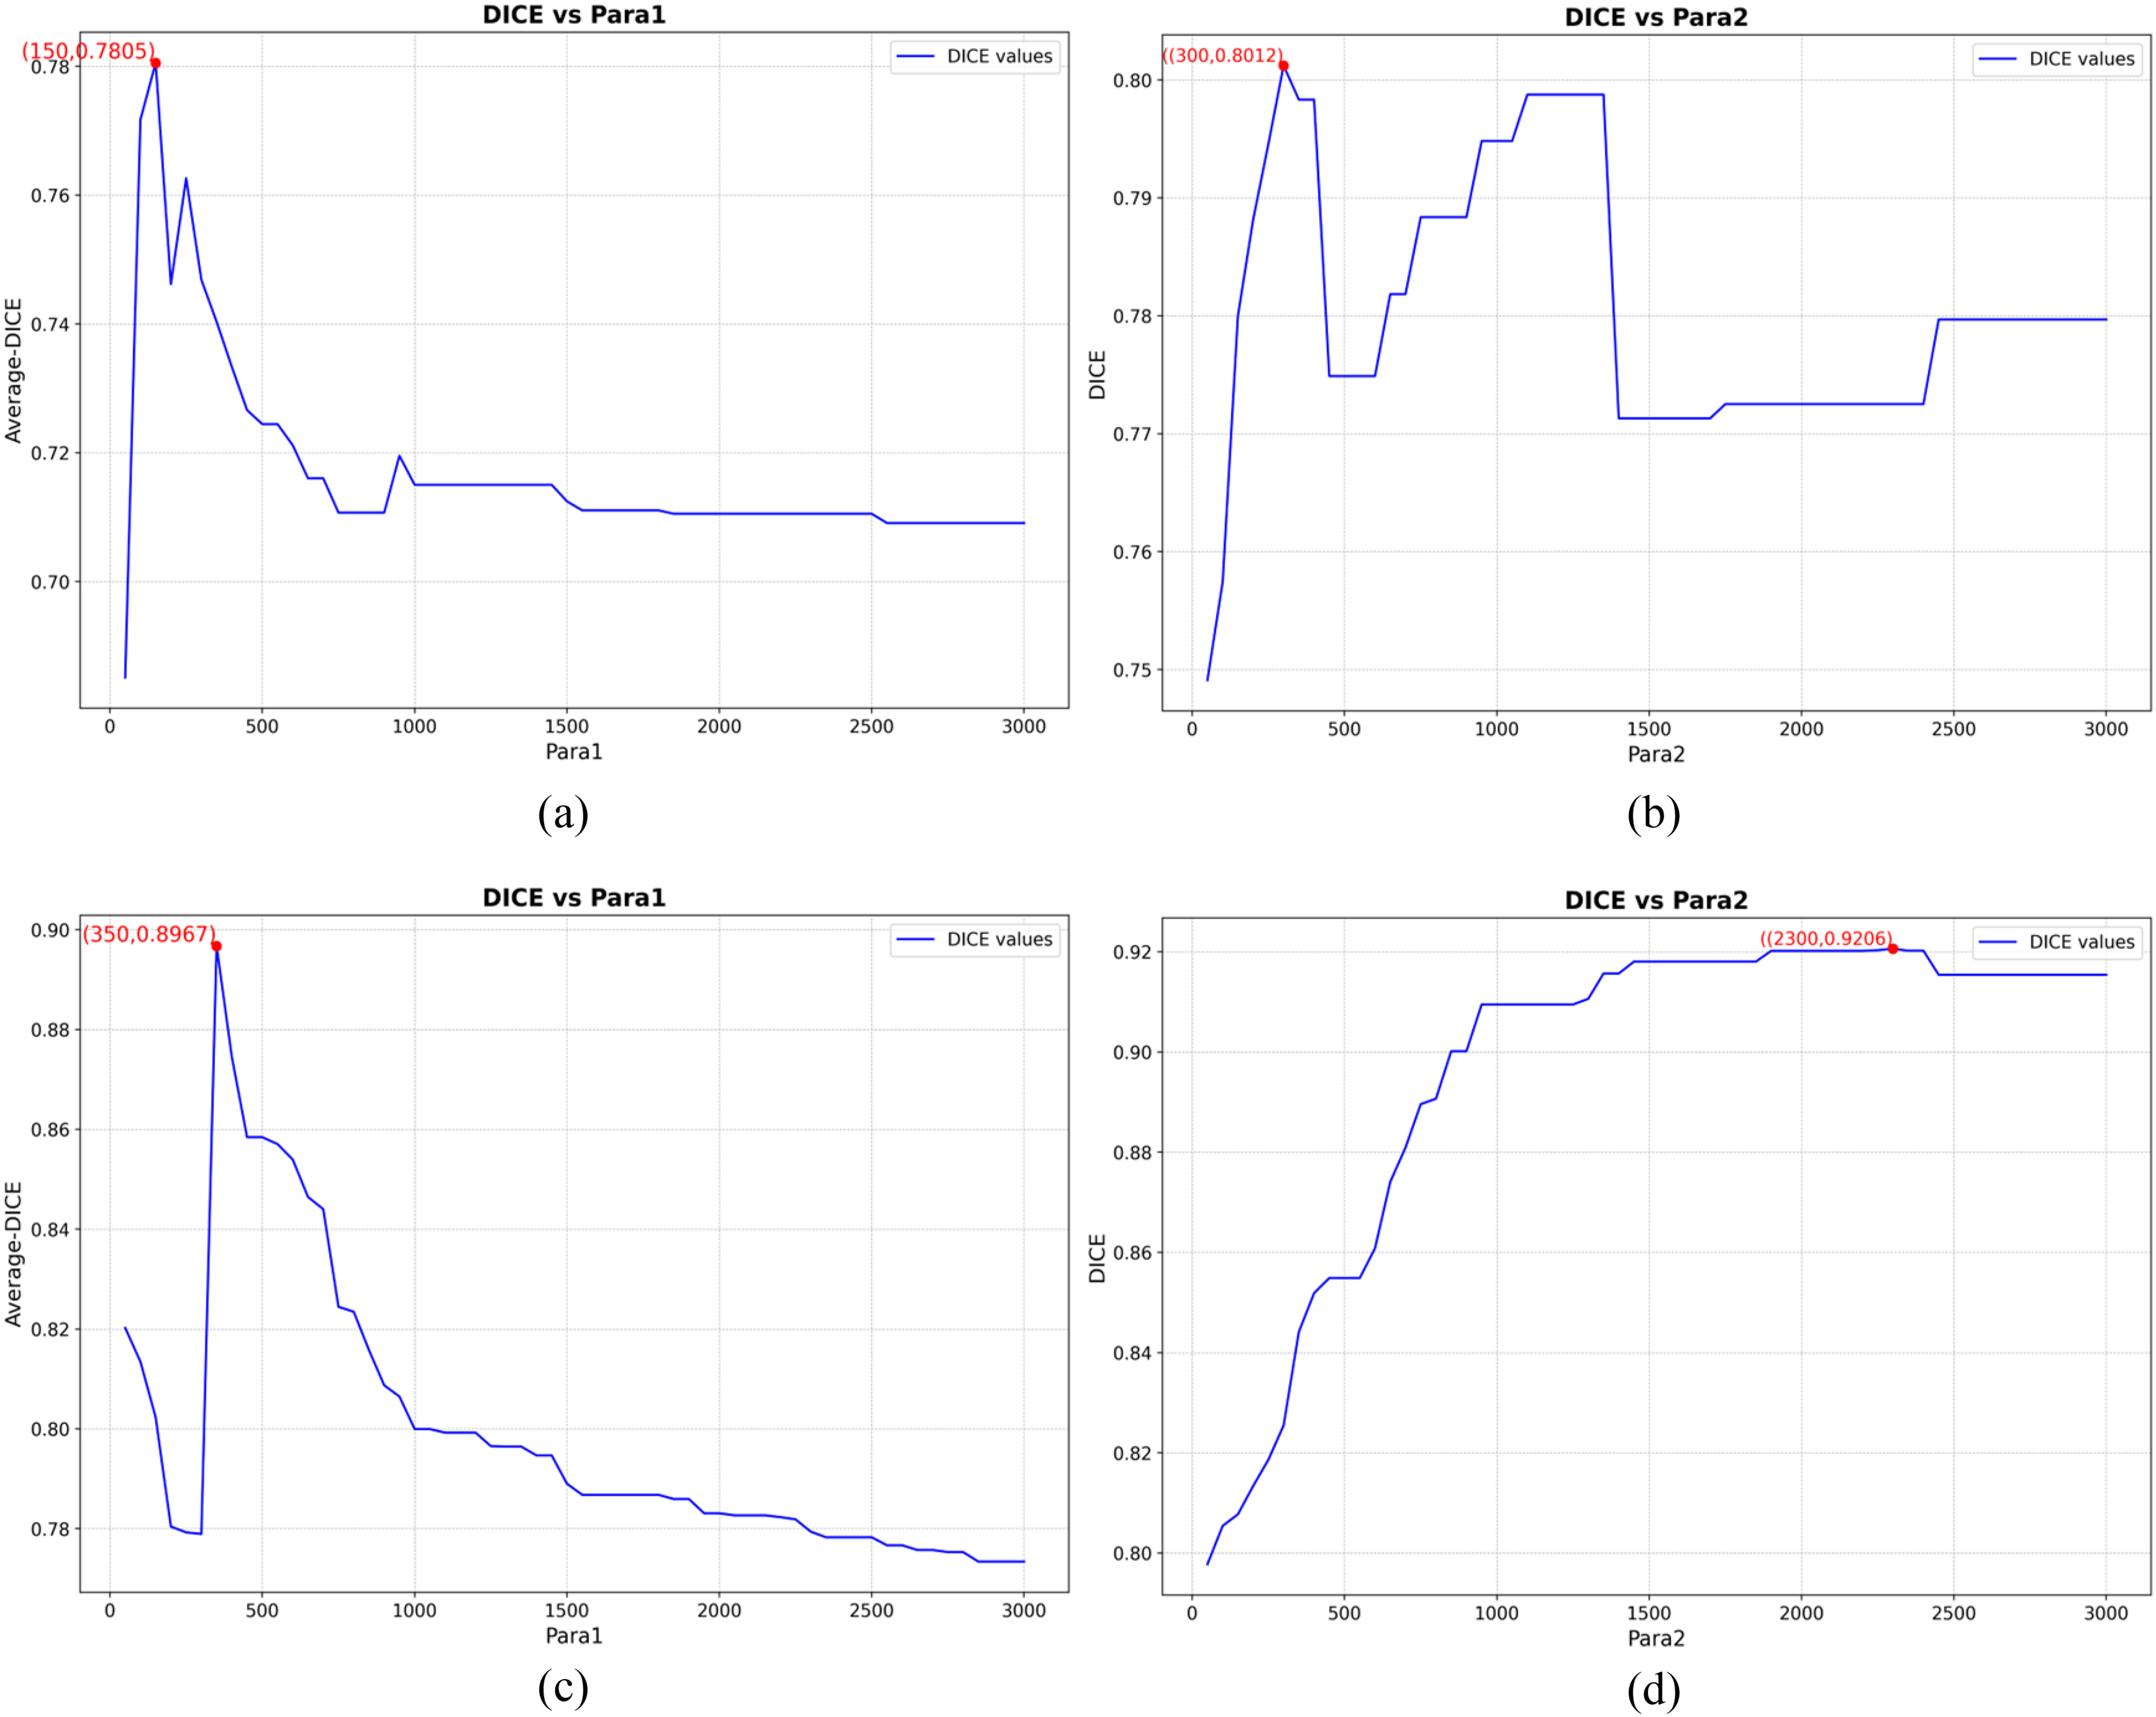
The line charts depicting the experimental results of parameter selection in the model fusion mechanism (Figures 5(a) and (c)) illustrate the selection process for para1. In 3600 sets of experiments, data with the same para1 value were grouped together (resulting in 60 groups, each containing 60 different para2 values). The average DICE score of each group was plotted on the y-axis against the para1 values on the x-axis to determine the optimal para1 value. Figures 5(b) and (d) illustrate the selection process for para2, where, with the optimal para1 confirmed, different para2 values (60 in total) were plotted on the x-axis, and the corresponding DICE scores were plotted on the y-axis to determine the optimal para2 value. Figures 5(a) and (b) present the results from the LUNA16 dataset, while Figures 5(c) and (d) present the results from the dataset obtained from the Shanghai Chest Hospital. The parameters are defined as follows: Parameter 1 represents the difference in the number of target pixels output by the two models, and Parameter 2 represents the maximum number of target pixels output by the two models.
Segmentation result display
As shown in Figure 6, GT represents mean mask labeled by several physicians. As shown in Figures 6(a) and 6(b), the GT in the LUNA16 dataset tend to be slightly larger than the actual targets, which could be one of the reasons for the suboptimal performance of the models. Comparing GT with segmentation results of different segmentation models can more intuitively reflect advantages of each module proposed in this study. In Figure 6 (d), none of the compared open-source models cut out spiny features of lung nodules. In contrast, segmentation results of the proposed method preserve spiny features to a great extent. This preservation reflects effectiveness of the multi-size attention learning module in enhancing saliency of lesion features. In Figure 6(c), it is evident that SAM has an advantage to recognize different kinds of objects (In this study, this refers to an ability to recognize lesions with pulmonary atelectasis or organs). Other models cannot accurately detach lesions from organs. However, the proposed method resembles GT the most closely, demonstrating the proposed method outperforms other models, both in the case of freestanding lesions and lesions adherent to organs.
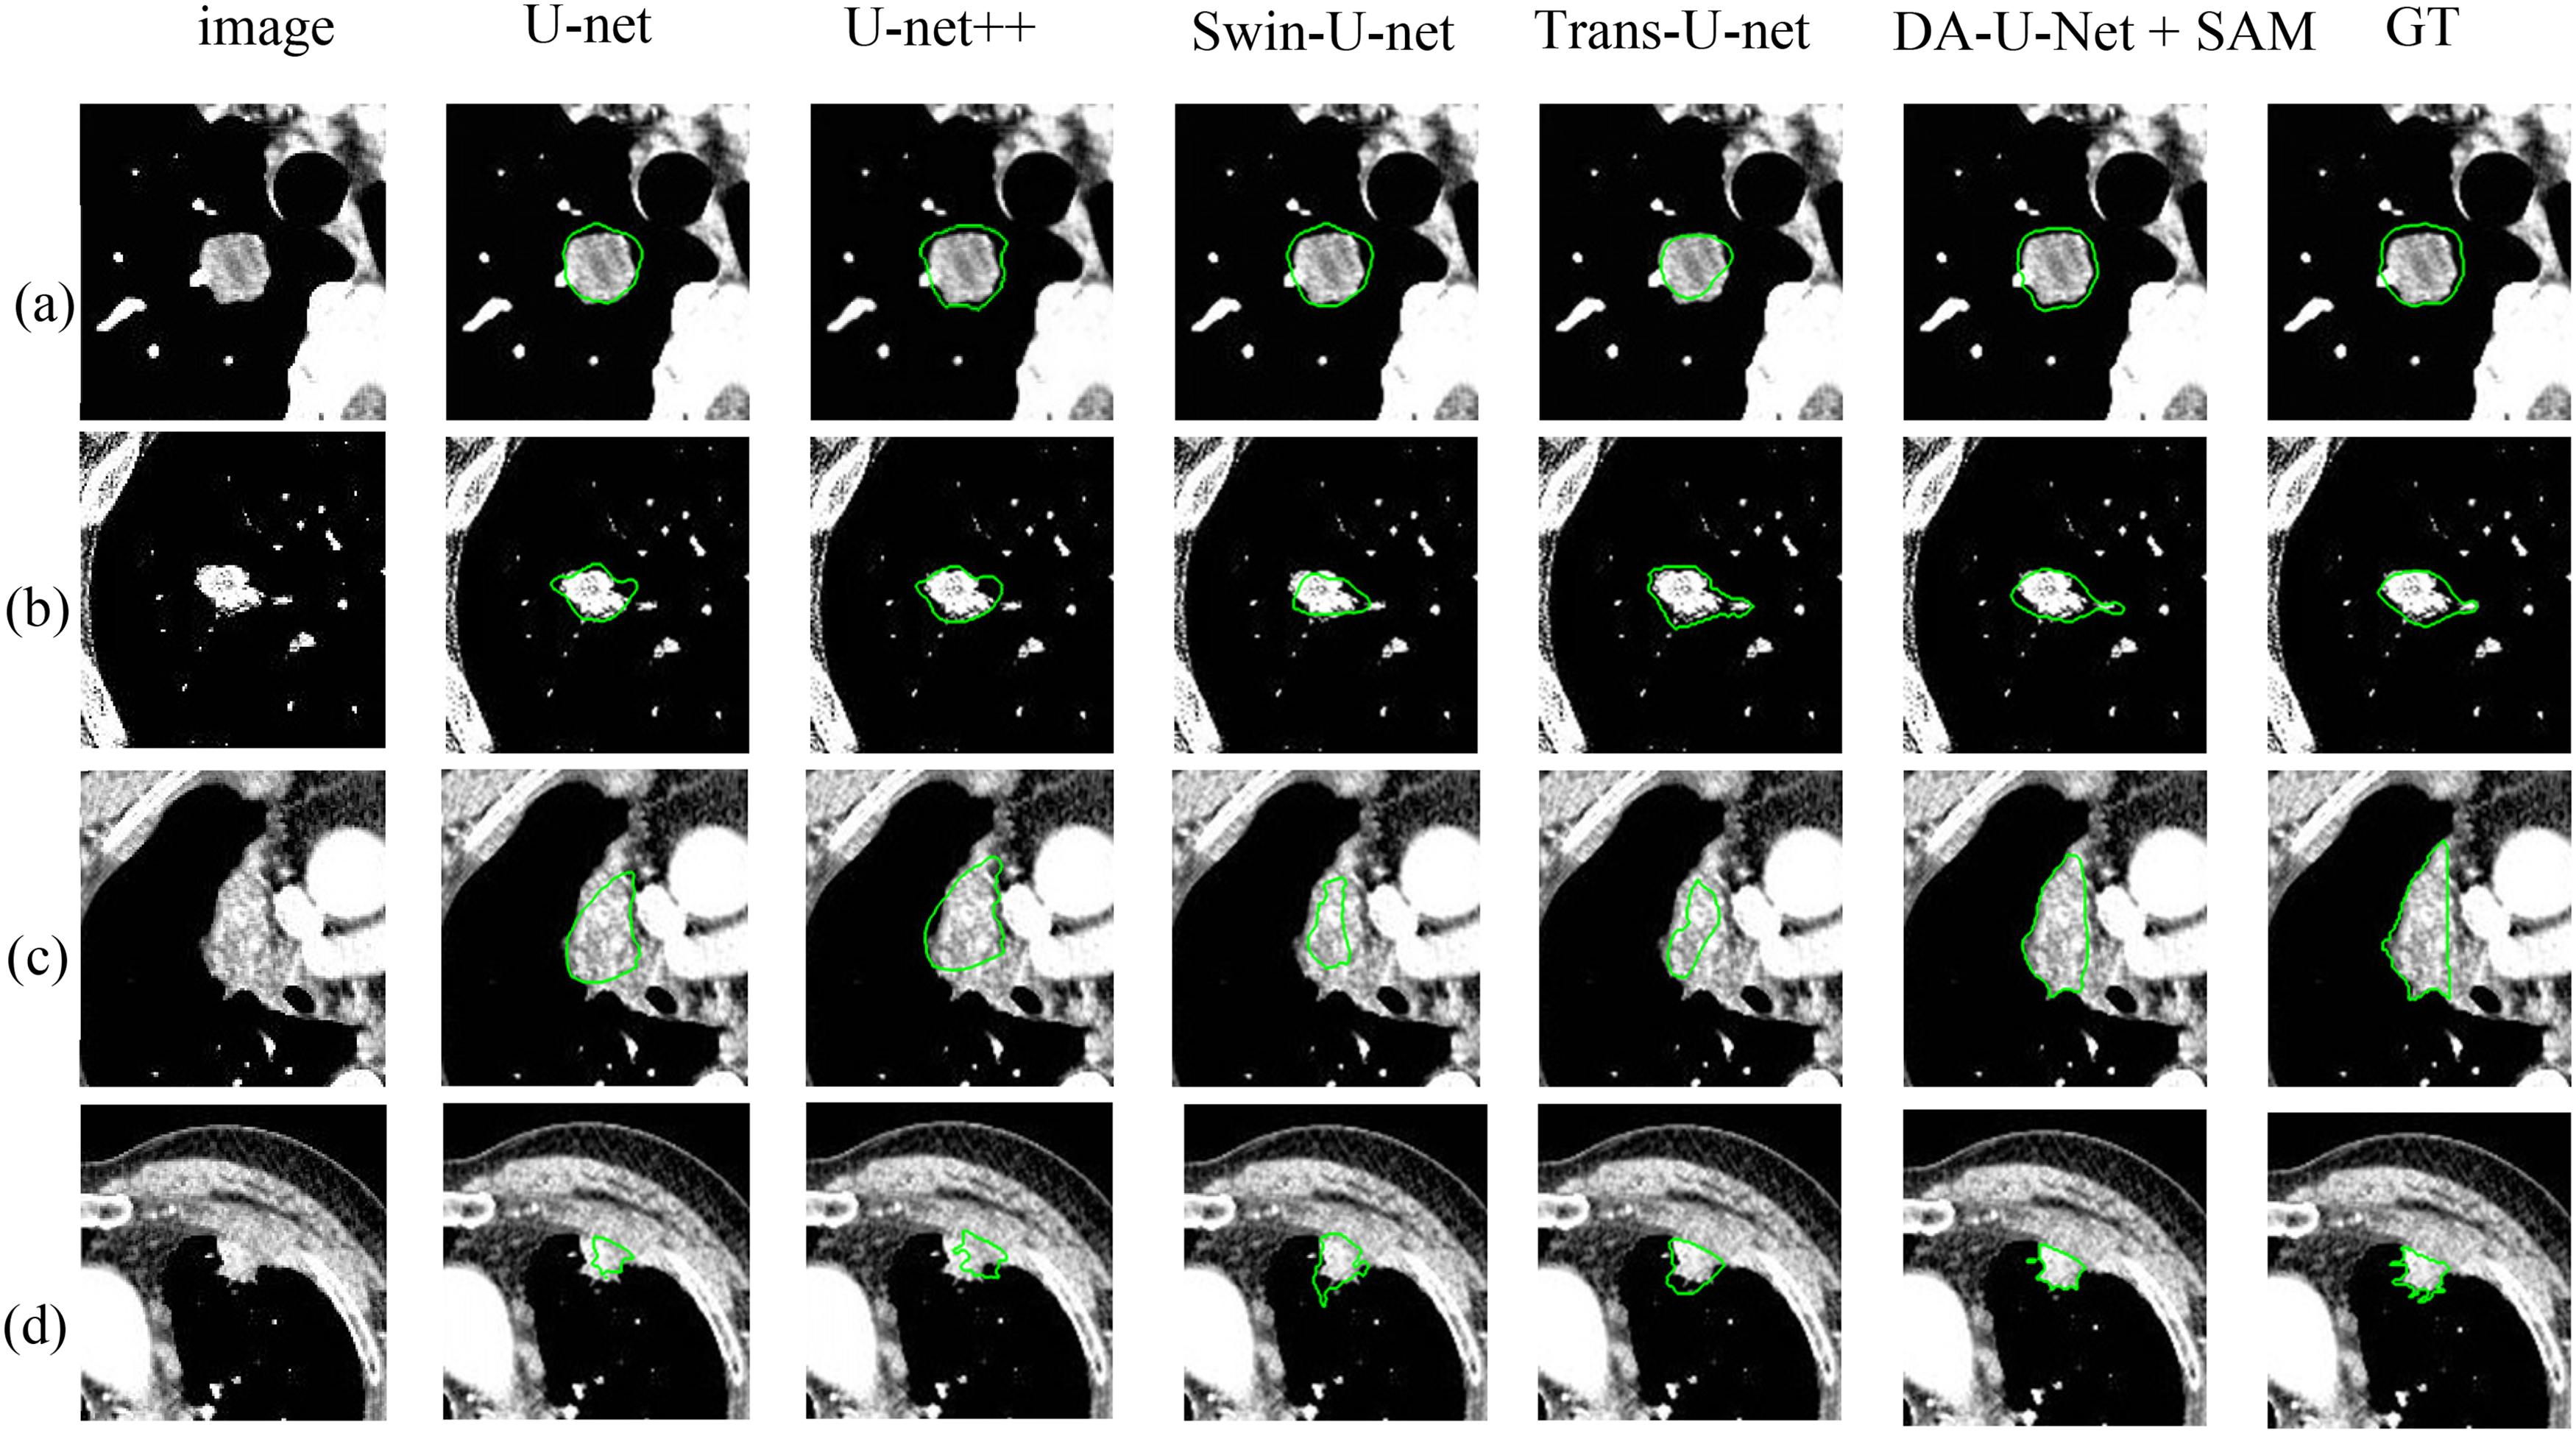
Examples of segmentation results by different models. (a)、(b) Segmentation results on the LUNA16 dataset and (c)、(d) segmentation results on the dataset provided by Shanghai Chest Hospital.
Computational complexity
We calculated the parameters (Param) and the floating point operations per second (FLOPs) for each model using an input tensor of size (1, 3, 128, 128). As shown in Table 3, due to the SAM model being trained on a dataset of 11 million images, its parameters and FLOPs are relatively high. If computational resources are limited, we recommend using the DA-U-Net model. It achieves the optimal segmentation performance with a limited number of parameters (Param) and FLOPs.
The computational complexity of various models (the values of Param (in millions(M)) indicate the number of tunable parameters in each model. These parameters are adjusted during training to reduce prediction error. Larger corresponding numbers generally indicate higher computational demands. And FLOPs(in giga(G) represent Floating Point Operations27,28).

Discussing
Figure 4 illustrates that when using automatic segmentation without adding the promptable cropping Module, the 5 metrics in Dual Attention U-Net show improvement compared to the other models. One possible reason for this phenomenon is that the multi-Size Self-Attention Module combines two types of attentional mechanisms: the multi-Headed Self-Attention Mechanism and ECA. This combination enhances the model's ability to capture global information, while ECA improves its ability to capture idiosyncratic multichannel information. Additionally, the multi-head self-attention mechanism enhances the model's ability to learn different attention directions, capturing both overall and detailed idiosyncrasies of ROI. Table 2 confirms, by ablating the two Modules, that both Modules improve model performance as all metrics show improvement. One possible reason for this phenomenon is that the promptable clipping Module can remove background in images unrelated to targets. This reduces amount of information the model needs to process, allowing it to focus more on target regions. This helps improve the model's accuracy in recognizing and localizing targets.
The fusion model of SAM and Dual Attention U-Net has the best segmentation performance in all 5 metrics and improves Dice segmentation performance by 2.67%, 2.19%, 13.88%, and 10.62% over performance of Dual Attention U-Net without fusion modeling mechanism. One possible reason for this phenomenon is that SAM was trained on a large amounts of datasets so that it has a higher ability to recognize different kinds of objects (in this study, we specifically refer to an ability to recognize lesions with lung atelectasis or organs). So we fused the Dual Attention U-Net model with SAM through the proposed model fusion mechanism to compensate for shortcomings of DA-UNET's poor segmentation accuracy on class of data where lesions are associated with pulmonary atelectasis or organs. Tables 1 and 2 and Experiments 3,4 in Figure 4 show that segmentation performance of existing models performs poorly when training and test sets are two different datasets, respectively, suggesting that the model generalization ability still needs to be strengthened.
Based on all the experimental data in this study (including data from Table 1, Table 2, and Figure 4), it can be concluded that, under identical conditions, the segmentation results for Dataset 1 consistently outperformed those for Dataset 2. The reason for this disparity may be attributable to the significant differences in the characteristics of the two datasets. Dataset 1 consists entirely of late-stage (Stage III-IV) lung cancer patients, where the lesions are generally larger (the ratio of positive samples (lesions) to negative samples (pixels other than lesions) is more balanced compared to smaller lesions, making it more conducive for model learning and convergence). Additionally, the mask annotations of the lesions in Dataset 1 are of higher quality. In contrast, most of the lung lesions in the public LUNA16 dataset are smaller (predominantly lung nodules), and the mask quality of these lesions is not high (the edge details of lesions are not clearly annotated).
We conducted Experiments 3 and 4 with the aim of verifying the generalization capability of our proposed segmentation model. Compared to other models in the experiment, our model also has some advantages in Experiments 3 and 4, but the segmentation results are not yet outstanding. Enhancing the model's generalization ability will be a key focus of our future research.
In our study, there is still room for improvement of the method. This aspect is analyzed from perspective of training data. The LUAN16 dataset and a set of lung CT dataset models provided by Shanghai Chest Hospital were selected as training dataset for experiments. Although size of the training data is larger, input images remain single (CT images) Currently, multimodal segmentation methods become more and more popular in field of medical segmentation, because it contains more lesion information and can achieve better segmentation performance. In future research, we plan to apply the nested U structure to multimodal approach. From the analysis of network structure design, segmentation methods based on deeper Transformer technology have received much attention. A deeper attention mechanism makes it easier for networks to focus on details of segmentation target. However, it needs to be widely tried and explored.
Conclusion
To address the issues of blurred boundaries and difficult feature extraction in segmentation of lung CT images of lesions, we propose a multi-size self-attentive learning Module, which combines feature maps of each shape more finely to enhance feature saliency and improves segmentation efficiency and a promptable clipping Module, which increases weight of effective feature channels in feature map to improve saliency of local feature information. Moreover, we propose a model fusion mechanism by combining characteristics of SAM, which has better segmentation accuracy when dealing with CT data with organ or pulmonary atelectasis. The method's DICE on the LUAN16 dataset and a set of lung CT datasets provided by Shanghai Chest Hospital reaches 80.12% and 87.43%, outperforming most existing mainstream segmentation networks. This method is of high value for developing a machine learning-based model for scientific prediction of efficacy of immunotherapy (PD-1/PD-L1) in lung cancer as well as its grading. Its future extension can help doctors adjust a treatment plan of lung cancer patients in a timely manner in clinic. It can also provide individualized treatment recommendations for each patient and offer guiding value for selection of clinical treatments.
Footnotes
Funding
The author(s) disclosed receipt of the following financial support for the research, authorship, and/or publication of this article: This research was supported by the National Natural Science Foundation of China (82373226).
Declaration of conflicting interests
The author(s) declared no potential conflicts of interest with respect to the research, authorship, and/or publication of this article.