
Abstract
Accurate localization and counting of tiny electronic components in high-resolution X-ray images is a critical yet challenging task in nuclear science, radiation imaging, and industrial quality control. Traditional methods suffer from poor generalization in cluttered scenes, while deep learning approaches are limited by the lack of large-scale annotated datasets. This study aims to develop a semi-supervised detection framework that achieves high-precision component localization and counting in 3072
Introduction
Industrial electronics manufacturing often requires fast and accurate counting of small components for inventory management, assembly verification, and quality control. Ensuring each product has the correct number is essential to prevent assembly errors or inventory discrepancies. Traditionally, this task has been performed by human workers or simple automated counters. Still, manual counting is time-consuming and prone to errors, especially when dealing with thousands of tiny components daily. Classical machine vision algorithms have been applied to automate counting, often using techniques like thresholding, contour detection, and template matching to identify parts in images. Leelawattananon et al. 1 used differential Gaussian edge detection technology for counting, Kumar et al. 2 used a minimum distance classifier to track objects, Perera et al. 3 optimized the feature space and modeled it through Principal Component Analysis (PCA), and Wu et al. 4 improved counting accuracy through image denoising. However, these algorithmic approaches typically struggled with cluttered scenes, changing lighting or component orientation, and overlapping parts, leaving a need for a more robust and efficient counting solution.
Beyond generic object detectors, a parallel line of research architectures to X-ray non-destructive testing. Early systems adopted dual-energy thresholding
5
and morphological blob analysis
6
for component presence check, while recent CNNs exploit segmentation7,8 or oriented bounding-box regression9,10 for solder-joint and wire-bond inspection. Xie et al.
11
employed a convolutional neural network to perform macroscopic counting regression on synchrotron Kirkpatrick–Baez mirrors, which highlights the growing trend of using CNNs for dense counting. To correct spectral peak drift and obtain reliable net counts, Yang et al.
12
introduced a data-driven CNN-LSTM model that tackles X-ray peak-count drift. CNNs have also been adopted for macroscopic counting, such as automatic
In recent years, advances in computer vision and machine learning have led to significant improvements in object detection performance, opening new possibilities for automated counting. Convolutional Neural Networks (CNNs)18,19 can learn rich feature representations and have revolutionized visual recognition tasks, outperforming earlier hand-crafted feature methods. de Arruda et al. 20 combined CNN with feature map enhancement. Onoro-Rubio et al. 21 designed CNN for instance counting, Kilic et al. 22 proposed a heatmap learner CNN, Gao et al. 23 combined Adaboost and CNN for crowd counting. Two-stage detectors like Faster R-CNN24,25 first generate region proposals and then classify them, achieving strong accuracy at the cost of speed.
In contrast, single-stage detectors such as Single Shot MultiBox Detector (SSD) and You Only Look Once (YOLO) directly predict object bounding boxes and classes in one pass, enabling real-time detection. SSD 26 enhanced the detection ability of small objects by detecting on feature maps of different scales. EfficientDet 27 optimized model performance at multiple scales through the compound scaling method. YOLOv1 28 achieved end-to-end object detection through a single network structure, while YOLOv2 29 further improved performance by introducing batch normalization and high-resolution classifiers. YOLOv3 30 introduced multi-scale prediction and a deeper network structure. YOLOv4 31 achieved the optimal balance between speed and accuracy by integrating multiple technical improvements such as weight decay and CIOU loss. YOLOv5 32 was completely based on the PyTorch framework and introduced auto anchor and multi-scale pre-trained models. YOLOv6 33 was developed by the Meituan technical team and emphasizes high performance in industrial applications. YOLOv7, YOLOv8, YOLOv9, and YOLOv1034–37 continued to innovate in feature fusion, model architecture, and detection speed, demonstrating unparalleled performance in terms of speed and accuracy.
The task of counting objects in images has significant applications in various fields, including agriculture, industry, and public safety. In recent years, deep learning-based methods have achieved remarkable success in object detection and counting tasks, particularly in the domain of crowd counting. For example, Khan et al. 38 provided a comprehensive review of state-of-the-art methods in crowd counting, highlighting the effectiveness of convolutional neural networks (CNNs)39,40 and density map estimation techniques. 41 Similarly, Fan et al. 42 surveyed CNN-based approaches for crowd counting and density estimation, emphasizing the importance of multi-scale feature extraction and regression methods. These techniques have also been successfully applied to other counting tasks. For instance, Huang et al. 43 surveyed deep learning-based object detection methods in crop counting, demonstrating how CNNs can handle occlusion and scale variation in agricultural settings. Gao et al. 44 proposed a method called SwinCounter for multi-class object counting in remote sensing images, leveraging transformer-based architectures to address challenges in aerial imagery. Additionally, Wang et al. 45 introduced the NWPU-Crowd dataset, a large-scale benchmark for crowd counting and localization, which has further advanced research in this area. Despite these advancements, industrial applications such as electronic component counting remain challenging due to densely packed and overlapping objects. This paper explores the adaptation of deep learning-based methods from crowd counting to electronic component counting. By integrating techniques such as density map estimation, multi-scale feature extraction, and transformer architectures, we aim to address the unique demands of industrial component counting. The work builds on methodologies developed for crowd counting 46 and applies them to solve analogous problems in electronic component detection and counting, as highlighted by researchers like Holla et al. 47 and Wang et al. 48
Recently, transformer-based object detection models like DETR 49 introduced an alternative architecture, using an encoder–decoder transformer to predict objects without traditional anchor boxes or post-processing. DETR and subsequent transformer models such as Deformable DETR, 50 Dynamic DETR 51 offer a new way to capture global context and relationships between objects, which could be beneficial for counting many similar items. Zhang et al. 52 proposed that a CNN based on an encoder-decoder is also used to generate high-quality density maps to accurately count X-ray images. These deep learning approaches represent a major improvement over earlier algorithmic methods.
Despite these advances, directly applying general-purpose detectors to industrial component counting still presents challenges. Electronic components on production lines or PCBs are often tiny, closely spaced, and visually similar, 53 and thus general object detection models not specifically trained on such data can miss small, densely packed items or confuse one type for another, resulting in inaccurate counts. Moreover, many existing deep models require large annotated datasets for training, but public datasets for component detection or counting are limited in the electronic manufacturing domain. To mitigate annotation cost, weakly-supervised counting54–56 and semi-supervised detection57–60 have been explored in natural scenes. In the X-ray domain, unsupervised domain adaptation 61 alleviates cross-machine drift but rarely addresses label scarcity for counting tasks. Recent studies begin to fill this gap: Andriiashen et al. 62 bridge simulation-to-reality gaps with scattering-calibrated synthetic data, and Jia et al. 63 adopt adversarial domain adaptation to segment PCB layers across dose regimes without extra target annotations.
To meet these challenges, this work bridges this gap by introducing a dedicated dataset and a specialized detection model for electronic component counting. We present the LEEC dataset, a new collection of annotated images specifically designed for learning to detect and count electronic components in industrial scenarios. The LEEC dataset contains a wide variety of components (e.g., different types of chips, capacitors, resistors, and connectors) captured under diverse conditions, including varying backgrounds, lighting, and degrees of occlusion. To mitigate the high cost of manual labeling, a semi-supervised approach was implemented, leveraging a feature similarity graph and GAT to propagate labels. This method requires only one fully labeled image per category to generate reliable pseudo-labels, significantly reducing annotation effort while expanding the training dataset.
Using insights gained from the dataset, we also develop YOLO-DEP, a deep neural network tailored for accurate, real-time counting of electronic components. YOLO-DEP builds upon the YOLOv11 64 framework and introduces domain-specific enhancements to improve the detection of small, closely packed objects. Through these modifications, YOLO-DEP achieves higher precision in identifying each component. We evaluate our proposed approach on the LEEC dataset and compare it against several state-of-the-art detectors. Experimental results show that YOLO-DEP significantly outperforms standard YOLO models and other baseline methods in counting accuracy and detection precision, while operating at speeds suitable for real-time deployment on assembly lines. In summary, our contributions in this paper include:
Methodology
YOLO-DEP framework
Figure 1 shows the detailed structure of YOLO-DEP, which is an improvement on the mature YOLOv11 framework. X-ray images are different from optical images, which can penetrate the surface of an object to show its internal features. As an accurate counting model tailored for X-ray images, YOLO-DEP is fundamentally based on the introduced DEP module, which replaces the conventional self-attention mechanism in YOLOv11, as illustrated in Figure 2.This module divides the input feature map into multiple slices (similar to the tomography slices in X-rays), each of which focuses on processing a part of the channel information, thereby improving the focus and efficiency of information processing.
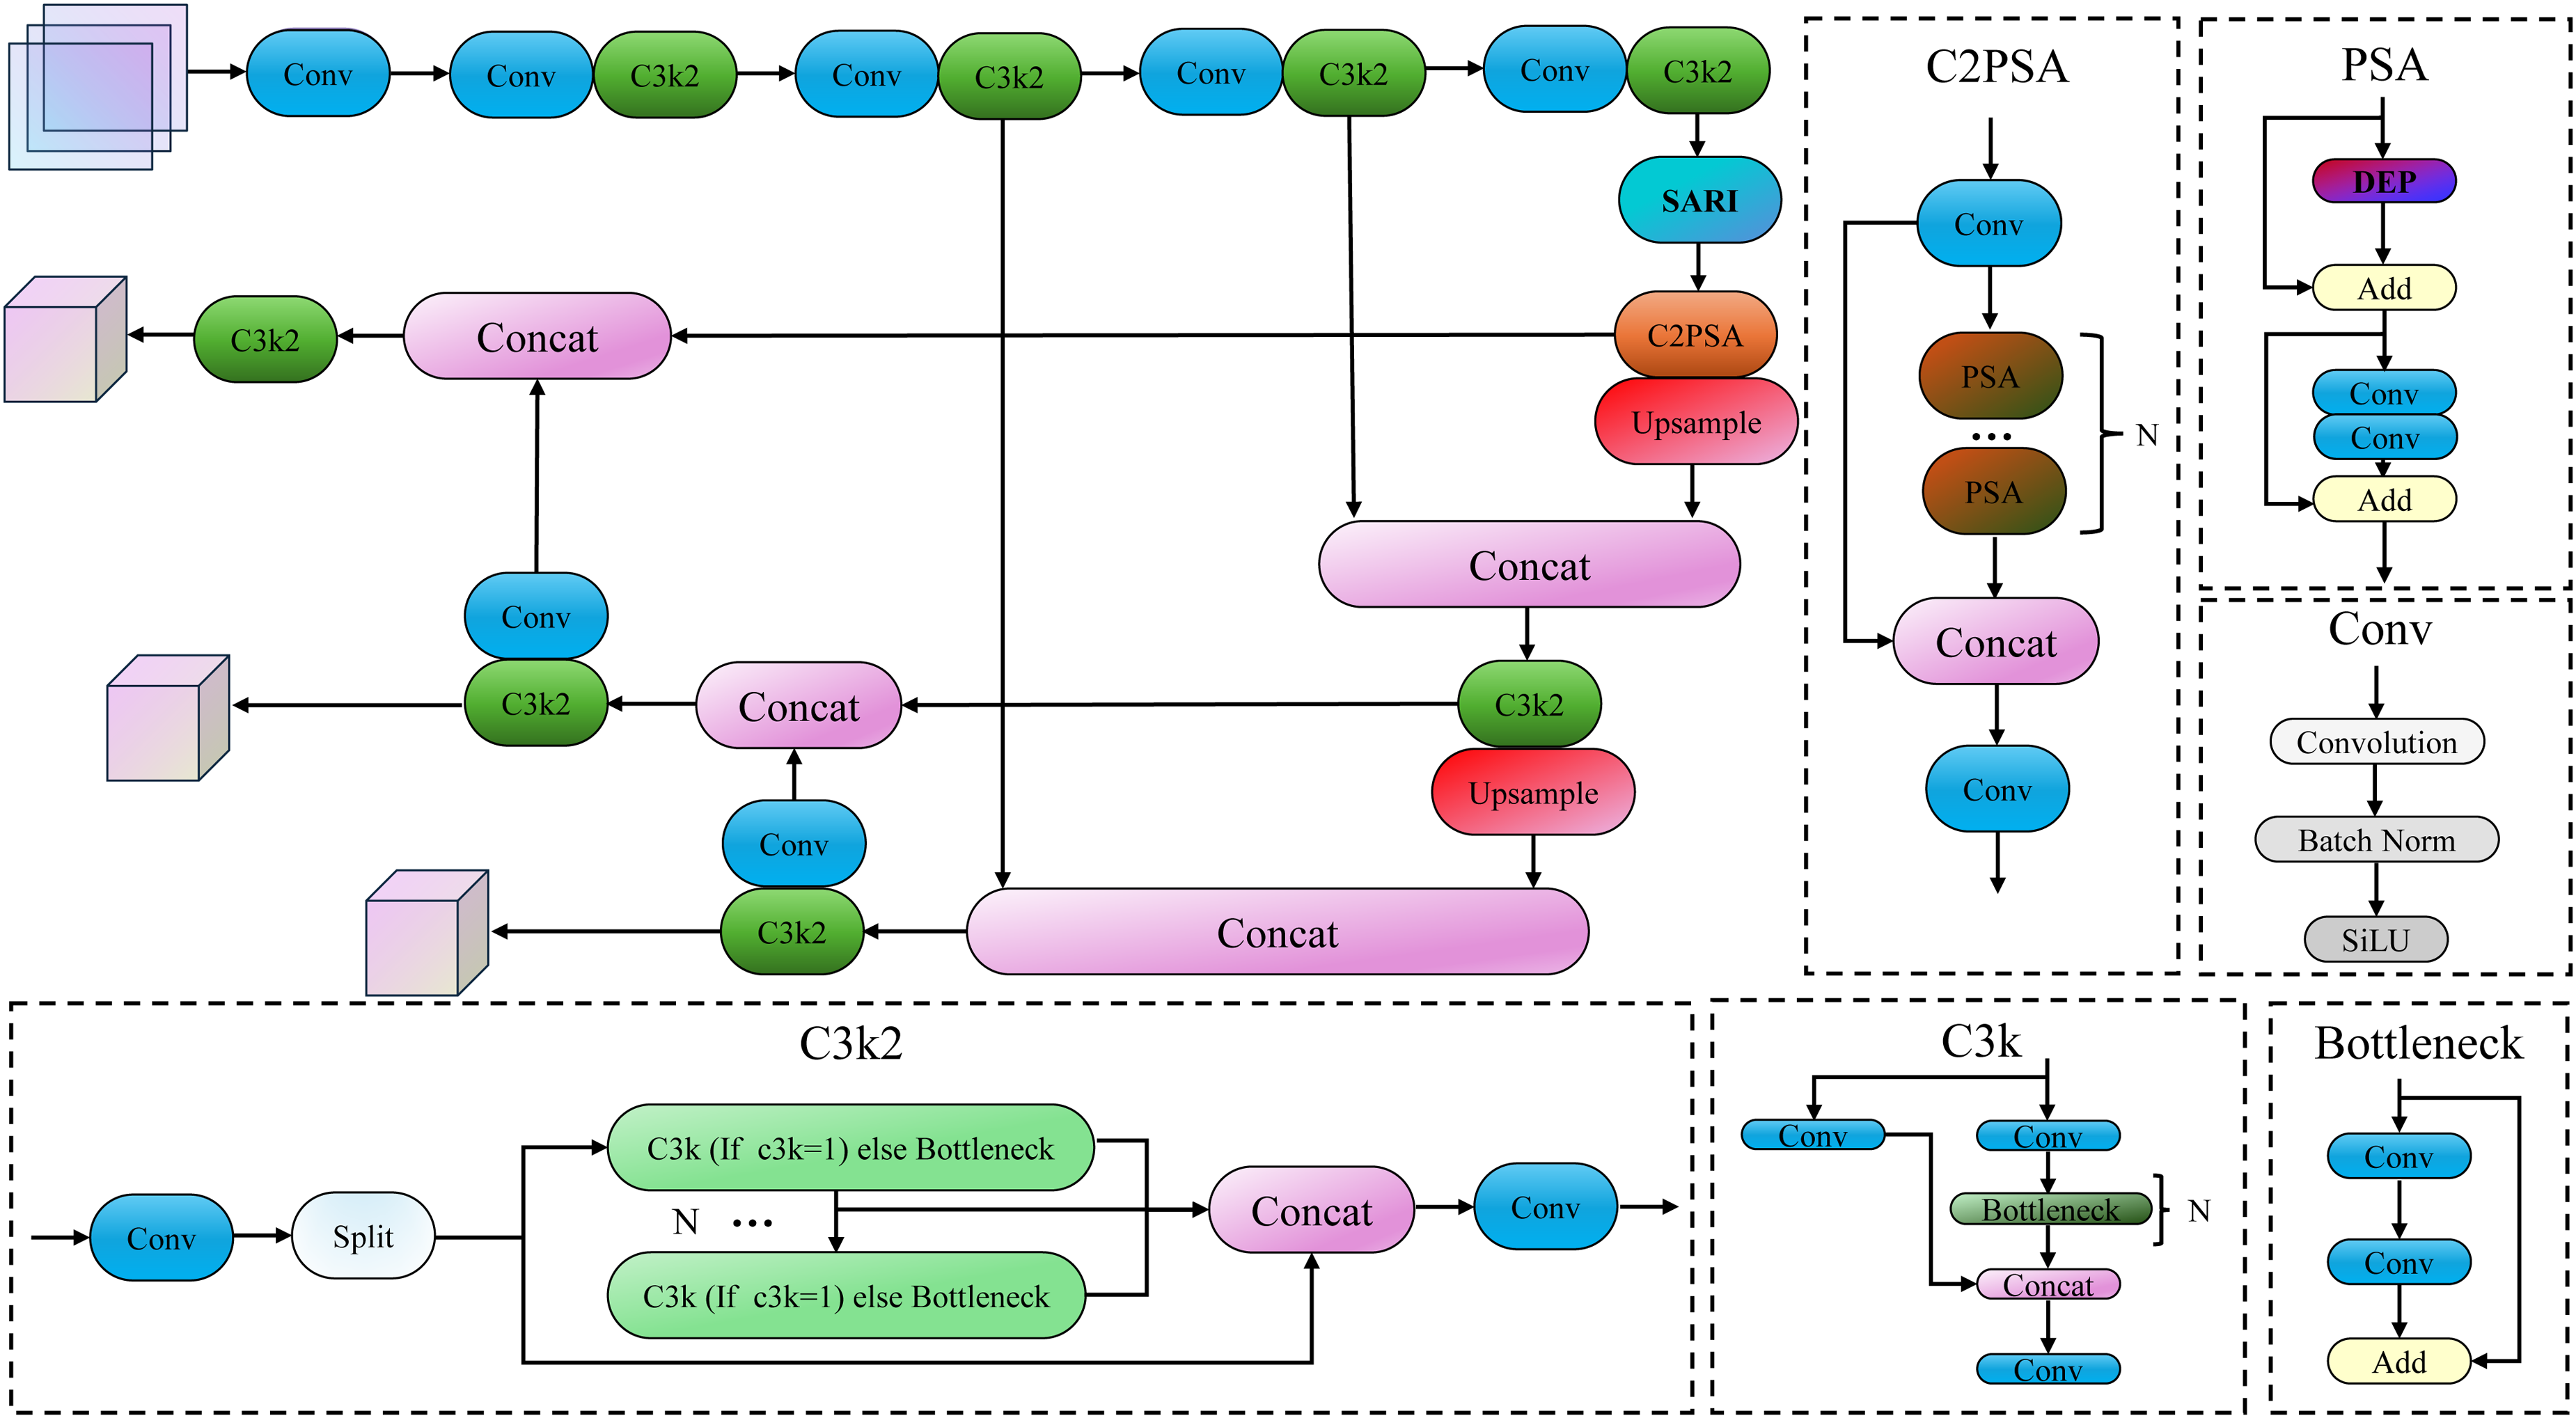
The overall structure of YOLO-DEP.
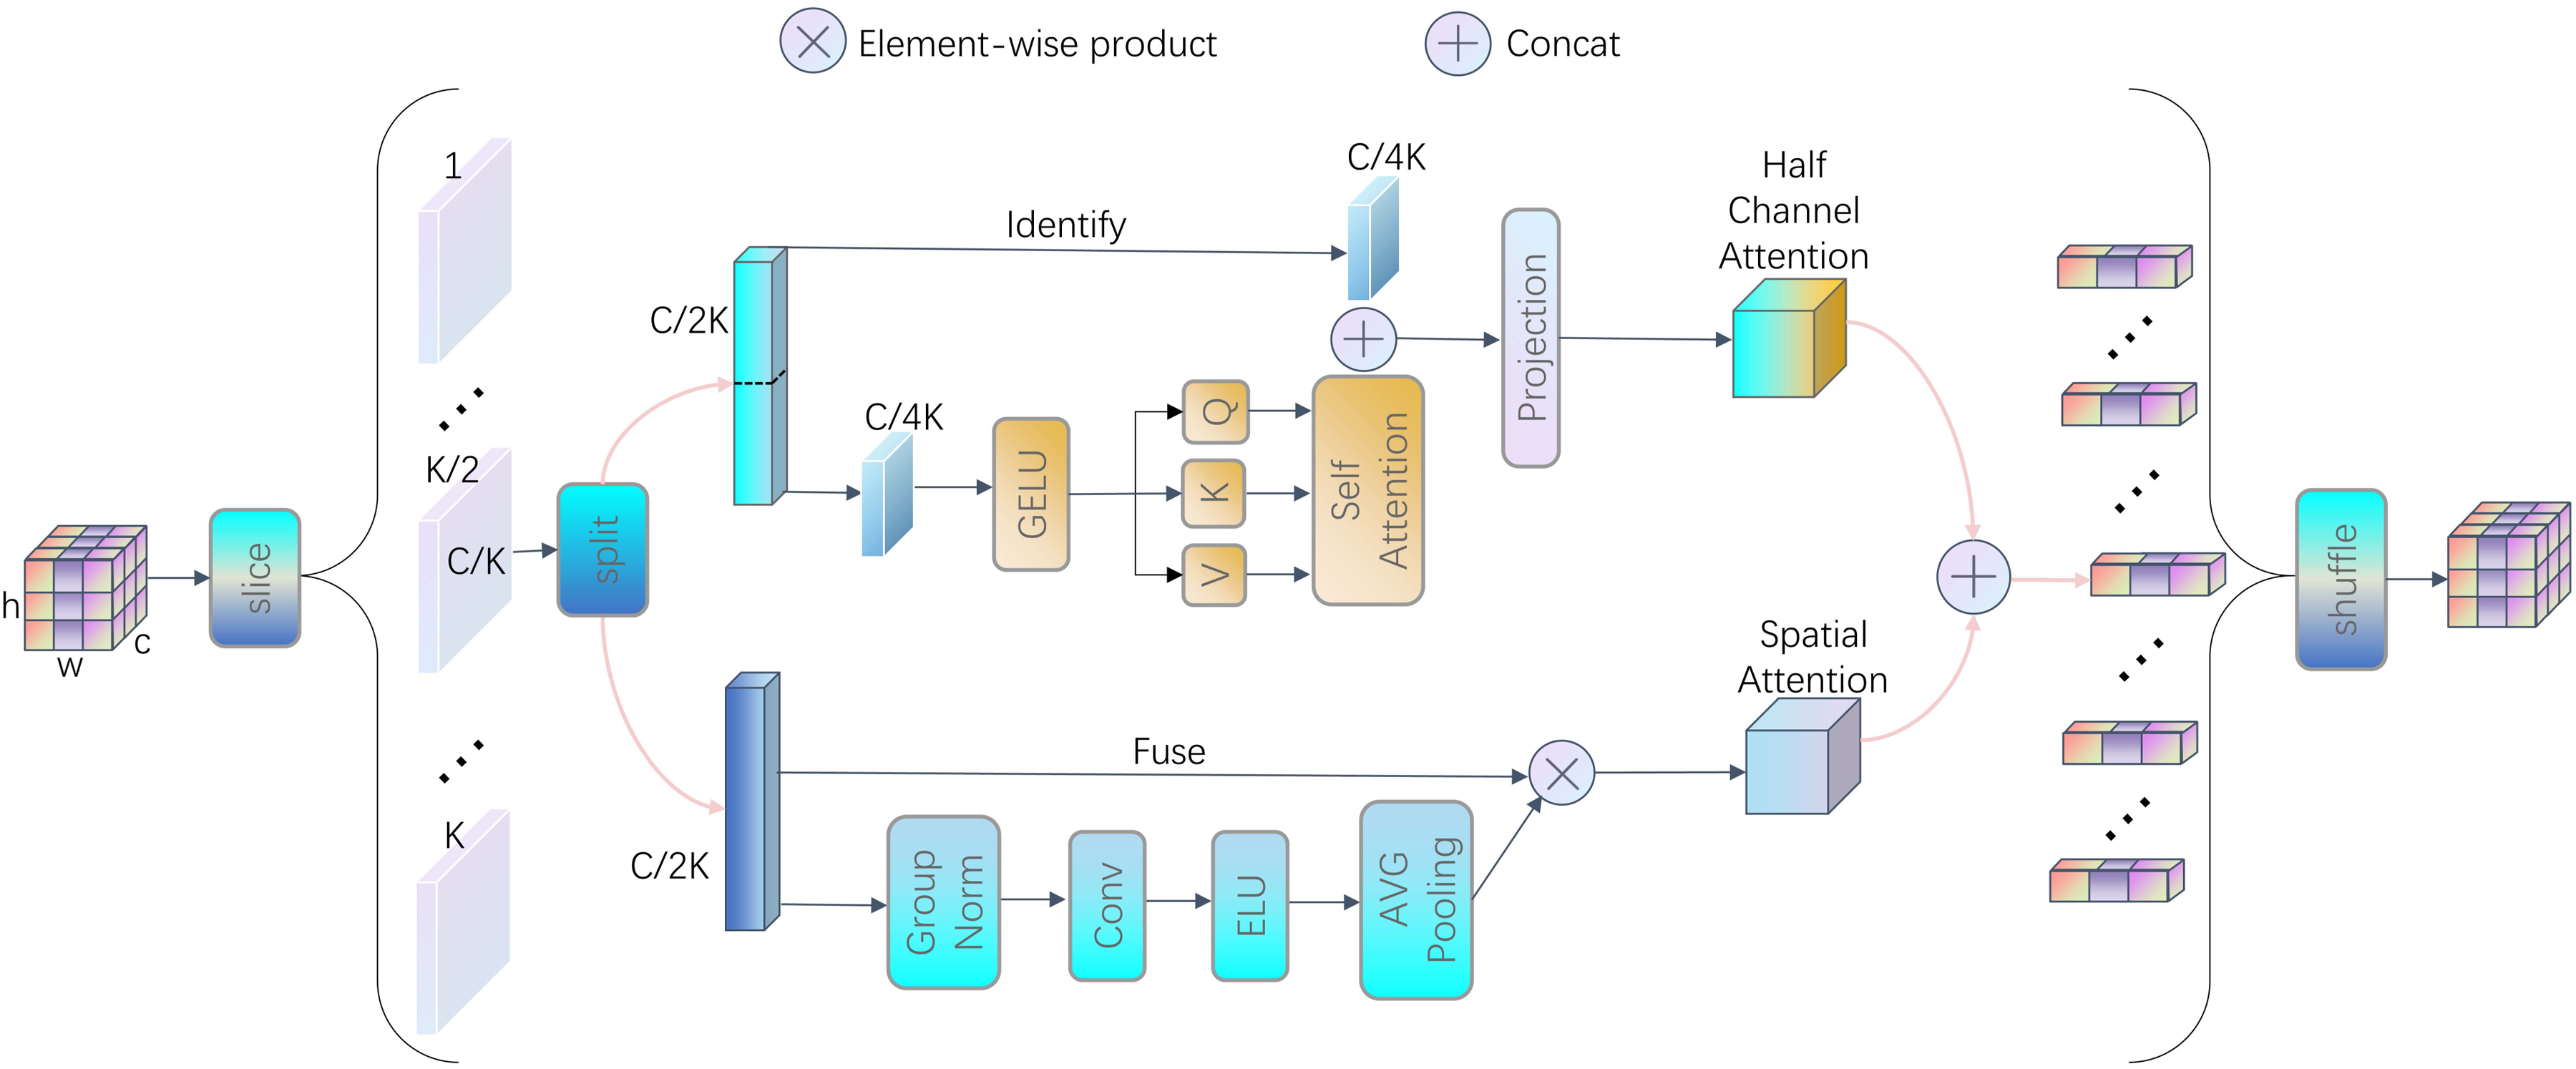
The structure of the deep encoding processor module (DEP).
The DEP module uses a half-channel attention mechanism (HCA), which only applies the attention layer to half of the input channels, while the other half of the channels remain unchanged. This design enables the attention mechanism to attend to both the object’s external contours and its internal structure in X-ray images. Consequently, it captures features and localizes targets more accurately. Attention is applied to only half of the channels, computational overhead is reduced, and the projection layer propagates the refined attention features uniformly across all channels, further improving feature representation. At the same time, the introduction of the spatial attention mechanism enables the DEP module to capture feature information closely related to the spatial position of the target, which is crucial for accurately locating the target. Based on the half-channel attention and spatial attention, the DEP module fuses the outputs of the two attention mechanisms through channel shuffle. This step not only improves the feature expression capability but also achieves uniform distribution of feature maps in the channel dimension by rearranging channels, significantly improving information utilization efficiency.
Furthermore, to further enhance global feature interaction, YOLO-DEP replaces the original SPPF module with the Structural Adaptive Relative Interaction (SARI) module. As illustrated in Figure 3, SARI is a spatially-aware and computationally efficient variant of AIFI, which employs spatial reduction and relative position bias to facilitate long-range dependency modeling in high-resolution feature maps. By integrating these key improvements, YOLO-DEP not only adheres to the core principles of the YOLOv11 framework, but also breaks through these principles and provides an advanced mechanism for high-precision detection and counting of objects in X-ray images. This technological advancement is particularly critical in application scenarios where the internal structure of an object is as important as its external form, allowing for more comprehensive and in-depth analysis in areas such as security inspections, medical diagnosis, and industrial quality control.
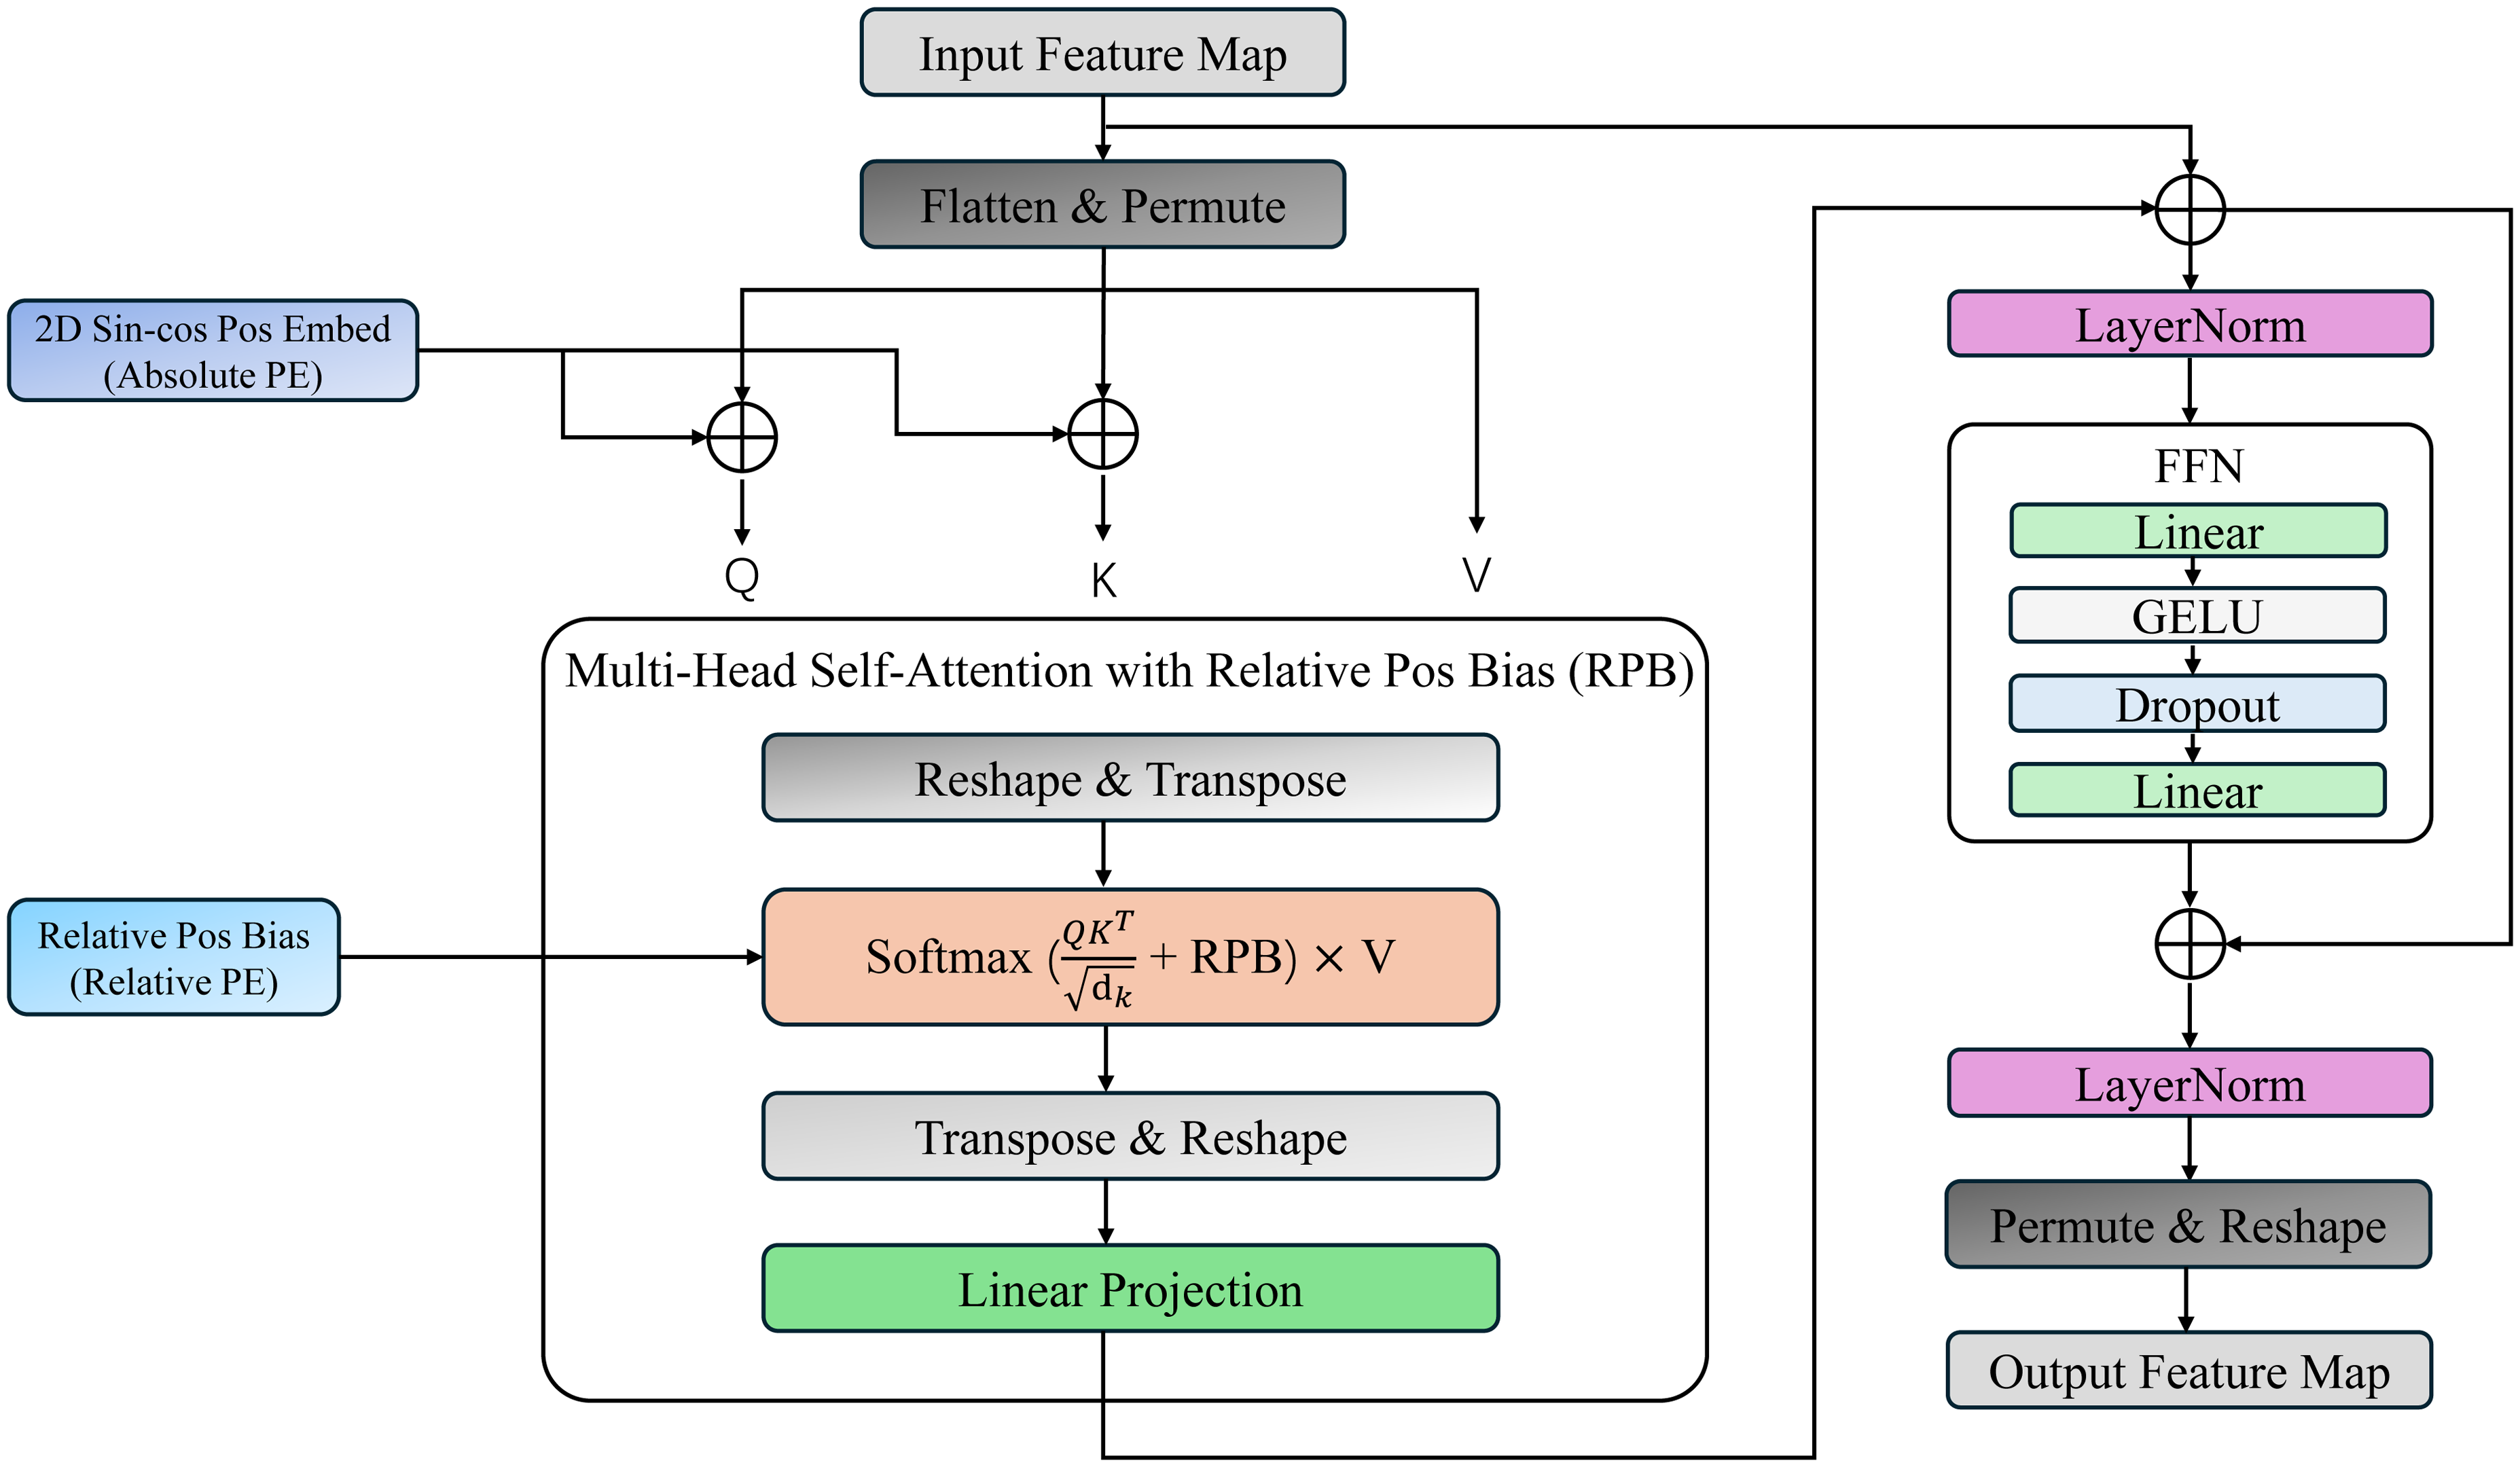
The structure of the Structural Adaptive Relative Interaction module (SARI).
Feature slice & split
Given a feature block
Allocate
Allocate
Half channel attention (HCA)
The half channel attention module offers an efficient approach to modeling channel-wise dependencies in neural networks. It begins by taking a feature slice of dimension
The HCA module’s final output is a feature map that retains the input’s dimensionality while enhancing channel-wise dependencies, providing a refined representation for deep learning architectures. This concise process makes the HCA module a lightweight and effective choice for attention mechanisms.
Spatial attention (SA)
The spatial attention module enhances feature maps by focusing on informative spatial regions. It starts with Group Normalization (GN) on the input feature map of dimensions
Feature concat & shuffle
The integration of half channel attention and spatial attention culminates in a concatenated feature map that amalgamates the nuanced insights gained from both channel and spatial perspectives. This unified feature map is then subjected to a channel shuffle operation, which intricately interlaces the channels, fostering an environment where cross-group information can flow freely. This not only enhances the feature map’s richness but also paves the way for a more nuanced and comprehensive representation, readily integrated into subsequent neural network layers.
Semi-supervised learning pipeline
The proposed training process adopts a three-stage progressive semi-supervised learning framework, shown in Figure 4, aiming to fully utilize a small amount of labeled data and a large amount of unlabeled data to improve model performance. Overview of the semi-supervised pipeline: labeled and unlabeled images are embedded by the pre-trained backbone; a dynamic graph + GAT produces pseudo-labels, which are filtered by confidence and then combined with the original labels to retrain the detector.
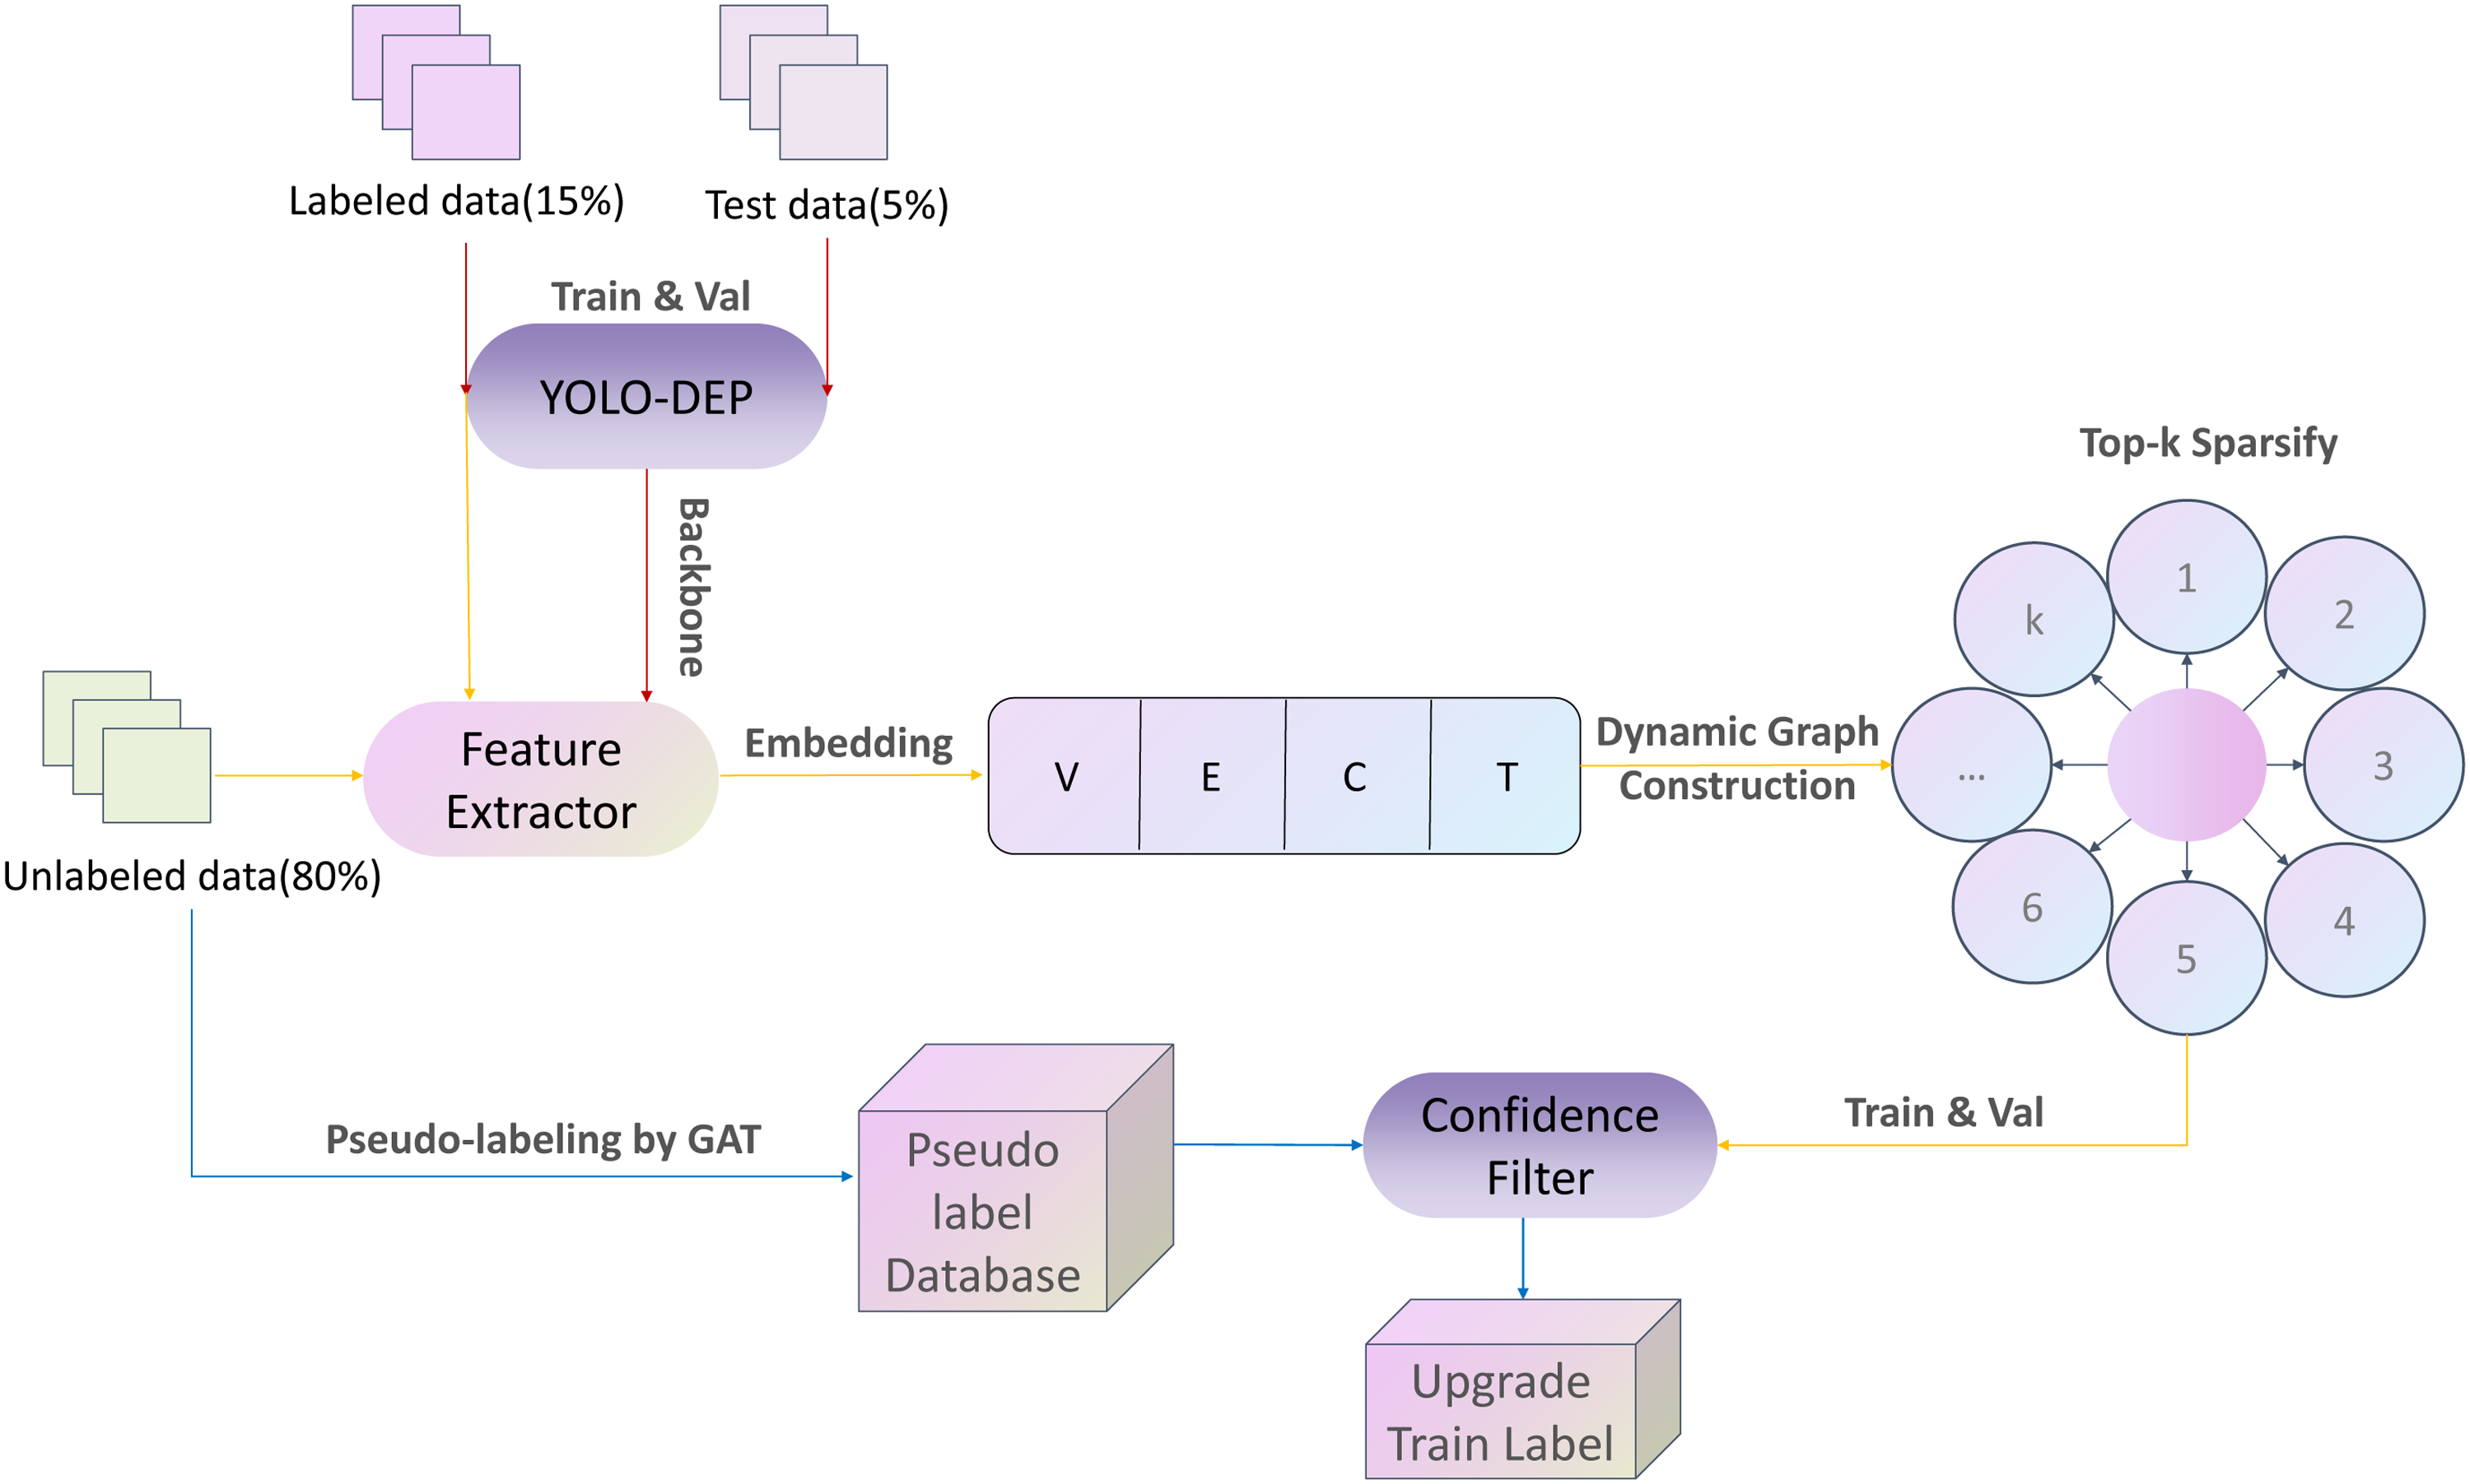
The overall framework of pseudo-label generation.
The specific workflow is as follows:
Initialization training with fully labeled data (red arrow section)
First, 15% of the fully labeled data is used to initialize the training of the YOLO-DEP model. The feature extractor, combined with the backbone network, extracts multi-scale visual features.
GAT confidence filter training with mixed data (yellow arrow section)
The embedding layer maps image features to a low-dimensional space. A dynamic graph construction module establishes sample relationships based on feature similarity, improving local semantic structure capture. A GAT is integrated for joint training. Specifically, pseudo-labels are generated for 80% of the unlabeled data and, together with the 15% labeled data, are fed into the GAT, which models global dependencies and adjusts pseudo-label weights using an attention mechanism.
A confidence filter selects high-quality pseudo-labels based on entropy thresholds and probability distribution consistency, reducing noise and improving reliability.
Iterative fine-tuning of YOLO-DEP (blue arrow section)
The pseudo-labels filtered by confidence are stored in a database, which are then fused with the original labeled data to form an upgraded training set. This strategy effectively balances data diversity and reliability, avoiding interference from redundant samples. The updated dataset is used for iterative fine-tuning of YOLO-DEP. This method, through the collaborative optimization of feature generation, graph structure modeling, and data filtering mechanisms, breaks through the performance bottleneck of models under limited labeled data, providing a new technical paradigm for weakly supervised object detection.
Loss functions within training GAT
Supervised classification loss
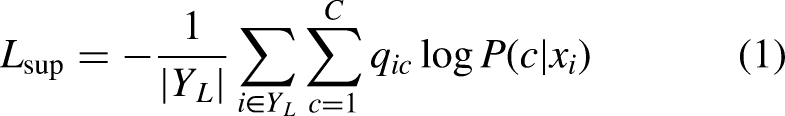
Confidence-aware pseudo-label loss
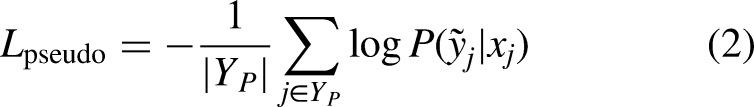
Structural consistency loss
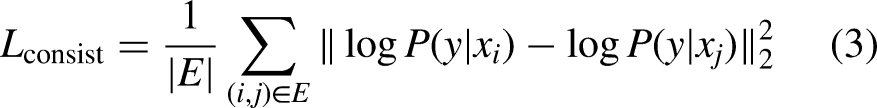
Total loss function

Dataset and preprocessing methods
The LEEC dataset was crafted to fill the gap in resources for industrial counting tasks, a domain where specialized dataset resources are notably scarce. It comprises 720 high-resolution images, each with a resolution of 3072
The LEEC contains images of various electronic components, ranging from standard resistors and capacitors to complex integrated circuits. It focuses on the diversity and comprehensiveness of the data, ensuring that the component images in the dataset have high variability in shape, size, contrast, and background to simulate various situations that may be encountered in the real world. In terms of image annotation, it uses a precise bounding box annotation method to assign a bounding box to each electronic component in the image and record its category information in detail. This annotation method not only provides the model with the precise location information of the component but also enables the model to learn the spatial relationship between different components. Accurate component count annotations have been provided for every image within the dataset, ensuring that each component is precisely identified and tallied. This approach furnishes the model with high-quality training data. Furthermore, special attention has been given to the balance of the data, ensuring that the representation of each component type within the dataset mirrors its distribution in real-world applications, thus preventing the overrepresentation of specific categories.
The LEEC dataset is the first dataset dedicated to small sample multi-class X-ray industrial electronic components. The electronic components in the dataset exhibit vast differences in appearance, size, and brightness due to their different shapes, sizes, and light transmission characteristics, especially the small size and high-density distribution of components, making the minimum target in the dataset only 15
Comparison of
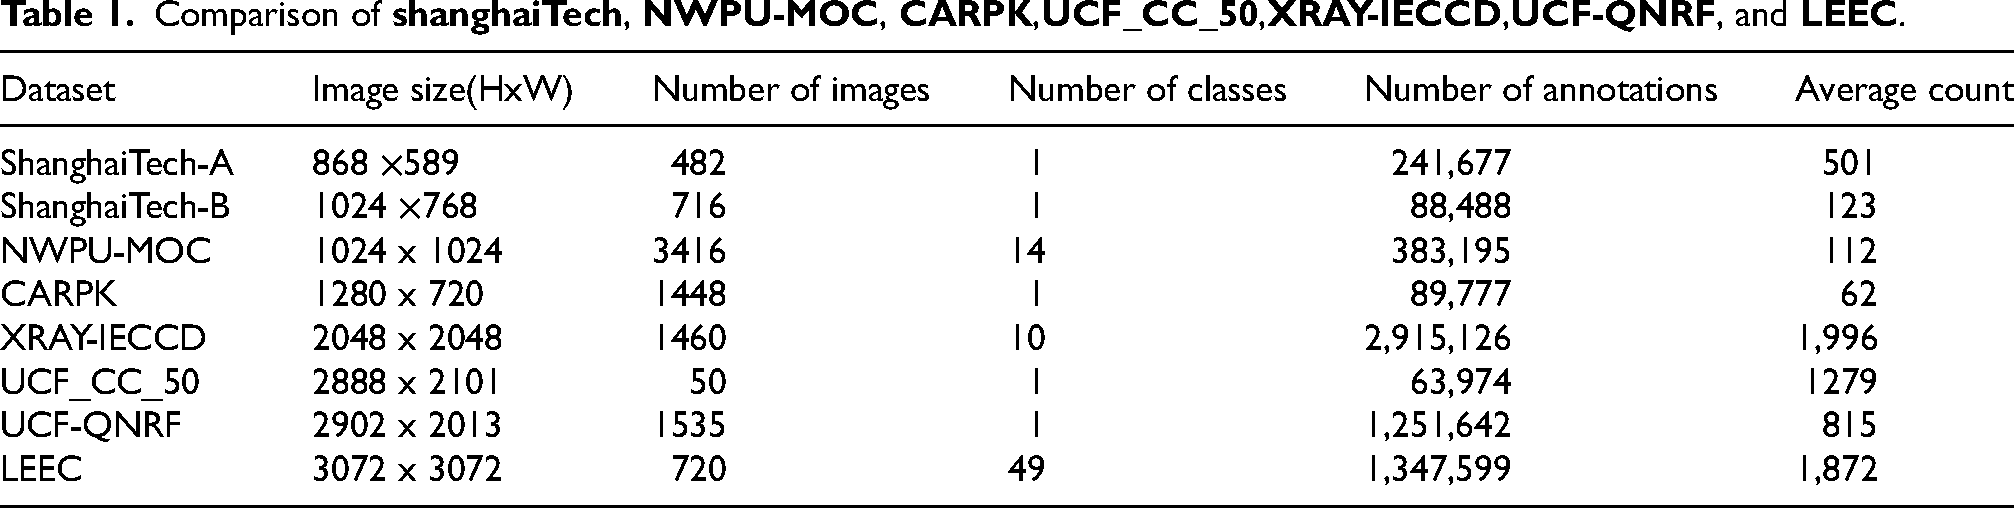
Figure 5 shows the display of the LEEC dataset and normalization in two different scenes. Figure 6 shows the preprocessing process of the LEEC dataset:
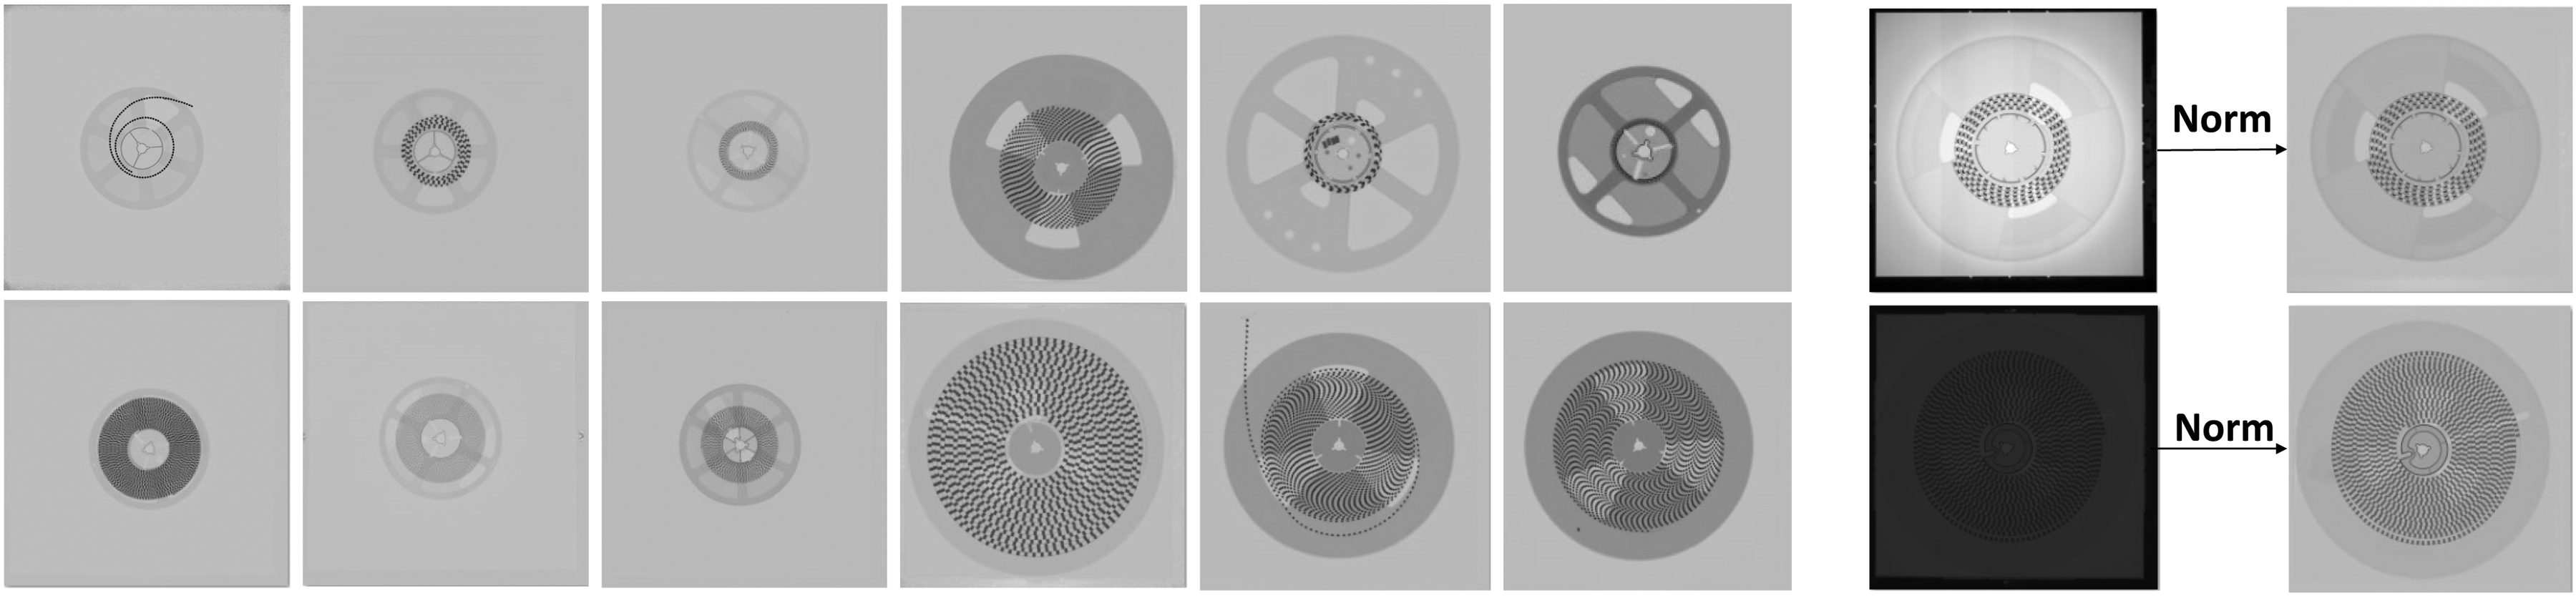
The display of the proposed LEEC dataset. The left side shows 12 pictures of different types in the LEEC dataset, and the right side shows the normalized processing results of two original images in different scenes, corresponding to the conditions of bright strips on the edges (upper right) and dark scenes (lower right).
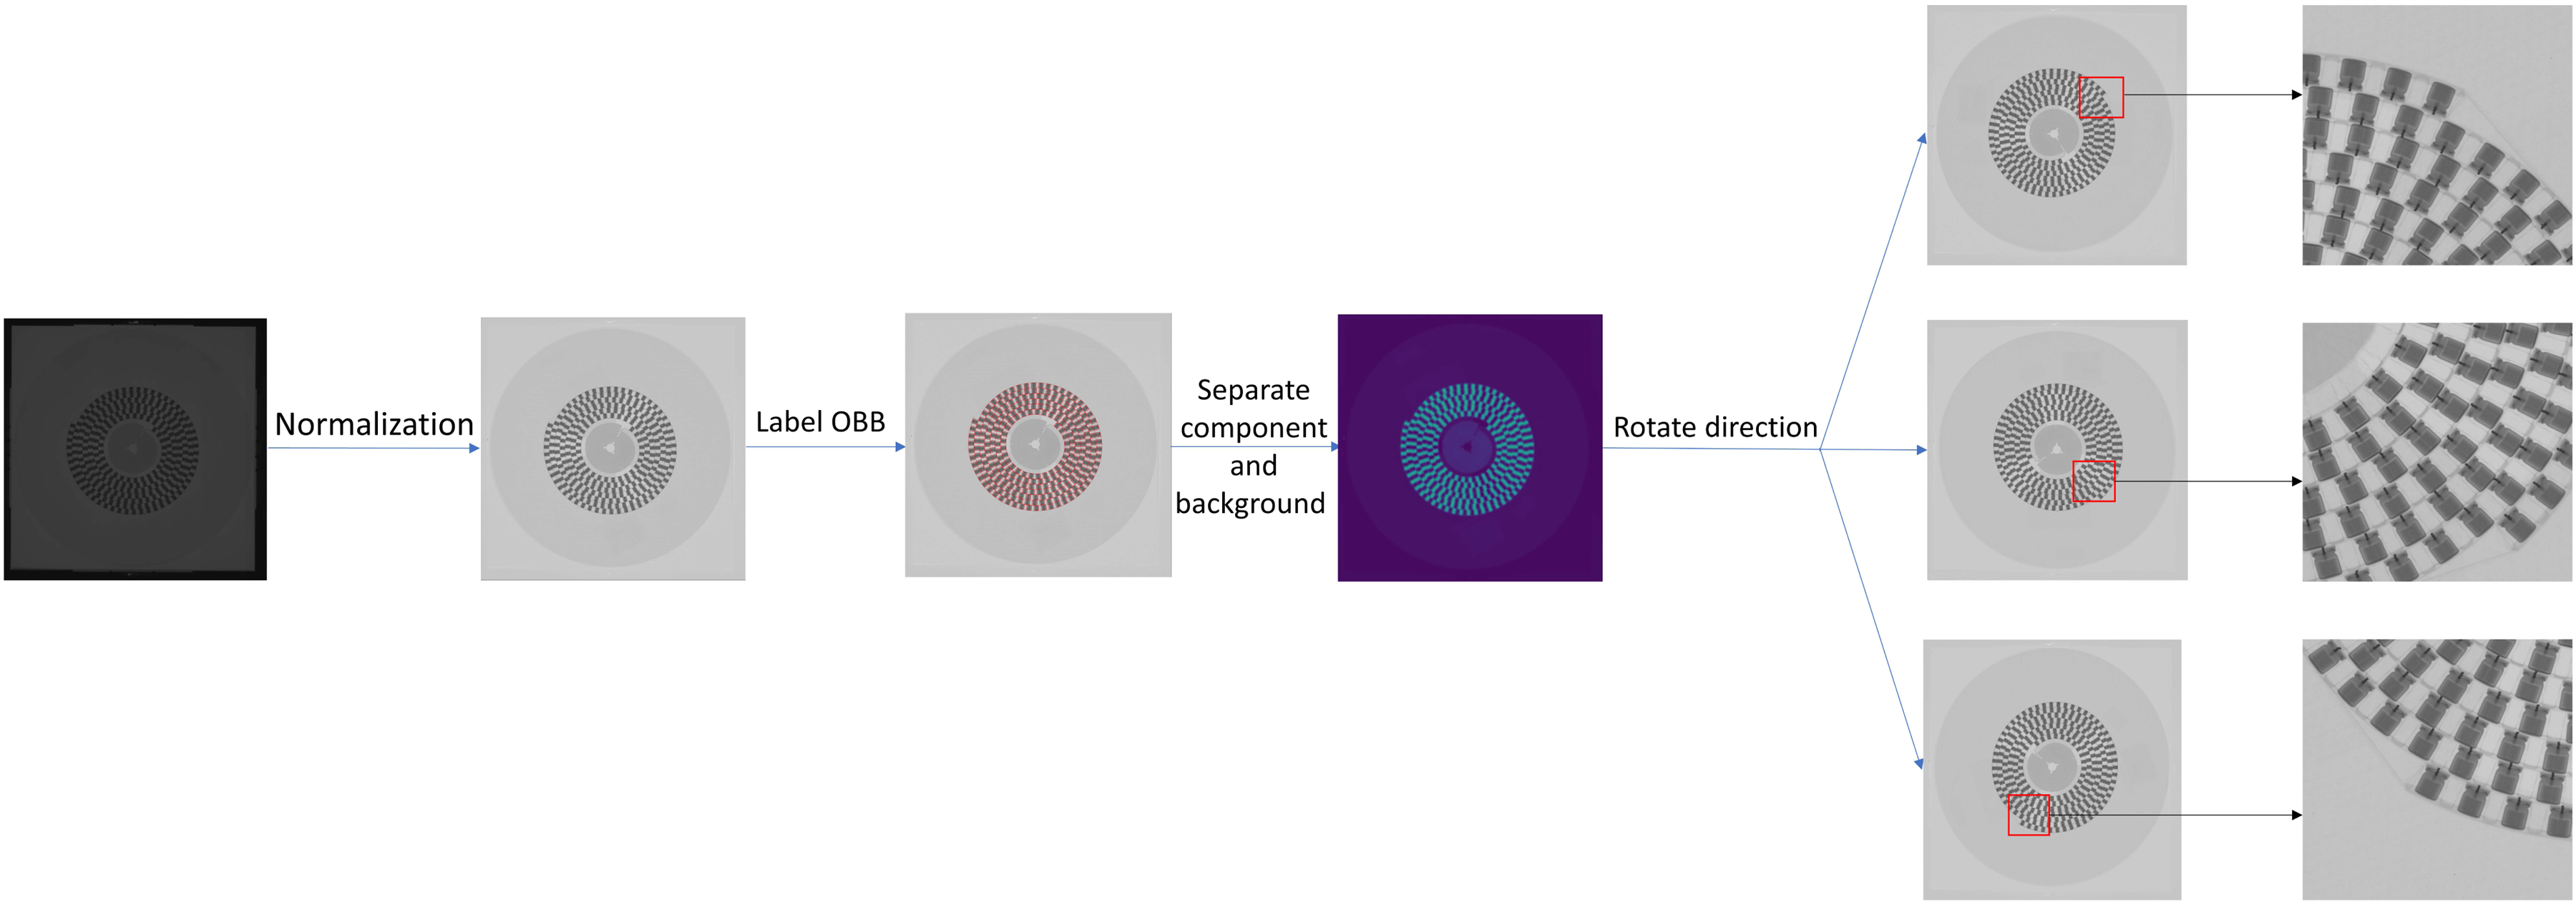
LEEC dataset preprocessing method.
Experiment
Implementation details
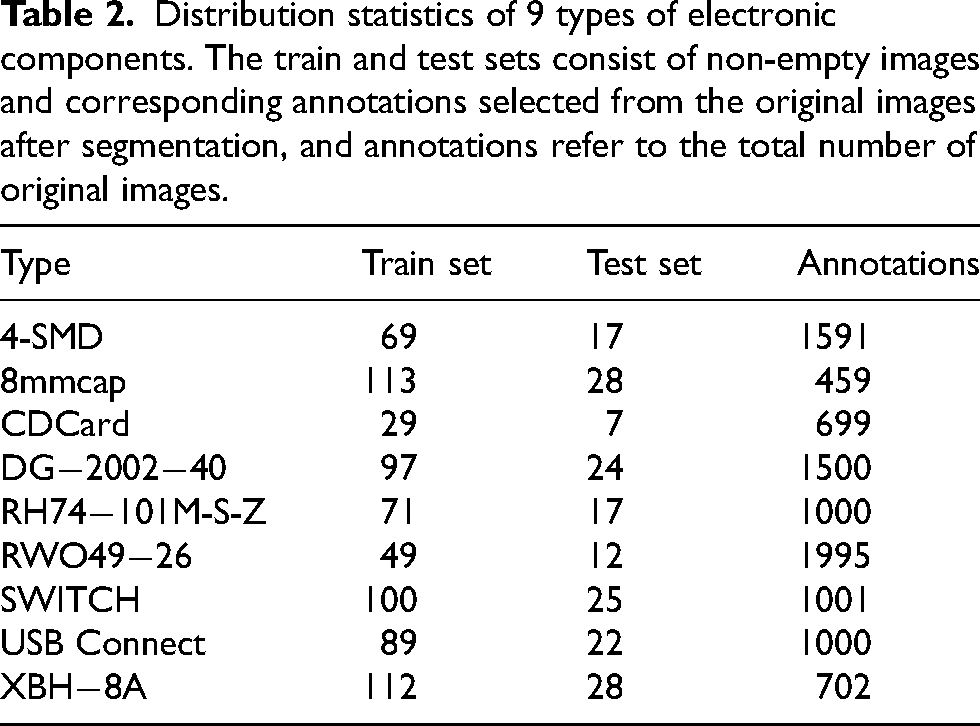
The LEEC dataset is partitioned with 15% labeled data allocated for training and 5% labeled data reserved for testing, while the remaining 80% of the images are unlabeled. Each image undergoes a series of preprocessing steps, including rotational alignment, dimensional adjustment through cropping and scaling, followed by resolution normalization to 512
Distribution statistics of 9 types of electronic components. The train and test sets consist of non-empty images and corresponding annotations selected from the original images after segmentation, and annotations refer to the total number of original images.
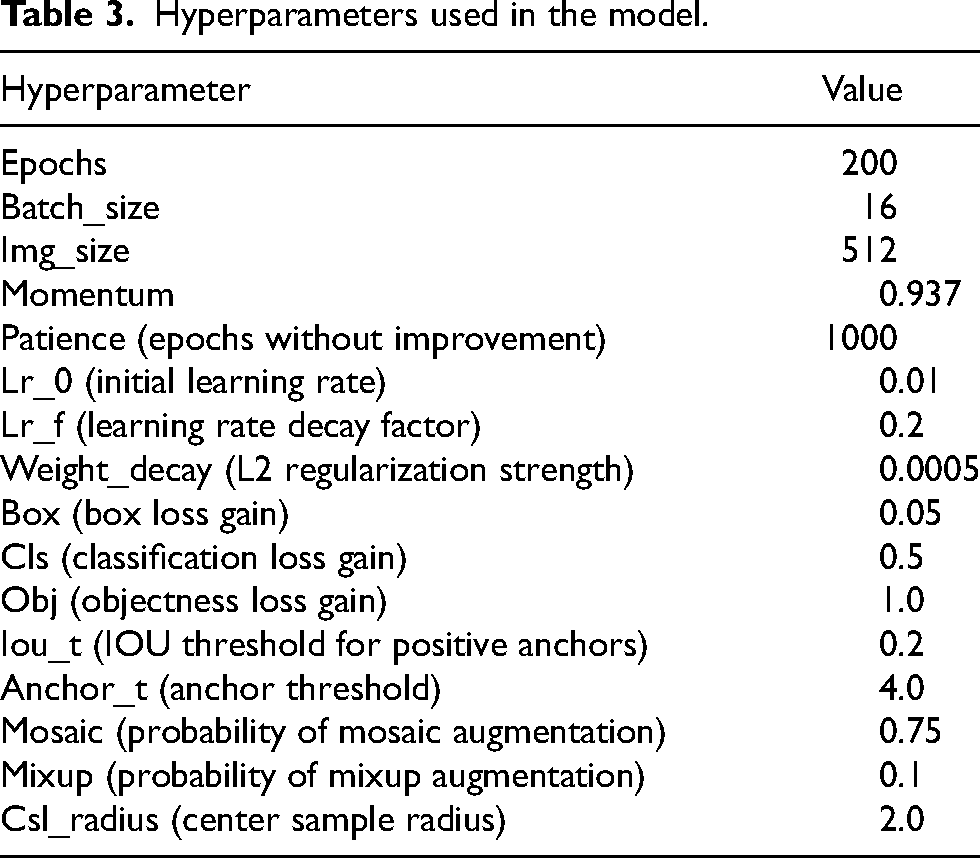
For training, a batch size of 16 was chosen to optimize GPU memory usage and maintain training stability, facilitating effective learning from the LEEC dataset. The Momentum optimizer, initiated with a learning rate of 0.01 and complemented by a cosine annealing schedule, was employed to achieve efficient convergence. Training was accelerated on NVIDIA RTX A6000 GPUs, each equipped with 48 GB of VRAM, and Automatic Mixed Precision (AMP) was utilized to boost computational throughput and minimize memory usage without compromising accuracy. Hyperparameter configurations are outlined in Table 3.
Hyperparameters used in the model.
Comparison study in the LEEC dataset
As shown in Table 4, the YOLO-DEP series models show significant advantages in many core metrics. Compared with the latest YOLO series and RT-DETR models of the same scale, YOLO-DEP maintains a leading position in localization accuracy and comprehensive performance of target detection. At the five scales of n/s/m/l/x, the mAP50 and mAP50
Metrics for each model on the validation set after training on the full labeled training dataset . The number of parameters (#Param.), floating-point operations (FLOPs), mean average precision at 50% (mAP50(%)), 50
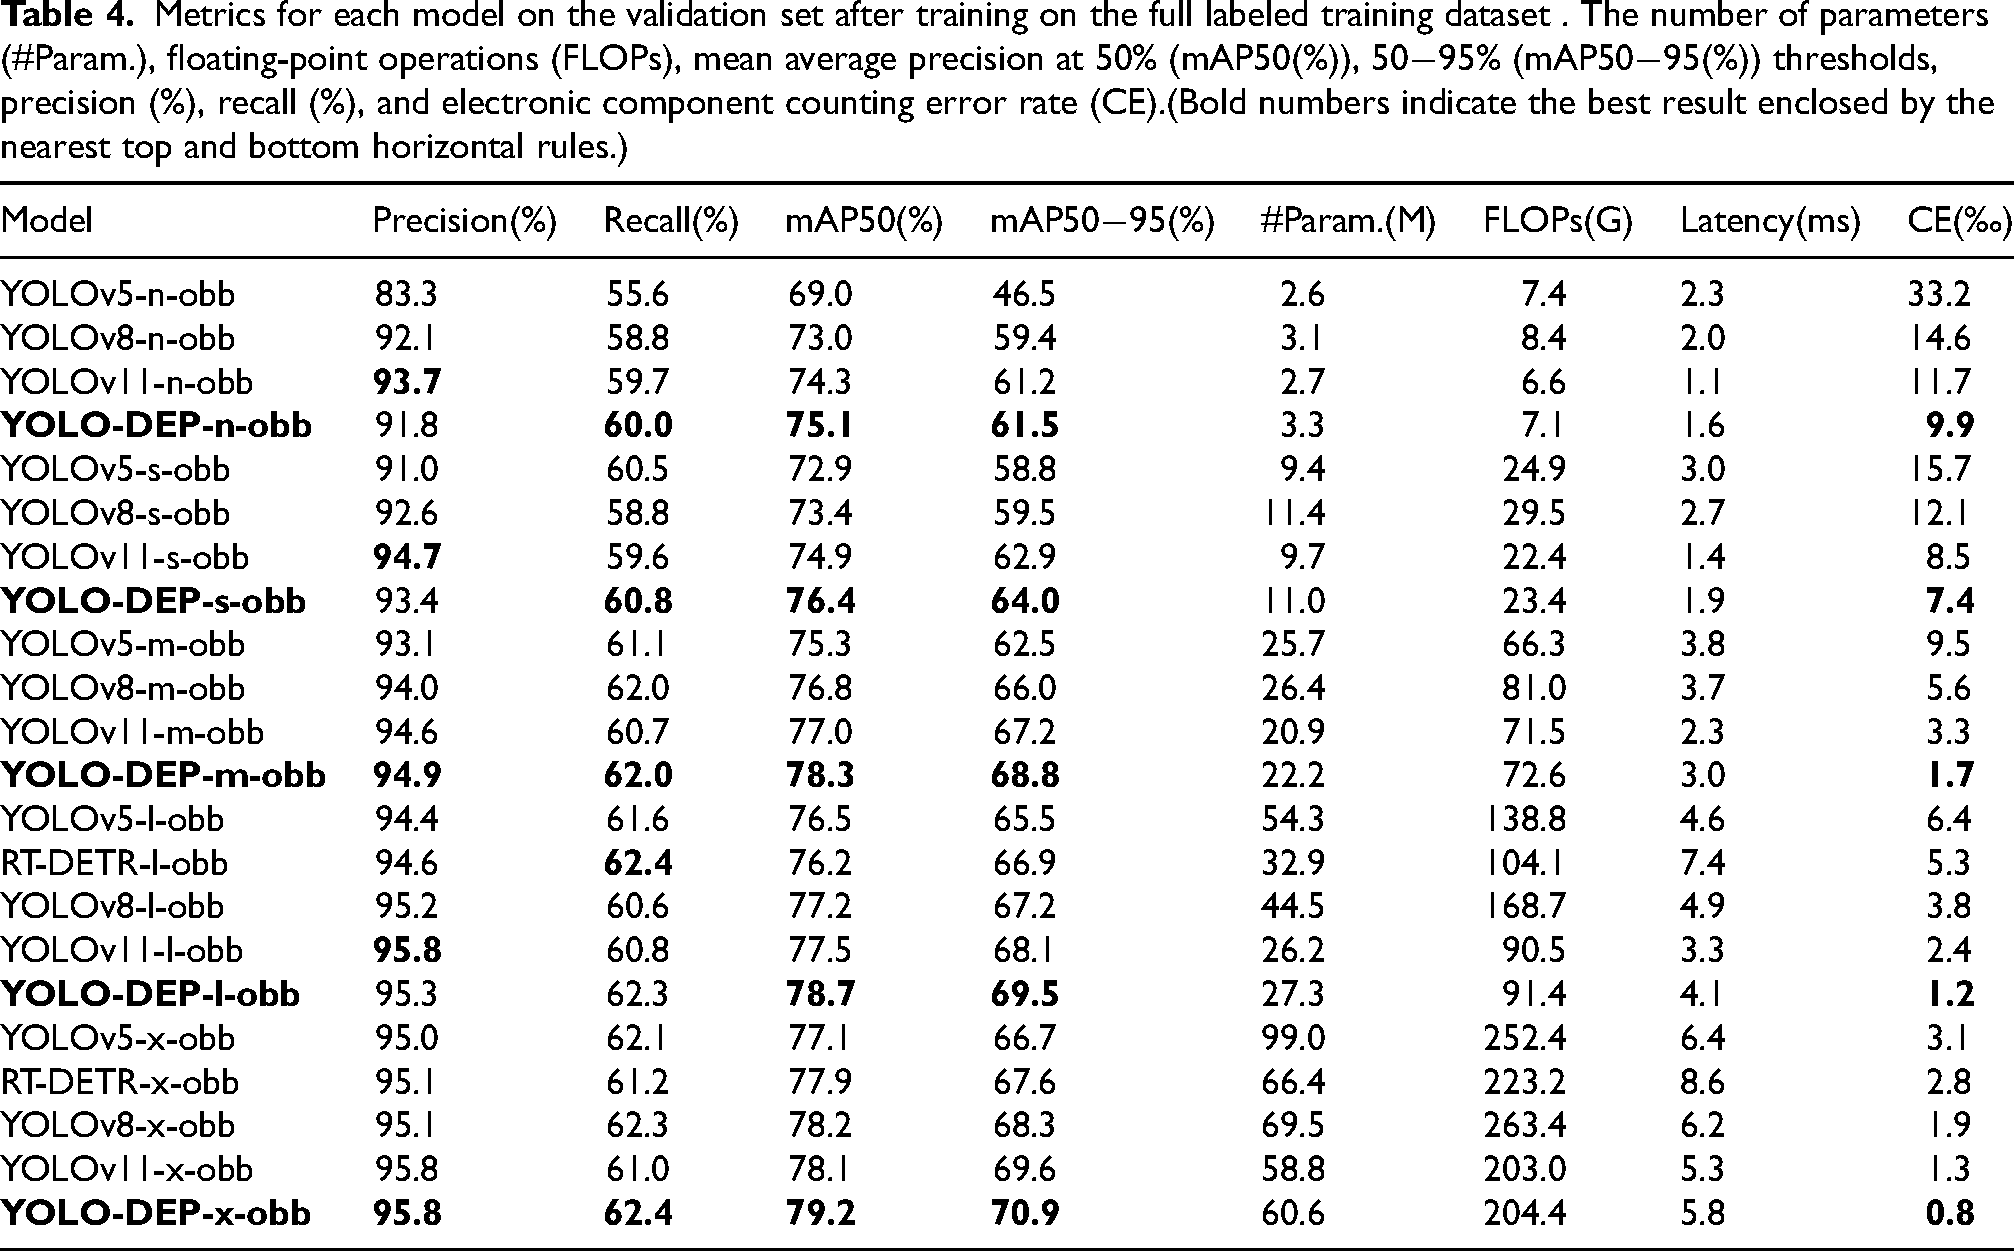
With respect to the key indicator, counting error rate (CE), which equals the absolute difference between the predicted and true counts divided by the true count, YOLO-DEP demonstrates outstanding stability in industrial counting scenarios. The counting error rate of the entire series of models is less than 10‰, among which the CE value of YOLO-DEP-x-obb is only 0.8‰, which is 38.5% lower than YOLOv11-x-obb (1.3‰) and 71.4% lower than RT-DETR-x-obb (2.8‰). This sub-thousandth error control capability, combined with its high frame rate characteristics, fully verifies the practical value of this architecture in real-time industrial detection systems. YOLO-DEP achieves a better balance in terms of accuracy, speed, and resource consumption through a deeply optimized feature fusion mechanism and lightweight design, providing a new technical paradigm for target detection and counting tasks in complex scenarios.
Comparison study on public dataset
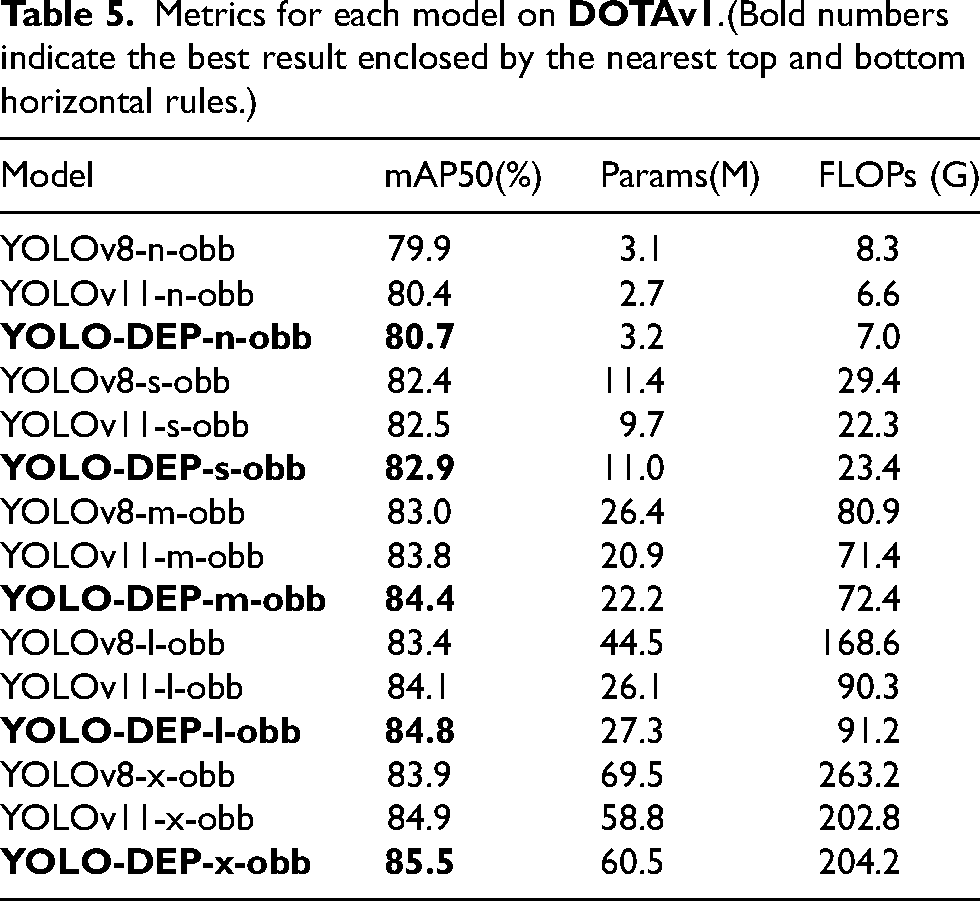
As shown in Table 5, experiments based on the DOTAv1 aerial imagery dataset show that YOLO-DEP has significant advantages in multi-directional target detection tasks. At the x-large model scale, YOLO-DEP-x-obb achieves the best detection accuracy with (85.5%) mAP50, which is better than YOLOv11-x-obb (84.9%). YOLO-DEP optimizes feature expression through the deep encoding processor (DEP) module, and enhances the contour resolution capability of complex targets while using fewer parameters and lower computational cost. The hierarchical feature encoding strategy of the DEP module effectively improves the model’s detection robustness for small and rotating targets, and provides a new technical pathway for automatic interpretation of the detection results.
Metrics for each model on
Ablation study
Table 6 presents an ablation study of YOLO-DEP on the LEEC dataset, evaluating the impact of DEP and SARI modules on model performance, which is measured by APval(%), parameters, FLOPs, and latency. The table is organized by YOLO-DEP variants (n, s, m, l, x), showing performance with different module combinations. Checkmarks (✓) indicate included modules.
Ablation study with YOLO-DEP on LEEC.(bold numbers indicate the best result enclosed by the nearest top and bottom horizontal rules. All models use the OBB head; ‘-obb’ suffix is omitted for compactness.)
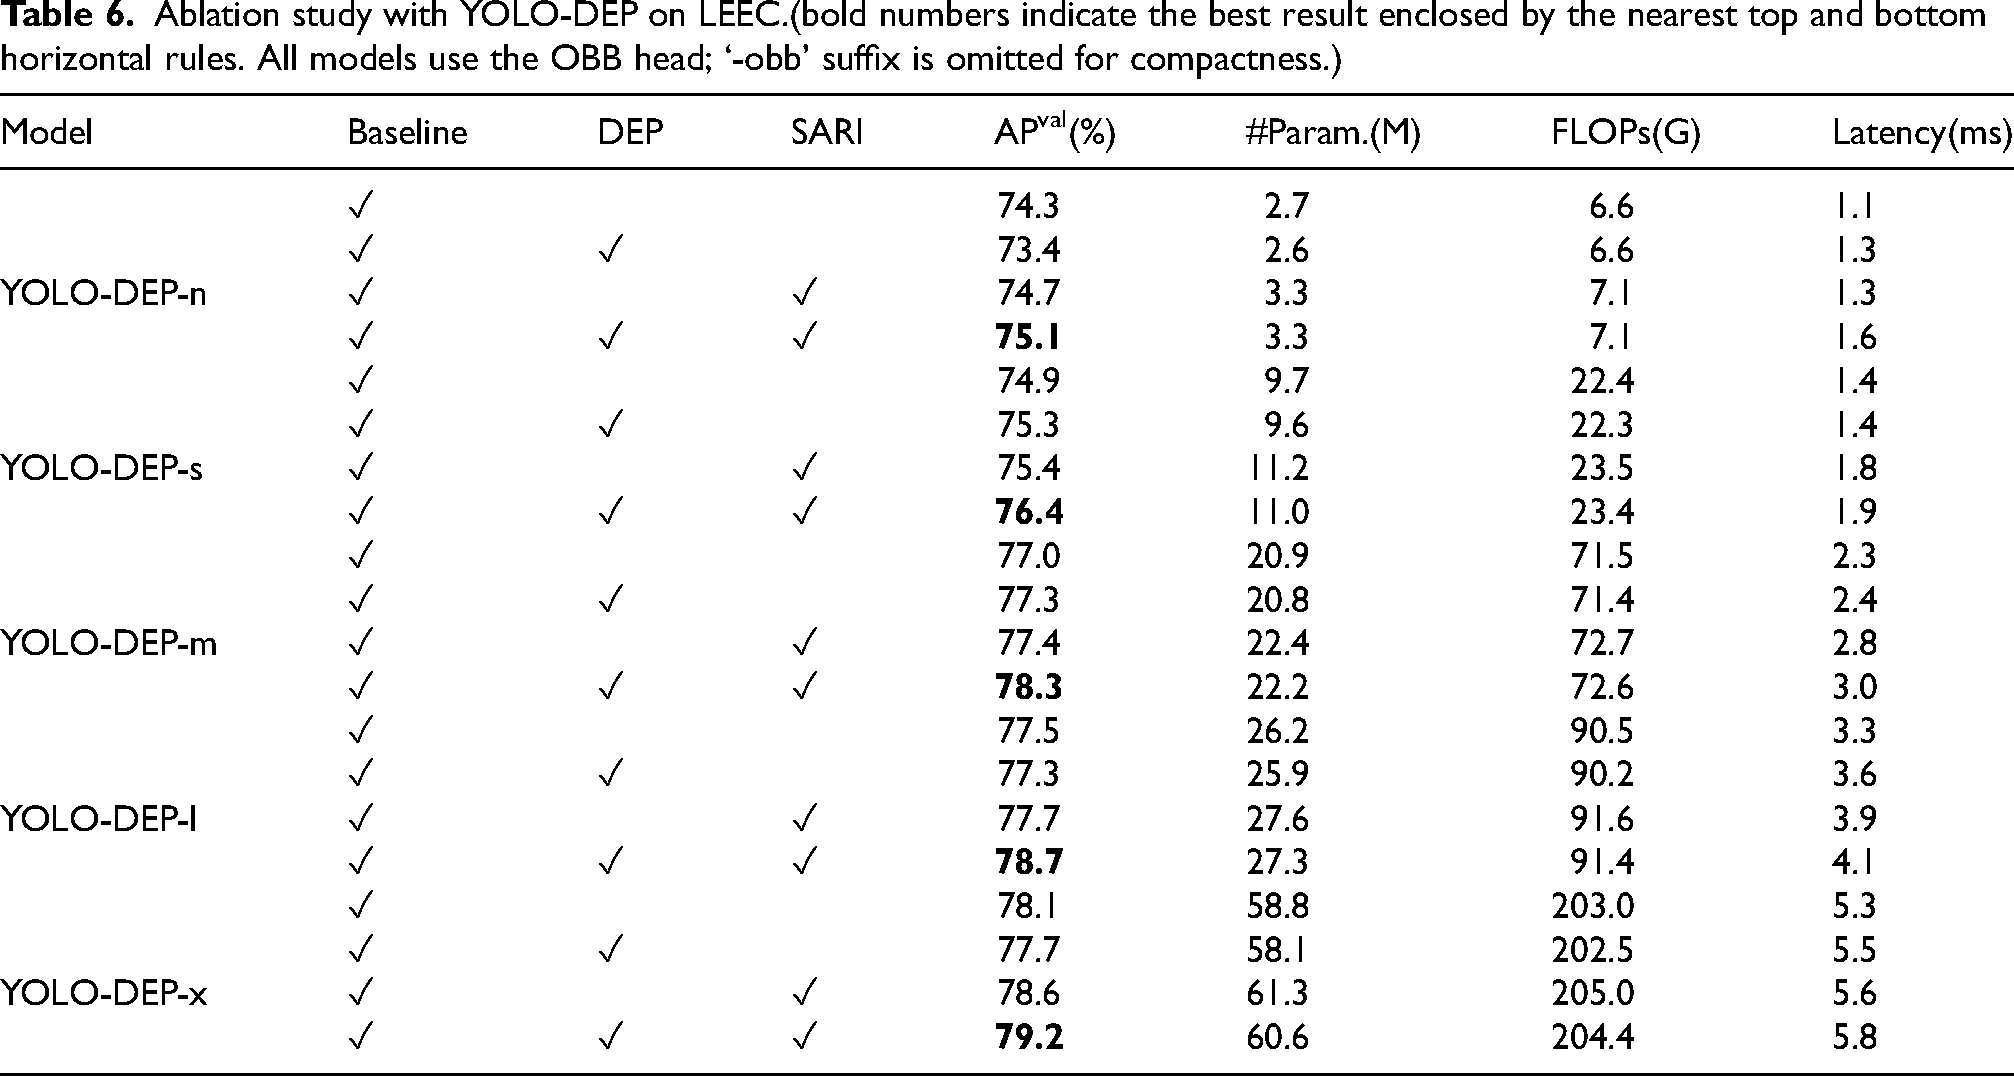
The ablation study clearly demonstrates that the inclusion of DEP and SARI modules consistently improves the performance of YOLO-DEP across all scales. The largest model, YOLO-DEP-x, benefits the most from these modules, achieving the highest APval, albeit at the cost of increased computational resources and latency. This suggests that the attention mechanisms are crucial for enhancing the model’s ability to detect objects, especially in more complex scenarios that require finer-grained feature extraction and spatial awareness.
Pseudo-labeling study
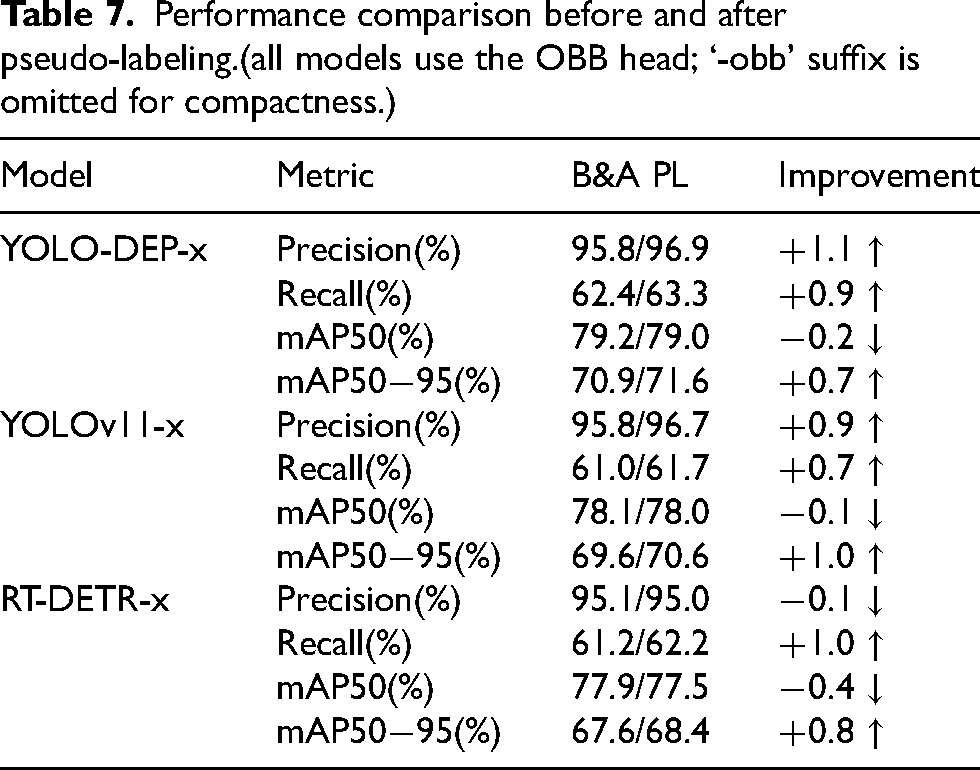
The experiments in Table 7 show that pseudo-labeling can effectively improve the recall rate and high-confidence localization accuracy (mAP50
Performance comparison before and after pseudo-labeling.(all models use the OBB head; ‘-obb’ suffix is omitted for compactness.)
Results visualization
The first column in Figure 7 displays the input images of 9 electronic components, the second column shows the ground truth detection maps corresponding to their input images, and the third to fifth columns display the detection maps predicted by the proposed method, and the other two latest methods (YOLOv11, RT-DETR). The red rotating box is the target detected by the ground truth or model, and the blue rotating box is the target that is not detected.
YOLO-DEP and other methods generate detection maps for 9 types of components in the LEEC dataset.
As can be seen, YOLO-DEP-x-obb can accurately locate components in most cases, and the detection frame fits the real target well, which effectively reduces false detections and missed detections. YOLOv11-x-obb has equally good overall detection performance, but is slightly inferior to YOLO-DEP-x-obb when dealing with complex or mutually interfering components, and occasionally misses detections. RT-DETR-x-obb can accurately capture subtle features and identify occluded parts, but has a higher miss detection rate.
Heatmap visualization
According to Figure 8, YOLO-DEP shows a significant primary-secondary characteristic in attention allocation, focusing most of the attention on the core area of the circular material disk, ensuring high-precision detection of the main target and significantly reducing the possibility of false detection and missed detection. At the same time, part of the attention is reasonably allocated to the four small areas between the square disk and the circular disk, which can effectively capture potential targets at the edge or occluded part (such as material offset or stacking), thereby improving the robustness in complex scenes. Through this primary-secondary attention mechanism, YOLO-DEP ensures the accuracy of core target detection while avoiding the omission of key details caused by completely ignoring the background.
Heatmap of YOLO-DEP and other models.
YOLOv11 mainly focuses on the edge area of the square disk and the circular disk, but does not pay enough attention to the core circular material disk, which may lead to a decrease in the stability of the main target detection. In addition, its excessive focus on the background or secondary areas makes it more sensitive to noise (such as lighting changes or irrelevant objects), thereby increasing the false detection rate.
The attention distribution of YOLOv8 is relatively scattered, lacks a clear focus, and fails to highlight the core area, resulting in insufficient localization accuracy for the circular material disk. At the same time, it pays less attention to small edge areas (such as gaps between materials or stacked parts) and is prone to missing small targets or occluded targets in complex scenes.
Conclusion
This work introduces YOLO-DEP, a semi-supervised detector and counter for high-resolution X-ray radiographs. A Deep Encoding Processor inside the YOLO backbone preserves fine structure while capturing multi-scale context, achieving sub-pixel localization and top-tier counting accuracy on dense micro-electronic assemblies. To support reproducible research, we release LEEC (49 classes, 3072
Current work still needs faster inference for edge deployments and rigorous validation under extreme imaging conditions. Going forward, we will streamline the network by pruning parameters and applying knowledge distillation to boost efficiency, and we will extend the framework to neutron radiography, proton CT and
Footnotes
Acknowledgement
This research was made possible through the collaborative efforts of our research team, who contributed their expertise in deep learning, industrial automation, and X-ray imaging. We extend special thanks to the team members who assisted with dataset collection, annotation, and experimental validation. Additionally, we thank the reviewers for their valuable feedback, which helped improve the quality of this work.
Author contributions
Zhixuan Xiao: Conceptualization, Methodology, Software, Formal analysis, Investigation, Data Curation, Writing – Original Draft, Visualization. Huahai Sun: Methodology, Software, Validation, Investigation, Data Curation, Writing – Review & Editing. Xu Tuo: Data Curation, Investigation, Writing – Review & Editing, Supervision. Liang Li: Conceptualization, Supervision, Project administration, Funding acquisition, Writing – Review & Editing.
Funding
The authors disclosed receipt of the following financial support for the research, authorship, and/or publication of this article: This work was supported by the Beijing Natural Science Foundation under Grant No. L222001.
Declaration of competing interest
The authors declared no potential conflicts of interest with respect to the research, authorship, and/or publication of this article.