
Abstract
Background
Glaucoma is a leading cause of irreversible vision loss and is characterized by subtle structural changes in the optic disc and optic cup. However, existing automated detection systems often suffer from weak boundary delineation, dataset variability, and unstable feature learning, which limit their generalizability and clinical reliability.
Objective
This study aims to develop a unified and anatomically guided framework for accurate and reliable automated glaucoma detection from fundus images.
Methods
The proposed pipeline begins with contrast-enhanced preprocessing to improve image quality, followed by an Attention-guided Multi-scale Edge-aware Segmentation Network (AME-SegNet) for precise segmentation of the optic disc and optic cup. Both deep convolutional features and clinically relevant geometric features are extracted and optimized using Bitterling Colony Optimization (BCO) to select the most discriminative attributes. A Convolutional Transformer (CT) is then employed to integrate local convolutional representations with global attention mechanisms for robust classification. Additionally, the Honey Badger Algorithm (HBA) is used for automatic parameter tuning to ensure stable convergence.
Results
Experimental evaluation demonstrates high segmentation performance with Dice scores of 97.36% for the optic disc and 96.72% for the optic cup on the Drishti-GS1 dataset. The classification model achieves accuracies of 98.63% on RIM-ONE and 98.96% on ORIGA-Light datasets, indicating strong generalization capability.
Conclusions
The proposed framework exhibits robust performance, high accuracy, and strong generalization across multiple datasets. These results highlight its effectiveness and clinical potential for reliable automated glaucoma screening and early diagnosis.
Introduction
Glaucoma is a vision-threatening disease, and the progression of the disease is closely linked with the geometry of the optic disc and optic cup; therefore, accurate extraction of these parameters from fundus images is a mainstay for proper diagnosis for glaucoma. Manual delineation of these structures, however, tends to be subjective and inconsistent, which necessitated research toward automated segmentation. Convolutional neural networks have increased segmentation accuracy; however, the differences in imaging devices and patient populations often affect their generalizability. Advanced feature alignment and multi-color representation strategies are suggested to tackle these hurdles and stabilize learning across datasets, while edge-focused optimization further improves anatomical boundary accuracy. 1 Closer to glaucomatous diagnosis is the integrity of the neuro-retinal rim structurally; this, in turn, is dependent on how accurately one is able to identify the optic disc and optic cup. Traditional cup-to-disc analysis may not always carry forward true disease severity, given that blood vessels, low contrast, and anatomical variations conceal these regions. From accurate disc and cup segmentation, one could therefore derive better indicators of glaucomatous damage through reconstruction of rim tissue. Adversarial learning strategies have been employed to improve segmentation quality and thus stabilize glaucoma screening based on rim measurements. 2
Structural modifications at the optic nerve head are usually the first signs of glaucoma, and therefore an essential aspect of efficacious automated diagnosis is the detailed modelling of the optic disc and optic cup. The biomarker ratios that can be measured clinically change with the increase in cup-size and rim thinning. These changes should be linked to an analysis of geometrical and texture-based information. Robust feature extraction can therefore be performed irrespective of poorly defined boundaries through the combination of classical image segmentation techniques from deep neural networks. 3 Accurate localization of the disc is the prerequisite for efficient screening since the morphology of the optic disc is altered due to glaucomatous damage. However, illumination inconsistency and contrast often inhibit boundary detection in the retinal images. To increase the robustness of the approach, graph-based clustering and region-based segmentation algorithms were integrated with convolutional learning. As a result, the proposed hybrid approach is capable of recognizing meaningful disc regions even in noisy or incomplete images, making the automated detection of glaucoma stronger. 4
The changing landscape that denotes the progress of the glaucoma disease is found in the relationship of the optic disc with the optic cup; hence, their coordinated analysis is indispensable for early diagnosis. Such changes in the relationship between the optic disc and cup may alter their observed comparisons because of variations in the image quality or by how severe the disease is. This makes entirely local-based measurement-based models potentially fragile. The combination of global fundus context featuring disc-specific aspects provides a much deeper insight into the disease. In addition, embedding prior anatomical knowledge into the learning framework would result in screening systems that are more consistent and generalizable. 5 Glaucoma leads to structural damage and loss of functional vision while traditional field-based tests prove hard to scale. Retinal imaging includes a great non-invasiveness alternative because it captures anatomic changes related to external severity. Measures of the optic disc and cup allow construction of structures for correlating visual function. Moreover, thereby enhancing that, multimodal deep learning frameworks fuse clinical data with image-derived features, hence more accurately predicting the current and upcoming visual impairment. 6
The early stages of glaucoma typically show invisibly small alterations in the optic nerve head that may not even be evident on visual field testing. In order to be able to detect the disease before incurring permanent damage, it is highly important to obtain very precise segmentation of the retinal structures. Such quantitative measures derived from these segmentations reduce subjectivity while improving reliability across observers. These anatomical features complement deep learning classifiers and thus render high-scale and credible glaucoma screening from fundus pictures. 7 Automatically recognizing the lesions or pathology in glaucoma assumes a good extraction of optic disc and optic cup boundaries from retinal images. However, because of other factors like illumination, noise, and contrast, one often finds these parts are obscured. To overcome these obstacles, learning-based systems of nowadays work with the pictures to enhance their quality before performing clinically important features extraction from them using difficult visual conditions. Such advances contribute to lower rates of false diagnosis with respect to many disease-related changes and increase sensitivity in early glaucoma identification. 8
An optic disc analysis is needed not only for glaucoma but also for any other optic nerve disease that alters the appearance of the disc. When swelling or distortion occurs, normal segmentation fails to find the actual borders in many cases. More advanced boundary modeling techniques have thus been introduced to track distorted disc contours. Pathological changes can then be accurately identified by coupling these models with machine-learning classifiers, guiding early clinical intervention. 9 Glaucoma is the progressive damage of the optic nerve head, and fundus imaging provides a window through which these changes can be examined directly. Traditional clinical tests for glaucoma detection can be costly and require specialized premises; however, deep learning presents a scalable automated alternative. Neural networks learn discriminative patterns from various retinal datasets to detect glaucomatous features with increasing reliability. This enhances access to glaucoma detection, especially in settings where resources are limited. 10
The main goal of this research consists of developing a promising, anatomically guided, and fully automated glaucoma diagnosis framework that can segment the optic disc and optic cup from fundus images, extract clinically meaningful features, and accurately classify glaucomatous and healthy eyes in various imaging conditions using biologically inspired optimization and deep learning.
The early detection of glaucoma is very important, for the disease will eventually cause irreversible vision loss through progressive damage to the optic nerve head. However, subtle structure changes within the optic disc and the optic cup are not always easy to detect, even by experienced clinicians, and are very dependent on image quality, anatomical variability, and observer subjectivity. Existing automated systems often consider segmentation, feature extraction, and classification as separate processes with little understanding between anatomical structure learning and prediction of the disease from the learned maps. Most of the current state-of-the-art methods depend on fixed feature sets and manually tuned hyperparameters. These limitations significantly reduce the adaptability and reliability of the methods across different datasets and clinical environments. That, in itself, provides a strong motivation for a self-optimizing, anatomically driven, unified approach for the reliable learning of glaucoma-specific representations with stability, efficiency, and clinical relevance.
While many deep learning models for glaucoma detection have been proposed, most existing strategies treat segmentation, feature extraction, and classification as poorly connected or independent tasks, resulting in poor coordination between the learning of anatomical structures and disease prediction. Many models would focus either on pixel-wise accuracy or classification performance without ensuring that both stages feed back into each other meaningfully in the clinical space. In addition, current systems often depend on a certain set of fixed features or hyperparameters that have been manually fine-tuned, thereby limiting their adaptability to datasets and imaging conditions. Such limitations pave the way for a framework that is capable of simultaneously optimizing anatomical segmentation, feature relevance, and classifier behavior in a fashion that is data-driven and biologically inspired.
The study aims to look into automated glaucoma screening from color fundus images using deep learning and biologically inspired optimization. The system designed is to:
Carry out pixel-level segmentation of the optic disc and optic cup for anatomical evaluation. Calculate clinically relevant biomarkers like cup-disc ratios and shape descriptors. Support binary classification separating glaucoma from normal eyes and vice versa with dependable accuracy. To work economic enough to facilitate real-time or large-scale screening applications.
To confine the study to fundus-image-based glaucoma detection excludes any multimodal data like OCT or visual field measurements. Nevertheless, the architecture can be extended to incorporate such modalities later. The system is meant for screening and decision support, not to replace clinical diagnosis.
An enhanced retinal preprocessing pipeline is designed to improve the visibility of optic disc and optic cup by compensating for the variation in illumination, contrast, and noise in fundus image. The Attention-guided Multi-scale Edge-aware Segmentation Network (AME-SegNet) developed in this research will be able to accurately identify and delineate the optic disc and optic cup boundaries while maintaining anatomical relevance. A deep visual feature descriptor paired with clinically relevant structural descriptors will then be employed to better reflect glaucomatous damage from the segmented optic disc and cup regions. BCO will be applied to select the most discriminative features and reduce redundancy for better generalization. Build a Convolutional Transformer–based classifier that can jointly learn local retinal texture and long-range anatomical relationships for robust glaucoma detection. Optimize HBA-based learning behavior of the classifier for stable convergence and accurate diagnosis on different datasets. Establish a robust methodology with respect to cross-dataset generalization through validation on public datasets.
The rest of the paper is organized as follows: Section 2 deals with previous computerized methods for diagnosing glaucoma and retinal image analysis; Section 3 describes the complete design of the proposed segmentation and classification framework; Section 4 reports the experimental evaluations and quantitative results on a number of benchmark datasets; and finally, Section 5 wraps up the work at hand and proposes possible extensions for future work.
Related works
End-to-end retinal segmentation was developed to outline the optic disc simultaneously while outlining the optic cup for glaucoma screening support. The very strong feature extractor was embedded into a U-shaped network, so that fine-scale texture and the global retinal structure could be captured, and the spatial refinement was applied to make the anatomical boundaries more accurate. The class-aware learning objective thus ensured that small regions like the optic cup would not get swamped by background pixels during training. Stable optimization allowed for convergence of the network very effectively, with the outcome being consistence and anatomic meaning in segmentation through public datasets. 11 A deep learning framework has been introduced to enhance retinal image analysis for early glaucoma detection and assessment of the severity in glaucoma. Visibility of disease-related structures was enhanced by the normalization of images and enhancing the contrast, while the data was expanded to withstand real-world variations. A snapshot ensemble strategy allows the classifier to build diverse feature representations without blocking computation power. Reliably improved classification through parameter optimization, as well as having an independent segmentation module classifying disease subtypes once detected, provides clinically richer information in the diagnosis output. 12 To achieve joint segmentation of the optic disc and cup, a joint attention-shared encoder-decoder model was built. Attention at different scales brought different anatomical sites from long distances. Token aggregation reinforced separation of disc, cup, and backgrounds. Various clinical constraints were embedded in the learning objective to ensure that the model is anatomically consistent. Reduced labeled data dependence through self-supervised pretraining also improves robustness. 13
A lightweight, efficient deep-learning-enabled glaucoma detection pipeline was designed using synthetic data production. To address data imbalance for better representation of pathological patterns, synthetic retinal images were created. Noise suppression and enhancement of the images improved visual clarity, and therefore, the reliability of optic cup extraction. A compact convolutional model was then trained on the enriched dataset to discriminate between healthy and glaucomatous eyes, making precise predictions at optimized computational costs. 14 A combined approach used for glaucoma screening using several neural networks aligned with complementary strengths was proposed as follows. One model emphasizes hierarchical visual patterns, a second model focuses on spatial detail, and the third one captures long-range relationships within the retina. The prediction of the three models is then aggregated through a majority vote to counteract individual model bias while improving system stability. This cooperative strategy enabled better decisions when used in client environments where images tend to vary very widely. 15
Glaucoma screening has been made easy to implement with a cloud-based no-code learning framework that facilitates build model creation automatically via software-less methods. The system uses a balanced training strategy to allow the system to distinguish clinically significant glaucoma from normal retinal images, romping in the affairs of prediction bias. The partition methodology concerning structured data controlled optimization and frosting it against overfitting. After training, the model was made to be executed both online and offline so that it could cater to resource-limited clinics. Reliability was established through independent image source performance evaluation, thus proving its adaptability in different clinical environments. 16 One possible learning architecture integrates optic disc boundary extraction, optic cup region identification, and glaucoma presence detection, so that anatomical and diagnostic cues can reinforce each other. Effective feature encoding reduces the computational load while still storing image detail. Graph-based decoding improved the spatial relationships between retinal structures. Attention mechanism guided the network into clinically important regions, ensuring that feature learning patterns were dominated by important ones. Structural indicators from segmentation augment visual features, thus improving classification consistency. 17
A dual-path network, or synergetic model, was designed to recognize multiple ocular diseases under detailed texture analysis and global structure understanding. Localization pathology cues were utilized by convolutional layers while transformer attention modeled the long-range spatial dependencies. Such complementary representations were adaptively fused, thus preventing either from dominating the decision process. A balanced cross-validation could stabilize performance across disease categories. It also permitted the reliable detection of multiple retinal disorders in a single screening apparatus. 18 The ensemble-based retinal assessment framework was established as a cheap alternative to the traditional neurologic assessments. Such deep architectures combined would reduce prediction variance and thus improve robustness. The filtering criteria established for the quality of images ensured that only the informative retinal portions interacted with the learning. Indeed the system could estimate demographic traits and at the same time detect various neuro-ophthalmic diseases. Split annotations would verify the appropriateness of the clinical meanings guiding predictions in those retinal areas. 19
As part of an interpretable glaucoma diagnosis pipeline, results from deep learning were linked to a clinically endorsed anatomical measure. The optic disc was first localized and segmented along with the optic cup for structural analysis. From these masks, a diagnostic ratio was produced to define disease status. Continuous transformer-based segmentation guaranteed smooth and accurate anatomical contours. This architecture created the transparent diagnostics path between artificial intelligence and the medical reasoning. 20 A transfer-learning-based classifier was created to distinguish between multiple retinal conditions within just one predictive model. Pretrained visual knowledge was adapted to ophthalmic images through fine-tuning and regularized augmentation to illuminate the insensitivity to orientation and illumination changes. Detection of many diseases was made possible thanks to a multi-class probability output. Optimized training strategies ensured reliable convergence and stable performance. 21
To address certain issues such as blurred edges or vessel interference during optic disc extraction, a dense attention-based segmentation network was proposed. While keeping fine and coarse anatomical features intact, multi-scale contextual learning was employed. Established attention mechanisms emphasized pixel-level relationships across encoder and decoder stages. 22 Enlarged receptive fields provided structural continuity; this allowed for highly reliable delineation of optic discs across datasets. An automated optic disc localization system was thus introduced for more robust downstream analyses of glaucoma. Initial preprocessing, relying on brightness-based methods, limited the scope and reduced unnecessary computation. A deep classification network then refined the pixel-level disc boundaries, aided by multi-scale contextual cues. Sophisticated convolutional operations helped accurately segregate the disc from the background, and confirmation of reliable validation was given by consistent localization across various datasets. 23
Unprecedented ensemble pipeline for glaucoma detection starting from an initial correction of substandard quality retinal images. The generative enhancement stage converted degraded scans to clearer representations. Anatomical segmentation then extracted disc and cup regions to derive clinical measurements that were then classified into disease status. The integrated approach built robustness against noise, imbalance, and image degradation. 24 An improved variant of attention-guided U-Net was built for better segmentation of the optic disc and cup structures. The preparatory processing steps carefully excluded vessel interference and normalized image appearance. Multi-scale dilated features preserved structural context across resolutions. Dual attention gates highlighted clinically relevant regions while suppressing irrelevant background. Optimized training produced consistent segmentation even across heterogeneous datasets. 25
A two-step detection framework was developed, where optic disc localization preceded glaucoma classification. Annotated disc boundaries not being available made it impossible to train a fully supervised classifier for disc detection, thus a semi-automated labeling strategy was conceived to help in the appropriate training of the detector. The disc regions thus extracted were classified using deep residual networks. This region-wise approach improved the diagnostic accuracy. It was shown that deeper architectures performed better on the discriminative power. 26 A retinal analysis pipeline was designed to improve the focus on nerve fiber layer abnormalities via specialized image preprocessing. Channel-specific enhancement revealed disease-associated patterns. The refined images were further assessed using a deep convolutional classifier that was adapted through transfer learning. This way of combining image processing with deep learning improved the separation between the classes of the disease. The system showed great ability to discriminate between glaucomatous and healthy eyes. 27
Designed jointly with deep learning and clinical insight, a multi-step framework for glaucoma diagnosis was developed. The optic disc area was segregated for the anatomy of disease importance. The removal of blood vessels helped with the suppression of structural noise. Dual-branch feature extraction obtained complementary information from the retina, and these features were fused to arrive at a stable disease decision. 28 A conjoint segmentation model was trained persona-wise for the anatomical correctness of the optic disc and optic cup, weighed against pixel-wise accuracy. Multi-resolution feature fusion allowed incorporating detailed information and context at large scales, and progressive refinement improved boundary accuracy. To avoid distorted or broken contours, geometric constraints were integrated through contour-based reconstruction techniques. Consequently, the final contours were forced to be closed and anatomically valid, which assisted in making the results more amenable to clinical measurement and analysis. 29
And the secondary technique consists of semi-supervision in the Gradation of glaucoma severity to use both labeled and unlabeled retinal images. An enforced student-teacher architecture in prediction consistency across different views of data. Relationship-based constrains also contributed to the learning stability improvement. A significantly larger quantity of unlabeled images generalizes with less effect. Confirmed external evaluation makes sure it withstands dataset variegation. 30 A dual-modality fusion framework was introduced to couple retinal surface information with cross-sectional structural detail. Separate networks extract complementary features of their fundus and OCT images. The merged levels resulted in a more complete profile of the disease. The system is much better than single-image approaches in diagnosing glaucoma because it jointly models the optic disc appearance and nerve fiber integrity. 31
Integrated diseases classification performance using segmentation outputs and advanced deep learning systems is something the above works seem to indicate. In one of the studies, pre-segmented medical images are fed into an Enhanced Swin Transformer-based classification framework. The classification framework was enhanced through the introduction of a multi-layer perceptron guided by a Residual Pyramid Network that extracted strong multi-scale feature representations that further improved classification accuracy through proper conservation of local and global contextual information. 32 One method extracted texture-based descriptors according to the Gray Level Co-occurrence Matrix and discarded visually irrelevant information. For that method, spatial decompositions of the images were assigned through the U-Net architecture, while sophisticated feature representations were learned by a three-dimensional convolutional neural network. The final classification decision considered the predictions from several independently trained model architectures to improve robustness and reliability of the prediction. 33 In another setting, an evolutionary deep learning framework was devised for the diagnosis of Autism Spectrum Disorder. The clinically important areas identified during the U-Net-based segmentation analysis were then evaluated using this technique. The model hyperparameters were optimized with the aim of improving convergence and generalization using a Chaotic Butterfly Optimization strategy while high-level features were extracted using an Inception-v3 network.34,35 Finally, the temporal dependencies of the extracted features were modeled via a long short-term memory network for reliable disorder classification. 36
Recent studies have explored deep learning approaches for automated glaucoma detection using fundus images. A dual-network deep learning framework was developed to simulate human grading behavior, improving diagnostic transparency and achieving strong classification performance across multi-population datasets, demonstrating robustness against data diversity challenges. 37 Another segmentation-based framework employed independent convolutional neural networks to delineate optic disc and optic cup regions for accurate cup-to-disc ratio estimation, achieving high segmentation accuracy on benchmark retinal datasets. 38 Transformer-based architectures have also been introduced to replace conventional convolution operations, showing improved generalization ability and enhanced feature interpretability through attention mechanisms for glaucoma classification. 39 To address dataset variability, regression-based deep learning models were proposed using large multi-source fundus datasets, achieving strong generalizability and consistent screening performance across different populations and imaging conditions. 40 Additionally, convolutional neural network-based classification approaches utilizing data augmentation and channel-based feature extraction demonstrated high detection accuracy and early-stage glaucoma diagnosis capability across multiple retinal image datasets. 41
Limitations and issues of existing models
Even though much progress has been made in glaucoma detection and optic cup-segmentation through deep-learning approaches, there are still some important drawbacks. First, most approaches utilize a two-stage or uncoupled pipeline for segmentation and classification, which leads to weak interactions between learning the anatomical structure and predicting the disease. In consequence, segmentation errors around an ambiguous optic cup-disc boundary may propagate to classification, diminishing diagnostic reliability. Furthermore, a majority of models are extremely sensitive to different illumination conditions, imaging devices, and patient populations, leading to a marked decline in performance when evaluated on a different set than that used to train the model. A large number of these methods are based on hand-crafted features or fixed clinical ratios like CDR only that do not fully capture the complex morphological and textural changes related to glaucoma. In addition, many deep learning frameworks use all extracted features without filtering them for relevance, thus adding redundancy and noise contributing to overfitting and computational burden. Most current systems, finally, depend on manually chosen hyper-parameters, which can make them unstable above and often difficult to adapt between datasets. These limitations call for a unified, anatomically guided self-optimizing framework for enhancing segmentation accuracy, feature relevance, and classification robustness, giving rise to the proposed AME-SegNet architecture. A comparison of recent approaches to optic disc-cup segmentation and glaucoma detection is shown in Table 1 with their corresponding methodologies, merits, and limitations.
Summary of conventional deep learning–based glaucoma detection and segmentation methods.
Even though deep learning has made quick advancements in medical imaging analysis, glaucoma screening stays a challenge since it involves subtle changes in the optic nerve head that cannot easily be captured through general feature learning. Besides, some automatic systems cannot tell between the pathological and the normal disc and cup boundaries, which reduces the reliability of parameters such as the cup-to-disc ratio. Hence, the predictions produced are inconsistent with the models when applied on data collected from different machines, different populations, or different clinical setups.
Moreover, the existing frameworks lack intelligent feature refinements or adaptive learning control, causing classification by the noisy and redundant representations which further complicate computation and weaken the generalization. Automated glaucoma detection systems will not attain the robustness necessary for clinical deployment without a harmonized strategy protecting only meaningful anatomical and textural cues while tuning the learning mechanism itself. Thus, a coherent self-optimizing structure tightly coupling anatomical segmentation, feature importance, and classification dynamics is indeed needed for accurate, consistent, and scalable glaucoma diagnosis.
Overall framework of the proposed system
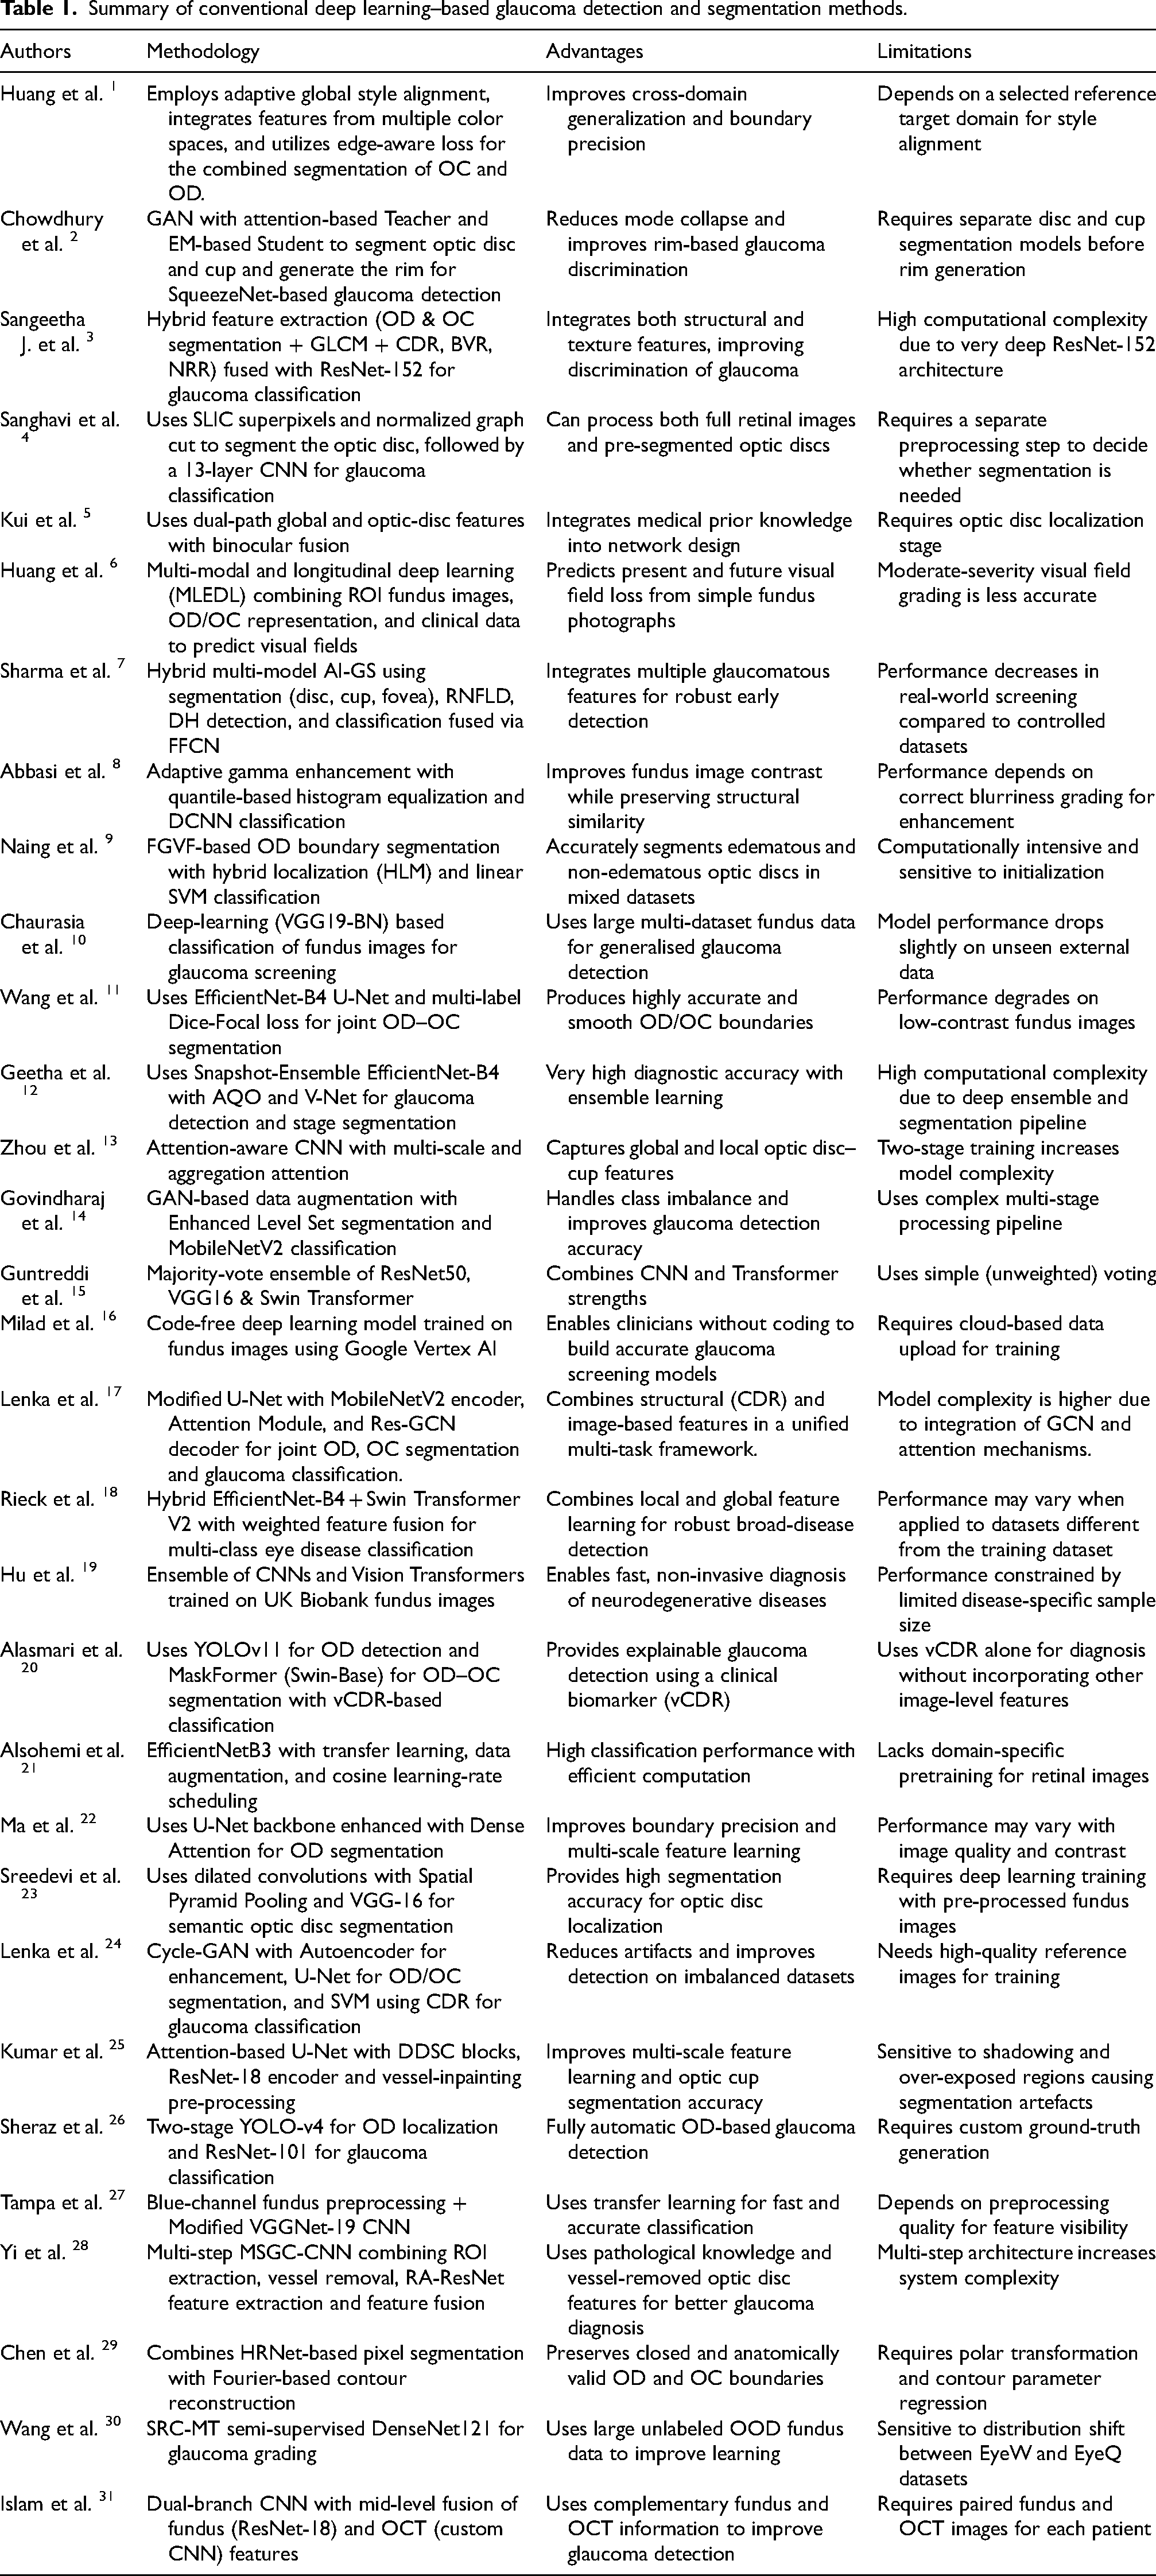
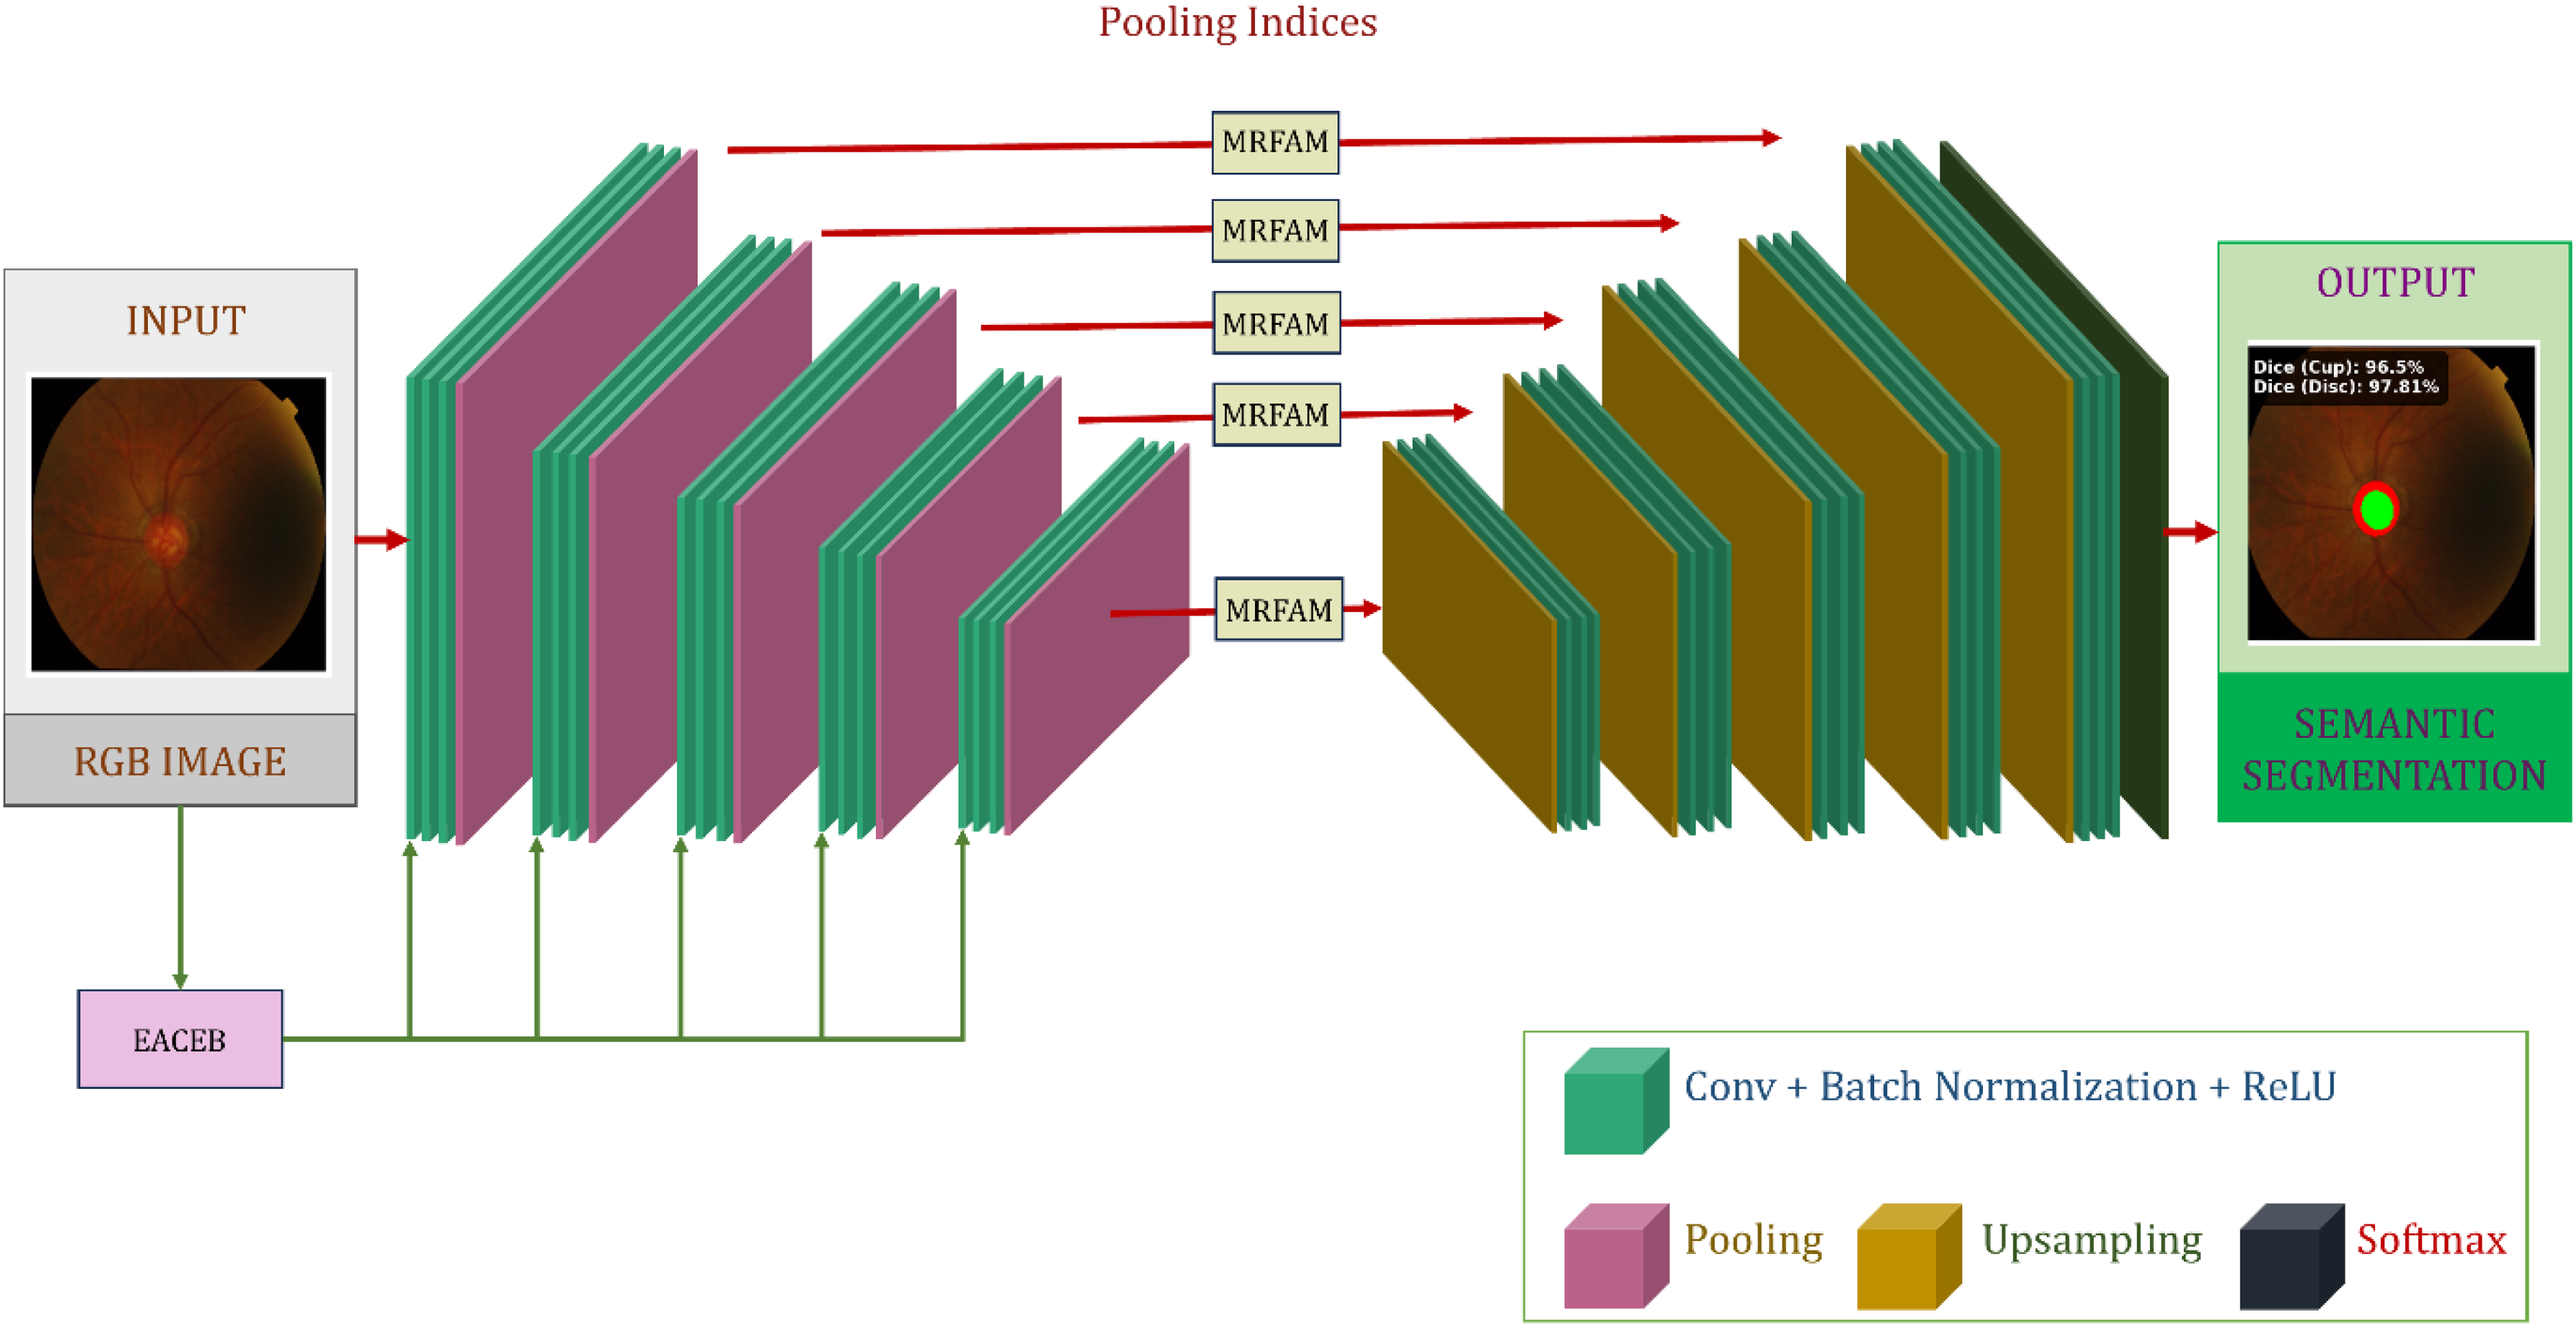
The proposed system is developed as a unified and fully automated framework for glaucoma screening, performing sequential processing of retinal fundus images through several tightly coupled computational stages, as depicted in Figure 1. In the first stage, color fundus images from three benchmark datasets enter a preprocessing module, where illumination imbalance, contrast degradation, and noise artifacts are countered via green-channel enhancement, contrast-limited adaptive histogram equalization, edge-preserving bilateral smoothing, and dynamic intensity normalization. The processed images are then sent to the AME-SegNet segmentation network for the accurate segmentation of the optic cup and optic disc at the pixel level while leveraging multi-scale contextual information. The segmented anatomical regions are then exploited to calculate deep feature representation vectors embedding structural and spatial attributes and pertinent to glaucoma assessment. Due to differential discriminative power of the attributes so extracted, an intelligent Bitterling Colony Optimization strategy is employed to discover and retain the most informative feature subset, with consequent proceeds into improved compactness and generalization. These optimized feature vectors then serve as input for a convolution-transformer classifier, which elegantly reconciles local convolutional responses with global self-attention modeling to the task of distinguishing glaucomatous from normal eyes. Greatly facilitating the reliable convergence and optimum prediction capabilities is the Honey Badger Algorithm, which is incorporated to automatically tune the learning and architectural parameters of the classification model. Thus, the synchronized workflow—from data acquisition and enhancement to segmentation, feature refinement, and final decision making—guarantees that the proposed framework is a strong and highly accurate solution for automated glaucoma detection.
Block diagram of the proposed AME-SegNet based glaucoma diagnosis framework.
Datasets description
To validate a glaucoma diagnosis framework under different imaging conditions, RIM-ONE, Drishti-GS1, and ORIGA-Light, all of which are popular public databases of retinal images, were employed. All of these datasets are composed of color fundus photographs centered at the optic nerve head, so they can be used for segmentation of the optic disc-cup and glaucoma diagnosis.
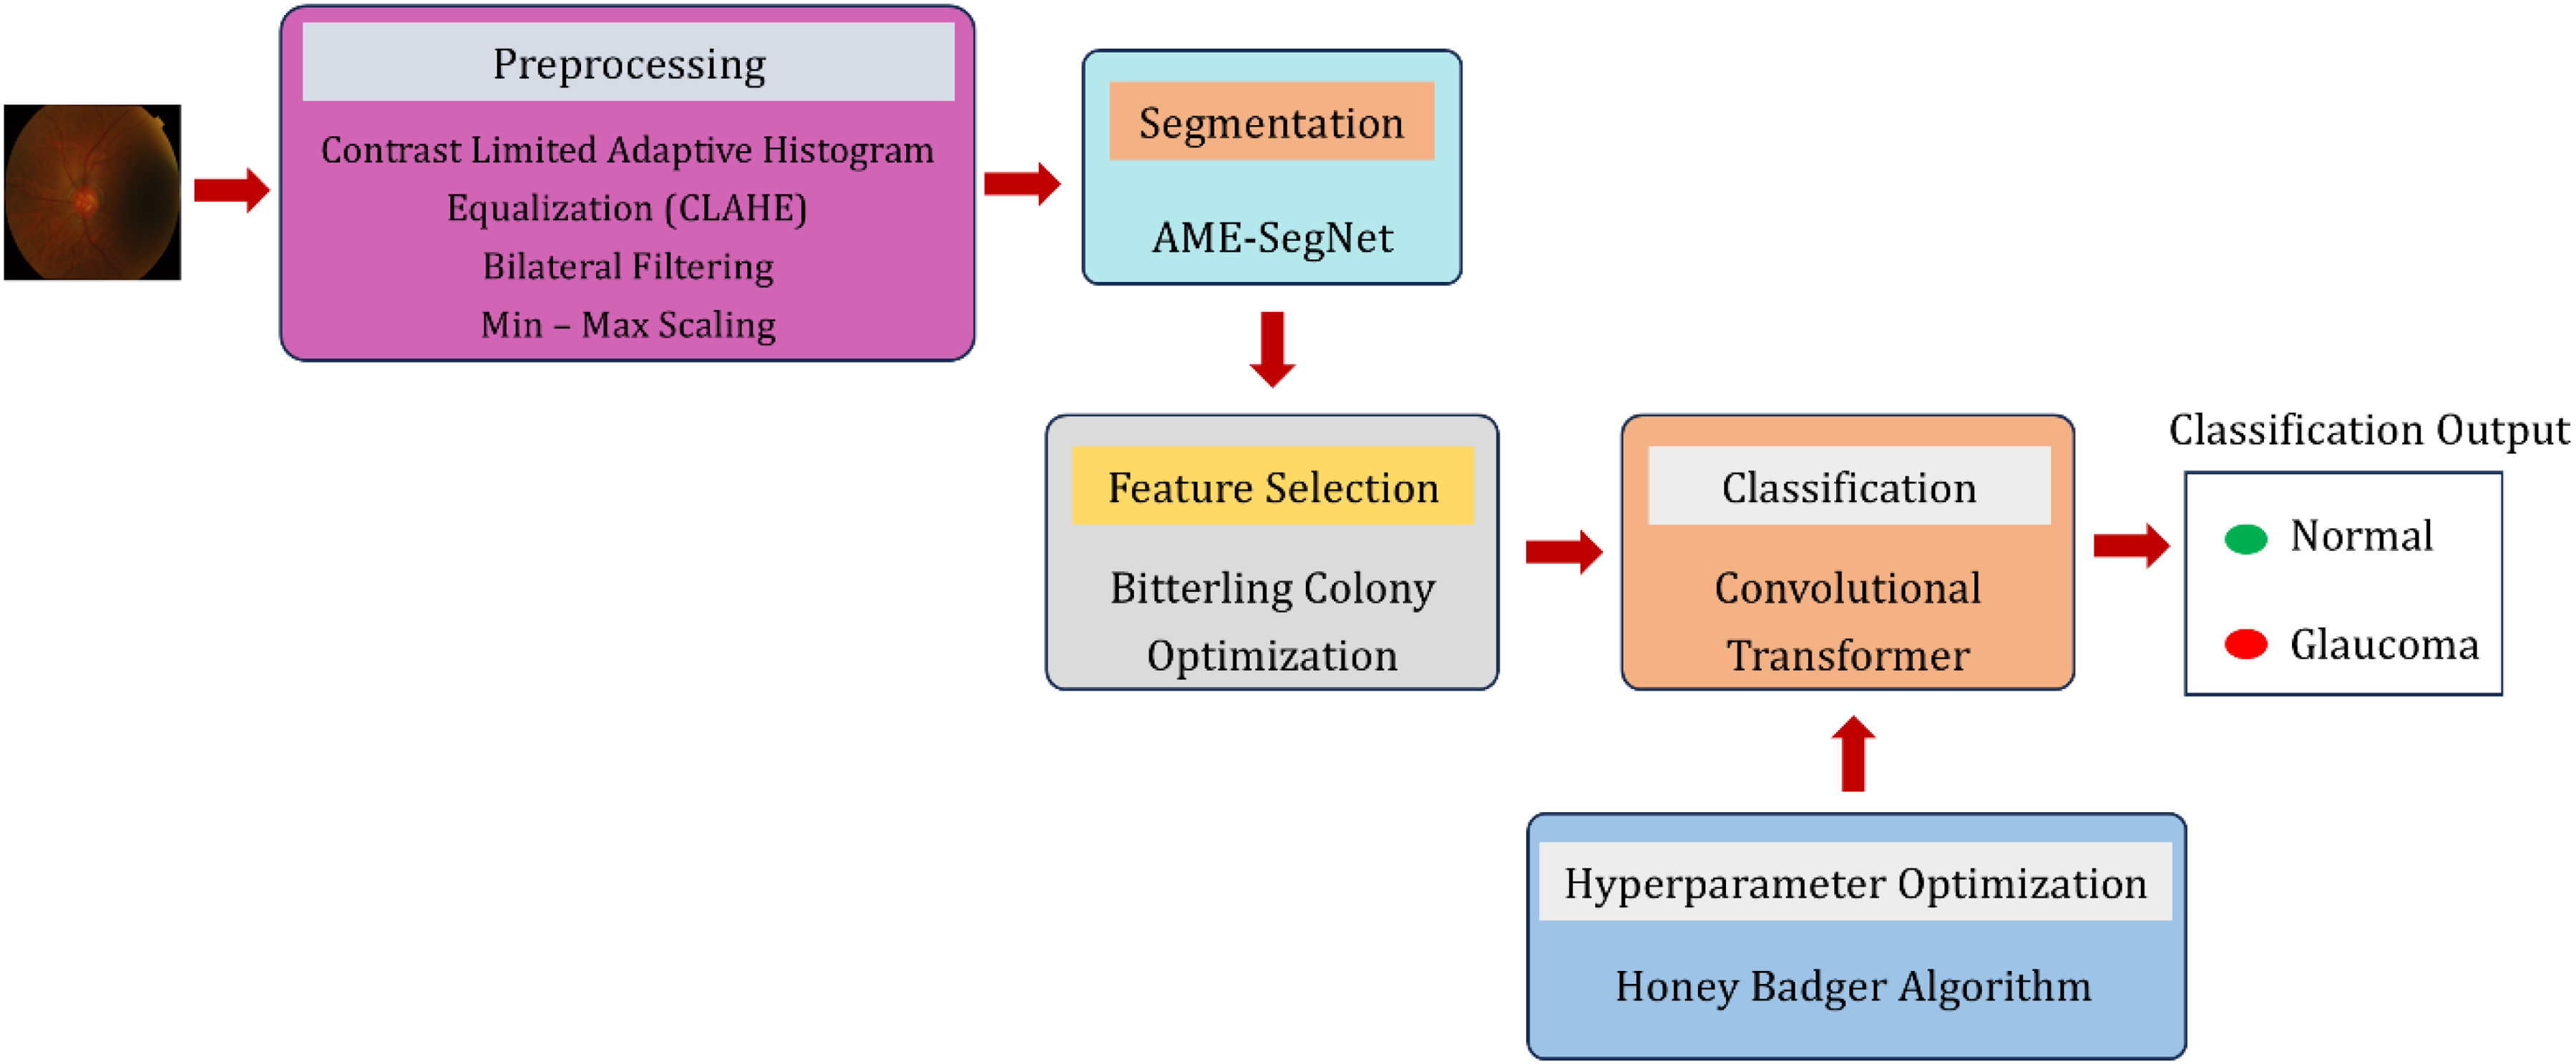
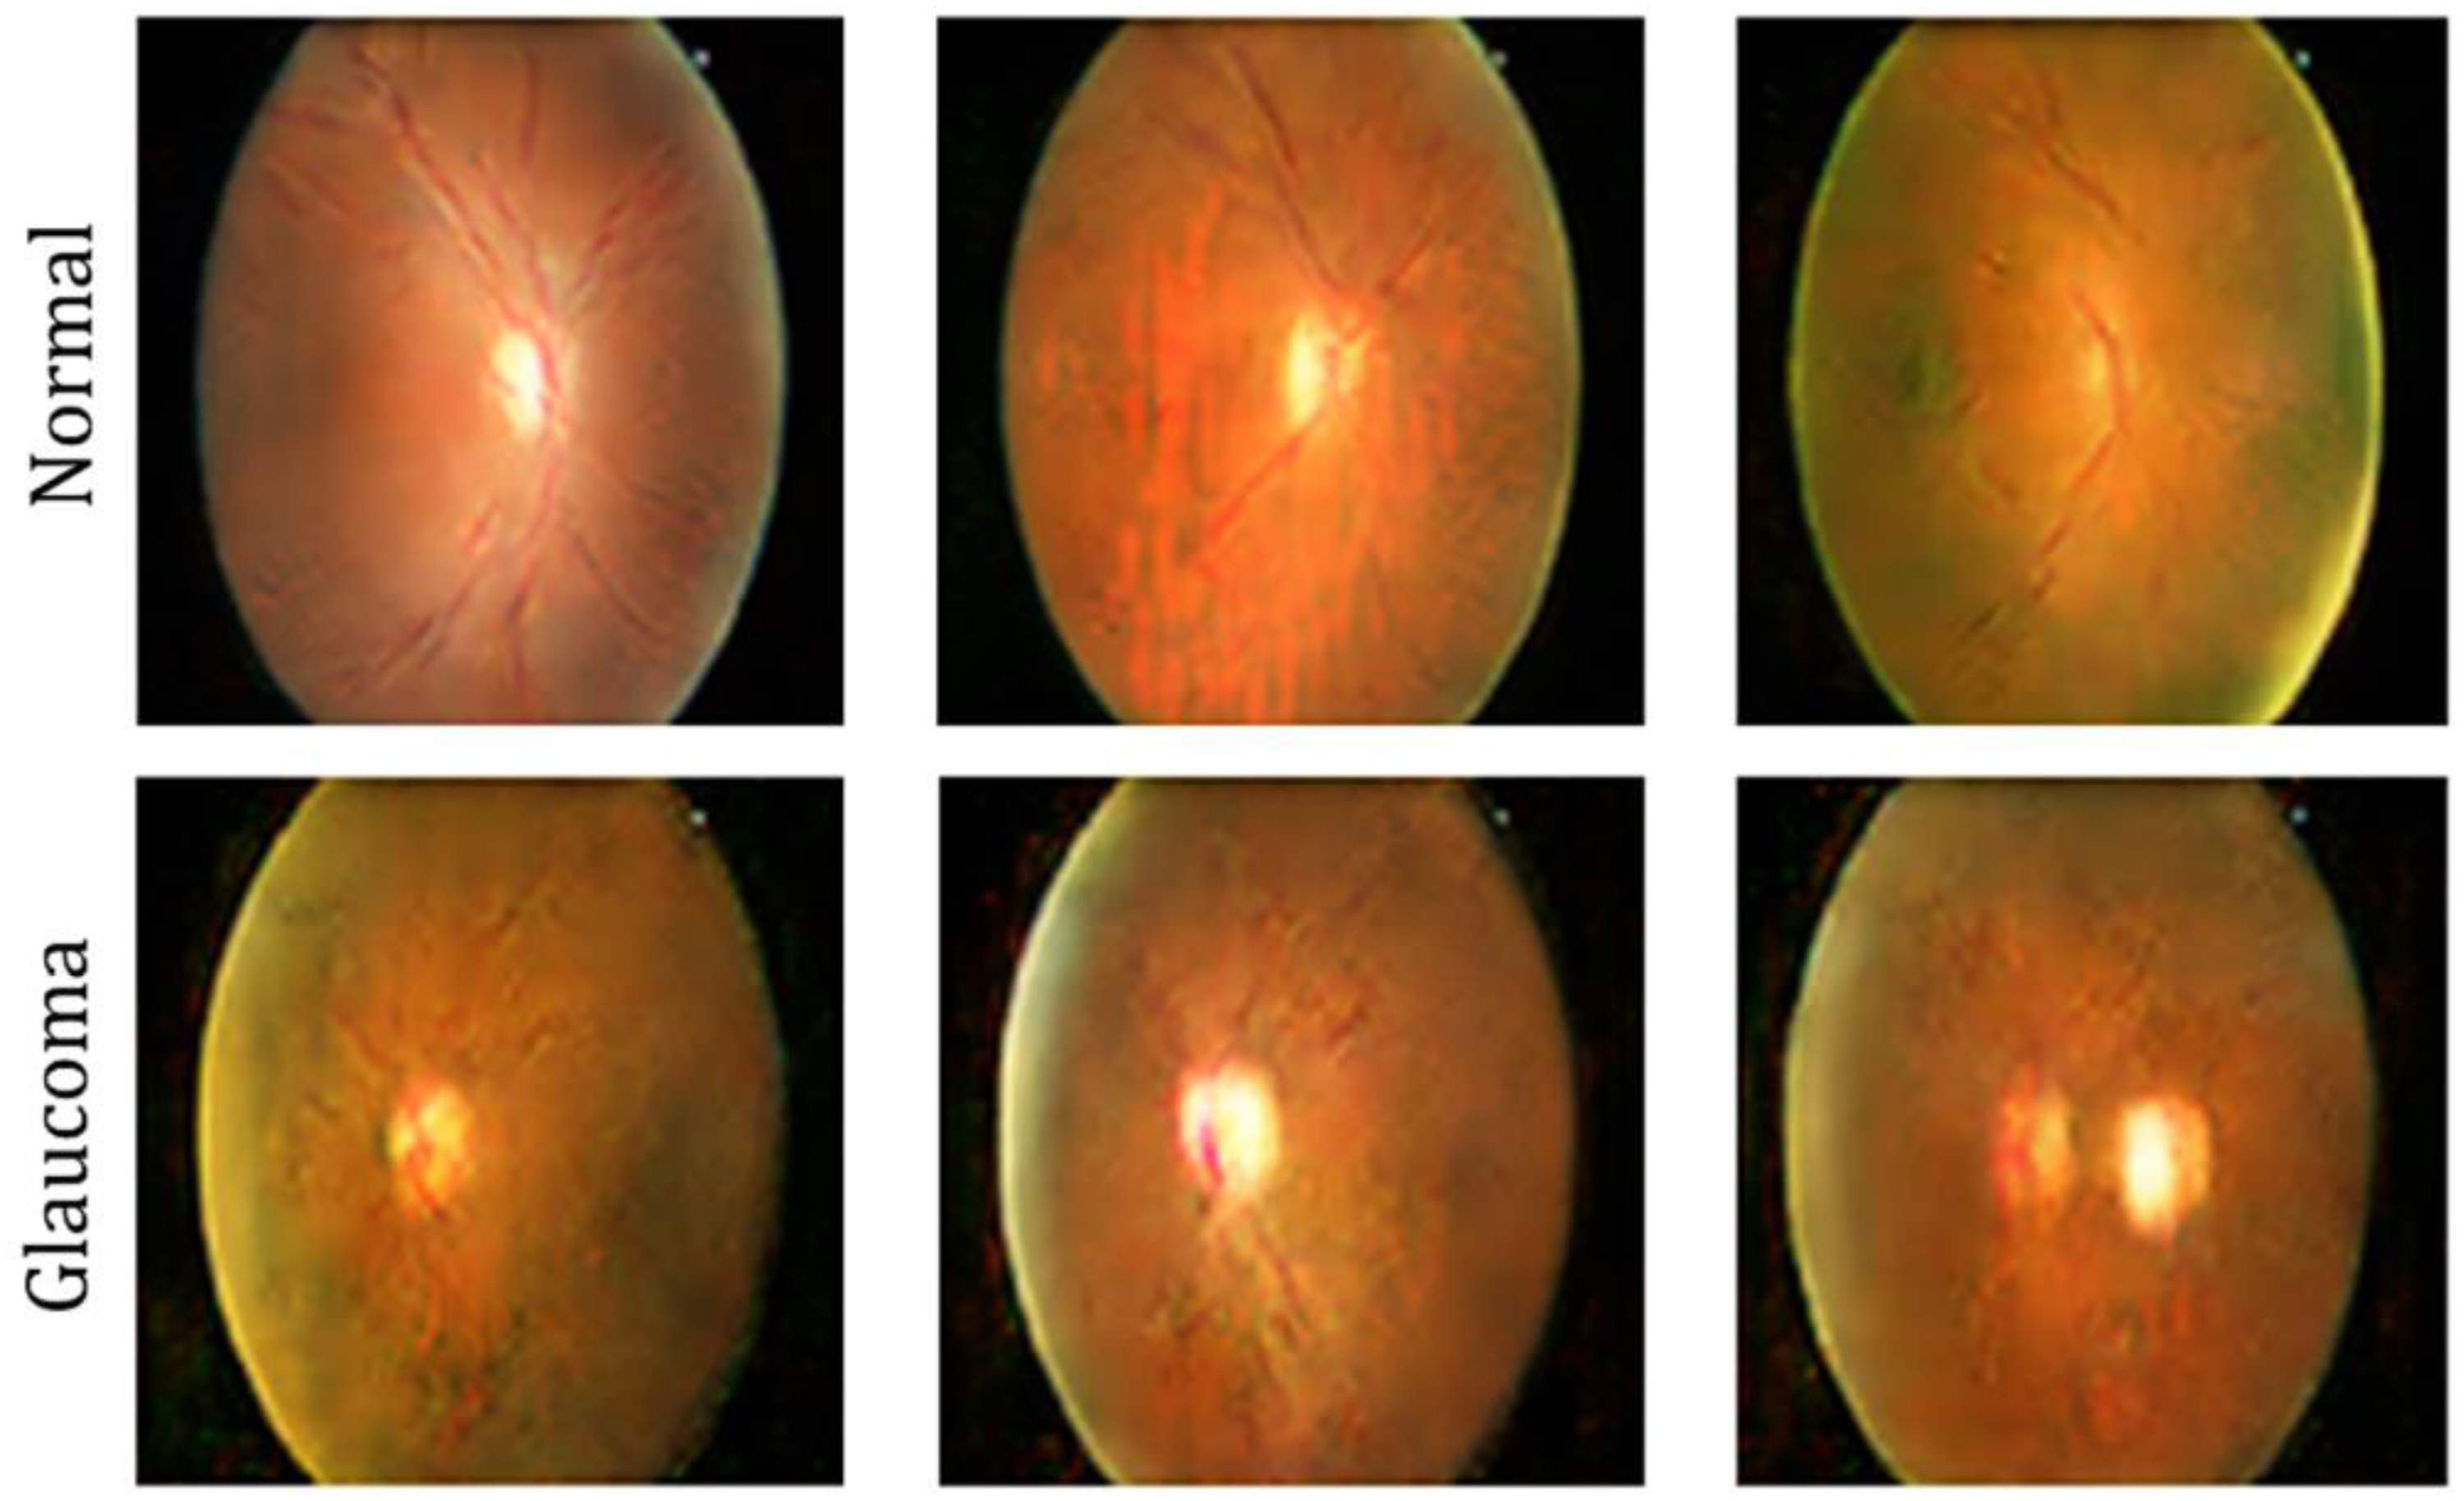
The Drishti-GS1 sample set 42 has 101 images of high-quality retinal fundus images that were taken under clinical conditions and were graded by a professional ophthalmologist as shown in Figure 2. The images were divided into 50 and 51 samples for training and testing, respectively, including healthy and glaucomatous images. Besides class labels, ground truth is available for this dataset at a pixel-level for optic disc and cup, useful for accuracy measurements. The spatial resolution of the images is such that they capture very fine structural details around the optic nerve head, critical for judging cup-to-disc variations.
Drishti-GS1 sample image.
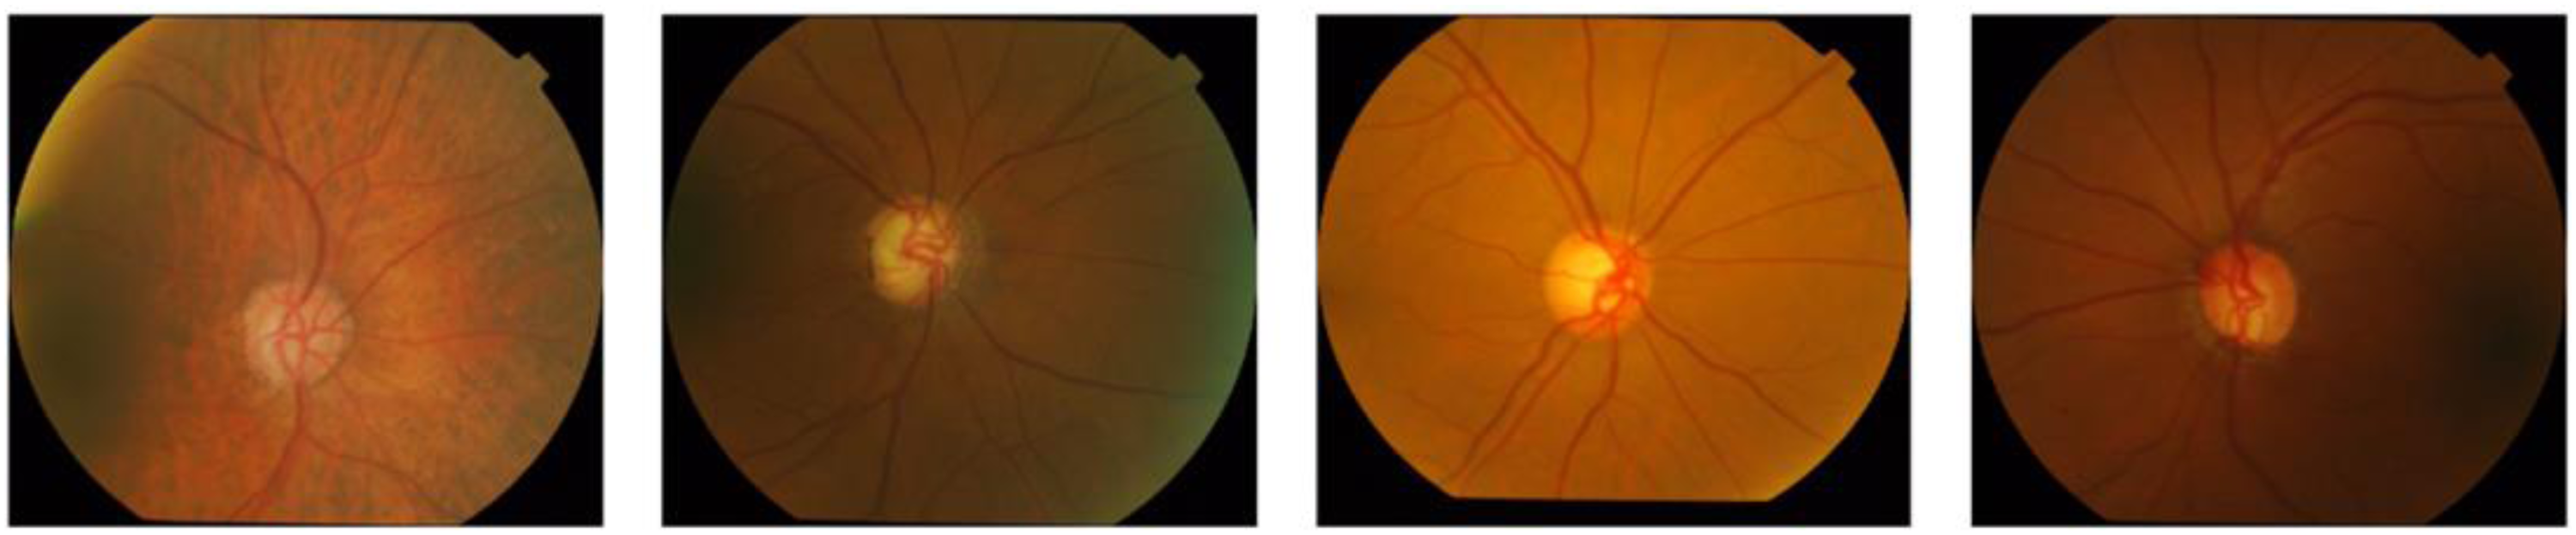
The RIM-ONE dataset 43 consists of 169 retinal fundus photographs of normal and glaucoma-affected eyes as shown in Figure 3. This dataset also contains manual annotations of the optic disc and optic cup masks that ensure a reliable evaluation of segmentation-based algorithms. Images are equally distributed among the two diagnostic classes and are acquired at a consistent imaging quality and resolution, making it a good benchmark for both region delineation and disease classification methods.
RIM-ONE dataset sample image.
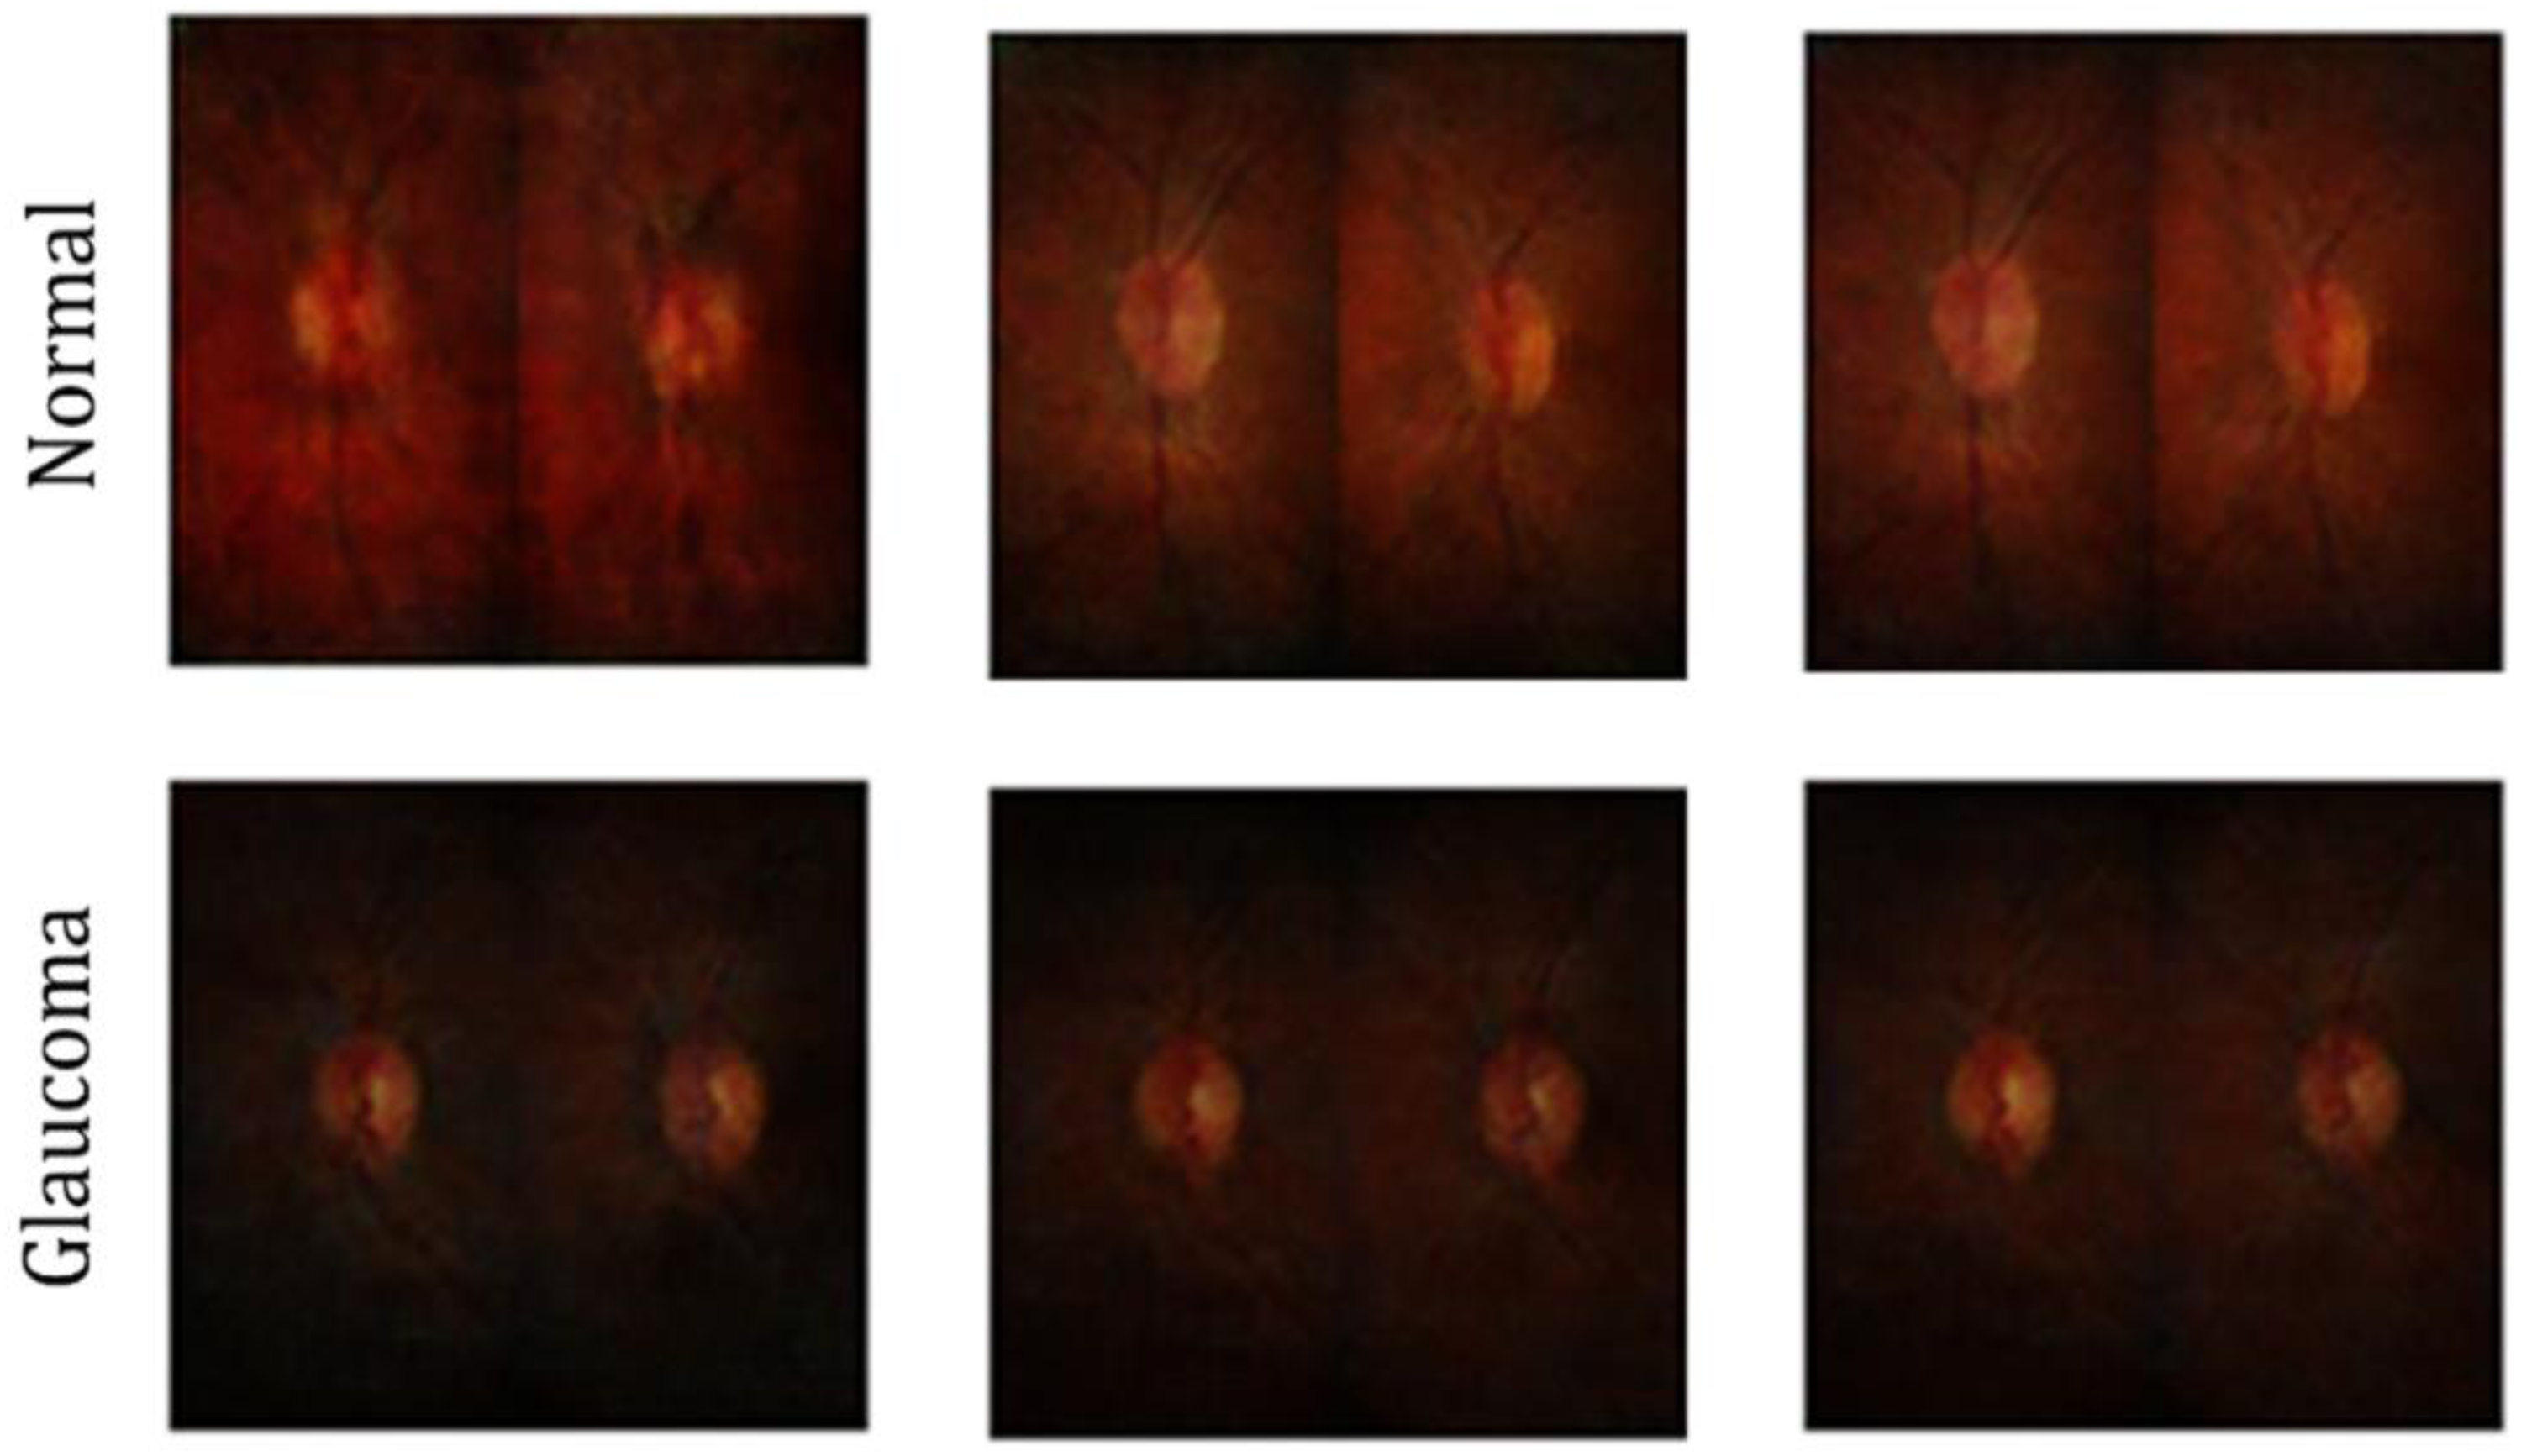
The ORIGA-Light database, 44 the larger and more diverse set, contains 650 fundus images, each labeled with regard to clinical glaucoma status as shown in Figure 4. Along with the diagnostic labels, this database also provides expert-generated ground truth for the segmentation of the optic disc and optic cup for in-depth structural analysis. Compared with the other two databases, ORIGA-Light shows greater variations in optic nerve head appearance, image contrast, and illumination, making it especially useful for training and validating deep learning models in real-world screening scenarios.
ORIGA-Light DatasetSample image.
All data sets used in this analysis are publicly available on Internet and without restrictions on access. The retinal fundus image datasets used for glaucoma segmentation and classification can be collected from Kaggle using the following link https://www.kaggle.com/datasets/ayush02102001/glaucoma-classification-datasets. This repository organizes public glaucoma fundus image datasets and contains annotated images, which are appropriate-for optic disc and optic cup segmentation, as well as glaucoma classification purposes. All of these datasets were used strictly for research purposes as their original licensing and usage guidelines permit. Moreover, this research would not use any private or proprietary clinical data at all.
The optic disc and optic cup segmentation in this work is a fully automated process performed with the help of the proposed AME-SegNet framework, while the ground-truth reference masks used for training and evaluation are obtained from expert-annotated public datasets. More specifically, the Drishti-GS1 databases provide pixel-wise delineation of the optic disc and optic cup created by well-trained ophthalmologists who followed standard clinical protocols for these delineations. Thus, these expert annotations serve for the gold standard of supervising the learning process and objectively evaluating segmentation accuracy. During the training process, each fundus image is associated with the corresponding masks of the disc and cup provided by the expert. The AME-SegNet network will learn to map the preprocessed retinal image with these anatomical labels through supervised learning. No manual intervention during prediction will be needed by this model, which will perform an automatic pixel-level segmentation of the optic disc and the optic cup on images never before encountered. Human involvement will not be required during inference, thus ensuring consistency, reproducibility, and scalability for large-scale screening.
It consists of the following segmentation stages: (i) preprocessing for disc-cup visibility enhancement, (ii) deep segmentation based on AME-SegNet giving probability maps for cup and disc, and (iii) thresholding and classifying using softmax leading to binary mask generation. These predicted masks are used in measuring clinically relevant indicators such as cup-to-disc ratio and in anatomical feature extraction for glaucoma classification. This extremely linear pipeline ensures that segmentation is clinically-grounded through the use of expert labels and computationally automatable through deep learning, thus bringing reliable and impartial anatomical measures for glaucoma detection.
Image preprocessing
The process of segmentation and classification comes after fine processing of retinal fundus images through a well-designed preprocessing pipeline dedicated to enhancing diagnostically important structures while suppressing irrelevant variations. This is done through an operation applied in a predetermined fixed manner such that all stages apply to one another, thus ensuring that each stage outputs stable and informing inputs into the learning model.
Green channel extraction
A color fundus image is derived from the red, green, and blue components, each responsible for different tissue responses. Among these, the green channel has the maximum contrast to display retinal vessels, optic disc margins, and the optic cup due to the preferential absorption of green by hemoglobin as compared to red or blue light; in other words, it delineates anatomical boundaries in contrast with reduced background saturation. Let 
Contrast enhancement using CLAHE
The extracted green image goes under Contrast Limited Adaptive Histogram Equalization to overcome the effects of non-uniform lighting and local intensity compression. In contrast to standard histogram equalization techniques aimed at adjusting global intensity distribution, CLAHE functions in small contextual regions and minimizes noise amplification in the image by clipping the histogram at an acceptable predetermined threshold. For a local window W, the cumulative distribution function 
Noise reduction using bilateral filtering
After contrast adjustment, the minor noise artifacts and texture variations would still be present. The bilateral filter reduces these, smoothing spatially while preserving edges. The value of the filtered pixel at the location p is computed in Eq. (3).
47

Min–max normalization
Finally, scaling the resultant image to a standard numerical range allows the input values to be equally proportioned during the network learning phase. Normalization occurs according to Eq. (4) with an image
AME-SegNet architecture
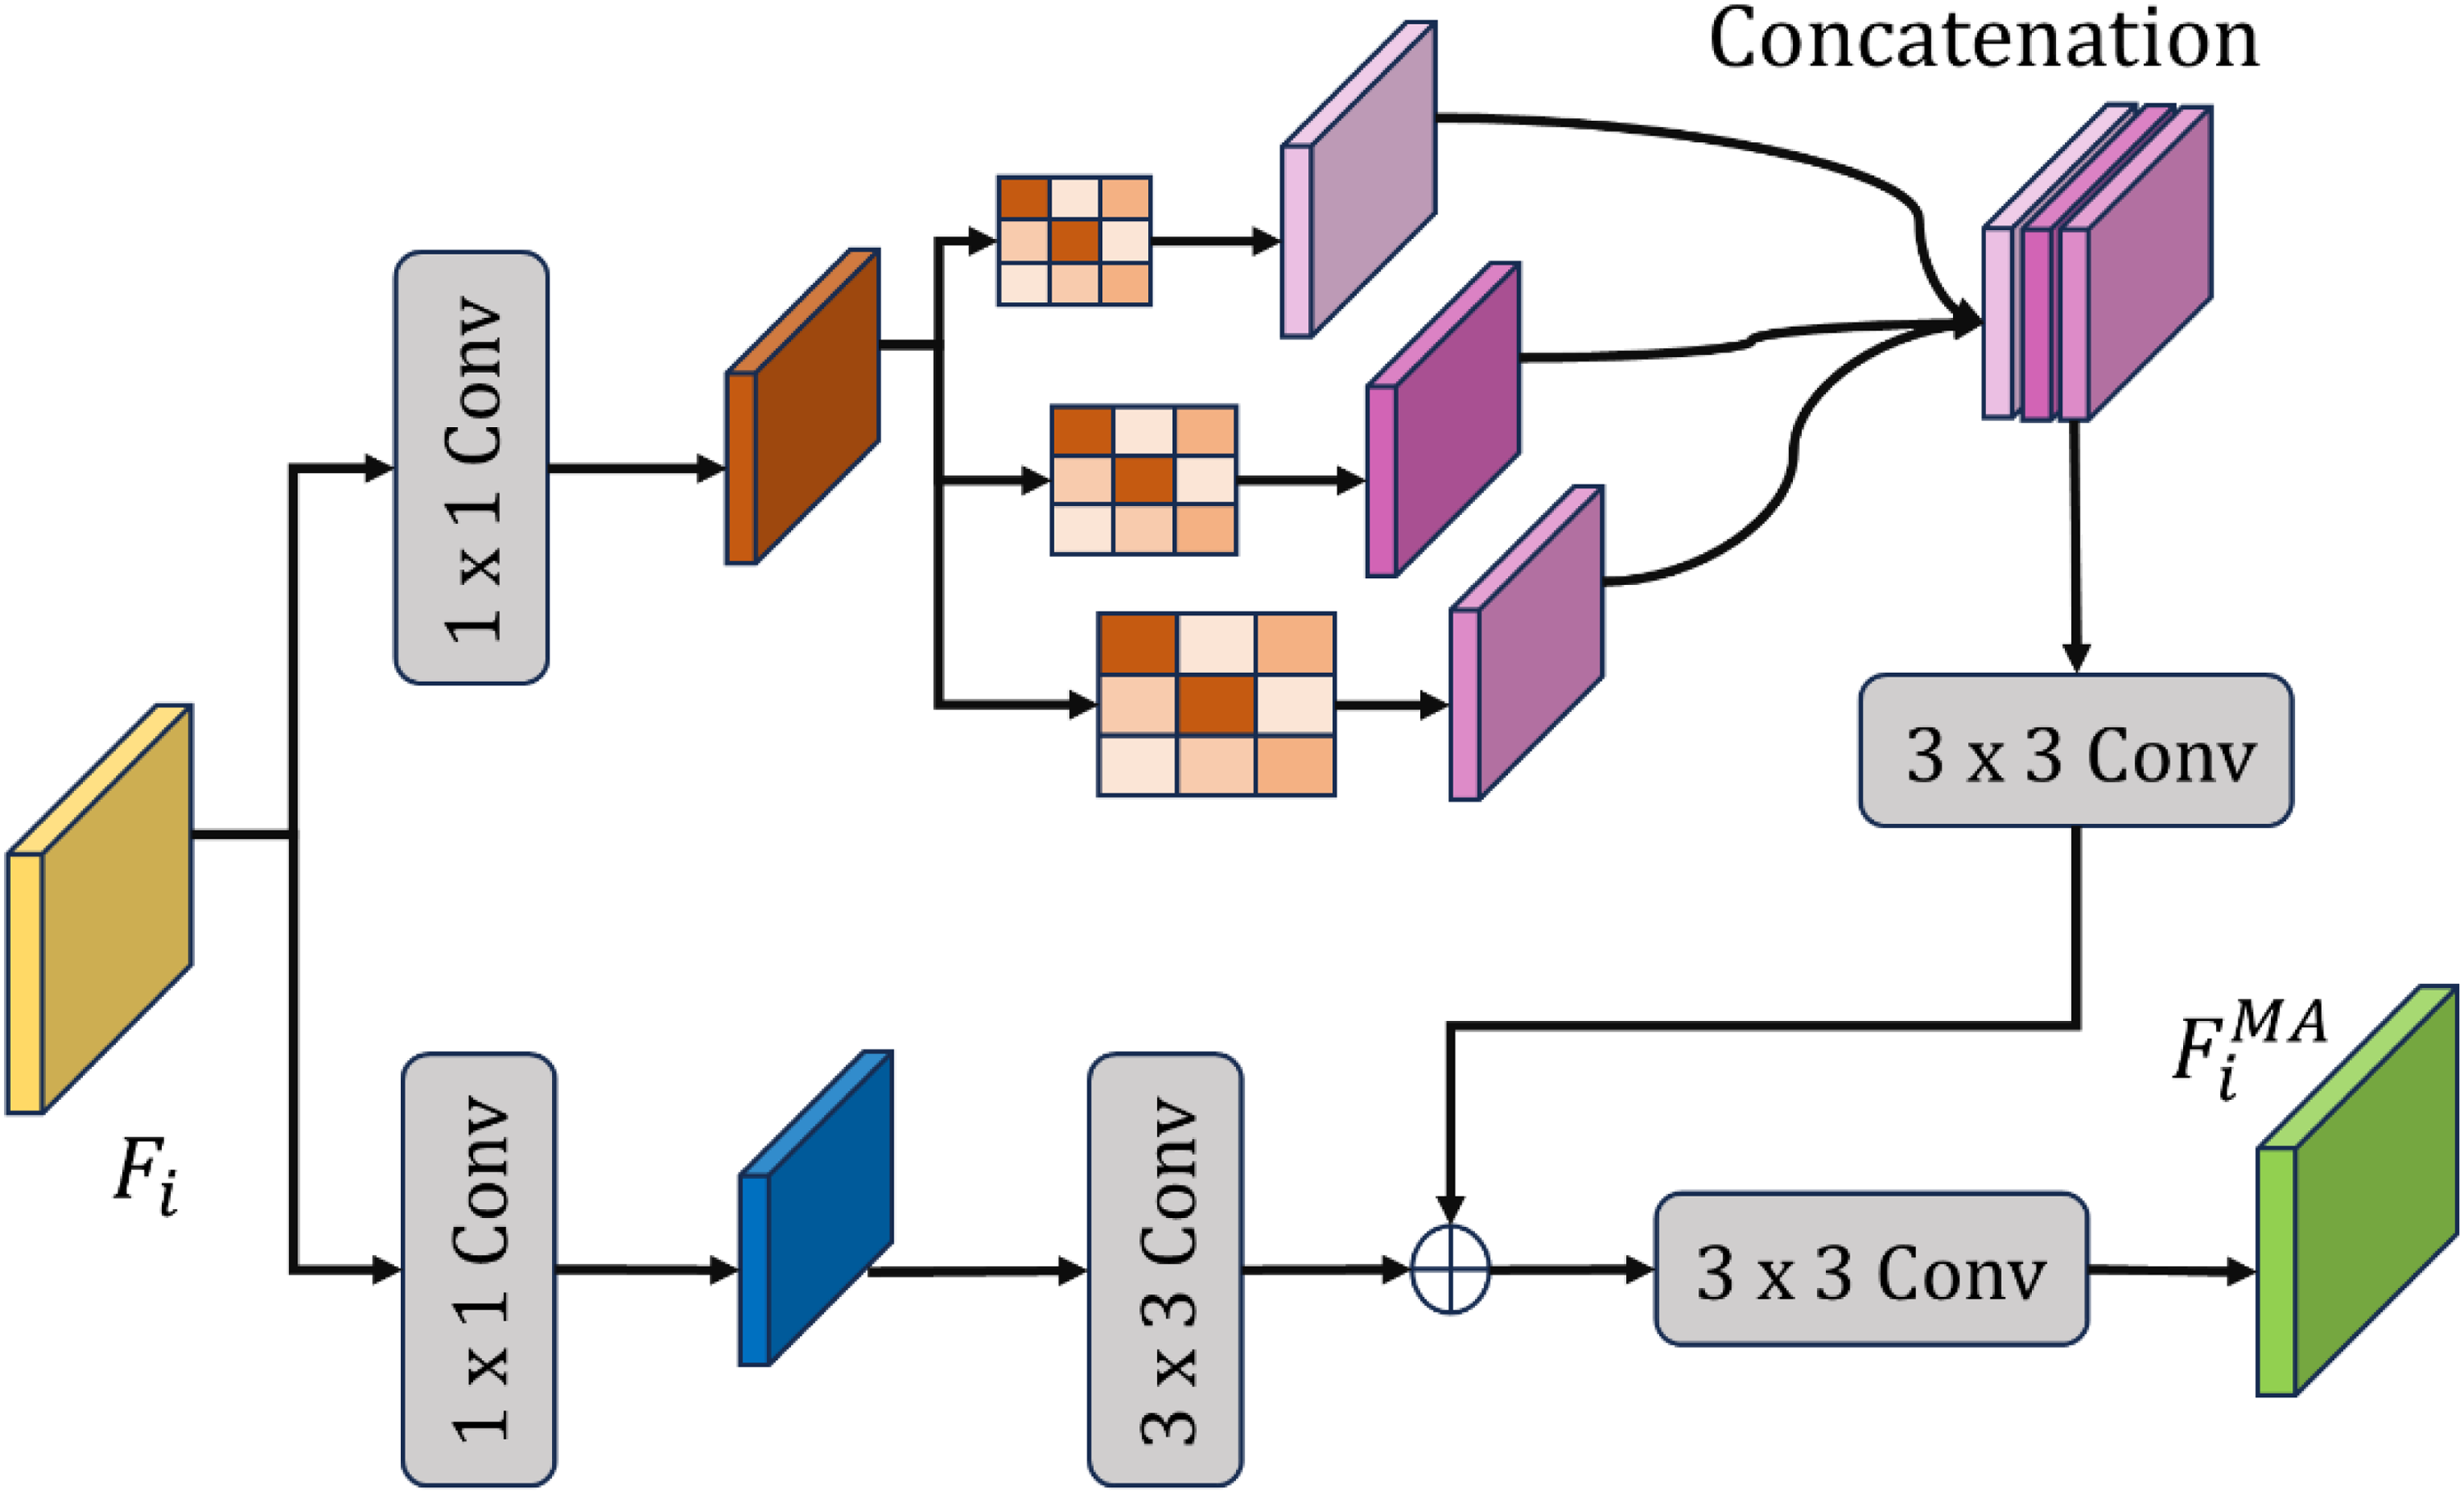
The AME-SegNet model has been designed as a retinal structure segmentation network specifically capable of distinguishing fine cellular differences between the optic disc and optic cup. Unlike conventional encoder-decoder networks that treat all features uniformly, the proposed architecture implements a scale-adaptive boundary-aware strategy for enhancing regional discrimination. The entire design of the AME-SegNet pipeline, comprising the encoder, decoder, and embedded enhancement modules, shows the respective implementation of Figure 5. 48
Encoder–decoder backbone of the proposed AME-SegNet architecture.
Base SegNet backbone
The AME-SegNet backbone is a symmetric encoder-decoder structure with a gradual reduction in spatial resolution for extracting abstract representations, which are later reconstructed for pixel-level predictions. We denote the input retinal image as 

In the decoder, instead of relying on interpolation for up-sampling, indices are kept and used. The unpooling operation reconstructs the feature maps using Eq. (7):
Multi-Resolution feature aggregation module (MRFAM)
The optic disc and optic cup have a large difference in size and texture, and any representation of both structures in a single-scale convolution is insufficient. Accordingly, the Multi-Resolution Feature Aggregation Module (MRFAM) processes the incoming features through parallel convolutional streams of which the operation is performed at different receptive field sizes-as shown in Figure 6. MRFAM applies several parallel convolution operations with input feature map F and kernel sizes of 
Multi-Resolution feature aggregation module (MRFAM).
While small kernels are used to capture fine local detail useful in the identification of the optic cup boundary, larger kernels provide more spatial context needed to detect the optic disc. The concurrent multi-scale responses are concatenated using Eq. (9):
The features are then compressed with an additional convolving operation in a process described in Eq. (10):
This multi-resolution fusion allows the network to view small and large structures at once, ensuring that neither small cup nor large disc regions are lost. The architecture of the multi-scale processing block is illustrated in Figure 6.
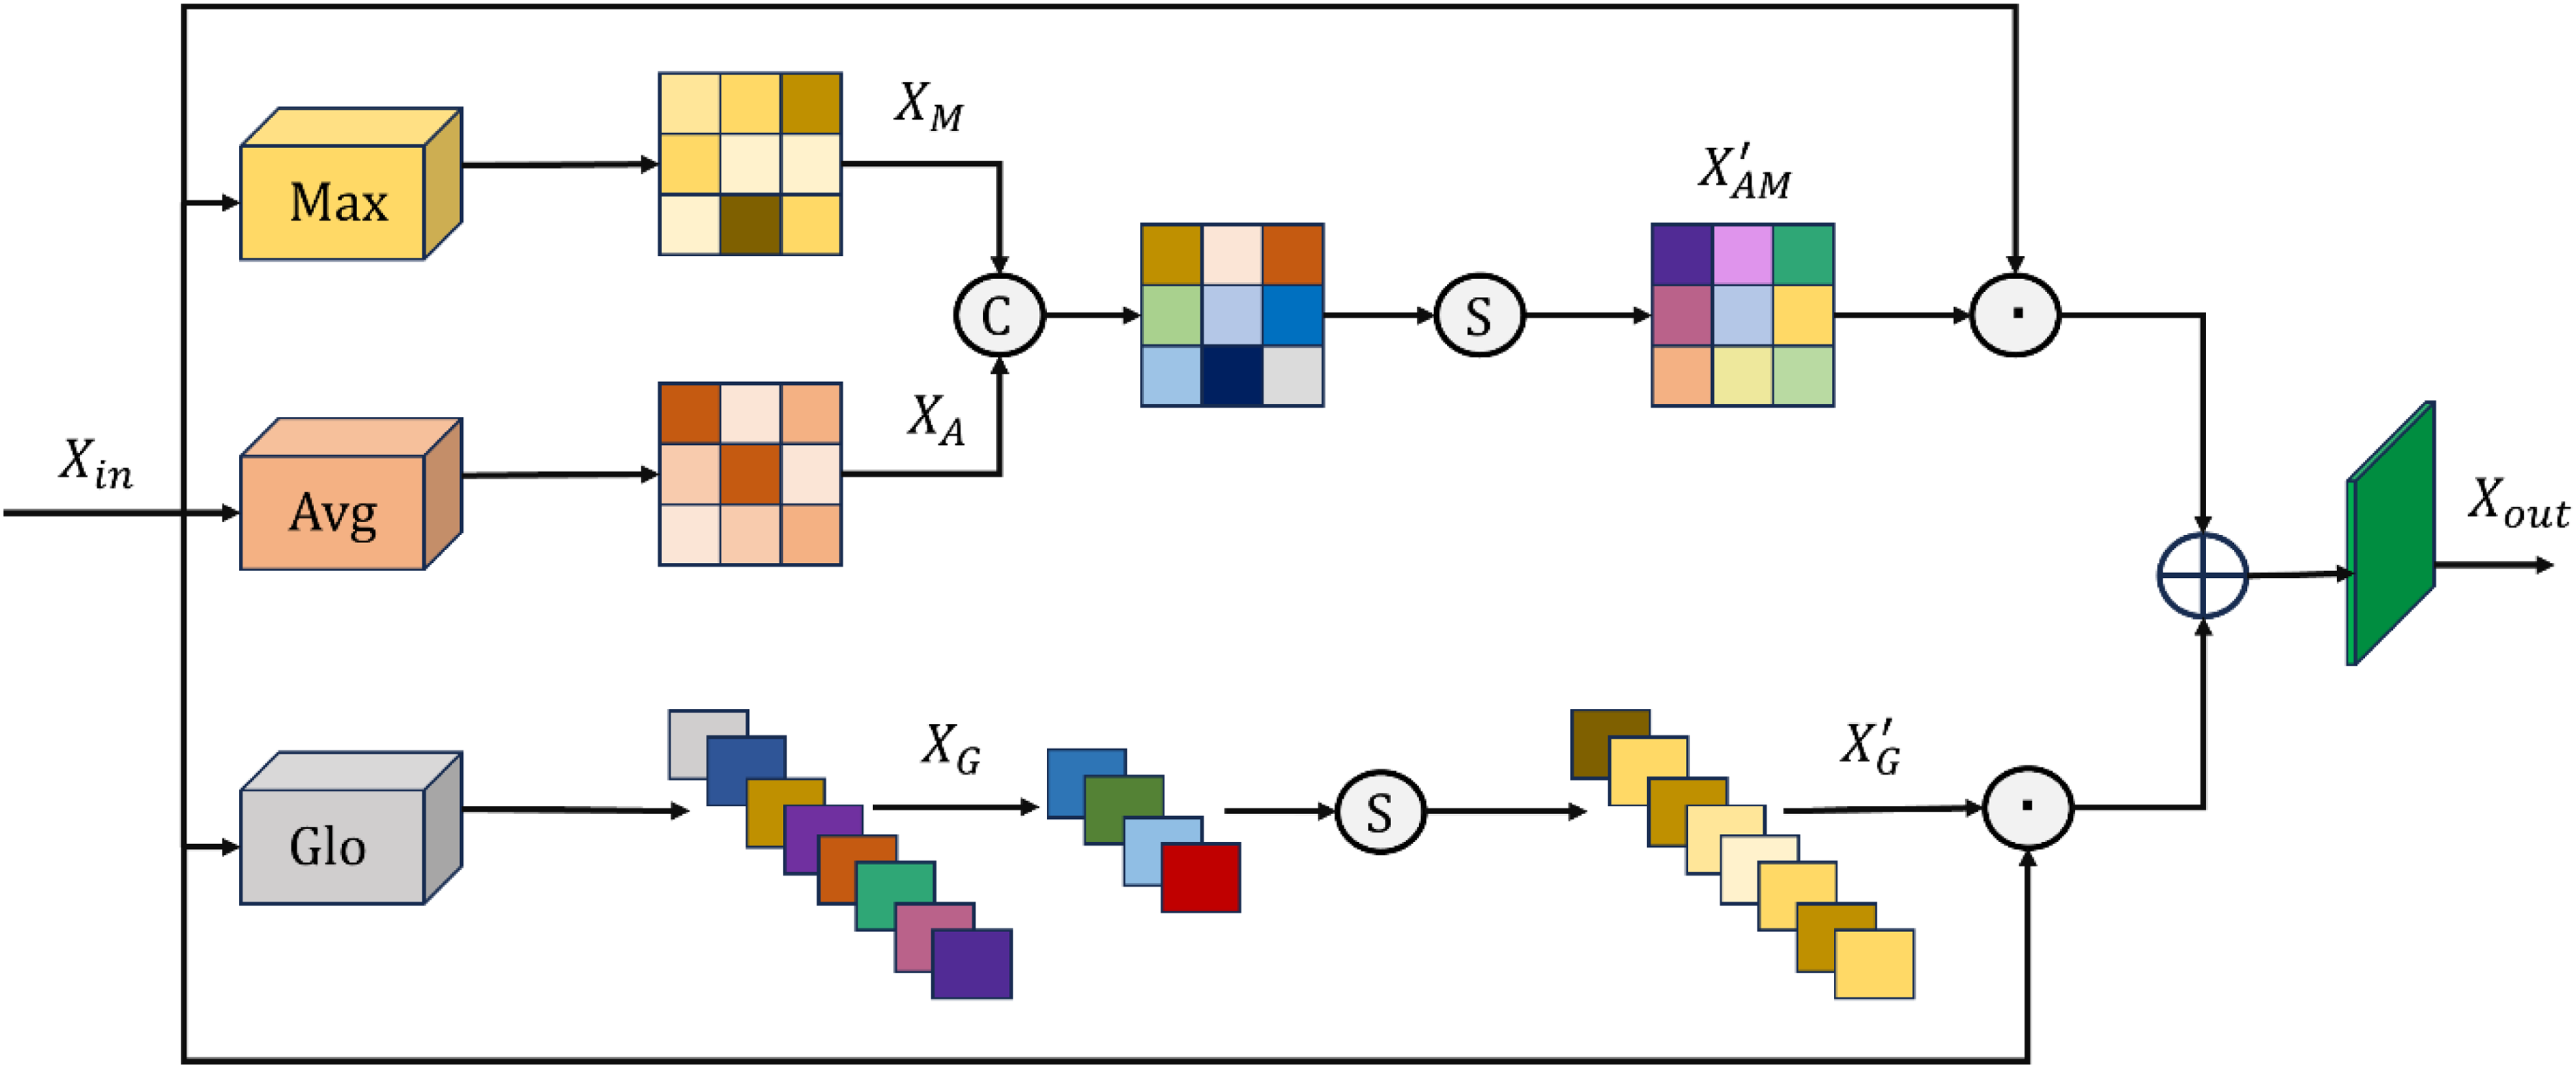
Edge-Aware context enhancement block (EACEB)
The boundary of the optic disc and optic cup is usually very faint owing to smooth intensity transitions and overlapping tissue appearance and poses a challenge to accurate separation. The Edge-Aware Context Enhancement Block (EACEB), as depicted in Figure 7, is embedded in the encoder path to strengthen these ambiguous areas.
Structure of the edge-aware context enhancement block (EACEB).
EACEB uses both spatial and channel-wise attention in its feature computation so as to amplify the pixels corresponding to anatomical borders; it starts by extracting global and local statistics using average and max pooling, given the feature map F to obtain using Eq. (11)
These descriptors get combined together and passed through a gating function to produce an attention map in accordance with Eq. (12)

Final segmentation output
After the decoding process and subsequent refinement, AME-SegNet outputs two probability maps corresponding to the optic disc and optic cup. A softmax function assigns each pixel a class likelihood according to Eq. (14):
From which
Feature extraction from segmented regions
The AME-SegNet model, when successfully separated from the optic disc and optic cup, allows the extraction of meaningful numerical descriptors from these areas, helping towards glaucoma classification. The anatomical regions are the focus of the framework rather than the raw image itself. The model represents structural and pathological changes associated with the disease via features within those areas. The binary masks for the optic disc and optic cup obtained from the segmentation step comprise

In addition to deep features, geometric and morphological characteristics are also extracted to describe the physical shape and size of the segmented regions. The area of the optic disc and optic cup is computed in Eq. (18)
Each one represented by the pixel coverage of the structure. The perimeter for each of these regions is calculated by identifying the boundary pixels, thus allowing analysis into its compactness and contour irregularity. The vertical and horizontal diameter would thus be measured as the furthest distance, at those extremes, across the optic disc and optic cup, where the structural elongation is given as the ratio of the two measurements. The extracted features are finally concatenated into one feature vector in Eq. (19)
Feature optimization using bitterling colony optimization (BCO)
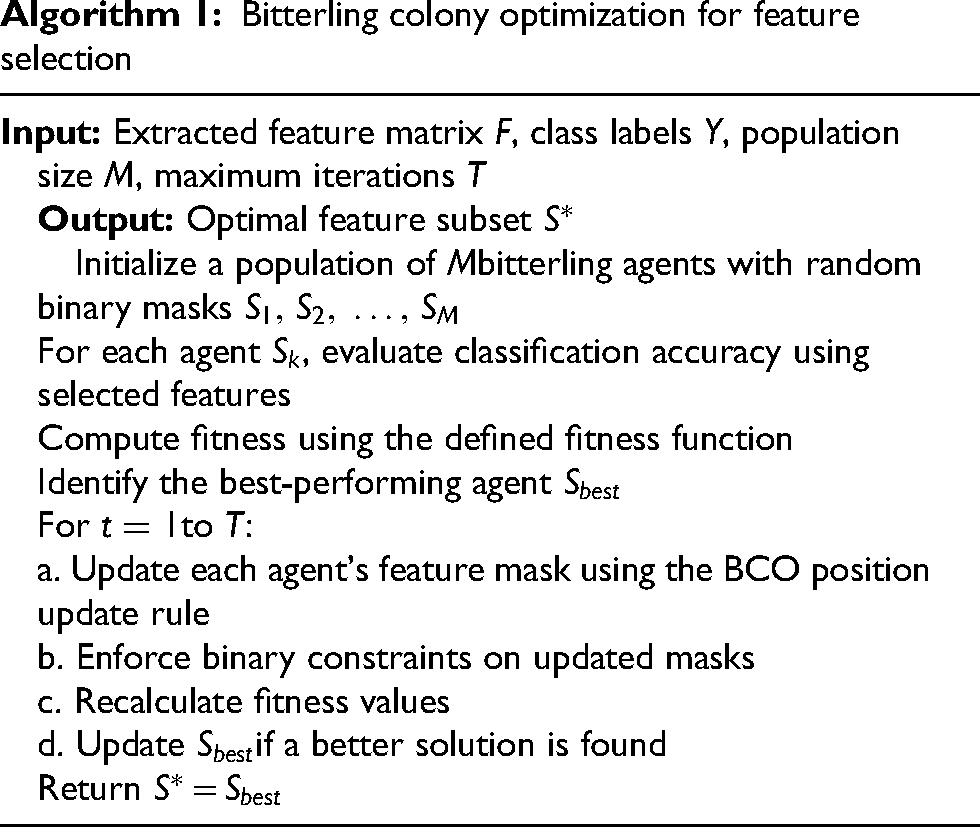
Features with ability to discriminate between glaucoma and non-glaucoma patients are derived from a considerable number of deep and region-based characteristics quantified from the segmented optic disc and optic cup. Some features may be either redundant, noisy, or weak in correlation to disease state, thereby degrading classification accuracy and significantly increasing processing costs. As a result, intelligent feature selection must be made to have very compact subset keeping maximum diagnostic information while irrelevant components get eliminated as given in Algorithm 1. Bitterling Colony Optimization (BCO) is adopted for this purpose, which is a population-based metaheuristic inspired by the collective foraging behavior of bitterling fish. 49
Let the complete extracted feature vector as given in Eq. (20).


Each agent measures its chosen feature set by developing a classifier and inspecting its predictive capability. The fitness of one solution 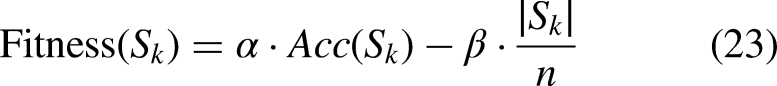
In every iteration, bitterling agents update their positions by mimicking natural exploration and exploitation behavior. Agents that do well influence the movement of the rest, and an encouraging convergence towards feature combinations thought to be promising is encouraged while allowing the search to escape local optima via random perturbation. The update rule for each agent can be expressed in Eq. (24):
The best solution found up to t iterations is denoted 
Bitterling colony optimization for feature selection
Glaucoma classification using convolutional transformer
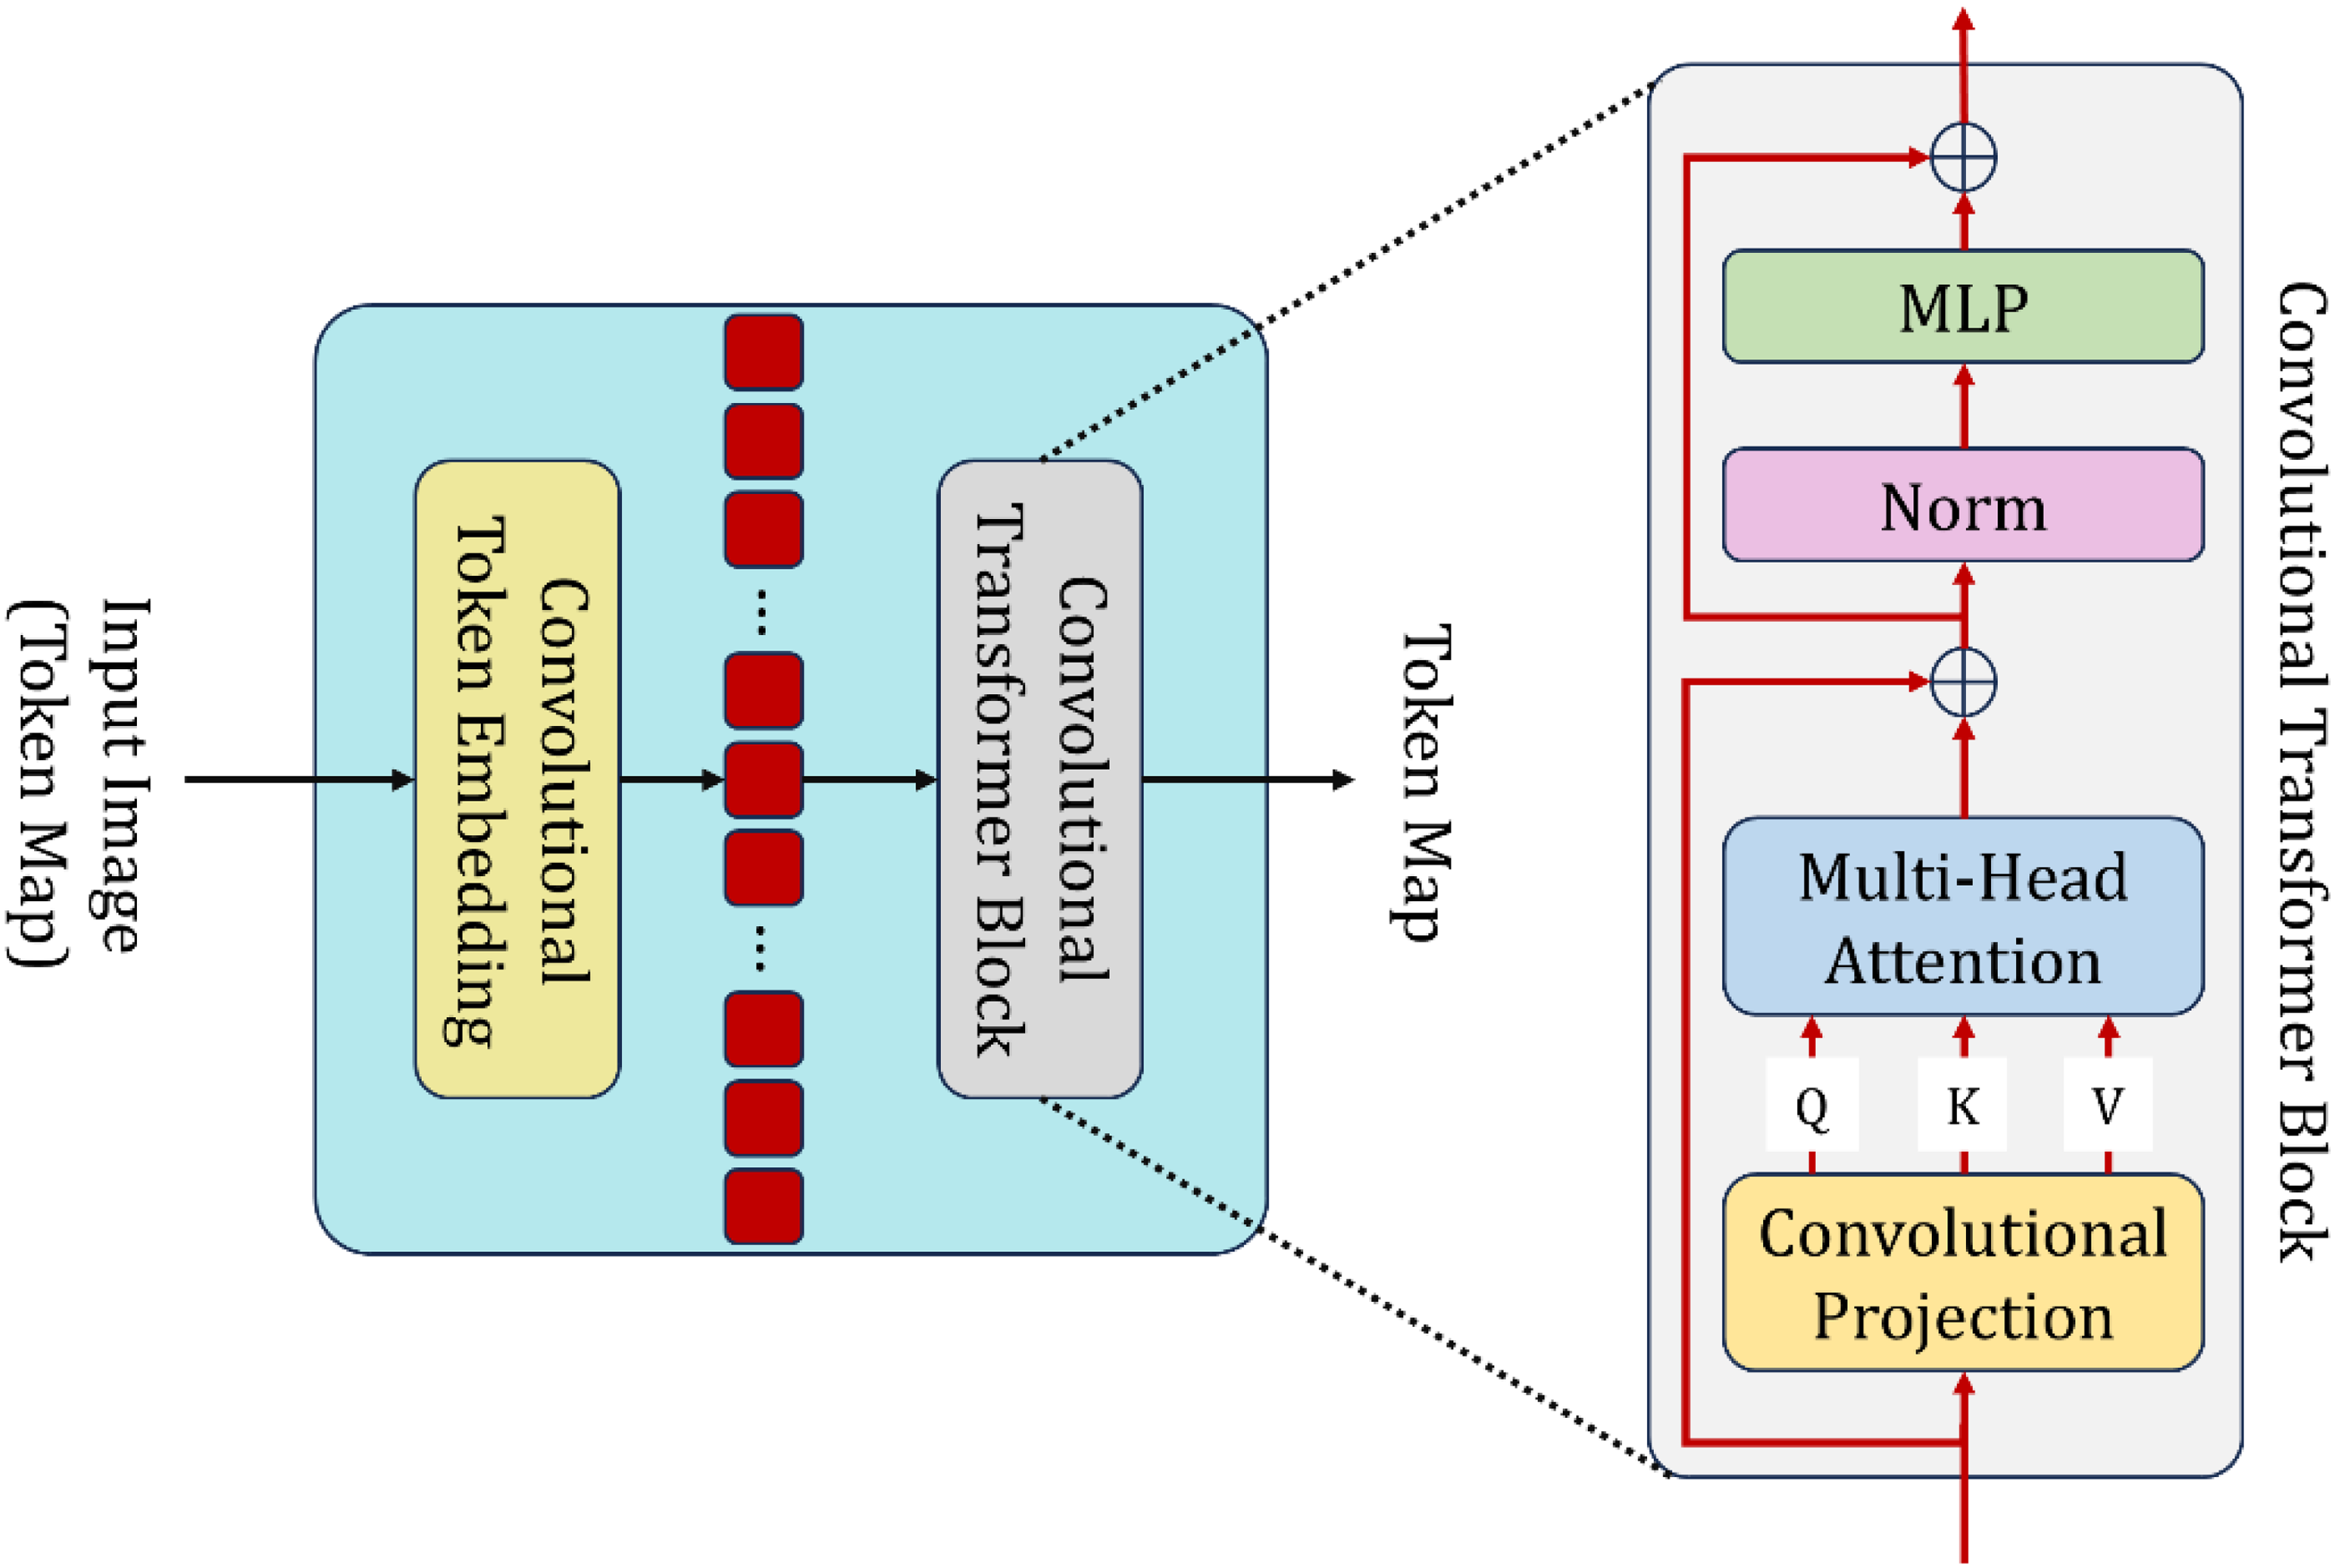
After the optic disc and optic cup segmentation followed by discriminative feature selection, refined feature vectors were forwarded to the Convolutional Transformer (CT) for the final glaucoma classification. This stage aims to learn local patterns from the retina and long-range spatial interactions imperative for distinguishing glaucomatous and healthy eyes. The Convolutional Transformer combines convolutional embedding with transformer-based sequence modeling, as shown in Figure 8. In this mix-and-match architecture, the network can conserve fine-scale spatial structure while also capturing global contextual relationships across the segmented retinal regions. 50
Architecture of the convolutional transformer.
Convolutional token embedding
Let the given feature map from the previous stage be written as indicated in Eq. (26)


This convolutional embedding ensures that structural information such as cup deformation, disc expansion, and rim thinning is retained in each token.
Convolutional transformer block
Each token sequence is processed through stacked Convolutional Transformer-block, which consists of a convolutional projection layer, multi-head attention, normalization, and feedforward learning (as shown in Figure 8).
Query–Key–Value Projection
The embedded tokens are first projected via convolutional kernels to yield query, key, and value tensors according to Eq. (29):
It is via convolutional map that one will keep neighborhood coherence instead of linear projection; thus, one can maintain local retinal structure participation in global attention of the tokens.
Multi-Head Self-Attention
Self-attention determines how strongly each token relates with every other token according to Eq. (30)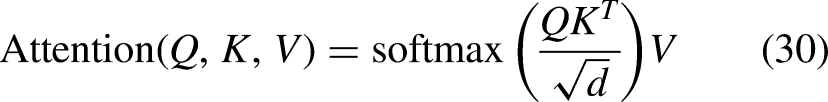
Multiple attention heads allow the model to learn extensively diverse relational patterns such as how the optic cup interacts with other regions in the disc. To form the more refined token representation, the outputs from all heads are concatenated and linearly projected as in Eq. (31)
Residual Learning and Normalization
The stable learning criterion is made possible with the addition of both residual connections and normalization as given in Eq. (32):
This preserves original information while encompassing much of the attention-based refinement.
Feed-Forward Network
Each token is subsequently processed by a multilayer perceptron (MLP) in accordance with Eq. (33)
The MLP augments the power of representation, thereby allowing the model to learn non-linear dependencies of patterns that are relevant to glaucoma.Convolutional networks are very effective in capturing the shape and edge patterns of a local texture; however, they progress at low rates in increasing their receptive fields and hence model long-distance dependencies, such as the spatial relationship between the optic cup and disc boundary.This limitation is overcome by the transformer component that allows global interaction between all retinal tokens. Meanwhile, the convolutional projections ensure that spatial coherence is not lost during attention computation. This provides an avenue where the model can detect the microscopic deformations and macroscopic structural changes, which are very important indicators of glaucoma.
Final classification
The equation (34) refers to an average of the output token sequence using global pooling to get a compact representation: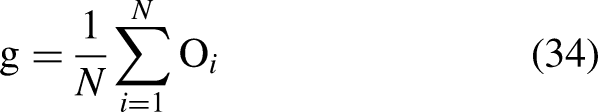
This vector is fed to a fully connected layer with softmax activation as mentioned in Eq. (35)
Here,
The predicted label is given in Eq. (36)
Hyperparameter optimization using honey badger algorithm (HBA)
The effectiveness of any deep learning classifier very much depends on suitable hyperparameter selection-in particular, the selection of learning rate, batch size, and number of neurons in hidden layers. The wrong choice of these may lead to slow training, unstable convergence, or suboptimal classification accuracies. To avoid manual tuning and to assure optimal training behavior, the Honey Badger Algorithm (HBA) has emerged as an intelligent optimizing strategy that will automatically select the hyperparameter configuration that is most suitable.
51
The hyperparameter vector is defined as in Eq. (37)

The quality of each candidate is evaluated through classifying training with the chosen hyperparameters and computing a fitness score based on validation performance. The fitness function used is in Eq. (39)
HBA models two major foraging strategies seen in honey badgers-that of digging and eating honey. In the digging phase, the agents carry out local exploitation around promising areas, while in honey search they are conducting global exploration to avoid premature convergence. Each agent's position is updated according to the equation (40)
The hyperparameter set is iteratively refined with HBA to speed up training convergence through a suitable learning rate, improve classification accuracy on neuron tuning to find optimal network capacity and increase stability through choosing a suitable batch size that strikes a balance between gradient smoothness and learning efficiency.
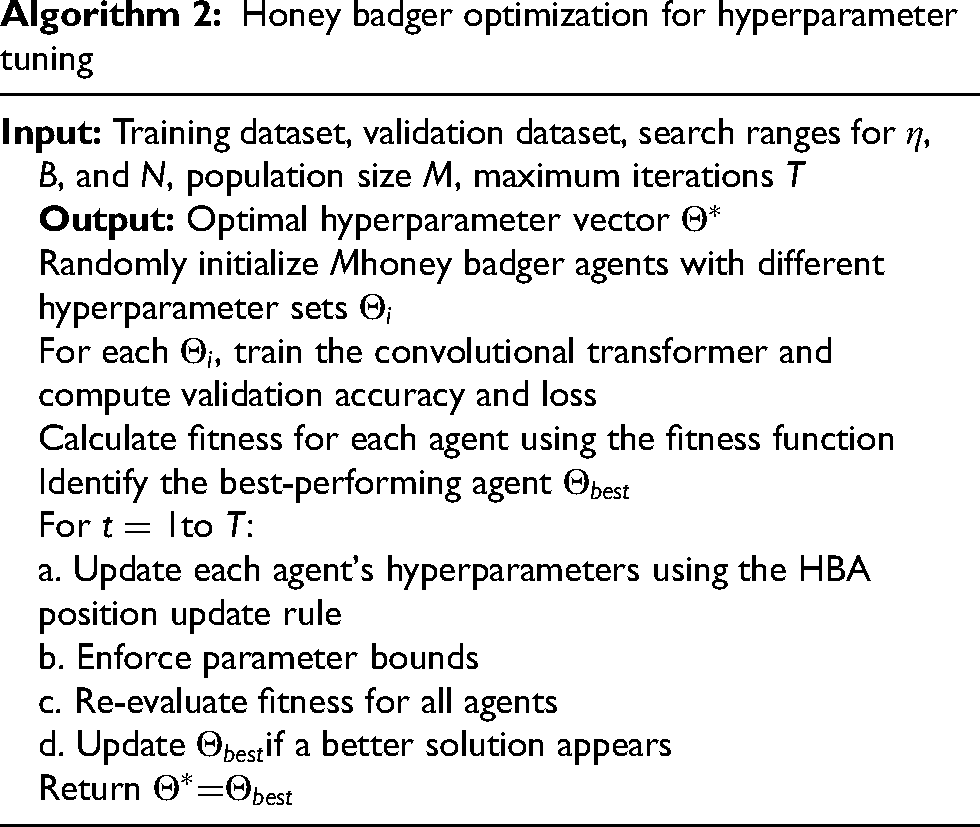
Honey badger optimization for hyperparameter tuning
Result and discussion
The proposed evaluation methodology of the AME-SegNetframework intends to test rigorously both quantitative performance and clinical reliability besides establishing the novelty of the architecture through comparison with other state-of-the-art methodologies. For optic disc and optic cup segmentation measures, Dice coefficient, Intersection-over-Union (IoU), pixel accuracy, and cup-to-disc ratio error (δCDR) have been considered. Dice and IoU do measure the spatial overlap between predicted and ground-truth masks whereas δCDR evaluates how segmentation errors will affect the most clinically important glaucoma biomarker. Hence, segmentation assessment ensures representation at both pixel level and diagnostic relevance. For glaucoma classification, these metrics are reported accuracy, precision, recall (sensitivity), F1 score, specificity and area under the ROC curve (AUC). These indices together assess the global correctness, the ability to detect the disease, the suppression of false alarms and the threshold-independent discriminatory performance. For all the major performance measures statistical robustness has been ensured by five-fold cross-validation and 95% confidence intervals. In addition, cross-dataset validation on Drishti-GS1, RIM-ONE, and ORIGA-Light is performed to confirm that improvements are not dependent on the dataset.
The uniqueness of the proposed design-presentation is thus benchmarked with all segmentation and classification frameworks available at the time. Individual separation or weak coupling governs feature extraction, classification, and other earlier paradigms of segmentation. The proposed framework is created instead as a fully integrated and anatomically driven pipeline, where every stage causes a reinforcing effect on the preceding stage. The previously existing U-Net, M-Net, SegNet, and the variety of attention-based models majorly optimize pixel-wise accuracy but such optimization has been realized to compromise the true optic cup-disc boundary, thereby contributing to cup-to-disc ratio estimation instability. On the other hand, with the overall context enhancement for large disc structures and multi-resolution aggregation of features, the proposed AME-SegNet explicitly models both fine cup boundaries and large disc structures, leading to higher values of Dice and IoU with lower values of δCDR.Classification methods have state-of-the-art performance yet mostly depend either upon raw image features or single clinical indicators such as CDR, which do not elaborate the truer picture of the complex structural and textural patterns of glaucoma. The proposed system takes on a biologically inspired feature optimization strategy, Bitterling Colony Optimization, to automatically choose the most discriminative combination of deep disc-cup features and anatomical descriptors. Furthermore, the unique amalgamation of Convolutional Transformer acts as an interface allowing convolutional locality to cooperate with transformer-based global attention in the local modeling of nerve fiber changes and global modeling of disc-cup relations. Such hyperparameter tuning through Honey Badger Algorithm extends uniqueness to the framework by making the learning process self-adaptive and stable over different datasets. Its superiority persists in the quantitative demonstration with consistent improvement over EfficientNet, Vision Transformer, ConvNeXt, and Swin Transformer across various datasets and ablation studies; thus affirming the efficacy as well as originality of the proposed AME-SegNet framework.
Experimental configuration
All the experiments were carried out on a dedicated high-performance computation workstation in order to maintain stable, reproducible, and efficient training and evaluation of the proposed deep-learning framework. The hardware platform comprised an Intel Core i9 central processing unit, 64 GB of DDR5 system memory, and an NVIDIA RTX 4090 graphics processing unit with 24 GB of GDDR6X memory, which endowed enough computational power to train large-scale convolutional and transformer-based models. Faster access to data and model checkpointing during training and testing were ensured by solid-state storage (2 TB NVMe SSD). The software environment was built on the Ubuntu 22.04 LTS (64-bit) operating system. All of the algorithms were implemented in Python 3.10, whereas the deep learning models were developed and trained using TensorFlow 2.13 and PyTorch 2.0, thus allowing a flexible implementation of both convolutional and transformer architectures. For GPU acceleration to increase training and inference speed significantly, CUDA 12.1 and cuDNN 8.9 were used. Image preprocessing and visualization tasks were performed using OpenCV 4.8 and scikit-image 0.21, while NumPy 1.25 and Pandas 2.0 were utilized for numerical computations and data management. Model evaluation and plotting were accomplished using Scikit-learn 1.3 and Matplotlib 3.8.
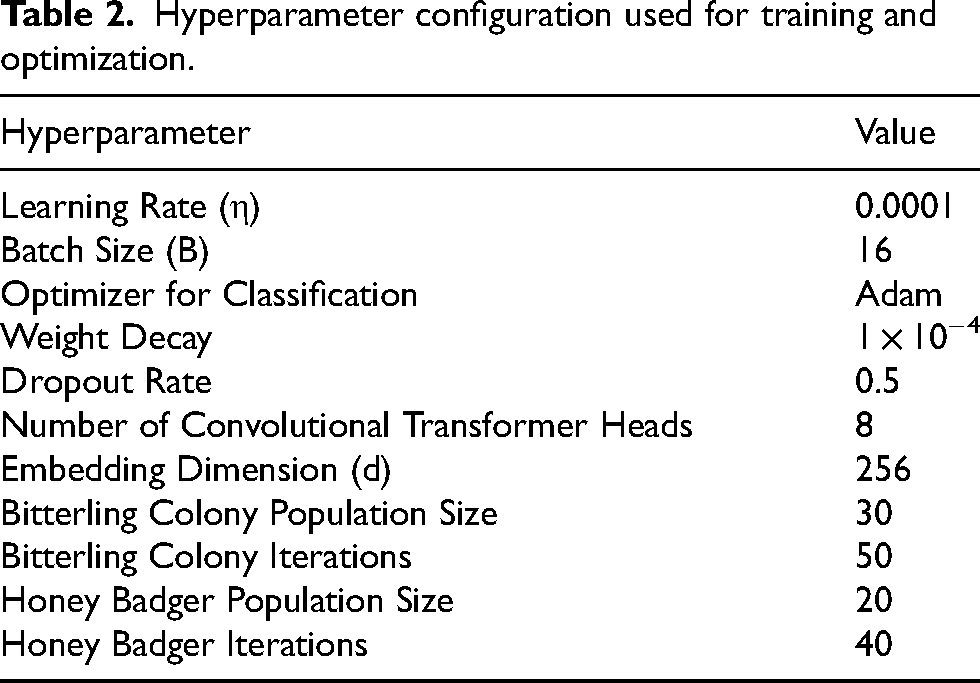
All experiments were conducted on a standalone local workstation without utilizing any external cloud services or distributed computing infrastructure. Hence, no network devices or network-based processing were involved in any step of training or testing, ensuring that all reported results came from a controlled and reproducible computing environment. All network architectures, including the AME-SegNet, Convolutional Transformer, and the optimizers, were trained using the hyperparameter configuration presented in Table 2, which includes learning rates, batch sizes, optimizer settings, and training schedules used to secure stable convergence and reproducible performance.
Hyperparameter configuration used for training and optimization.
Quantitative problem formulation and experimental validation
Let
On the other hand, for glaucoma classification, discriminative deep features extracted from the segmentation network are refined through biologically inspired feature selection and attention-based learning. The classification task is defined as a supervised optimization problem in which categorical cross-entropy loss is minimized concerning the predicted and ground-truth class labels. To jointly optimize the objectives of segmentation and classification, a unified loss function is adopted to quantitatively balance the contribution of both tasks during training. This ensures that the proposed framework remains mathematically well-defined and is guided by objectiveness.
To underpin the quantitative assessment by an experimental validation, the proposed approach is statistically validated. Therefore, Dice, IoU, accuracy, and error in cup-to-disc ratio are used to assess segmentation performance, while accuracy, precision, recall, F1-score, specificity, and the area under the ROC curve are for classification. For reliability purposes, all classification results are reported as mean with a 95% confidence interval. Furthermore, five-fold cross-validation and cross-dataset evaluation are performed to minimize sampling bias and validate robustness on different data distributions. Moreover, comparative evaluation with state-of-the-art methods, and ablation studies are quantitatively reported to provide measurable performance gain, and validate the contribution of each component of the proposed framework.
Inclusion and exclusion criteria and sample selection method
The research follows a stringent guideline with respect to sampling inclusion and exclusion criteria keeping in mind that only clinically meaningful and such samples are model tested and trained for evaluation of results.
Included among eligibility conditions were: (i) color fundus photographs centered on the optic nerve head; (ii) images having corresponding significant expert-annotated ground-truth masks for optic disc and optic cup (for segmentation); (iii) images clinically labelled as normal or glaucomatous (for classification). Only images that were captured at sufficiently high-resolution and with sufficient clarity of the optic disc and cup were included, since accurate anatomical segmentation and reliable feature extraction from these regions are dependent upon good visualization.
Exclusion criteria included: (i) images without optic disc or optic cup annotations, (ii) fundus images having severe blur, considerable occlusion, or artifacts such that the optic nerve head cannot be well visualized, and (iii) images that contain other retinal diseases but have no glaucoma-related classification labeling, to avoid confusion during classification.
The data in this study were derived retrospectively from public standard database sets, namely RIM-ONE, Drishti-GS1, and ORIGA-Light. These datasets were collected and validated using standard labeling protocols in a clinical environment with experienced ophthalmologists as experts. There was no further recruitment of patients or manual selection of samples in this study. All images included were taken directly from the official releases of the datasets but processed according to their respective splits for five-fold cross validation and cross-dataset evaluation protocols, thus ensuring unbiased and reproducible experimentation. The systematic inclusion, exclusion, and sampling strategy render experimental analysis clinically valid, statistically reliable, and ethically compliant.
Segmentation results - drishti-GS1 dataset
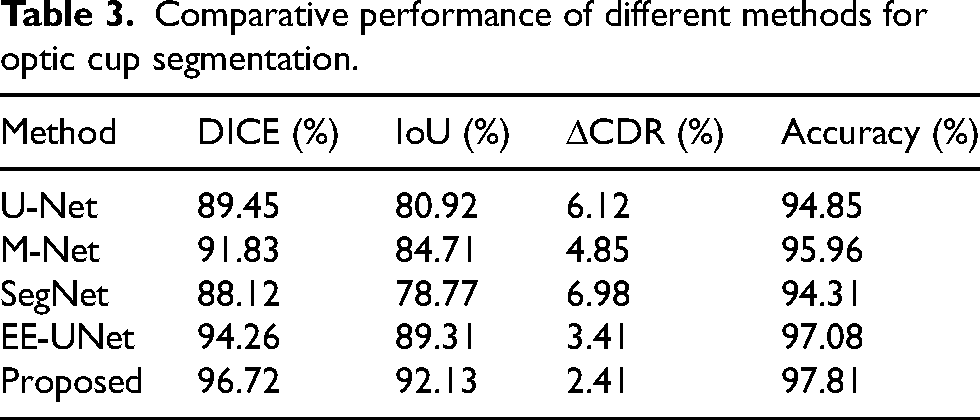
Quantitative assessment demonstrates that the method proposed here overtakes all extant models with respect to optic cup segmentation quality by attaining a Dice value of 96.72% and an IoU of 92.13%, much higher than the scores for U-Net at 89.45% and 80.92% and M-Net at 91.83% and 84.71%, also surpassing the score for EE-UNet at 94.26% Dice and 89.31% IoU with this clear dominance stated in Table 3, where the suggested model also has the minimum δCDR value of 2.41% against 6.12% for U-Net, 4.85% for M-Net, 6.98% for SegNet, and 3.41% for EE-UNet. In compliance with this, the 97.81% accuracy indicates that the proposed framework has a more reliable optic cup boundary localization than the other techniques that achieved accuracies ranging between 94.31% and 97.08%, endorsing that the optimized structure indeed improves both overlap accuracy and clinical reliability.
Comparative performance of different methods for optic cup segmentation.
It is visually demonstrated that the computational model isolates quite well the optic disc and the optic cup in various retinal samples even with differences in vessel density and illumination from image to image; and this consistency makes itself well visible, especially near the center of the optic nerve head where the boundaries are very well preserved and sharply defined as shown in Figure 9, indicating that the learned features are strong enough to maintain anatomical correctness. The segmented regions seem to be relatively balanced, meaning to say, the relation between the cup and the surrounding disc is preserved without significant evidence of shrinkage or expansion, which is an important factor in judging the integrity of the neuroretinal rim. Overlapping views are also proving that detected structures are aligned to the original fundus images, which allow to conclude that the developed system can adapt equally well to other optic disc shapes and contrast levels but at the same time produces stable and repeatable results for diagnostic evaluation.
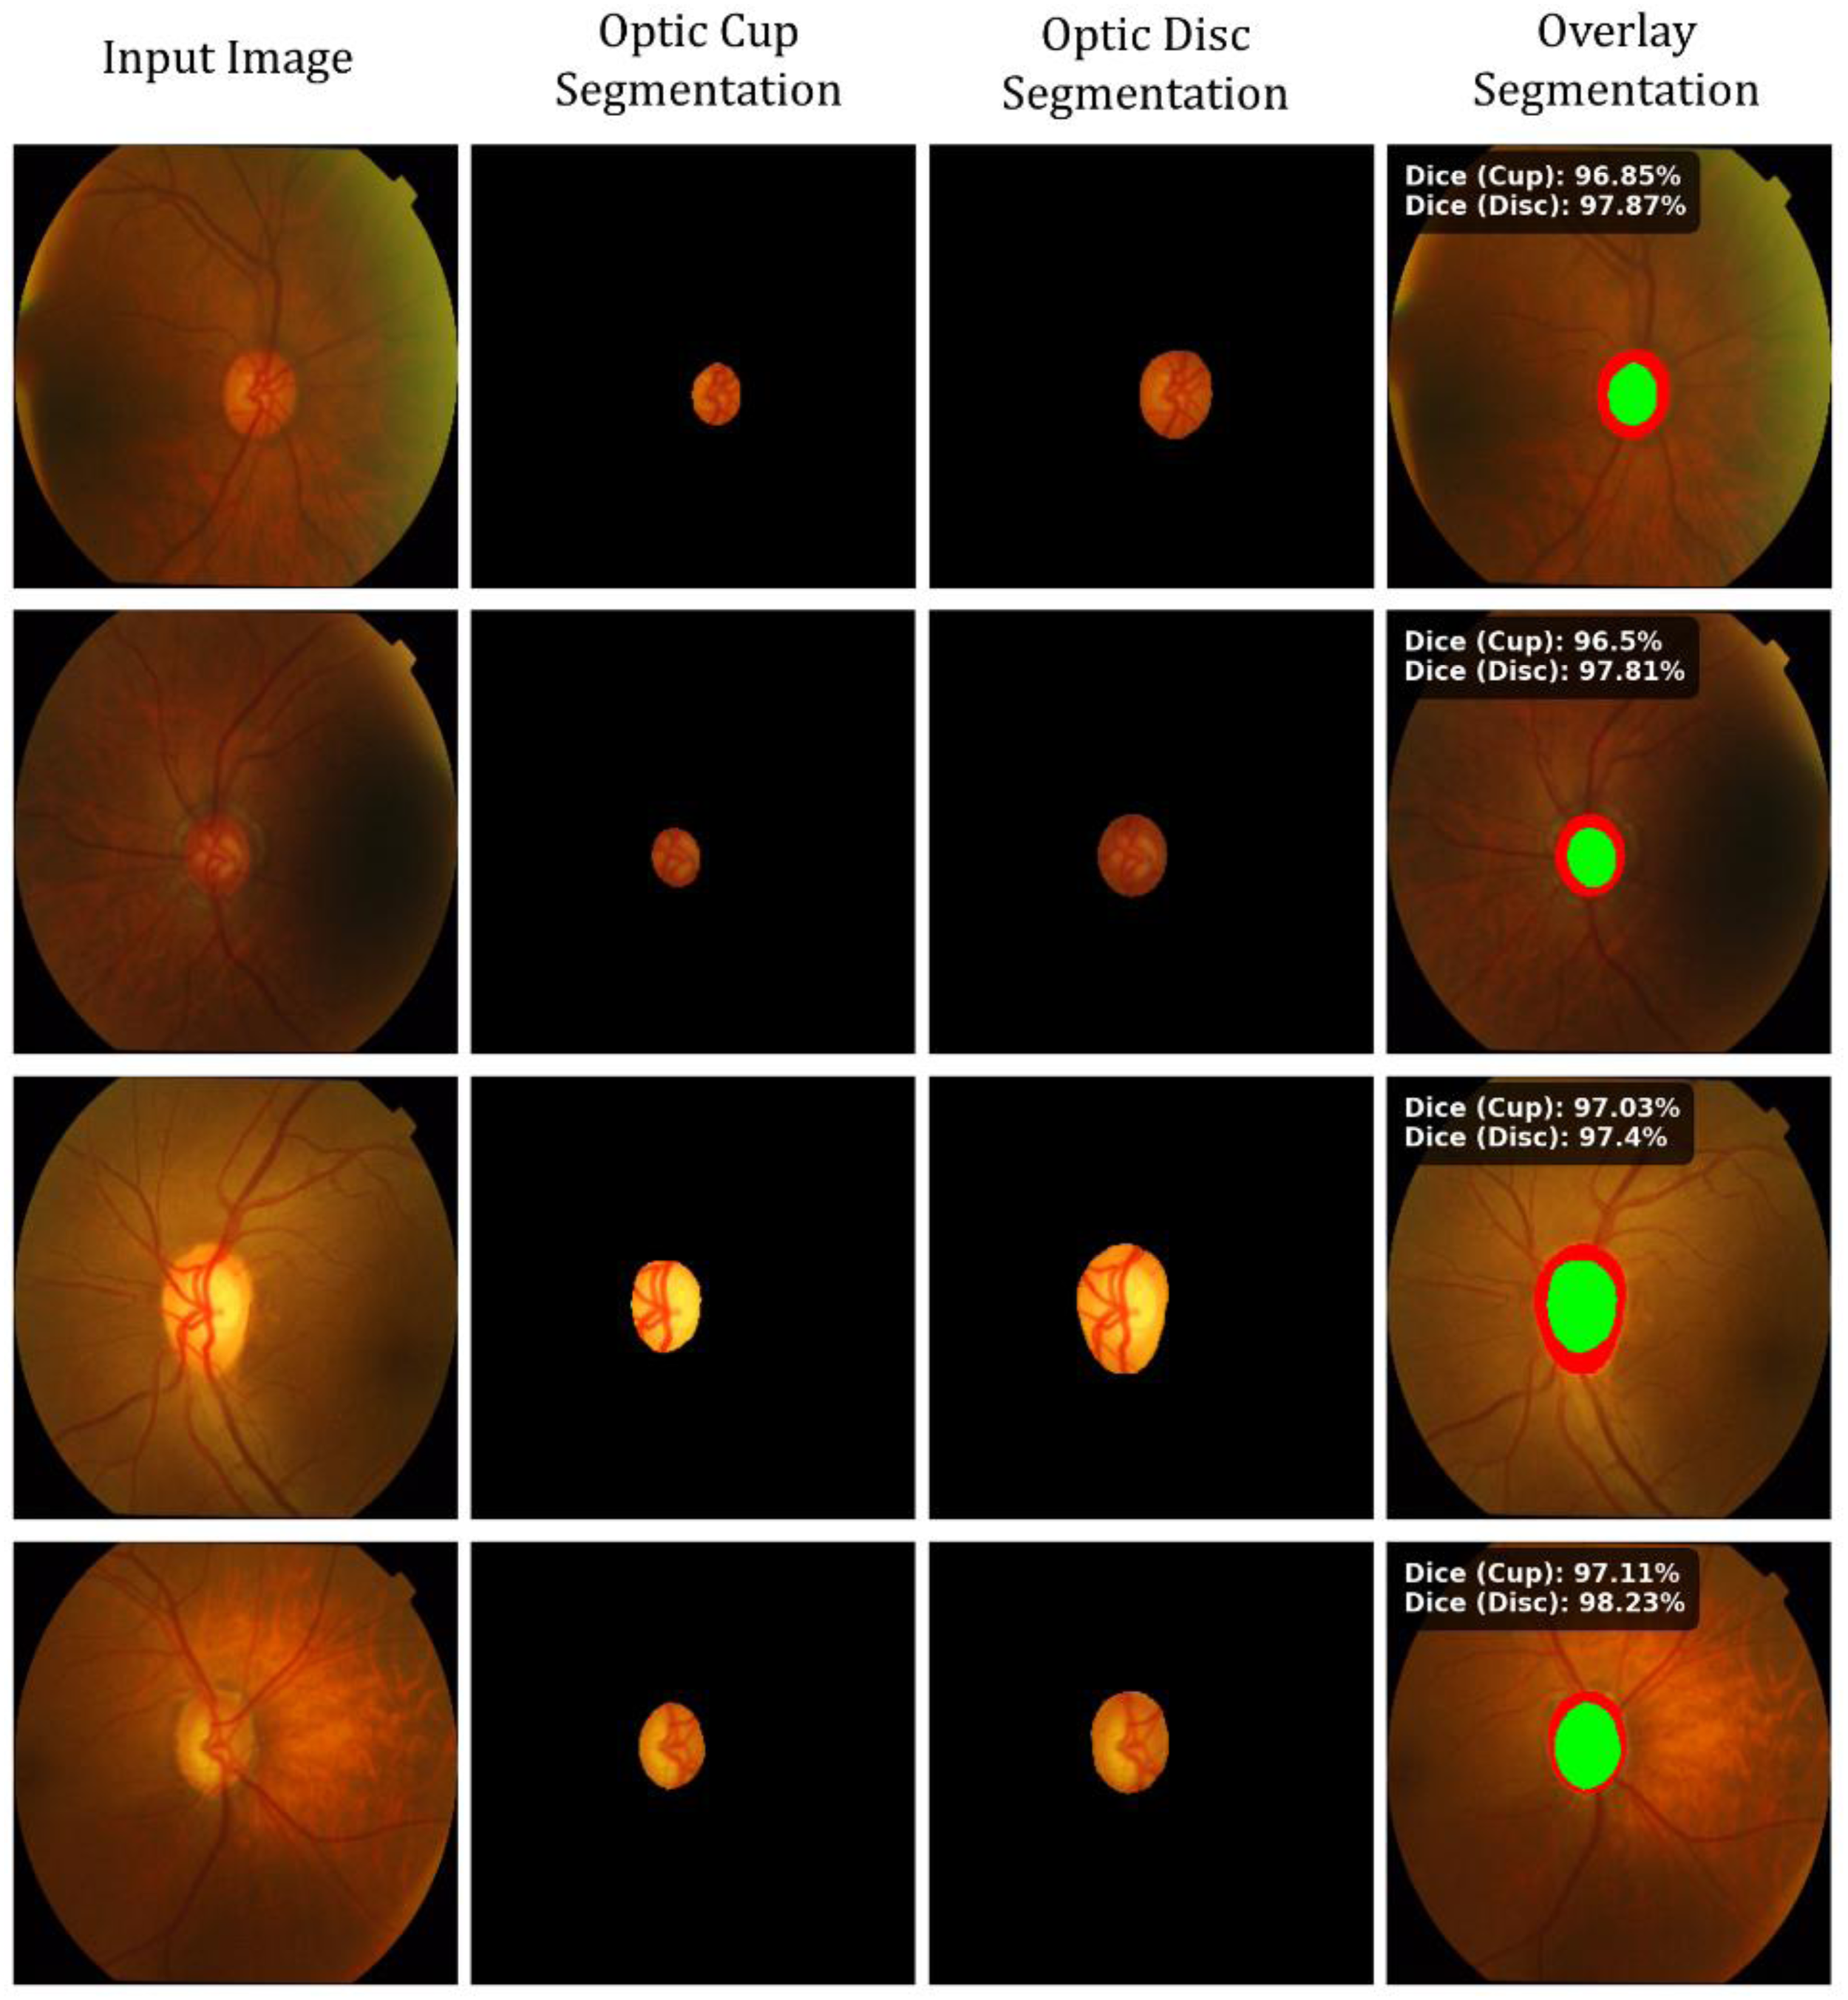
Optic cup and optic disc segmentation with overlay and dice score evaluation.
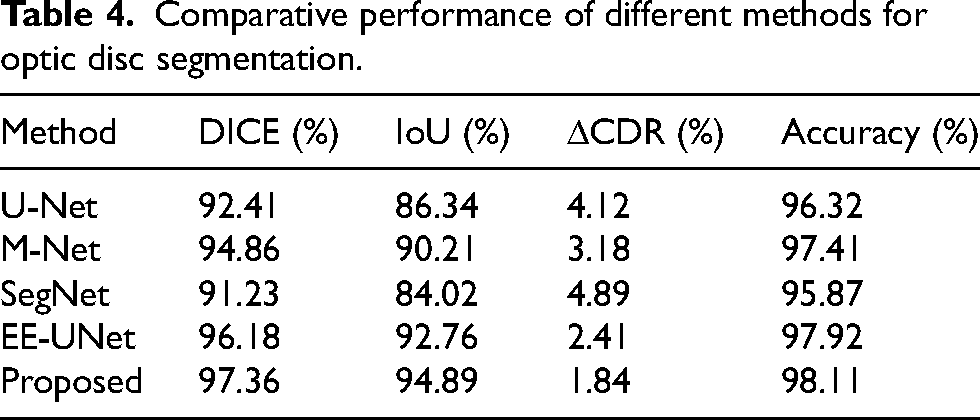
According to the numerical results, this presented framework performs the best in terms of total optic disc delineation accuracy among all the evaluated models with a Dice score of 97.36% and IoU of 94.89%, which are far superior to those achieved by U-Net, at 92.41% and 86.34%, and M-Net, at 94.86% and 90.21%, besides that, it beats EE-UNet which ranks with a Dice of 96.18% and an IoU of 92.76%; clear superiority is reflected in Table 4 where the proposed solution again registers the lowest δCDR of 1.84% compared with the 4.12% value of U-Net, 3.18% of M-Net, and 4.89% of SegNet, and 2.41% of EE-UNet. The accuracy attained also proves to be 98.11%, which further proves that the new methodology is superior in terms of providing more consistent and reliable methods of optic disc location as compared to the other techniques which produced accuracy values between 95.87% and 97.92%, thus evidencing superiority in boundary precision and overall diagnostic performance.
Comparative performance of different methods for optic disc segmentation.
Visual comparisons provided indicate that the contour-based detection method accurately delineates the optic disc region across different retinal images, tracing out smooth or jagged boundary shapes closely matching the anatomical true margins, and the reliability is evidently reflected in Figure 10, where the several overlaid outlines closely cluster around the optic nerve head; the minimal distance between the plotted contours shows that the method remains reliably localized despite a change in factors such as illumination, vessel patterns, and disc appearance-important properties for any method intended to be are structurally reliable. Further, the concentric near alignment of the detected rings emphasizes the fact that the system preserves the geometric consistency of the optic disc, which is suggestive of its capability in generating measurements required for evaluation of glaucoma and other ophthalmic applications accurately.
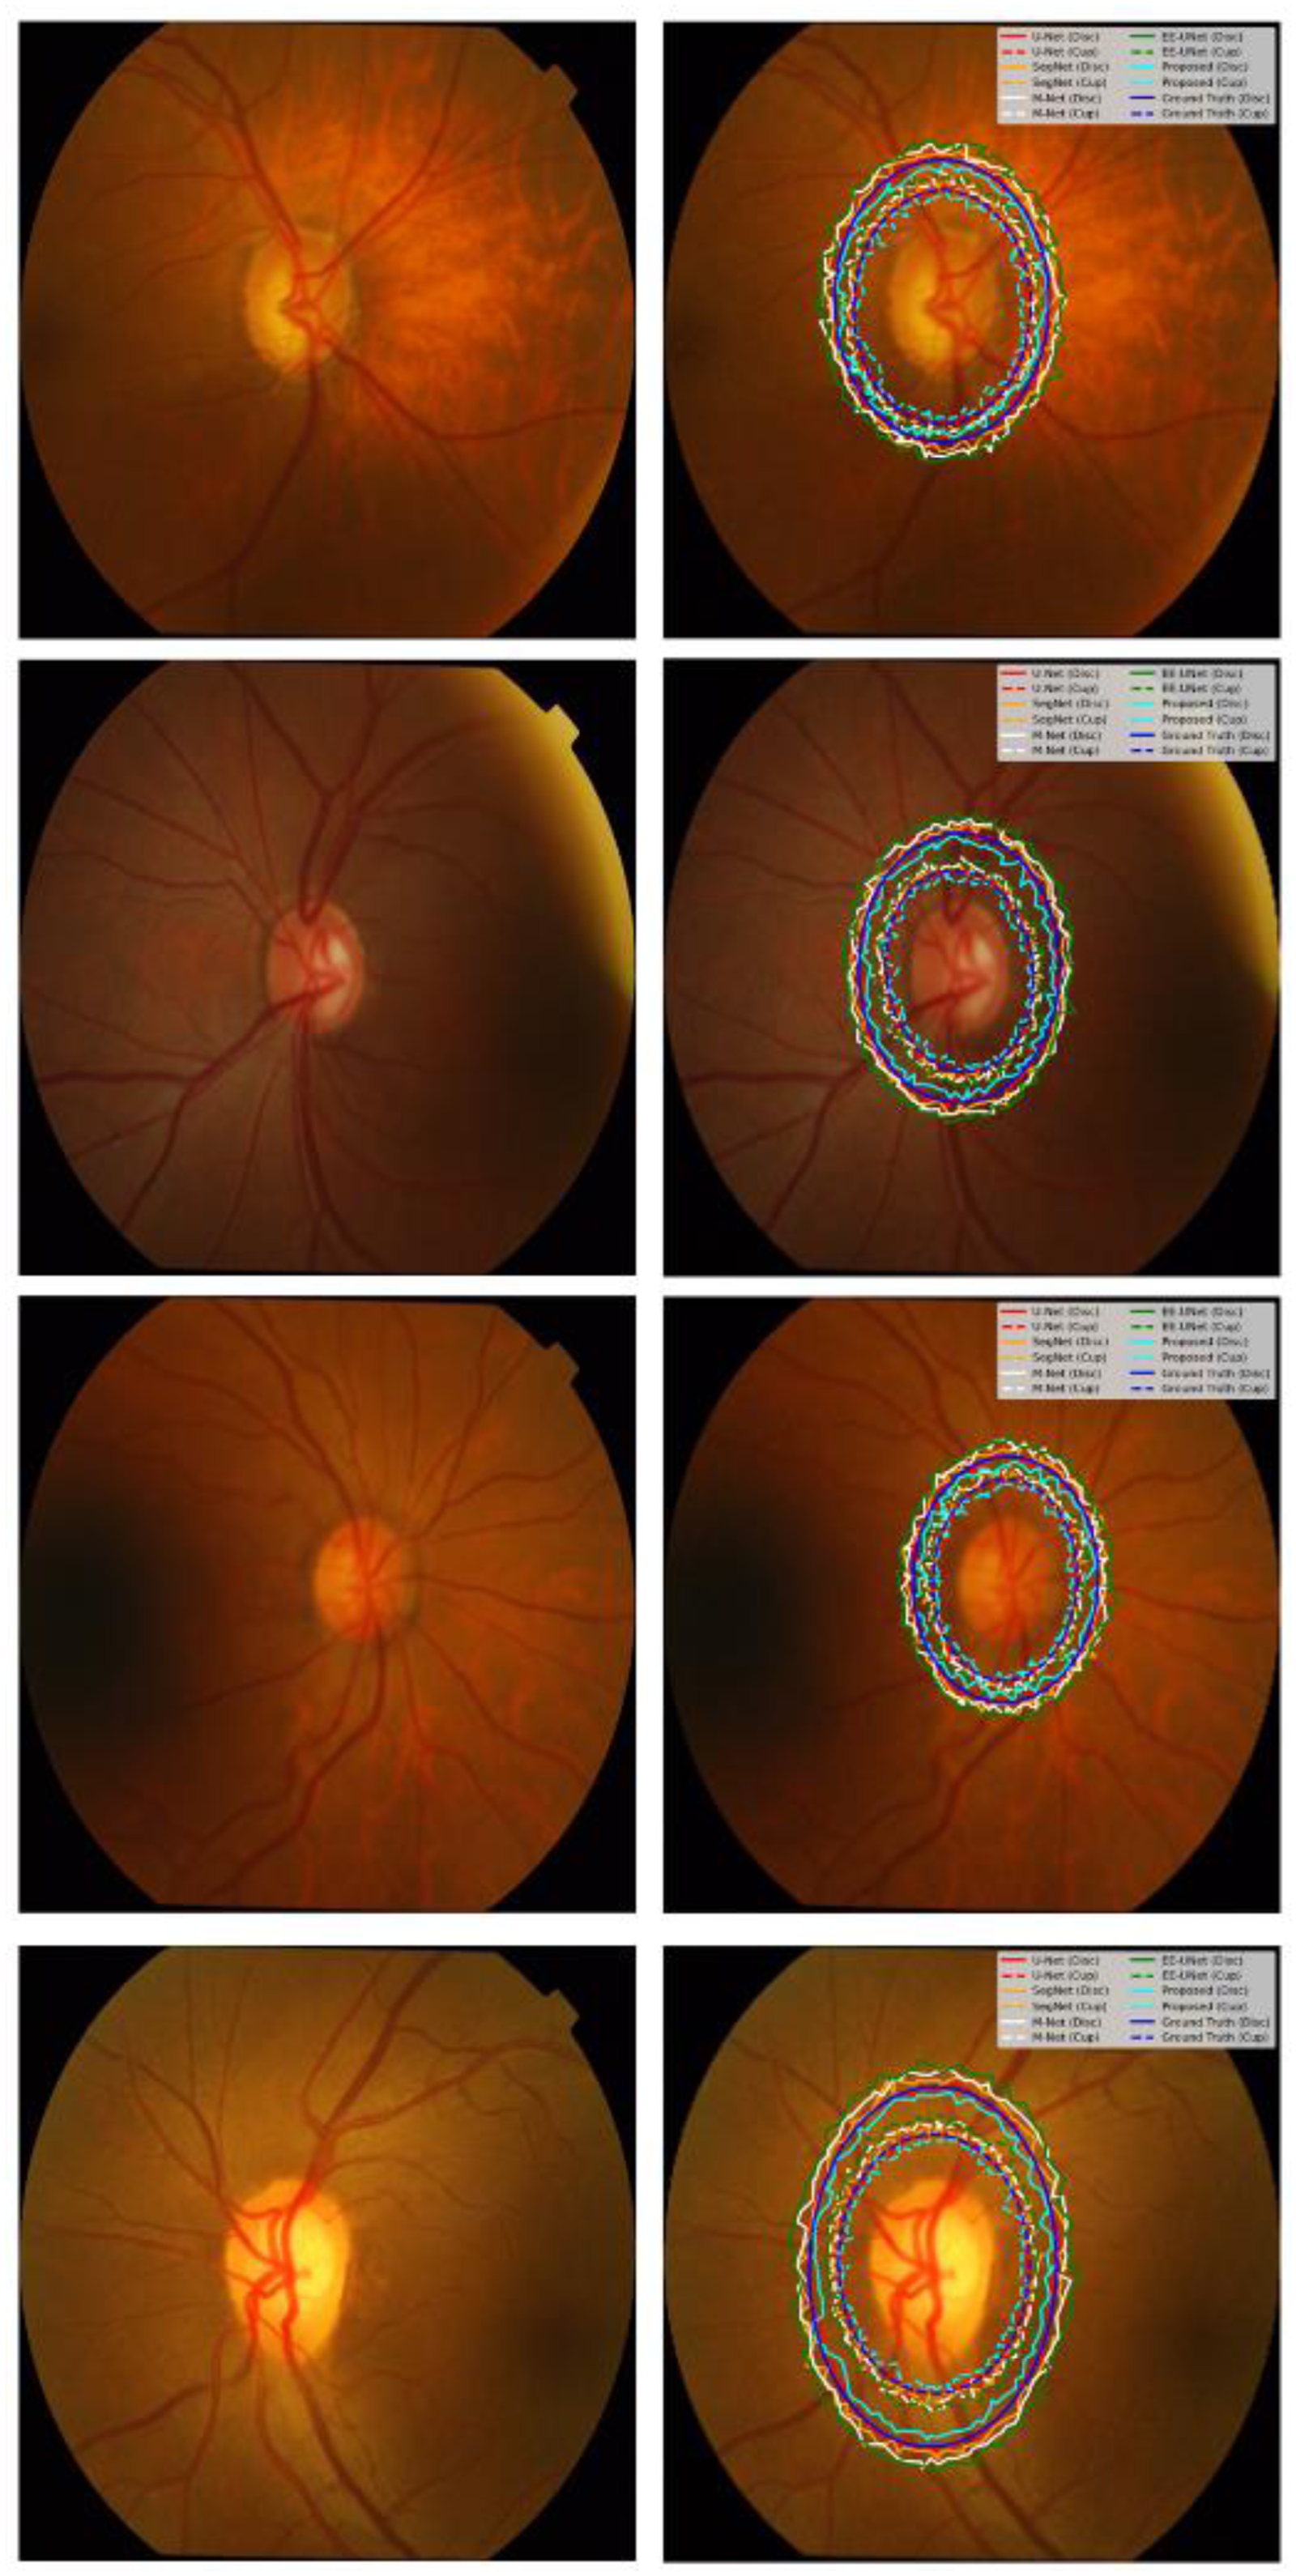
Multi-Contour optic disc boundary detection on retinal Fundus images.
The training graphs suggest that the RAdam with LookAhead together would produce the best learning behavior, achieving an accuracy of approximately 0.99 in about 30,000 batches and remaining close to that level until around 120,000 batches, whereas standalone RAdam got slightly stabilized around 0.985 and Adam around 0.97, with SGD at approximately 0.95, a clear comparative trend also seen in Figure 11 on the zoomed section of the mid-training period. The loss patterns concur, where the hybrid optimizer pulls down the error to nearly 0.01 before 20,000 batches and to values very close to 0.001 around 40,000 batches, whereas RAdam stabilizes around 0.002, Adam goes toward 0.005 with SGD hovering between 0.01 and 0.02 even beyond the higher batch counts. These differences in numbers testify that the integrated optimization strategy converges faster and achieves finer minima as compared to the other three methods, resulting in greater stability and better predictive performance.
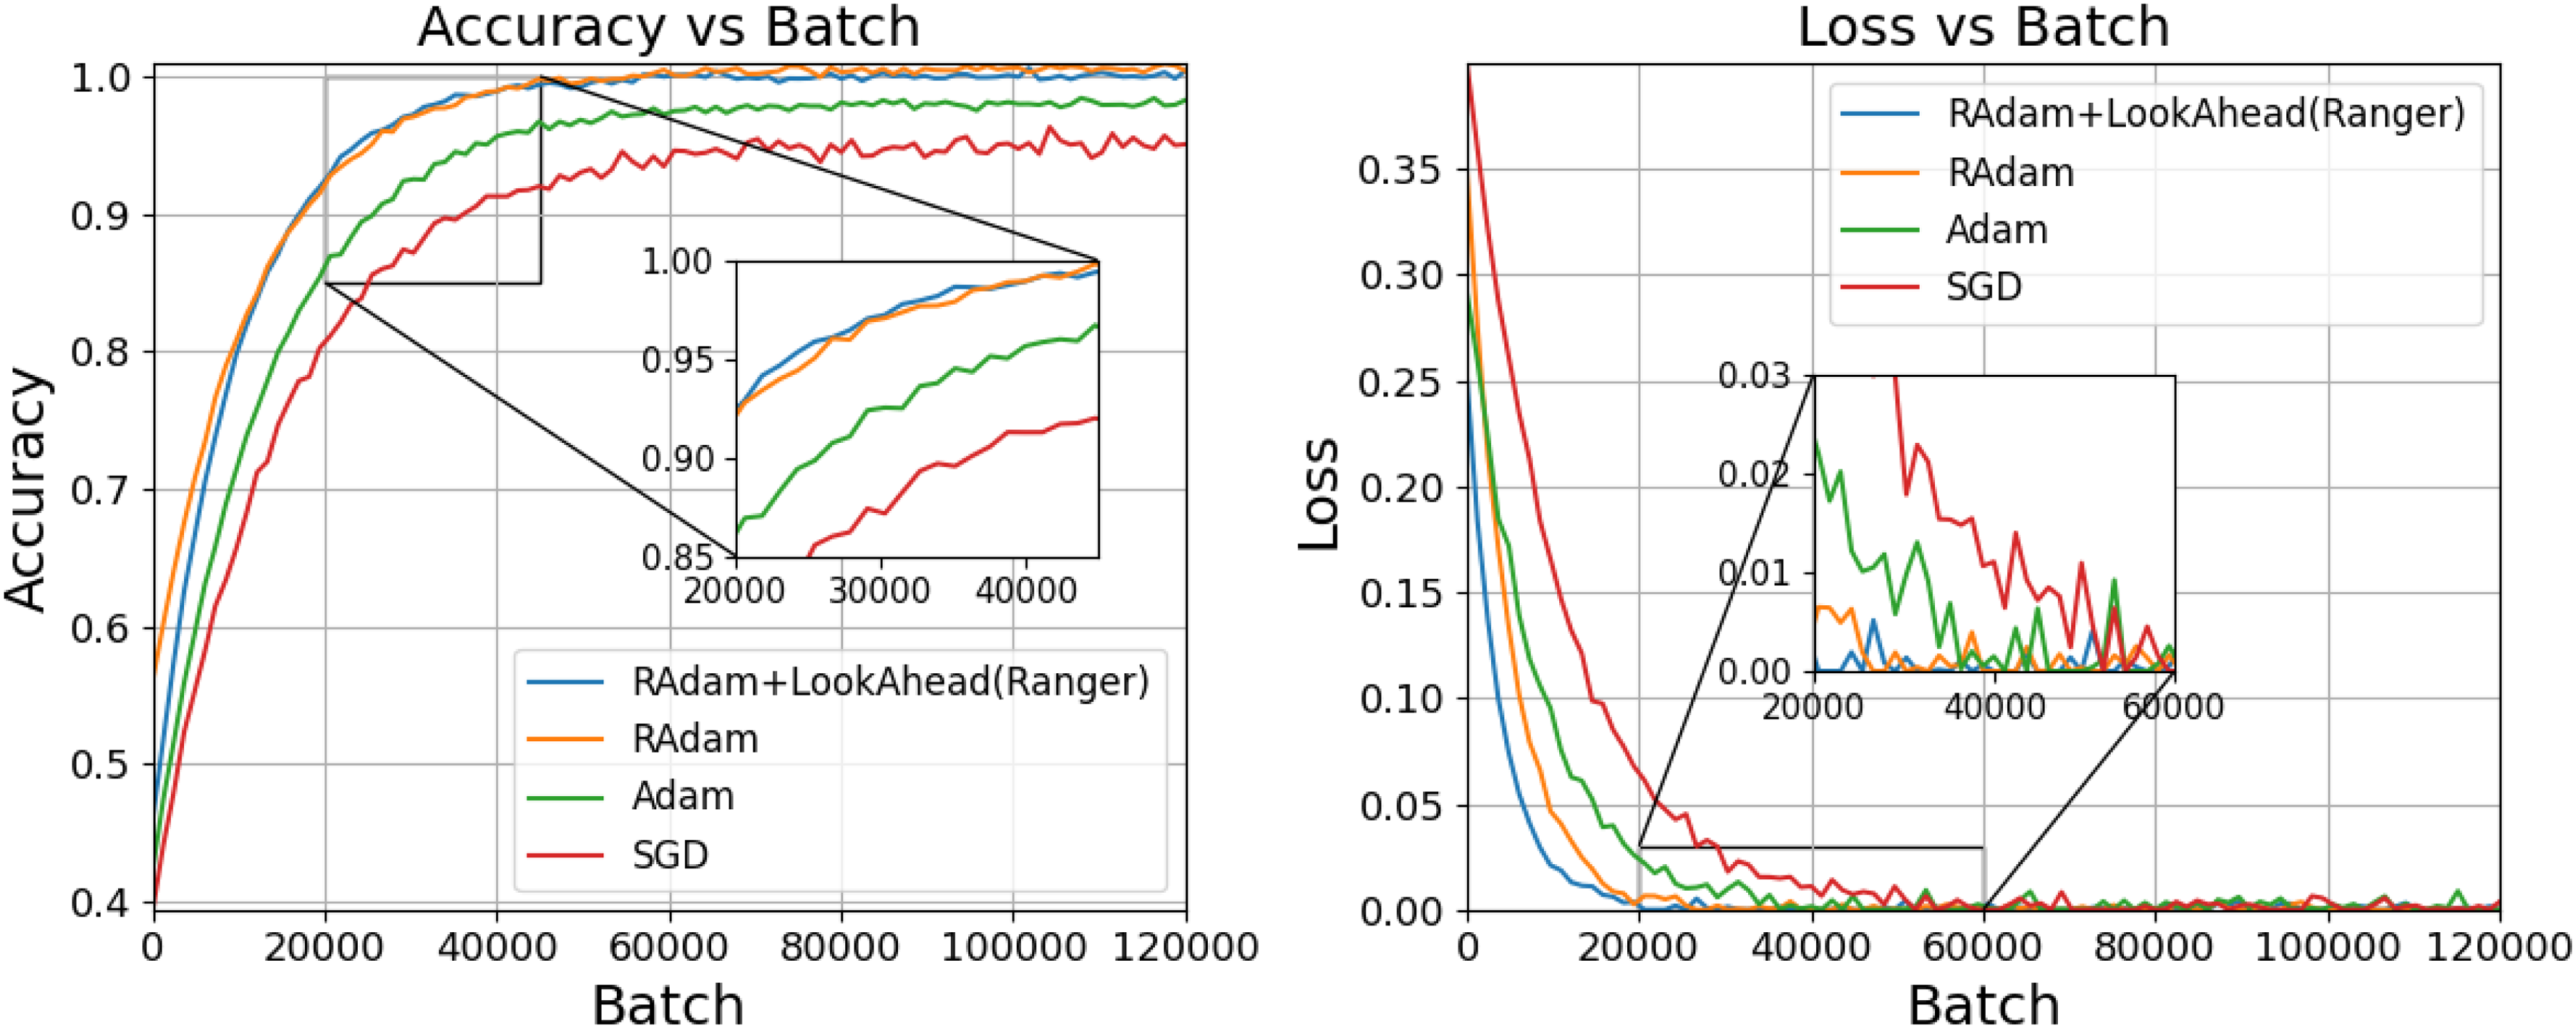
Accuracy and loss trends of different optimizers across training batches.
From the comparative learning curves, it is evident that the loss formulation with Dice and Focal terms at α=0.25 and γ=2 yield the best segmentation agreement, with a Dice score close to 0.99 at about 7000 batches, maintaining above 0.985 all the way through to 120,000 batches, whereas the Focal-only configuration plateaus slightly lower just below 0.985 while the pure Dice loss converges towards around 0.98; this ordering trend can be seen quite clearly in Figure 12 in the zoomed view of the early-training window. Other hybrid settings such as α=0.5, γ=1 and α=0.75, γ=0 reach plateaus near 0.97 to 0.975 while the α=0.5, γ=0.5 configuration remains closest to 0.965, indicative of decreased overlap accuracy. These gaps quantitatively suggest that an appropriate weighing of the class balancing and focusing parameters would interplay with boundary learning while suppressing the misclassifications more effectively, thereby leading to better consistency of segmentation through prolonged training.
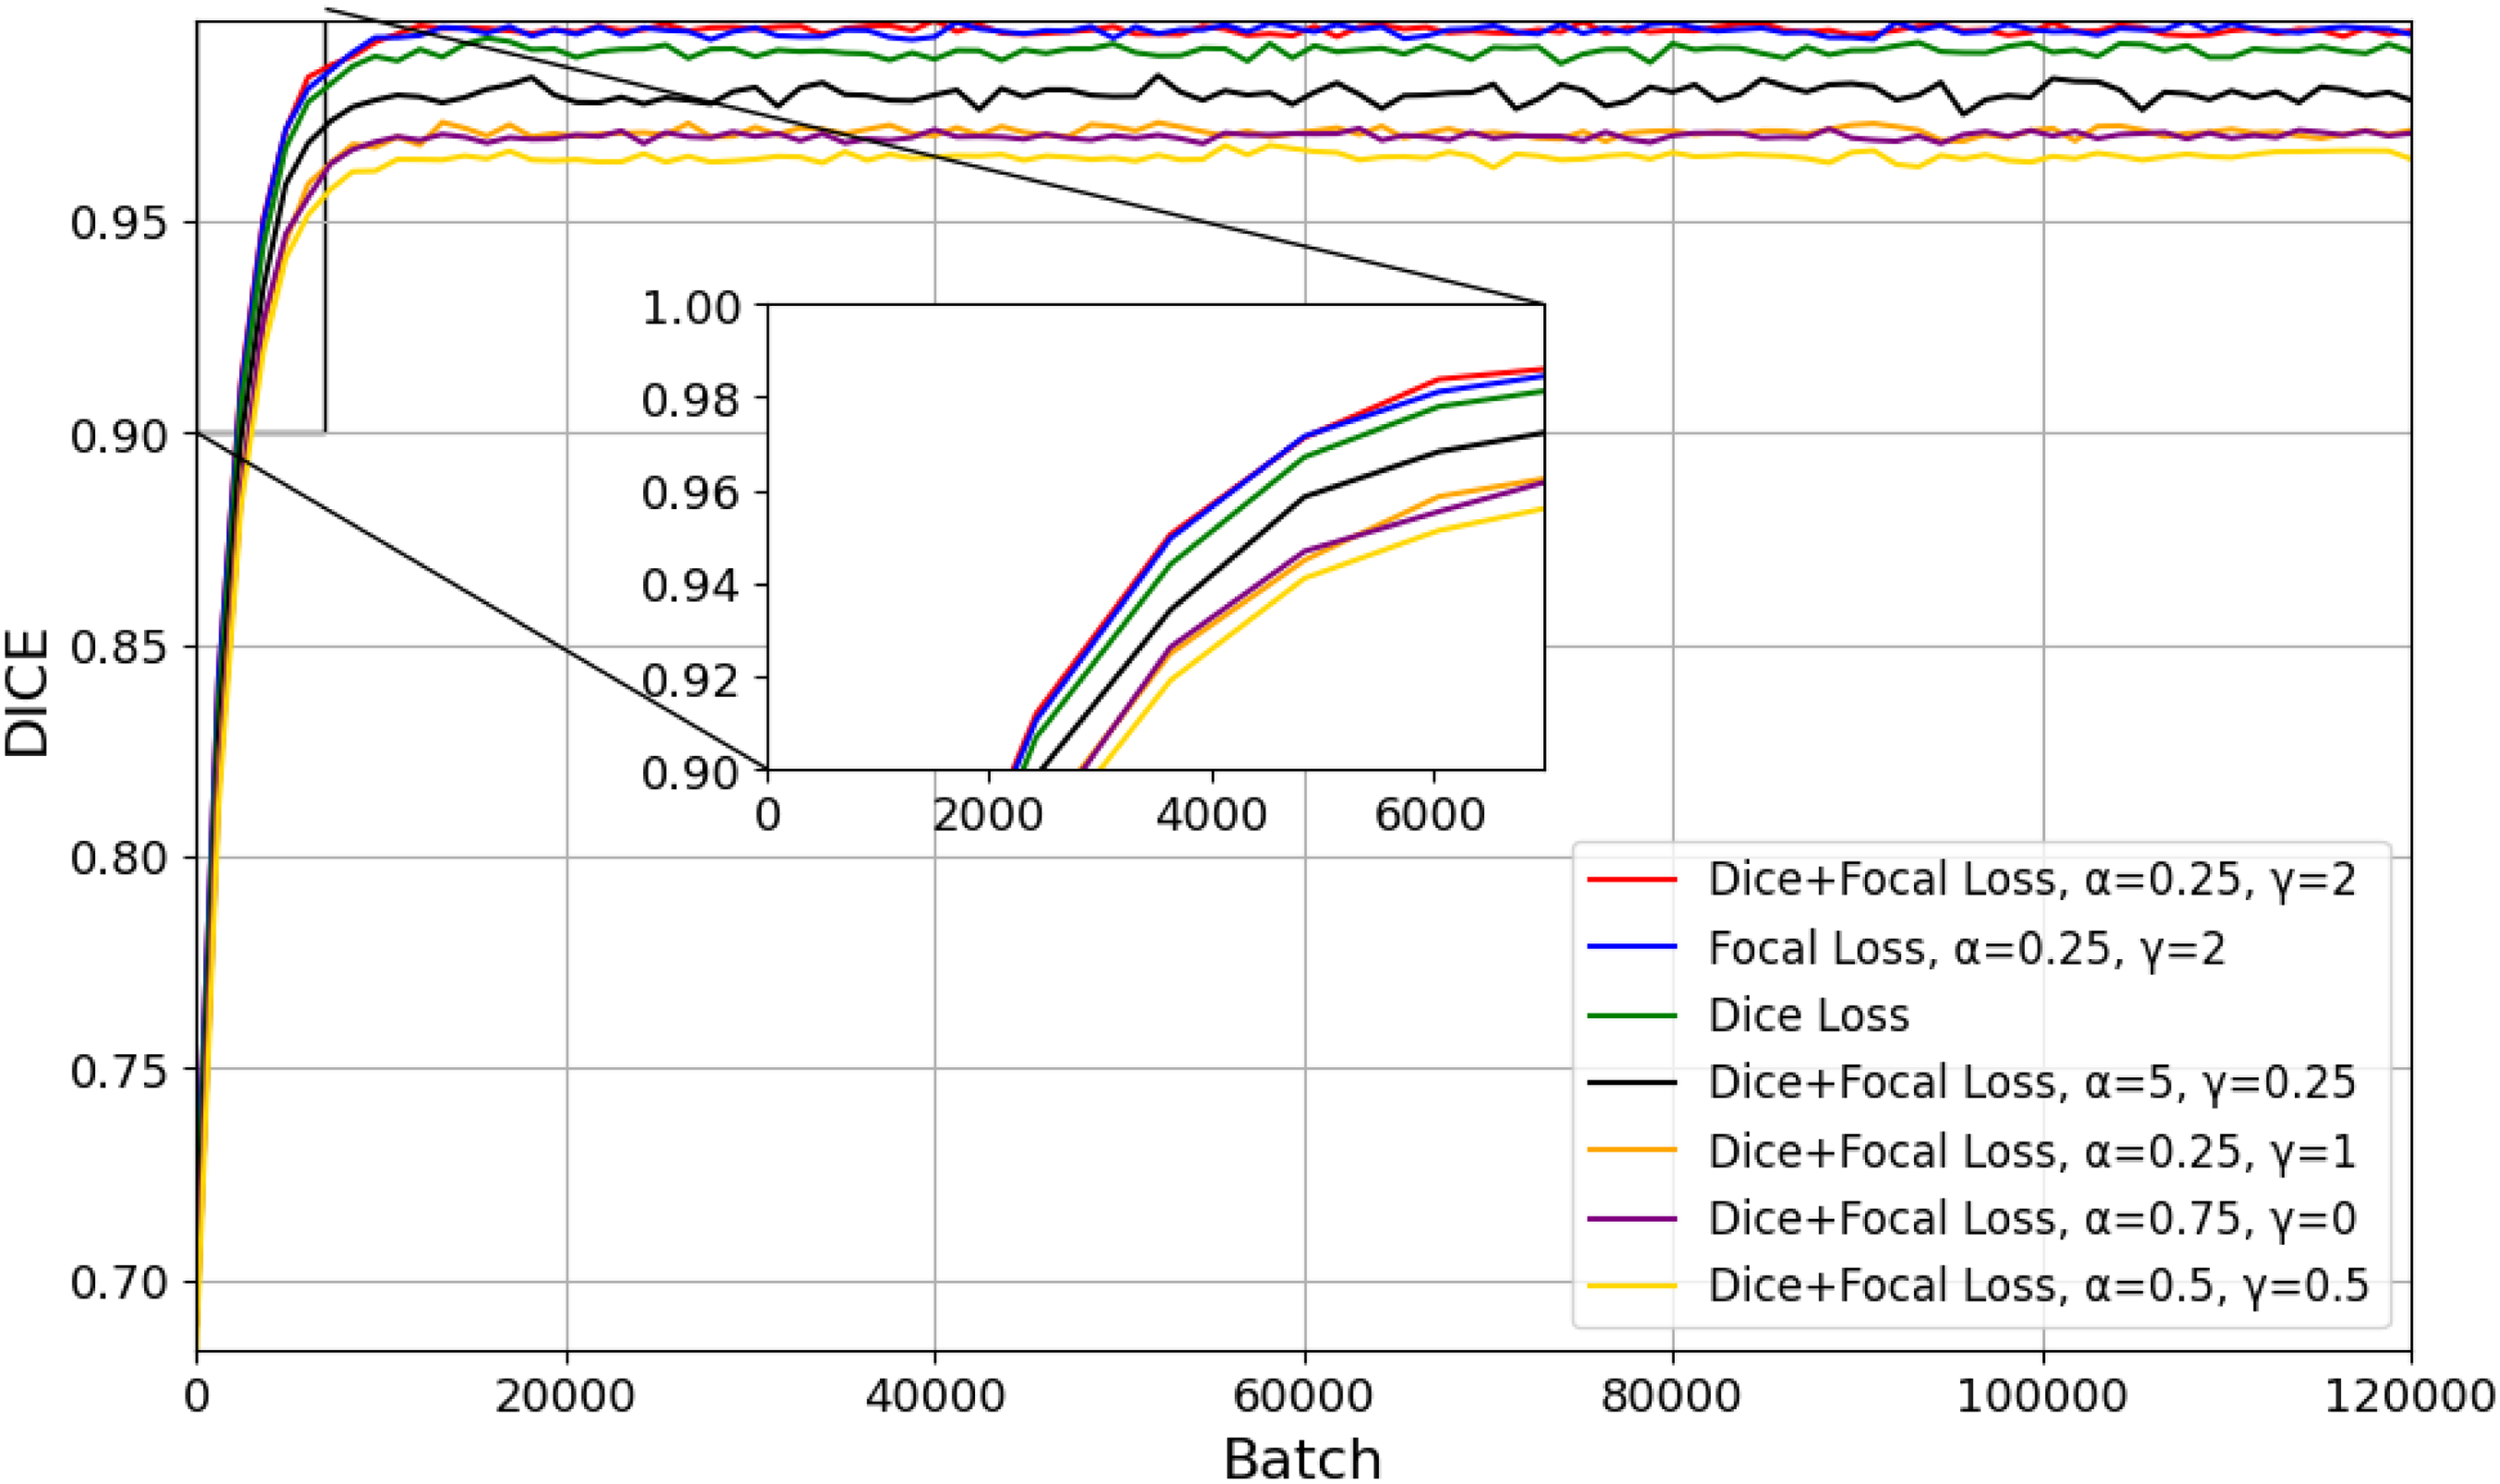
Dice score performance for different dice–focal loss configurations.
Classification results - RIM ONE dataset
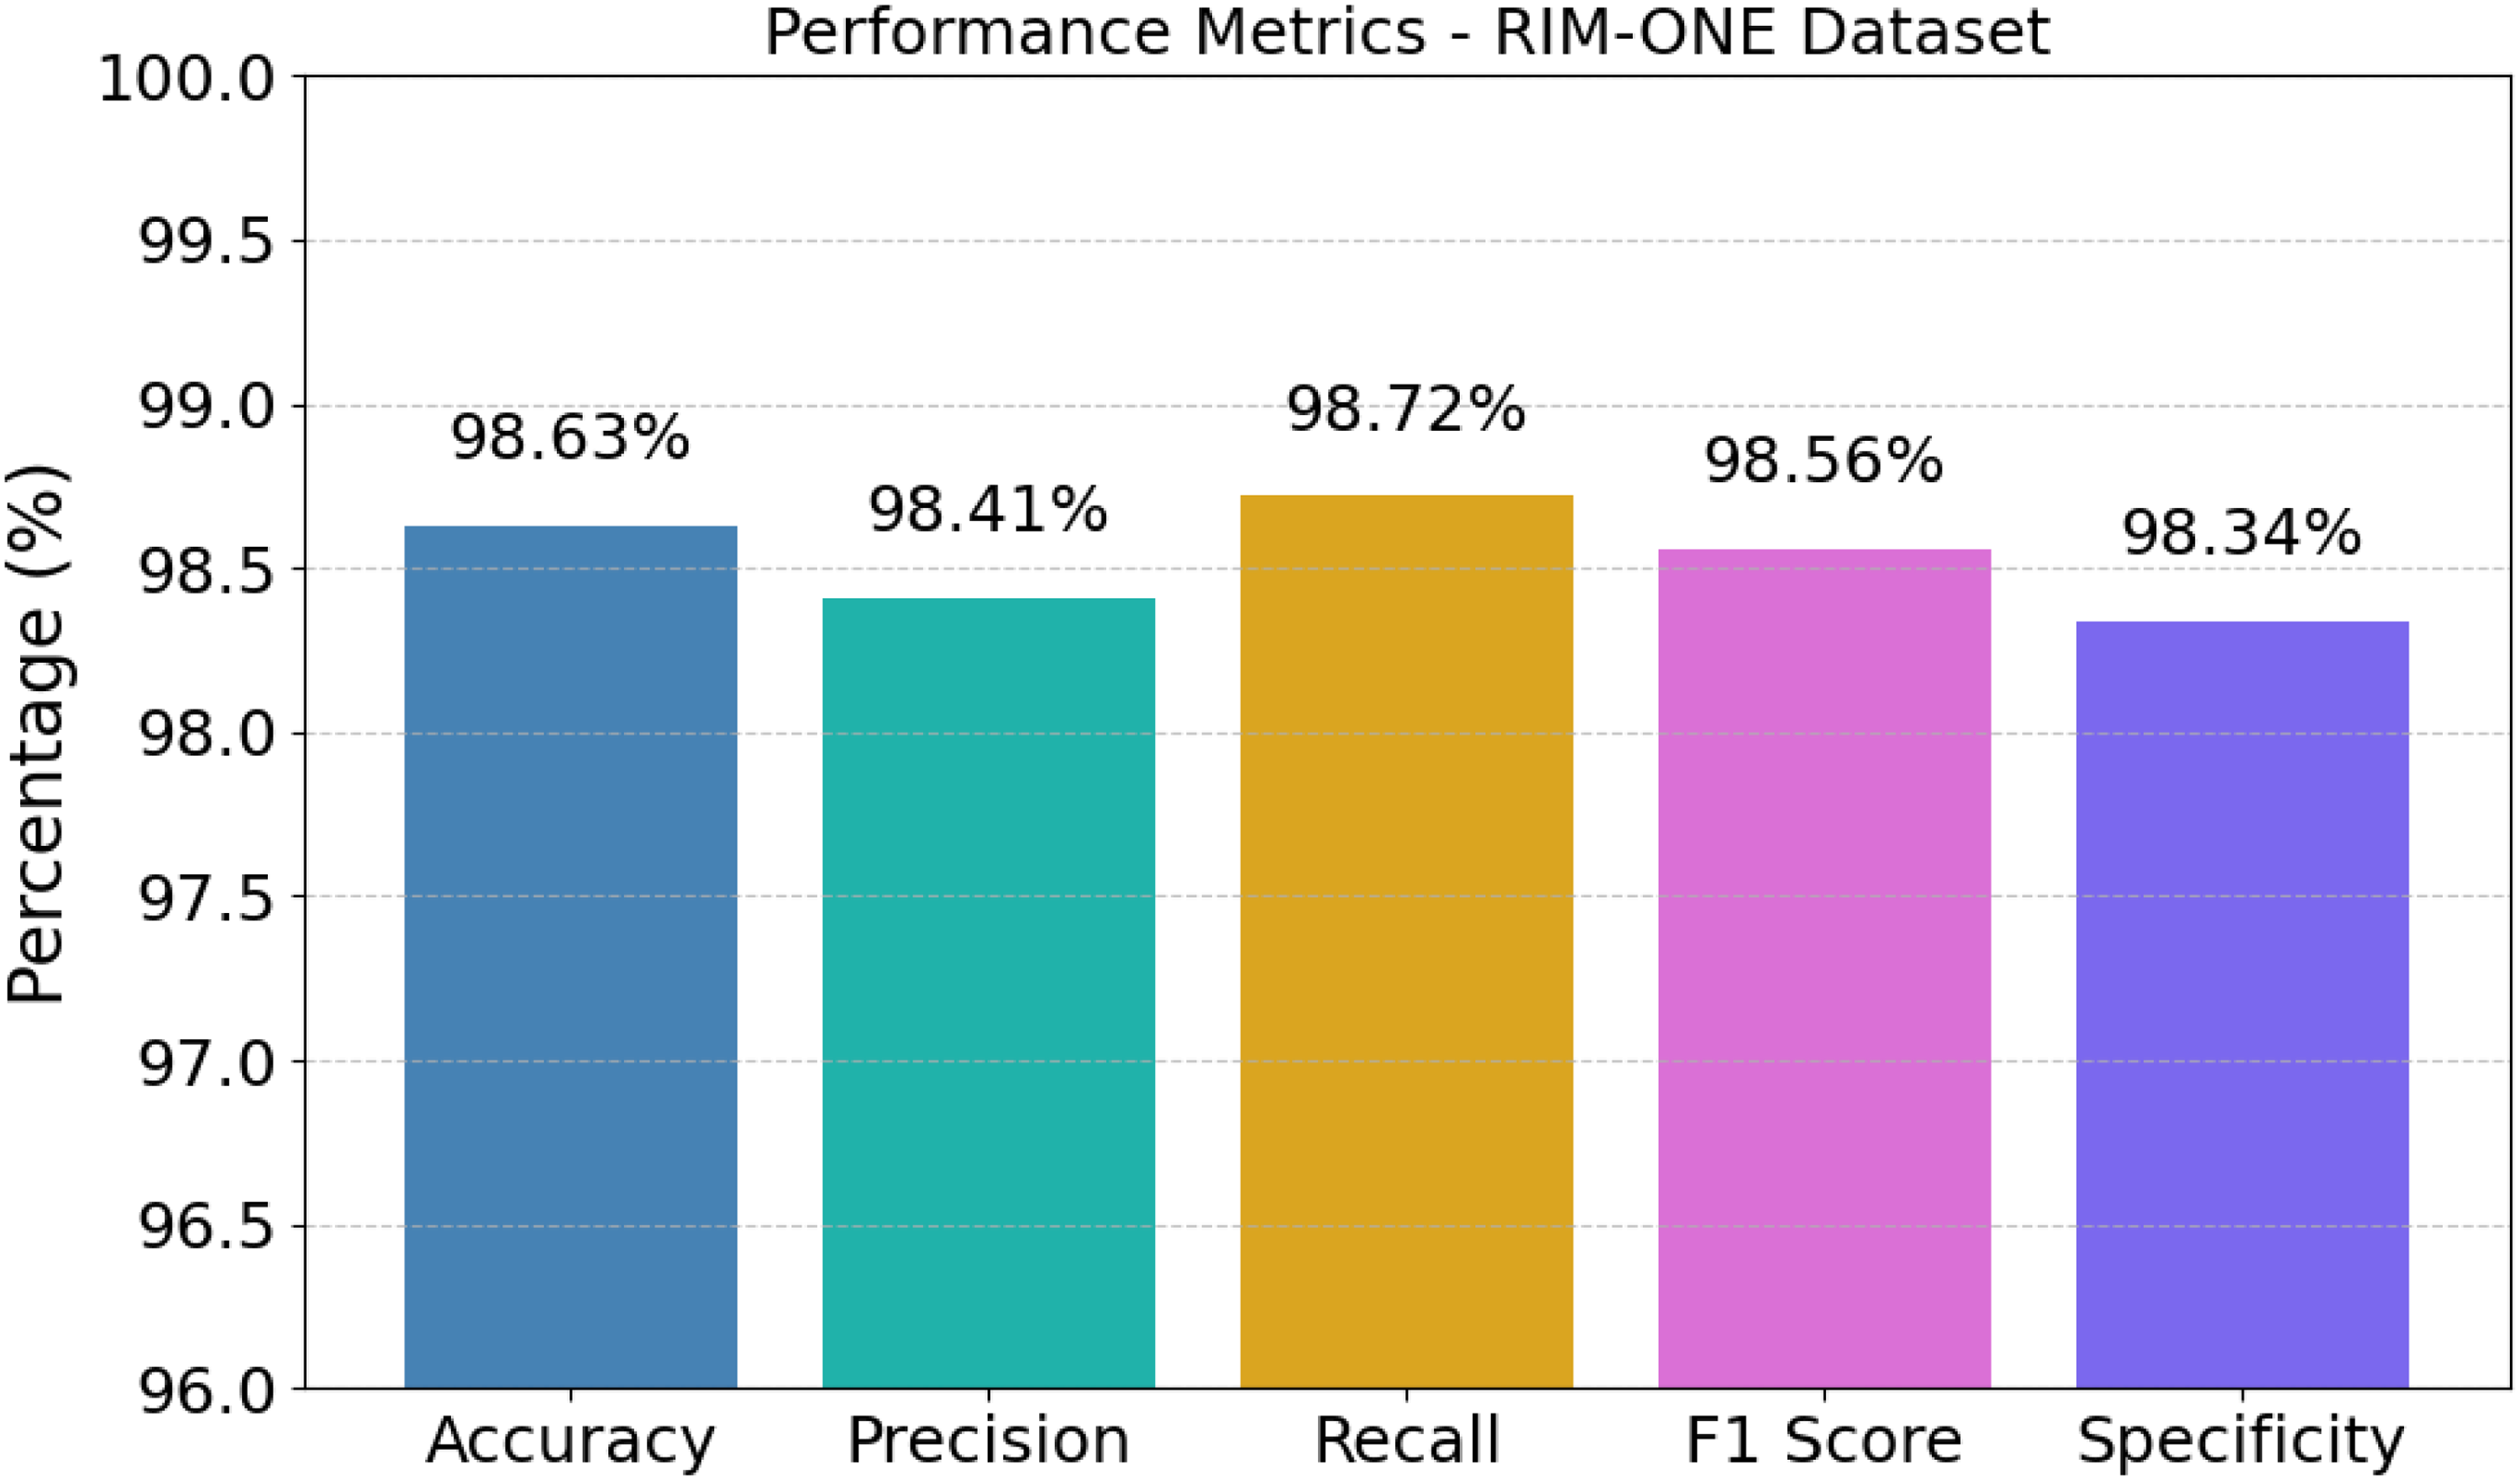
The evaluation results indicate that a well-balanced and reliable classification ability has been obtained from the model developed, with an accuracy of 98.63%, precision of 98.41%, and the highest value of recall of 98.72%, demonstrating that the system is particularly efficient at detecting true positive cases. This overall reliability is perhaps best illustrated in Figure 13, where all performance metrics are aggregated very closely to the upper limit. An F1 score of 98.56% further bolsters the claim that an excellent trade-off has been obtained between precision and recall, while a specificity value of 98.34% shows that false positive detections are kept to fairly low levels. These closely packed high percentage metrics indicate that throughout both positive and negative samples the algorithm maintains fairly consistent predictive strength, making it very suitable for extremely robust medical image analysis.
Performance evaluation of the proposed AME-SegNet model.
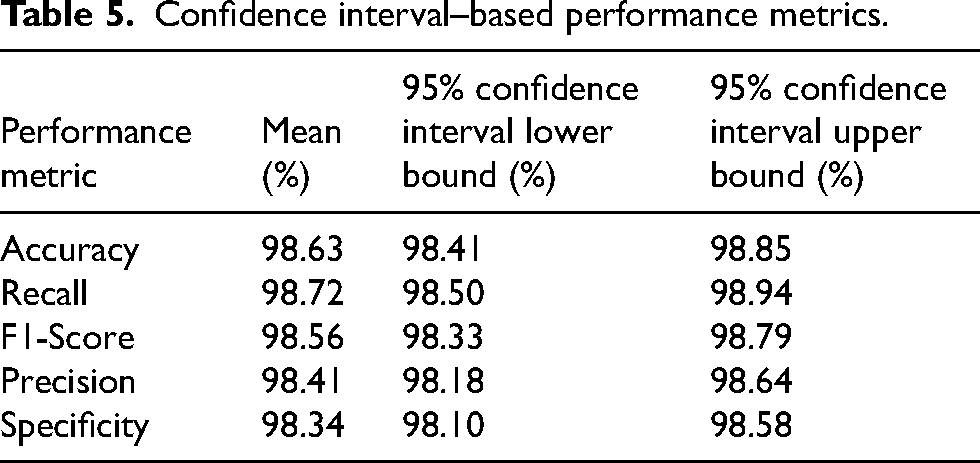
Statistical analysis demonstrated that the suggested method is proving to be highly reliable on the RIM-ONE dataset, as it achieved an average accuracy of 98.63% with confidence bounds ensuring that accuracy varies weakly from 98.41% to 98.85%, an indication that the model maintains strong stability across samples, which is indeed shown in Table 5 where all evaluation indicators exhibited similarly tight bounds. The average precision of the model was 98.41% with confidence bounds of 98.18%-98.64%, while the average recall was 98.72% credible from 98.50% to 98.94%, meaning that the system is equally effective in preventing false alarms while missing true glaucoma cases. Moreover, the F1-score at 98.56% with confidence bounds of 98.33%-98.79% and specificity at 98.34% ranging across 98.10%-98.58% further show that the classifier maintains diagnostic behavior well balanced and strong across the dataset.
Confidence interval–based performance metrics.
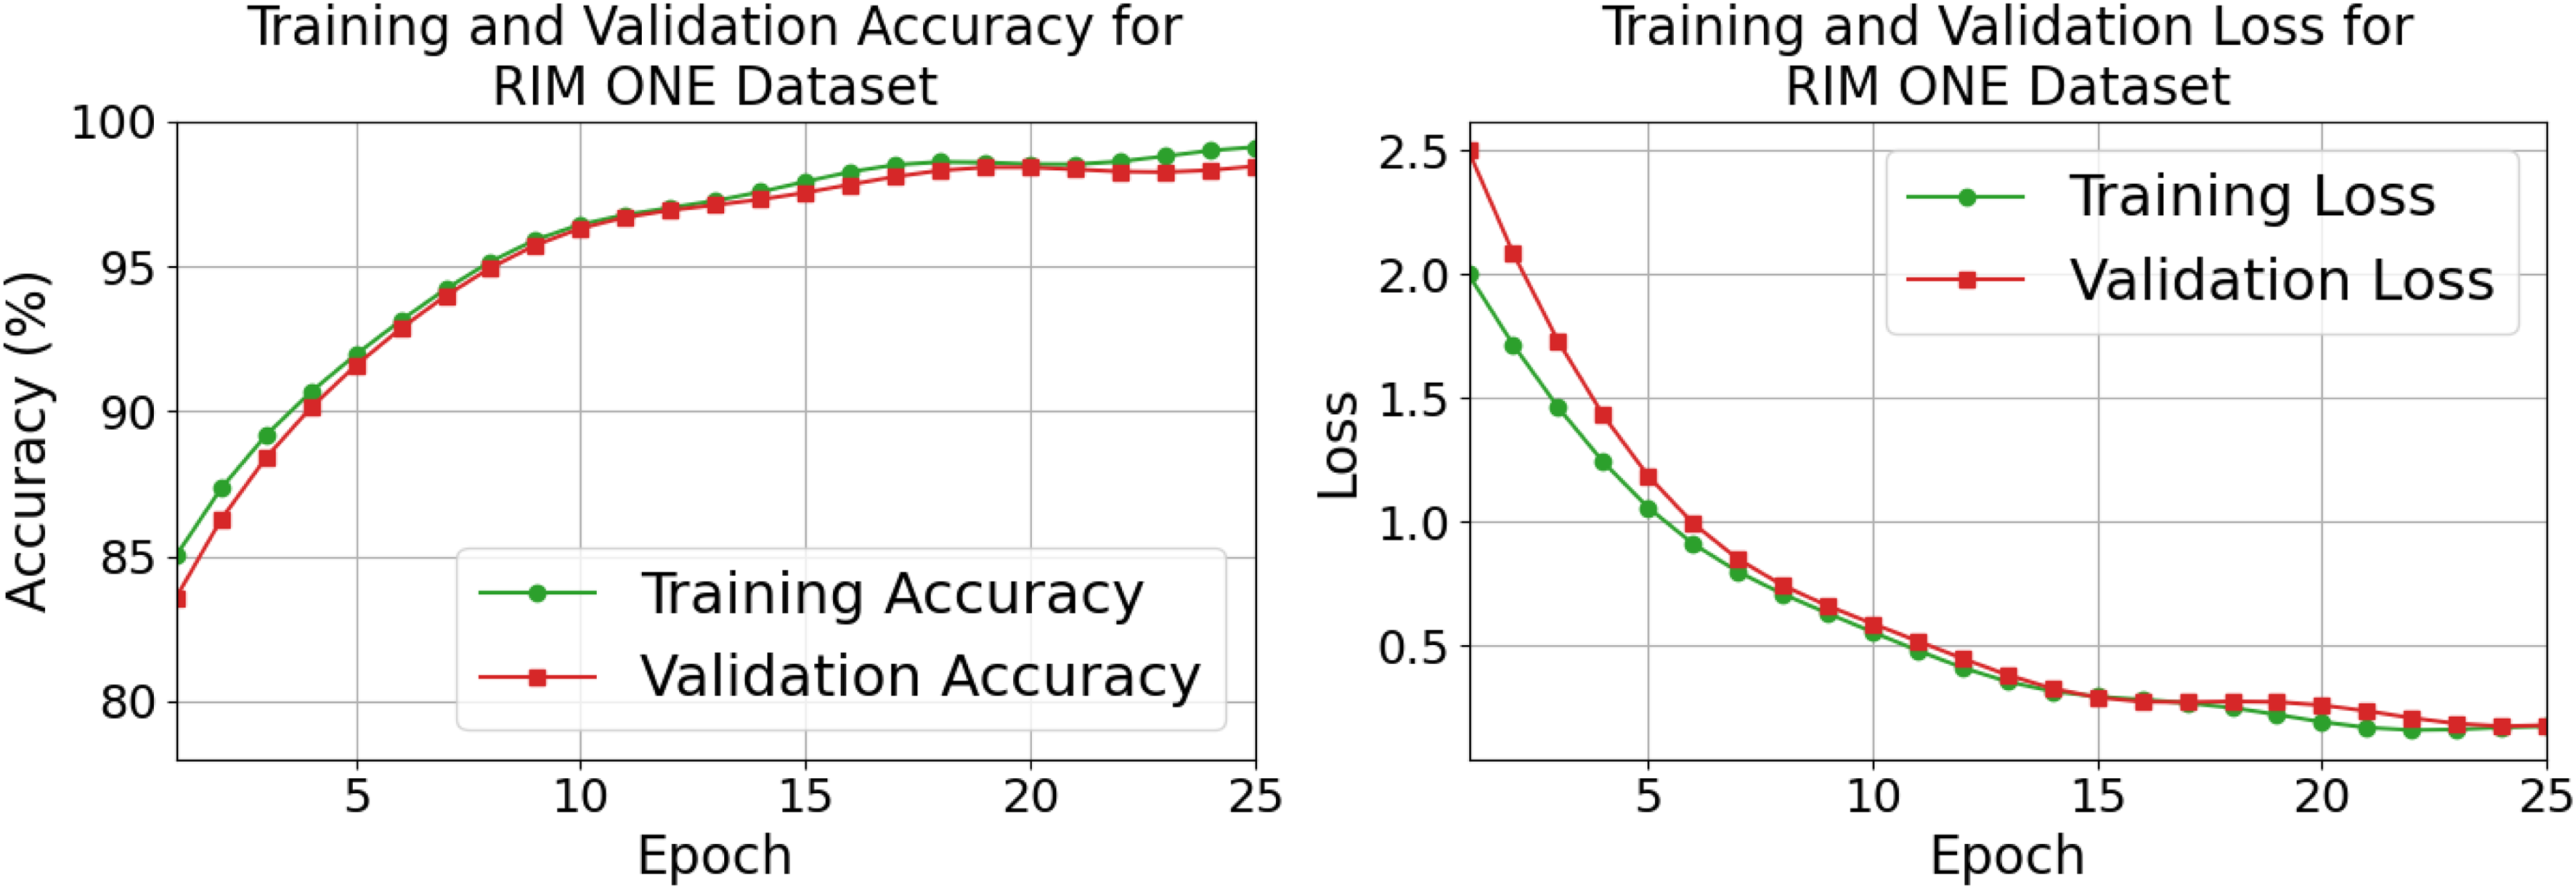
A behavior of learning showed that the network was advancing in a smooth and regulated manner, with the training and validation accuracy improving steadily from the mid-80% zone to a peak of 98.63%, while the corresponding loss curves were falling steadily to a low end of 0.0971, which indicated almost no prediction error, and this entire convergence trend has been clearly illustrated in Figure 14, where both curves traveled a nearly parallel journey without any major deviation. The closeness of the training and validation trajectories indicates that the model generalizes well instead of memorizing the training data, as there were no signs of the model either overfitting or being unstable even in the late epochs. These numerical findings support that the combined optimization strategy and network structure allowed consistent learning in the system leading to high classification reliability and, importantly, a tiny residual error.
Training and validation accuracy and loss.
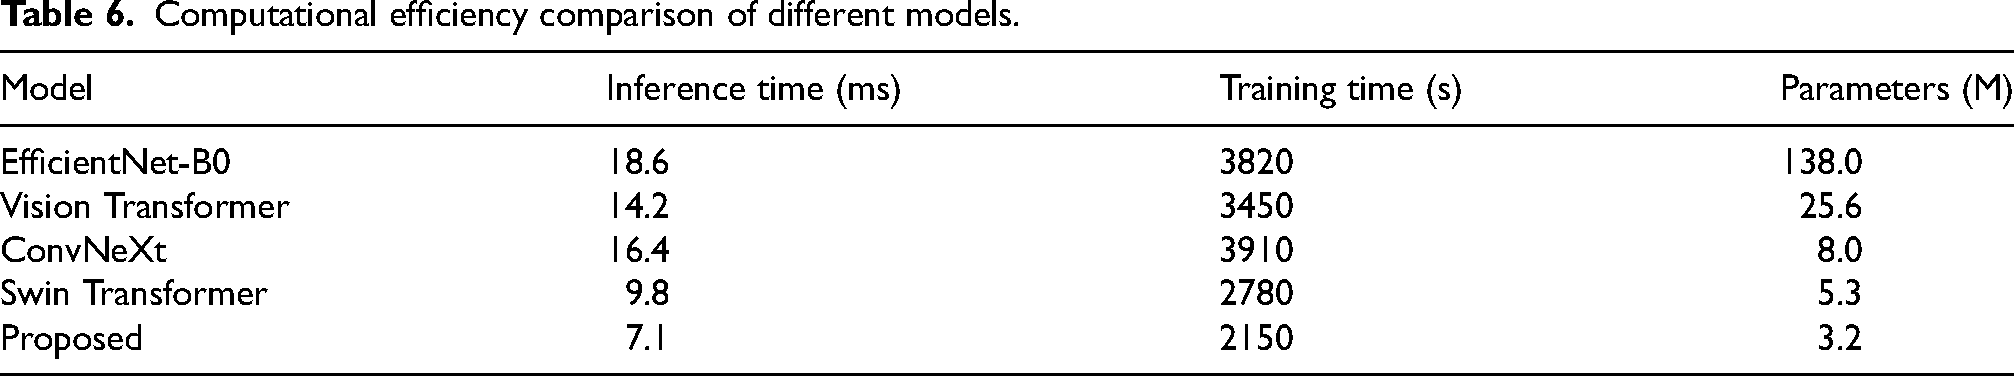
The proposed model is way faster and very efficient from all other deep learning architectures on computational comparison, as it achieved the best inference speed of 7.1 ms, the shortest training time of 2150 s, and is only 3.2 million parameters in size, an advantage clearly shown in Table 6 when compared to heavier networks like EfficientNet-B0 that require 18.6 ms for inference and 138.0 million parameters or Vision Transformer that still uses 25.6 million parameters, even though the run time is 14.2 ms. Even lighter transformer-based designs such as Swin Transformer, with an inference time of 9.8 ms and 5.3 million parameters, are also slower and larger in comparison to the presented model. Such numerical differences would prove that this new framework is a balancing act in speed, memoryspace, and economy in training, thus more suitable for real-time clinical deployment in the RIM-ONE dataset.
Computational efficiency comparison of different models.
Classification results indicate that there is an extremely valid discrimination achieved by the proposed system between healthy and glaucomatous cases: 98.60% of normal samples are sufficiently labeled as normal, whereas only 1.40% are wrongly assigned to the diseased category; conversely, 98.66% of glaucoma images are accurately recognized with just 1.34% misclassified, with Figure 15 clearly demonstrating such balance as both diagonal values dominate the matrix. This near symmetry of the two correct classification rates tells us that the model is not biased toward any of the classes because, for medical screening scenarios, both missed diagnoses as well as false alarms bear their own risks. Thus, these numerical proportions vindicate that the algorithm actually yields a fair as well as robust decision regarding the diagnosis of both the normal and the glaucoma cases with almost equal and very high confidence.
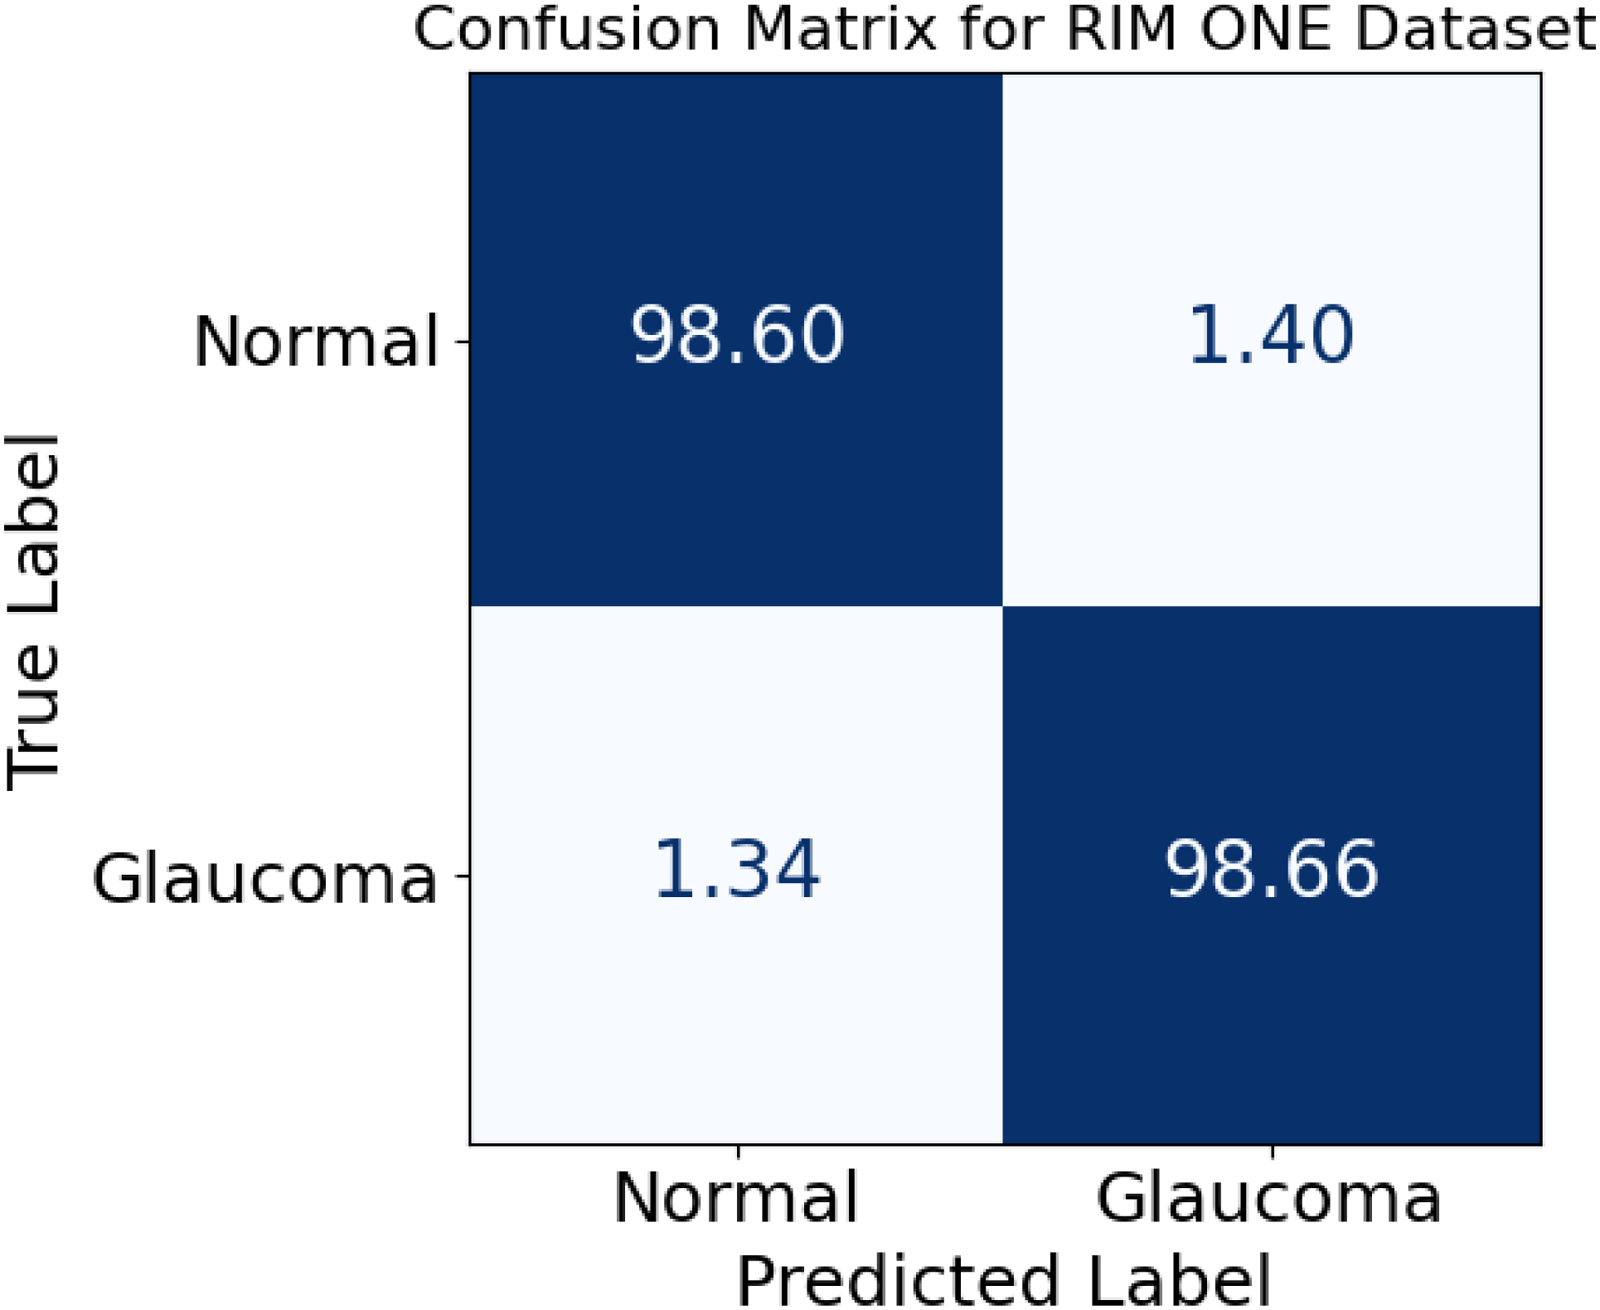
Confusion matrix for normal and glaucoma classification.
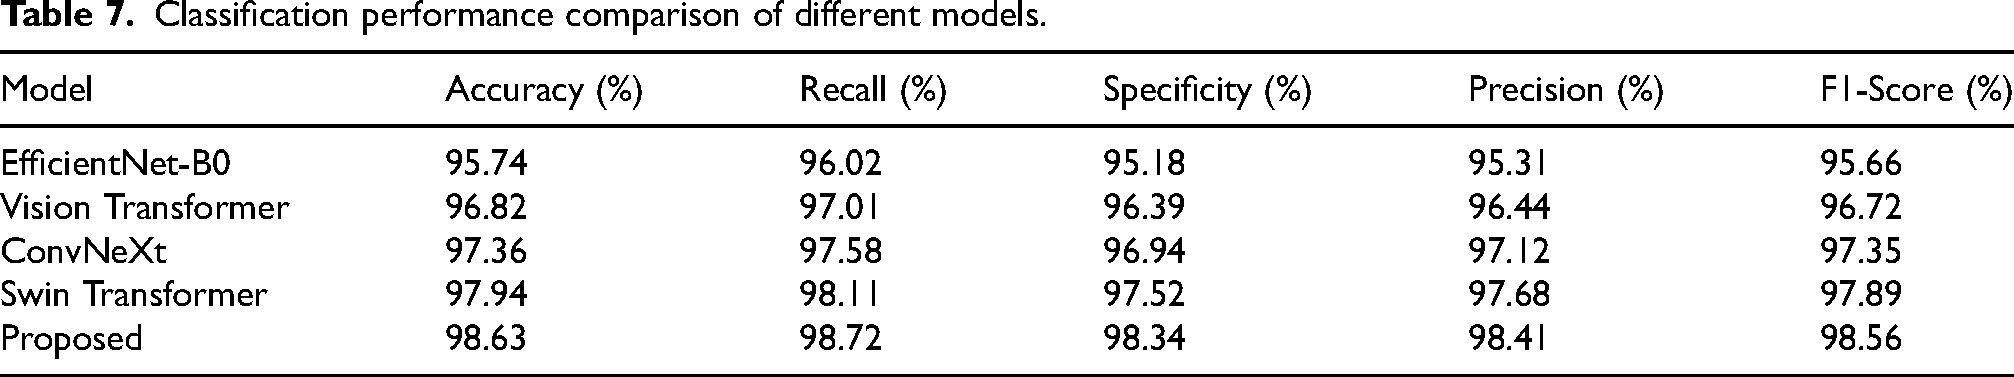
The performance comparison provides evidence that the proposed framework has the best diagnosis value among all the architectures evaluated, achieving an 98.63% accuracy, 98.41% precision, 98.72% recall, 98.56% F1-score, and a 98.34% specificity, higher than those reported Swin Transformer, which are 97.94%, 97.68%, 98.11%, 97.89%, and 97.52%, respectively, and it is a ranking that can be seen in Table 7, where every measure regarding the proposed model reaches the top rank. In contrast, EfficientNet-B0 and Vision Transformer are at the lower side concerning these value numbers. Accurate detection was recorded by the EfficientNet-B0 as moving with an accuracy percentage of 95.74, whereas Vision Transformer recorded it at 96.82, while ConvNeXt brought out a level of 97.36; indicating quite small but consistent lead above these models. The numbers in their respective differences indicate the proposed approach boosts overall correctness alongside enhancing the balance between detecting actual glaucoma cases and avoiding wrong detections on the RIM-ONE dataset.
Classification performance comparison of different models.
The Receiver Operating Characteristic (ROC) patterns illustrate that with little regard for varying decision threshold selection, the model has a very high ability to differentiate between glaucomatous and normal cases. The ROC for the normal category offers an area under the curve of approximately 98.02%, with the glaucoma category closely trailing with an AUC value nearly at 97.96; this is well-demonstrated in Figure 16, whereby both curves are well above the diagonal reference line, indicating the aforementioned near-perfect separation. At low false positive rates below 0.10, true positive rates have already exceeded about 0.90 for both classes, which means that the system can identify almost all diseased and healthy samples with very few false alarms. These numbers thus confirm that the classifier is preserving good sensitivity and specificity at the same time, which renders it very useful for screening and diagnostic assistance.
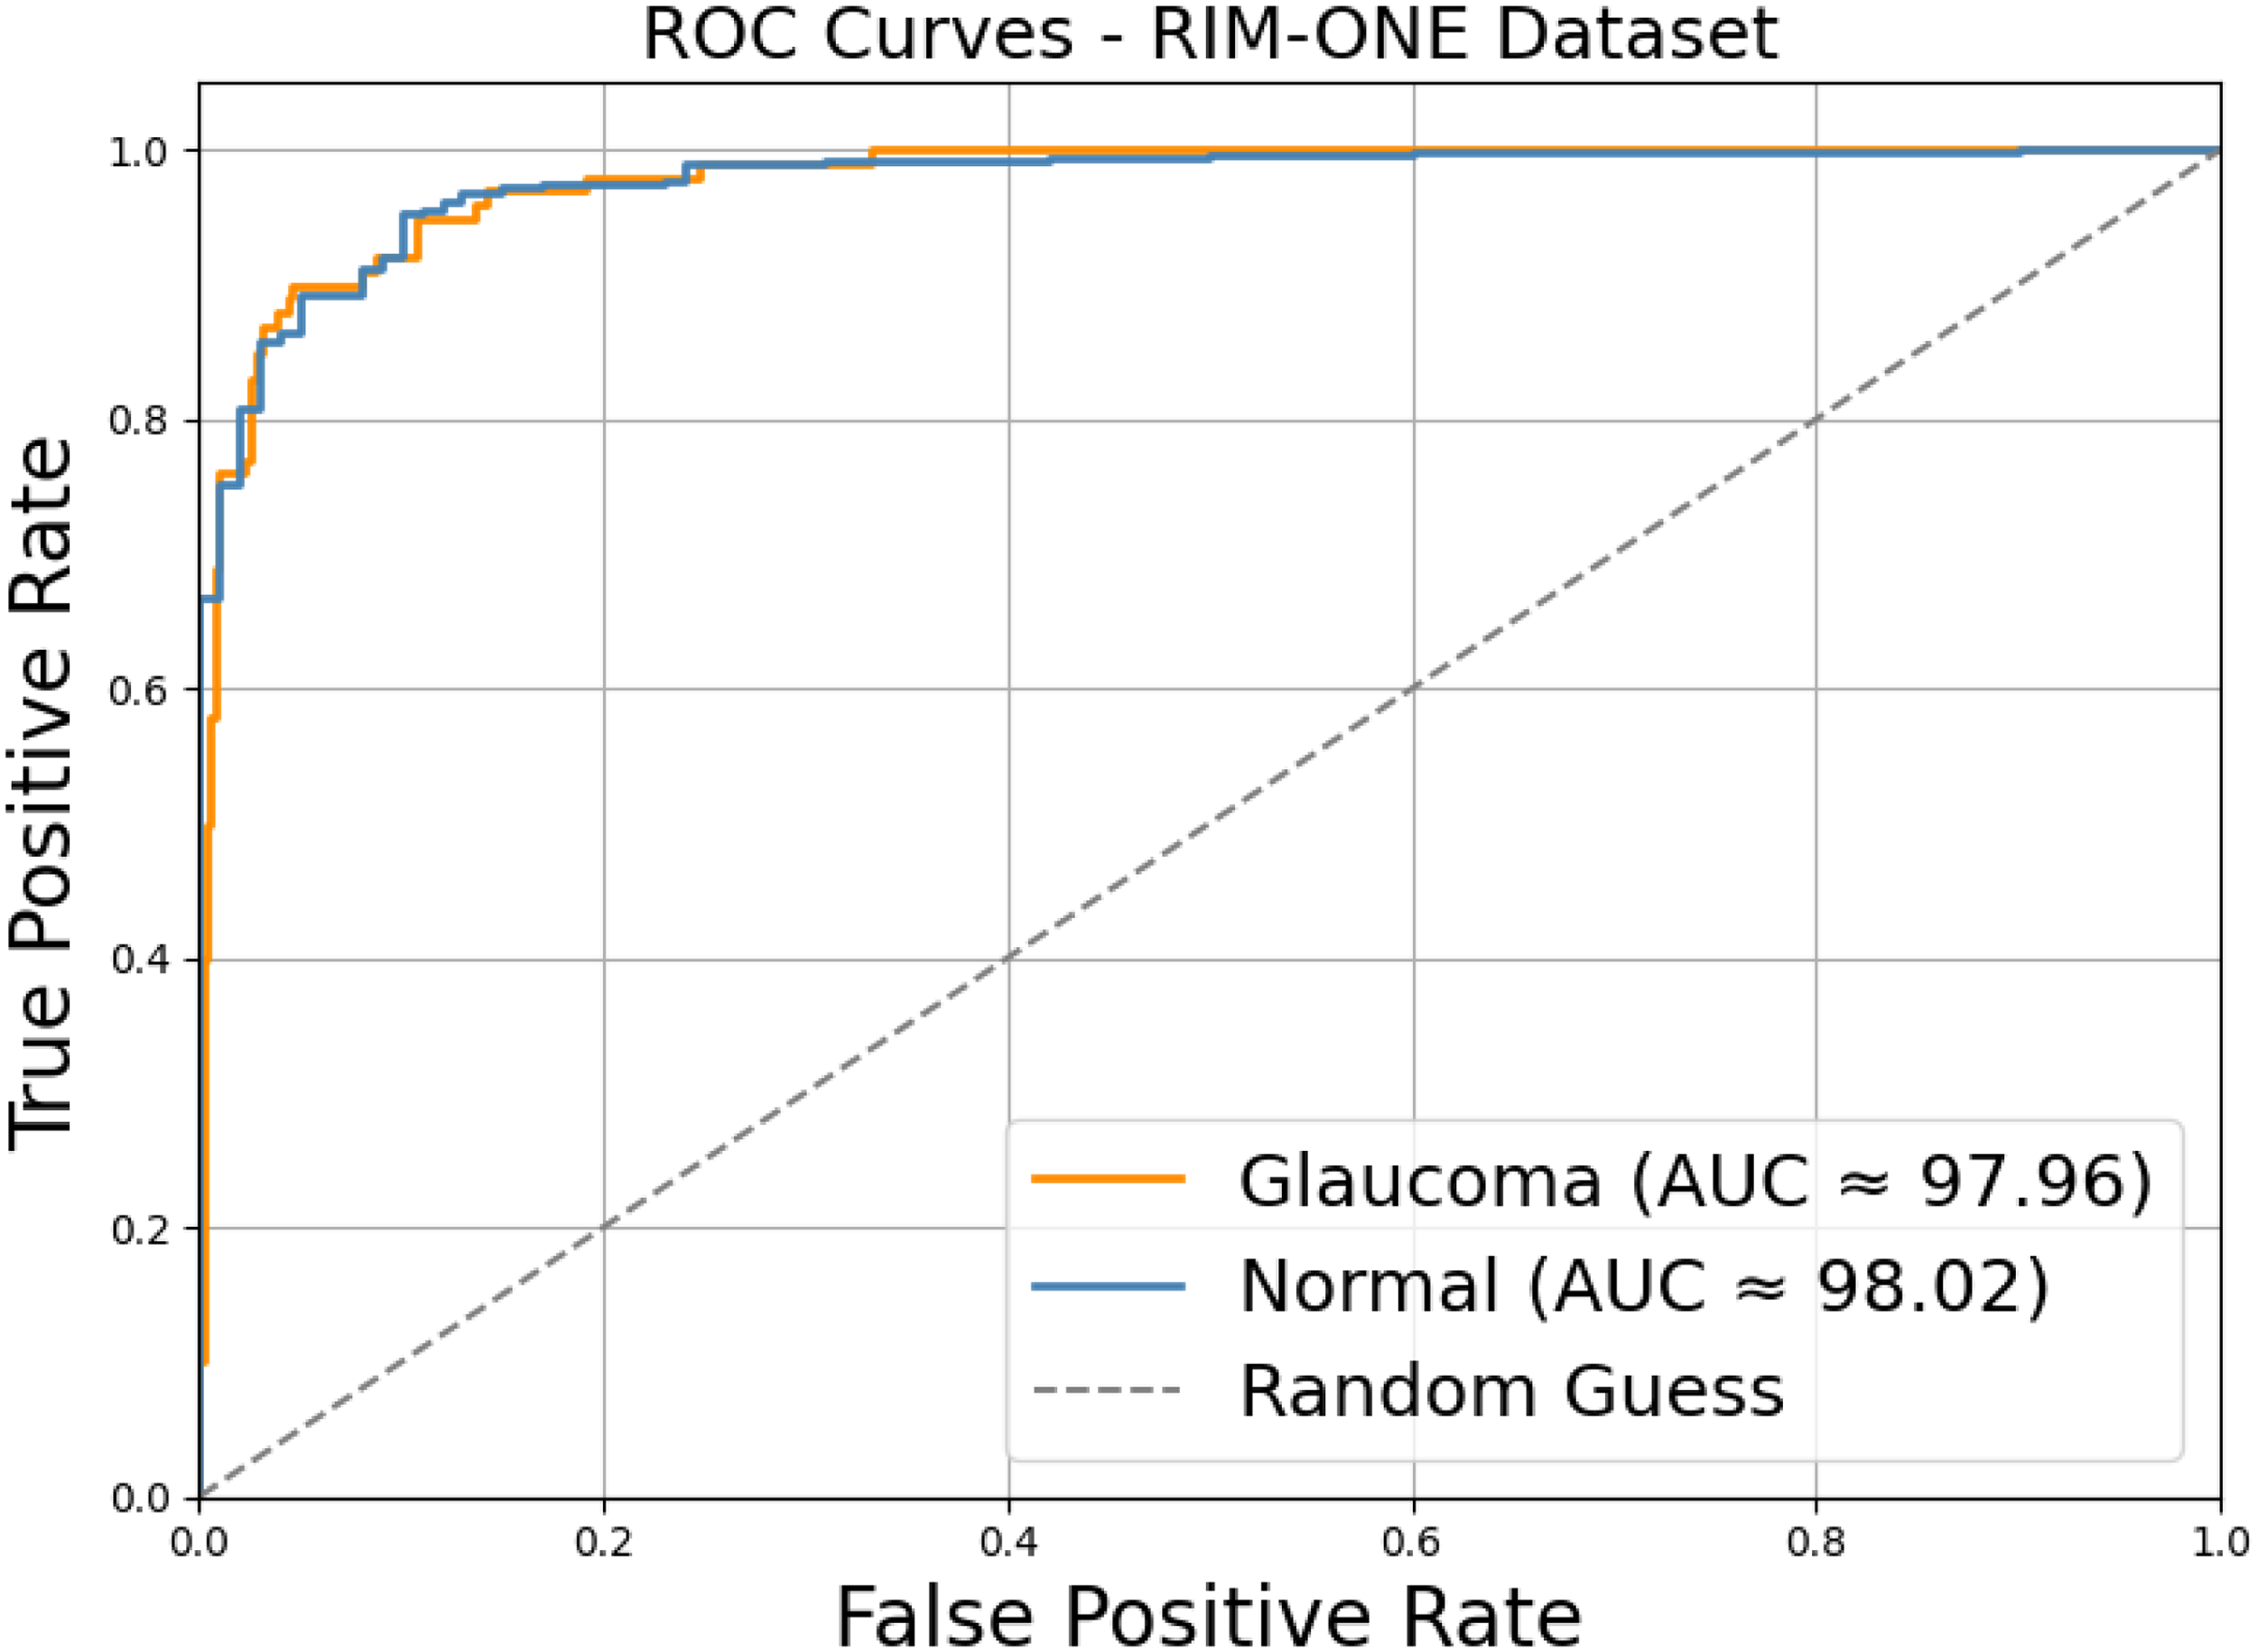
ROC curves for normal and glaucoma classification.
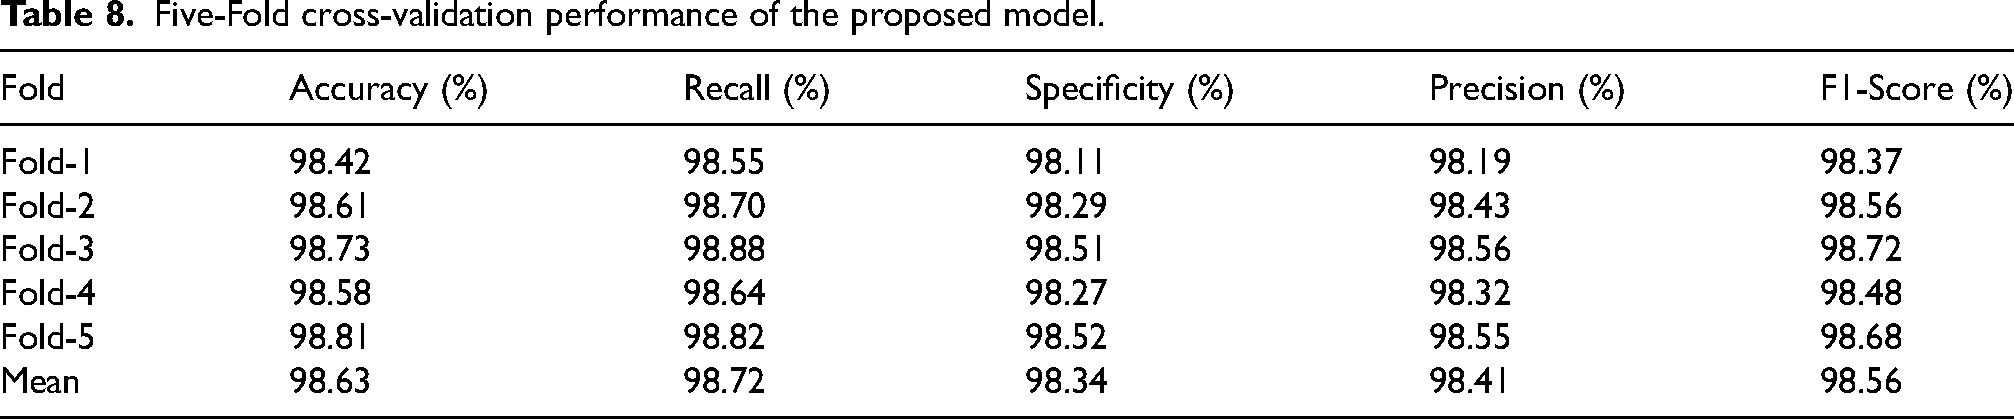
The results from five-fold validation indicate that the model provides a stable and replicable effectiveness on the RIM-ONE dataset, with the accuracy values falling in the range of 98.42% on Fold-1 to 98.81% on Fold-5, whereas precision varied only marginally from 98.19% to 98.56% with very little fluctuation across the different data splits; such an attribute was evidently indicated by Table 8 where the mean accuracy was set up at 98.63%. The recall has also shown steadiness in its performance, with scores from Fold-1 down to Fold-3 lying between 98.55% and 98.88%, respectively, while the F1-score moved in the narrow band from 98.37% to 98.72%, showing that relative sensitivity and balance have been preserved again in all folds. Specificity also exhibited the values of 98.11–98.52%, yielding an average specific to the class label of 98.34%, thus corroborating the claim that the classifier has good consistency and generalization, consistent across partitionings of the dataset.
Five-Fold cross-validation performance of the proposed model.
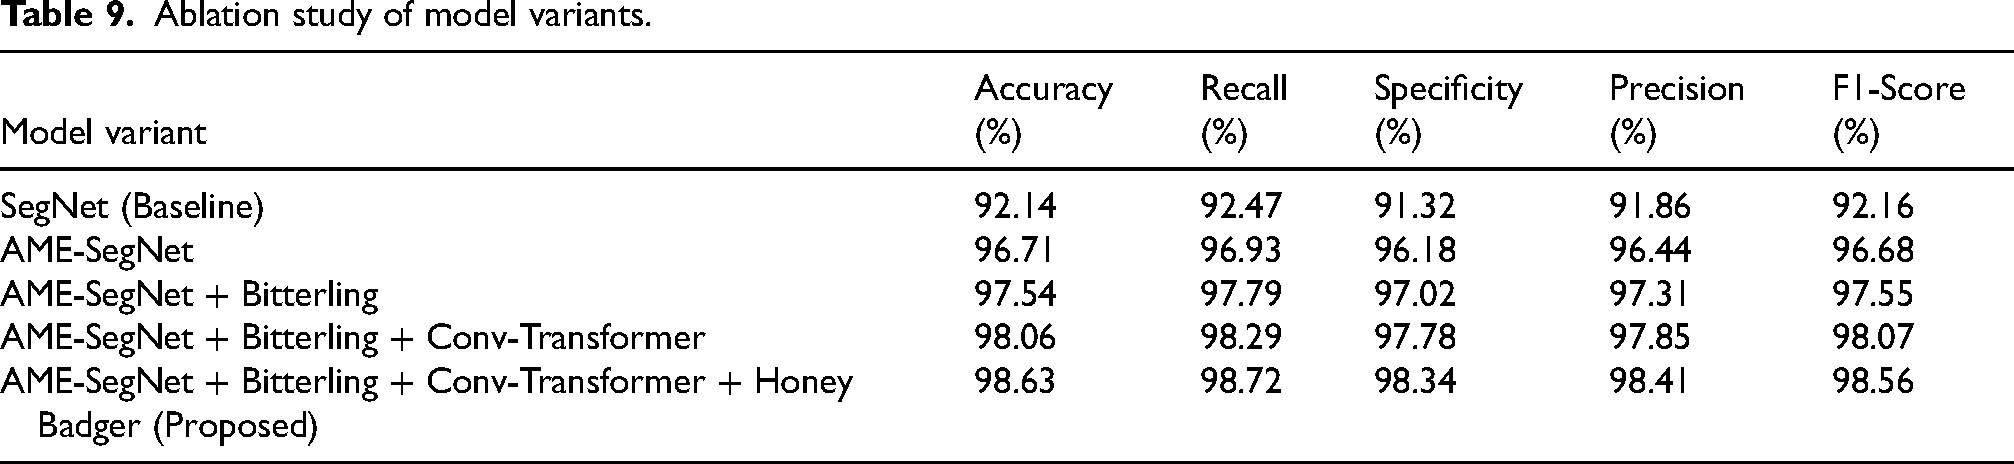
Progressive enhancement studies show that every successive component added contributes a quantifiable increase in diagnostic quality, starting with the base SegNet at 92.14% accuracy; from there, moving to AME-SegNet with a major increase to 96.71%; the next integration of Bitterling optimization increased accuracy to 97.54%. Adding Conv-Transformer increased it back on top to 98.06%, and the entire upward trend is nicely summed up in Table 9, with the full proposed setting achieving the highest accuracy of 98.63%.This pattern is also visible in precision, recall, and F1-score, with values steadily improving from around 91–92% for the baseline to 98.41% precision, 98.72% recall, and 98.56% F1-score for the final model. The specificity increased from 91.32% to 98.34%, thereby indicating that every refinement made, be it architectural or optimization, strengthens the ability of the system to correctly discriminate healthy and glaucomatous cases on the RIM-ONE dataset.
Ablation study of model variants.
Classification result – ORIGHA dataset
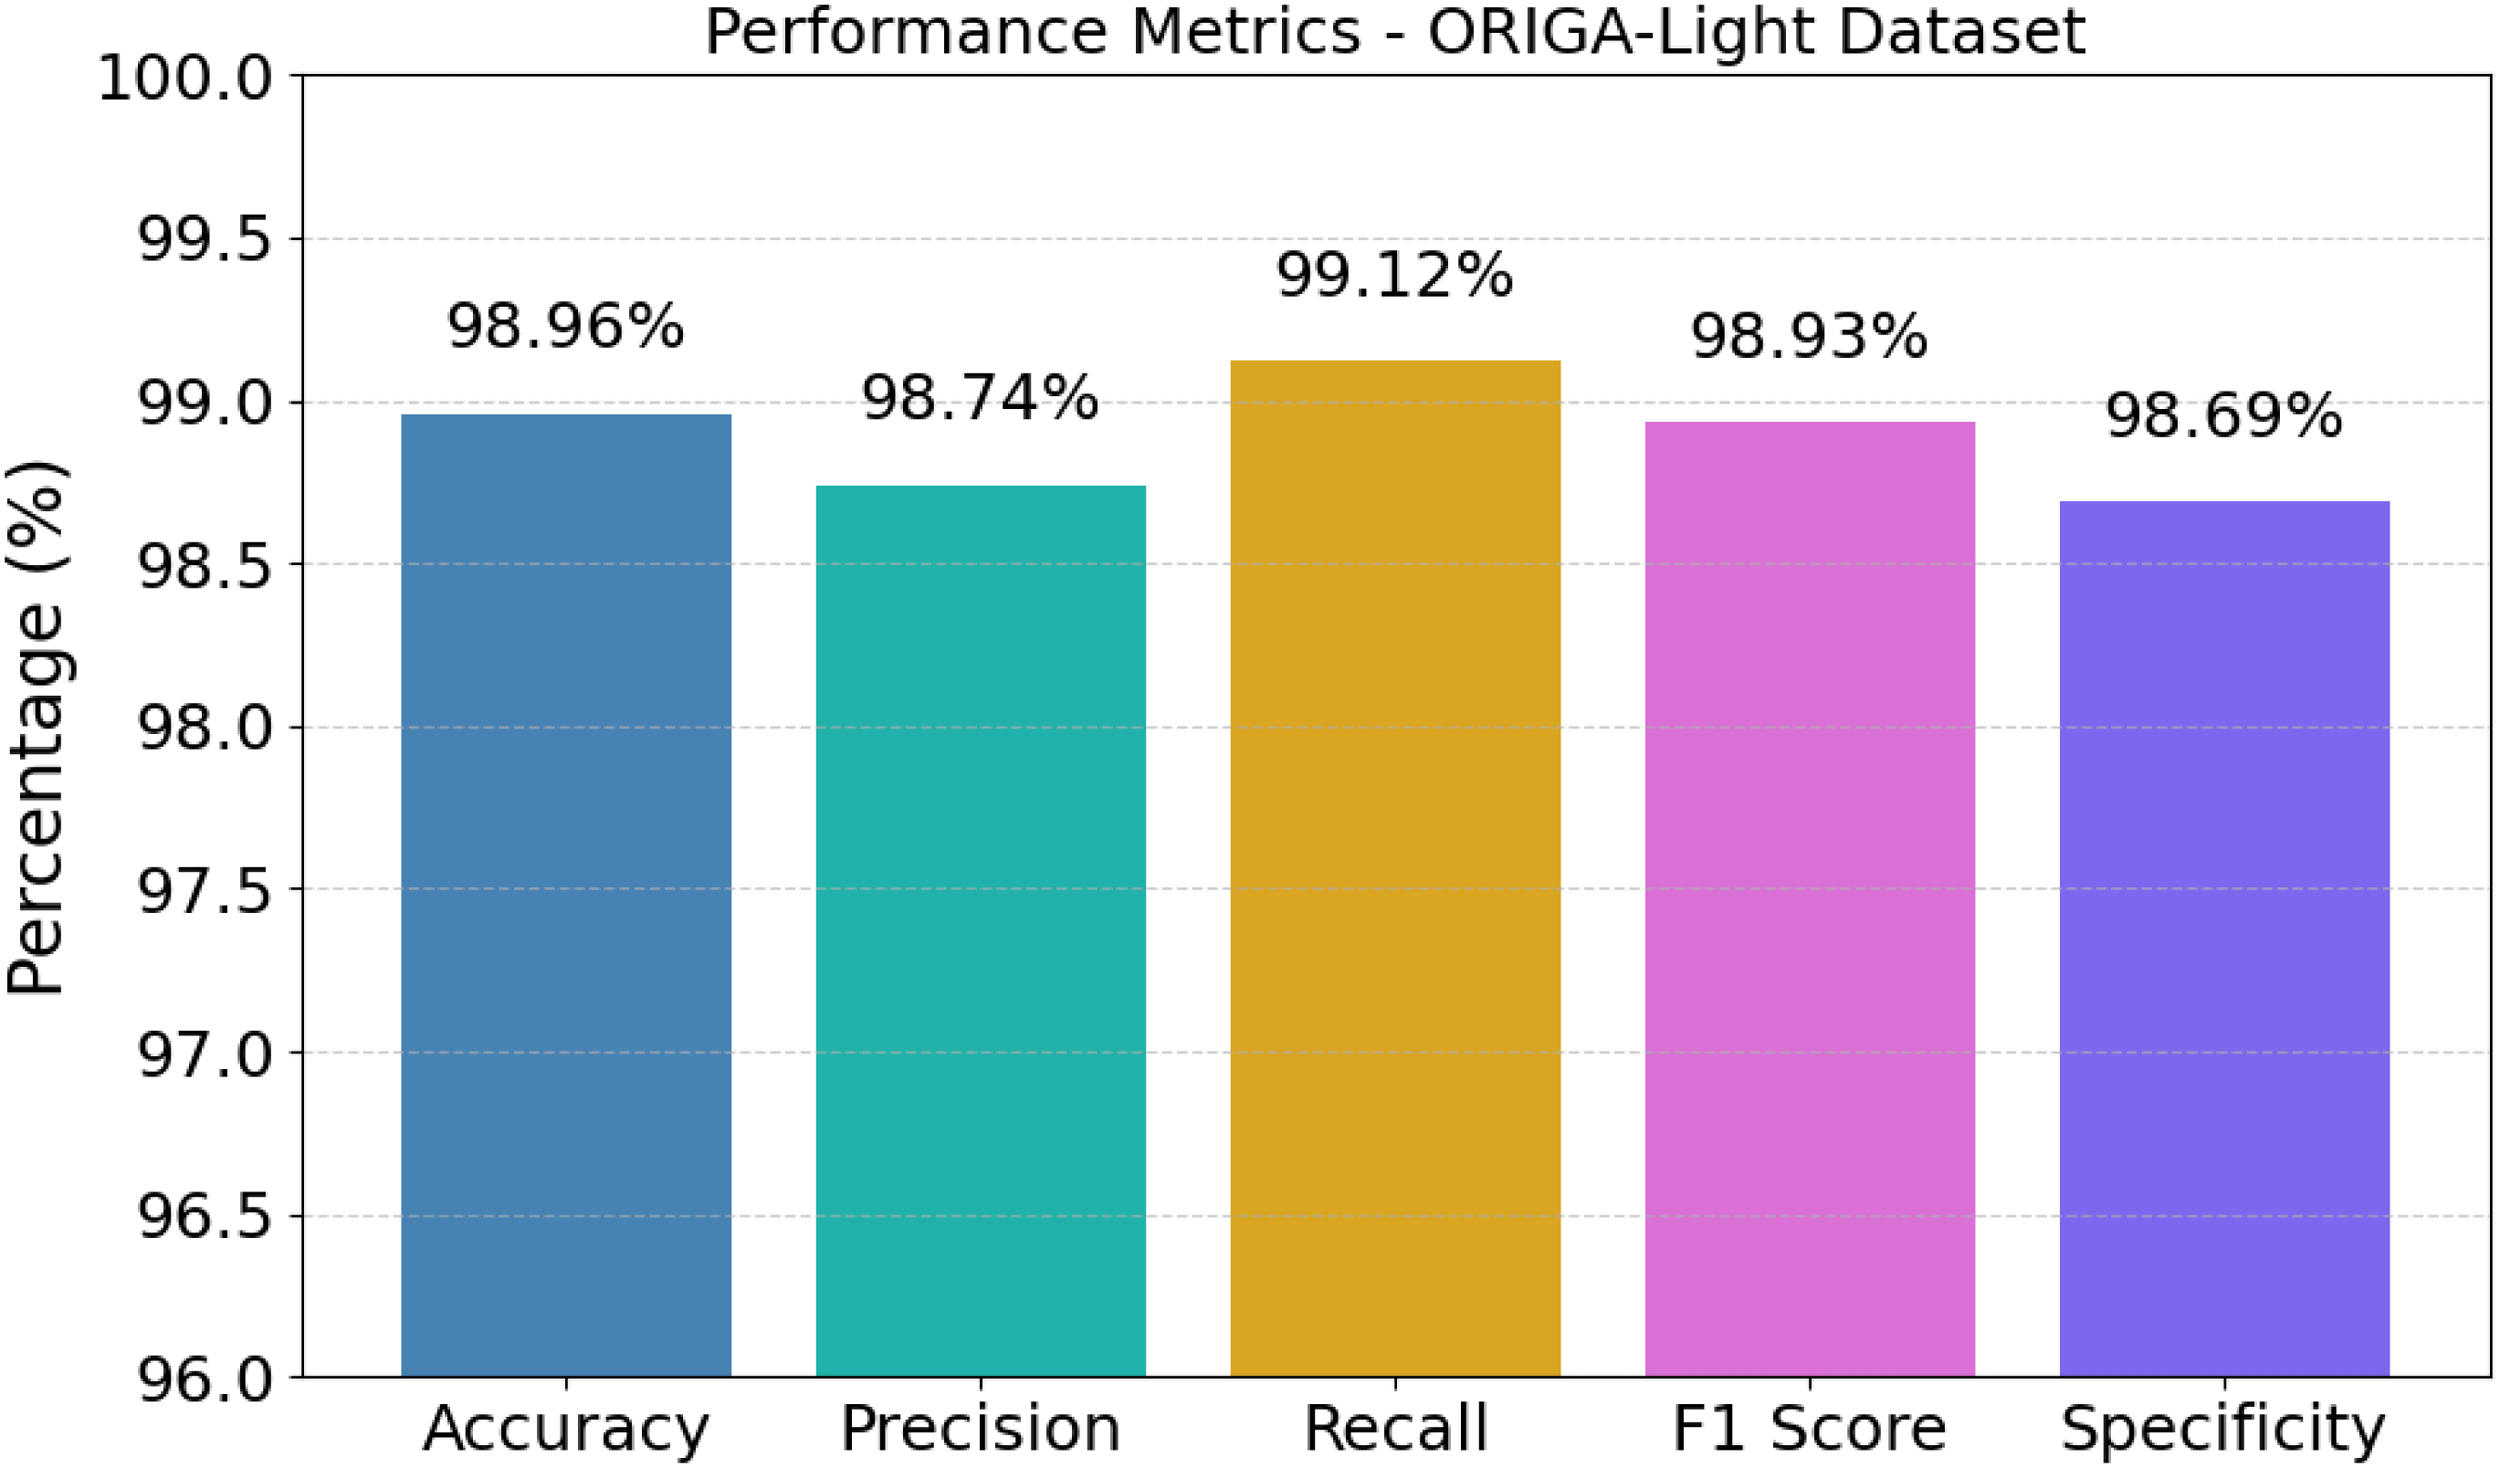
The statistics show that the model has quite a consistent diagnostic quality over the ORIGA-Light dataset with an overall accuracy of 98.96%, precision being recorded at 98.74%, and recall giving away the superlative value 99.12%- all establish that true glaucoma cases are recognized very reliably. This balanced performance is altogether shown in Figure 17 where all measures are firmly packed near the top of the scale. The F1 score of 98.93% further certifies that the harmony between sensitivity and precision is well maintained, whereas the specificity of 98.69% indicates that normal samples are similarly classified correctly with very few false alarms. These values together show that the system is capable of providing dependable screening results across both diseased and healthy images without noticeable bias.
Performance metrics of the proposed AME-SegNet model.
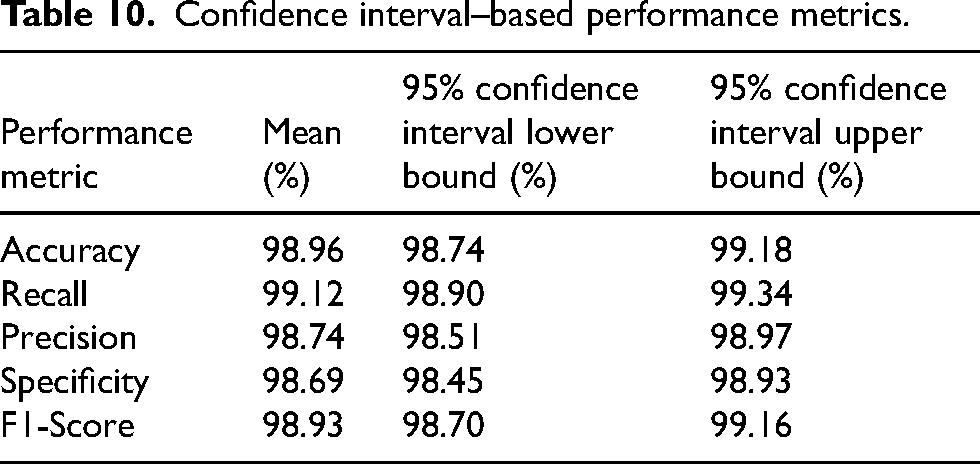
The confidence interval evaluation shows that the suggested method has indeed achieved highly reproducible and thus trustworthy performance on the ORIGA-light dataset characterized by a 98.96% mean accuracy, and with very narrow limits from 98.74% to 99.18%, showing minimal variability across samples. This robustness is clearly demonstrated in Table 10 with all the metrics being tightly bounded in the same manner. Precision was very high, with an average of 98.74% with limits of 98.51% to 98.97%, whereas recall is even higher at 99.12% within intervals of 98.90% to 99.34%, denoting that capture of true glaucoma cases is highly reliable. Also, the classifier being confirmed with an F1-score of 98.93% ranging between 98.70% to 99.16% and specificity of 98.69% between 98.45% to 98.93% shows that it has maintained highly balanced and stable diagnostic behavior across the ORIGA-Light dataset.
Confidence interval–based performance metrics.
The learning trajectory indicates progressive and consistent adaptation of the network in ORIGA-Light, where the accuracy of training and validation swells from very low values to the final level of 98.96%, and the corresponding loss curves decrease regularly into a minimal value of 0.0648, indicating effective minimization of prediction errors, which synchronized behavior can be observed in Figure 18, where the two sets of curves are closely aligned paths. The small gap between training and validation trends indicates that the model generalizes well as opposed to memorizing specific samples since neither curve shows any instability or divergence even at later epochs. These numbers confirm that the training strategy creates a stable and effective learning process leading to a highly reliable classifier with minimum residual errors.
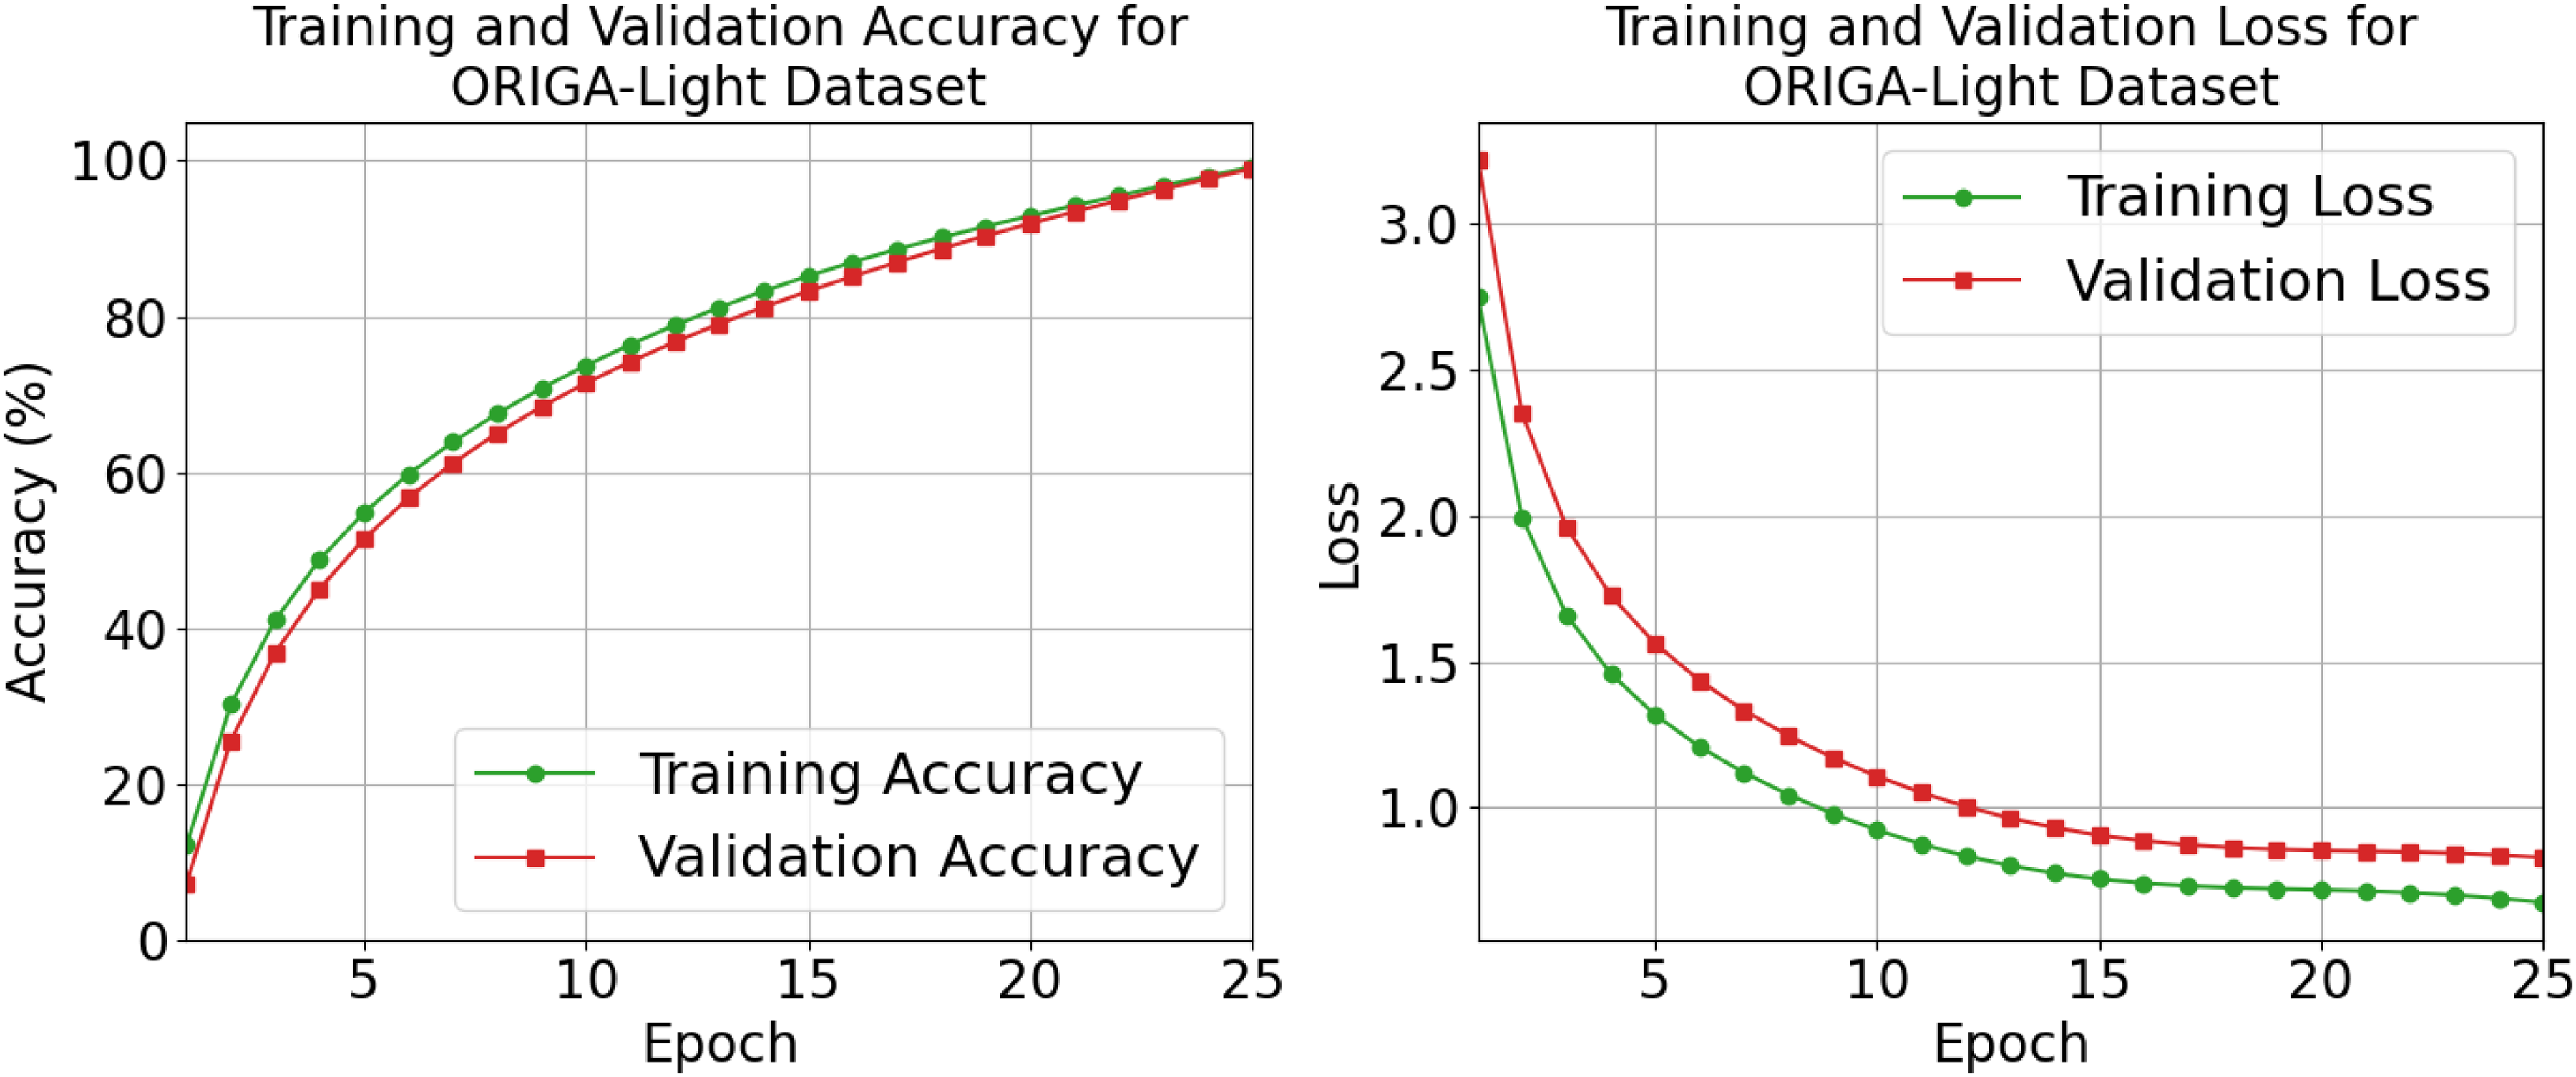
Training and validation accuracy and loss.
Comparative efficiency shows the proposed network yields an extreme advantage in both speed and resource consumption on the ORIGA-Light dataset, providing an inference time of 7.3 ms and a training time of 2720 s, using only 3.2 million parameters, with this high advantage summarized in Table 11 when compared to even heavier models like EfficientNet-B0, which takes 18.9 ms in inference with 138.0 million parameters, or Vision Transformer, with 14.5 ms and 25.6 million parameters. Even amongst the standard deep models, Swin transformer is the smallest model with 5.3 million parameters and 10.1 ms inference time, but it still is neither as fast nor as small as the proposed method. These numerical differences hence confirm that the new architecture presents the most efficient trade-off between learning capacity and computational efficiency and thus can highly be favored for practical application in glaucoma screening tasks.
Computational efficiency comparison of different models.
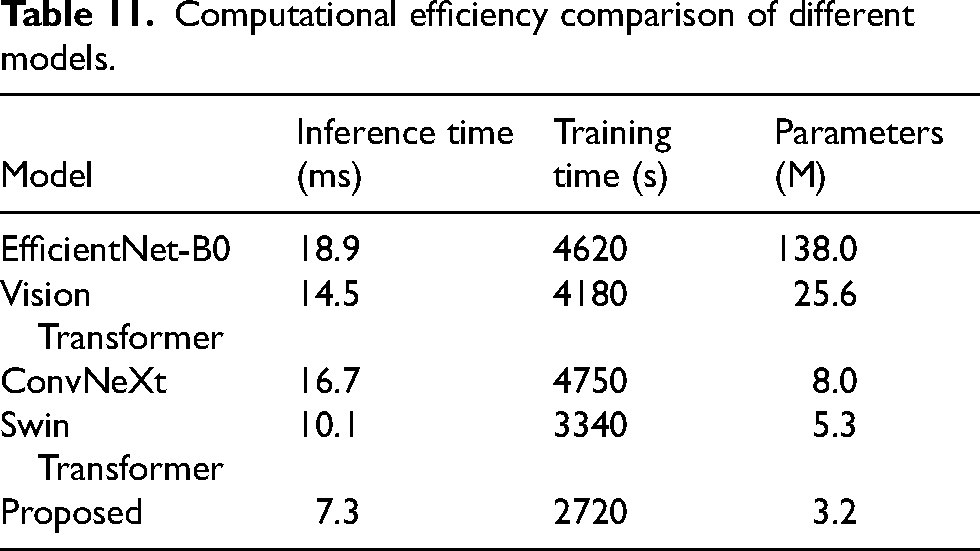
As depicted in the confusion matrix, this classifier is capable of extremely strong discrimination on the ORIGA-Light database, identifying 99.46% of normal images as normal while 0.54% are erroneously considered glaucomatous; similarly, 98.46% of glaucoma samples are correctly identified, with only 1.54% misclassified as normal. Such strongly balanced outcomes are illustrated in Figure 19, in which dominate values generally appear along the main diagonal. The very small off-diagonal percentages show that both false alarms and missed detections are maintained at negligible levels, which is of critical importance for any clinical decision-making. These numerical proportions are the proof that the system holds a high degree of reliability for either class, ensuring true efficiency in screening cases of glaucoma and health.
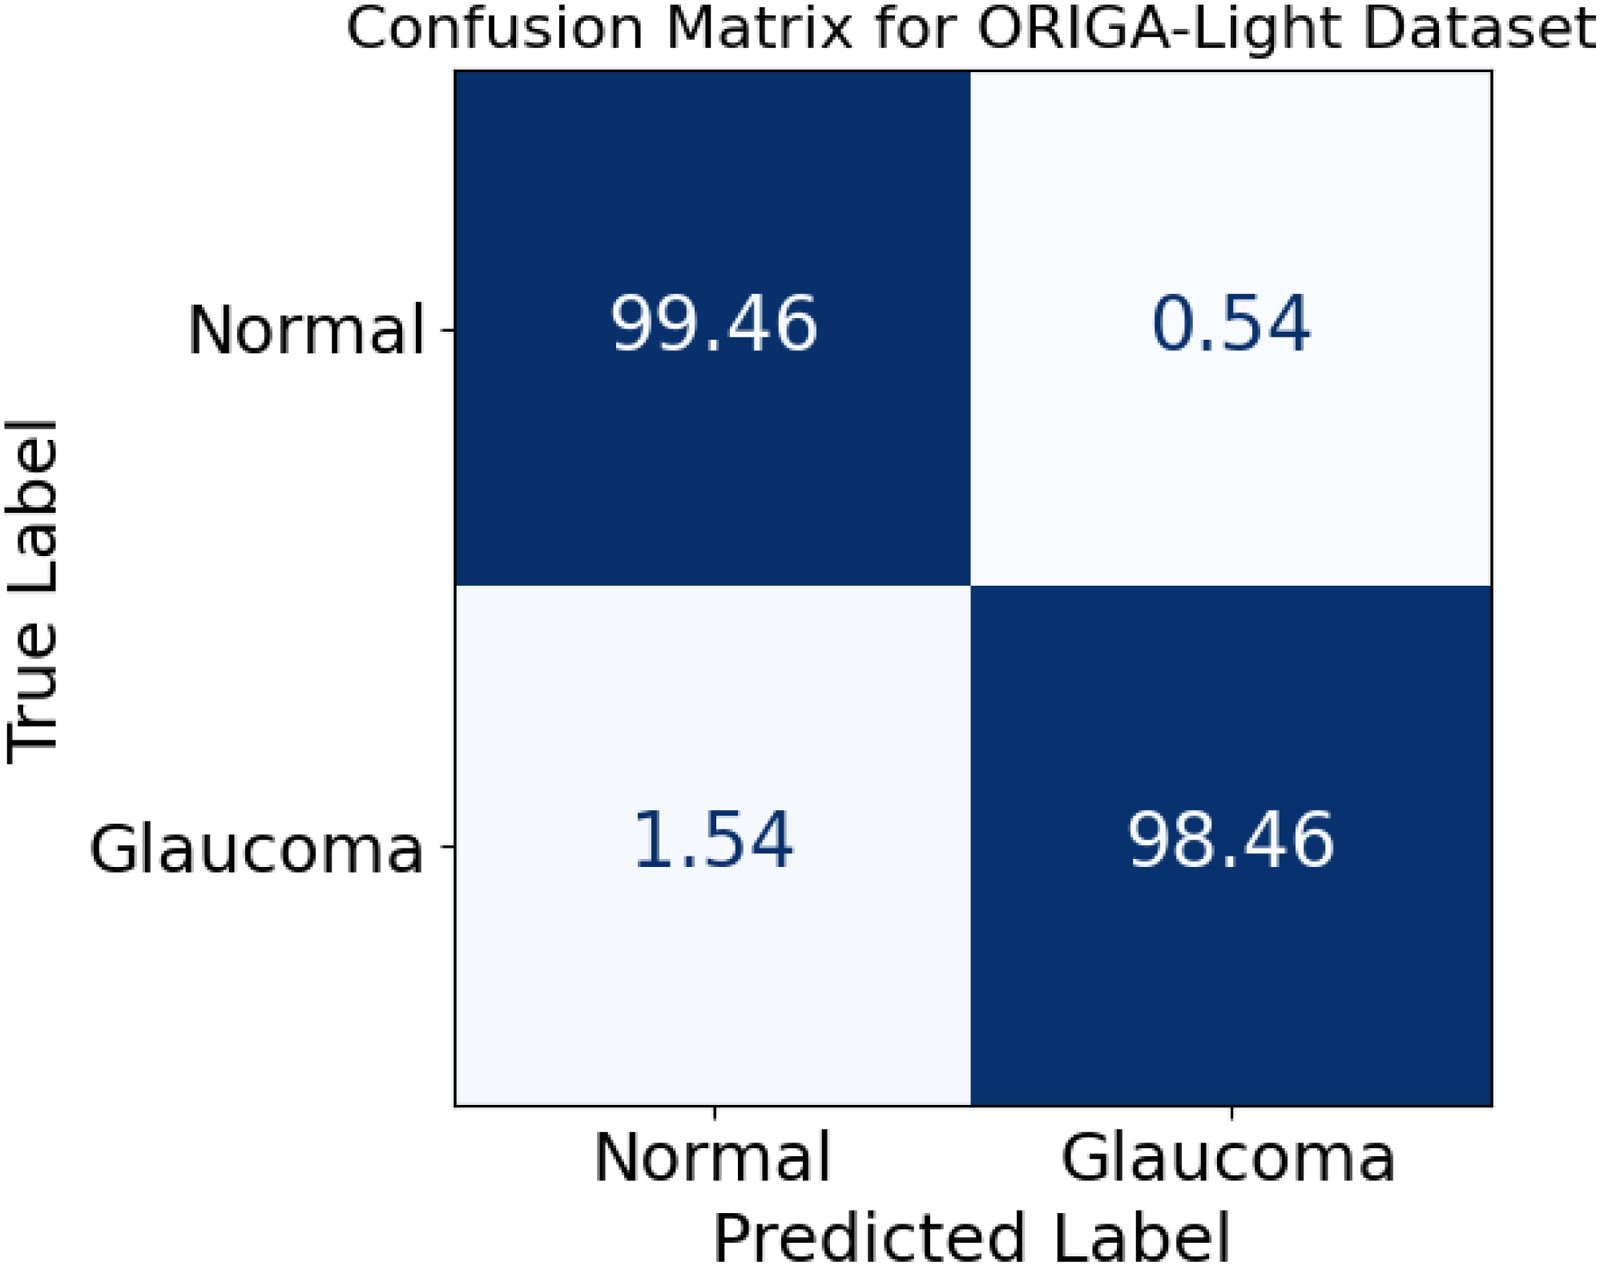
Confusion matrix for normal and glaucoma classification.
The comparative study proves that the proposed model has the highest diagnostic performance in the ORIGA-Light dataset: accuracy 98.96%; precision 98.74%; recall 99.12%; F-1 score 98.93%; and specificity 98.69%-all better than Swin Transformer with 98.42% accuracy and 98.16% specificity, a ranking endorsed by Table 12, where the proposed model leads on every parameter. Compared to EffectiveNet-B0 with 96.21% accuracy and the Vision Transformer at 97.42%, ConvNeXt gains more momentum, reaching 97.96%, marking a slight improvement towards the glory of best-performing models. The difference in accuracy discussed above shows that the proposed method improves not only the predicted accuracy but also balances the identification of true glaucoma cases and the reduction of false detections, positioning it as the most reliable among all other architectures studied.
Classification performance comparison of different models.
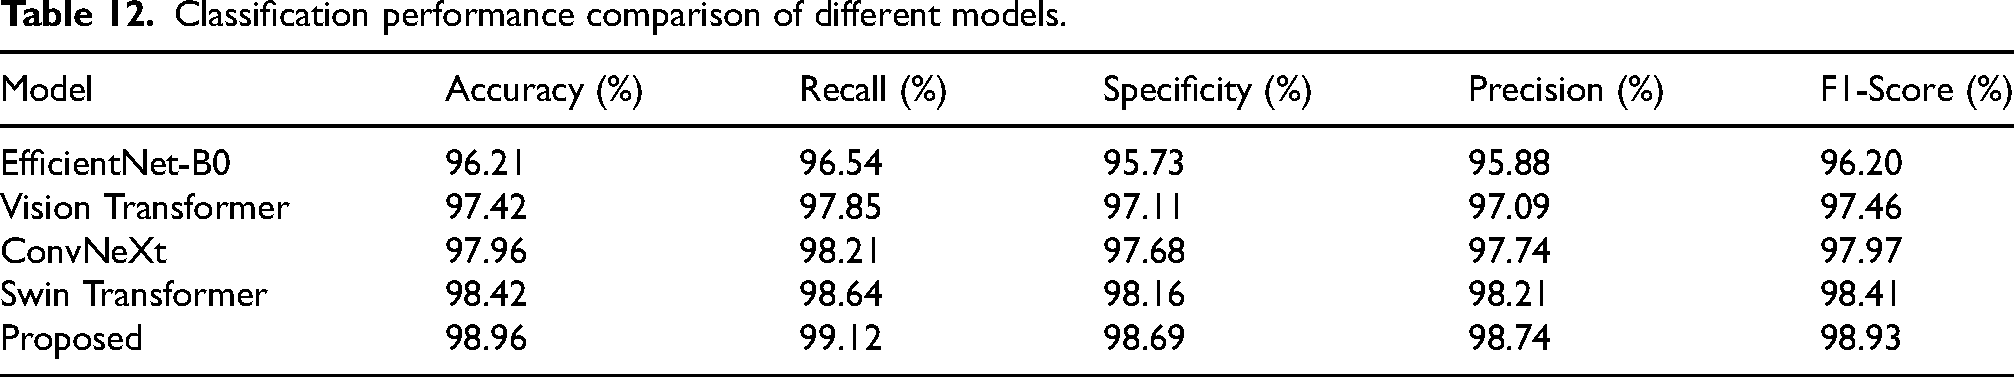
Receiver operating characteristics indicated that the classifier maintained a high level of separability over the ORIGA-Light dataset, with an area under the curve of nearly 98.34% for the normal category and an approximate 98.41% for that of glaucoma categories, indicating that healthy and diseased examples were barely differentiated at almost equal and very high reliability. Such impressive separation can also be observed in Figure 20, where both the curves are found well above the diagonal reference line. Up until false positive rates of nearly 0.10, the true positive rates have already exceeded approximately 0.95 for both classes, indicating that most related samples are being correctly identified while very few false alarms occur. These numerical values confirm that the system maintains excellent sensitivity and specificity over a range of thresholds, thus rendering it highly effective for real-life screening applications.
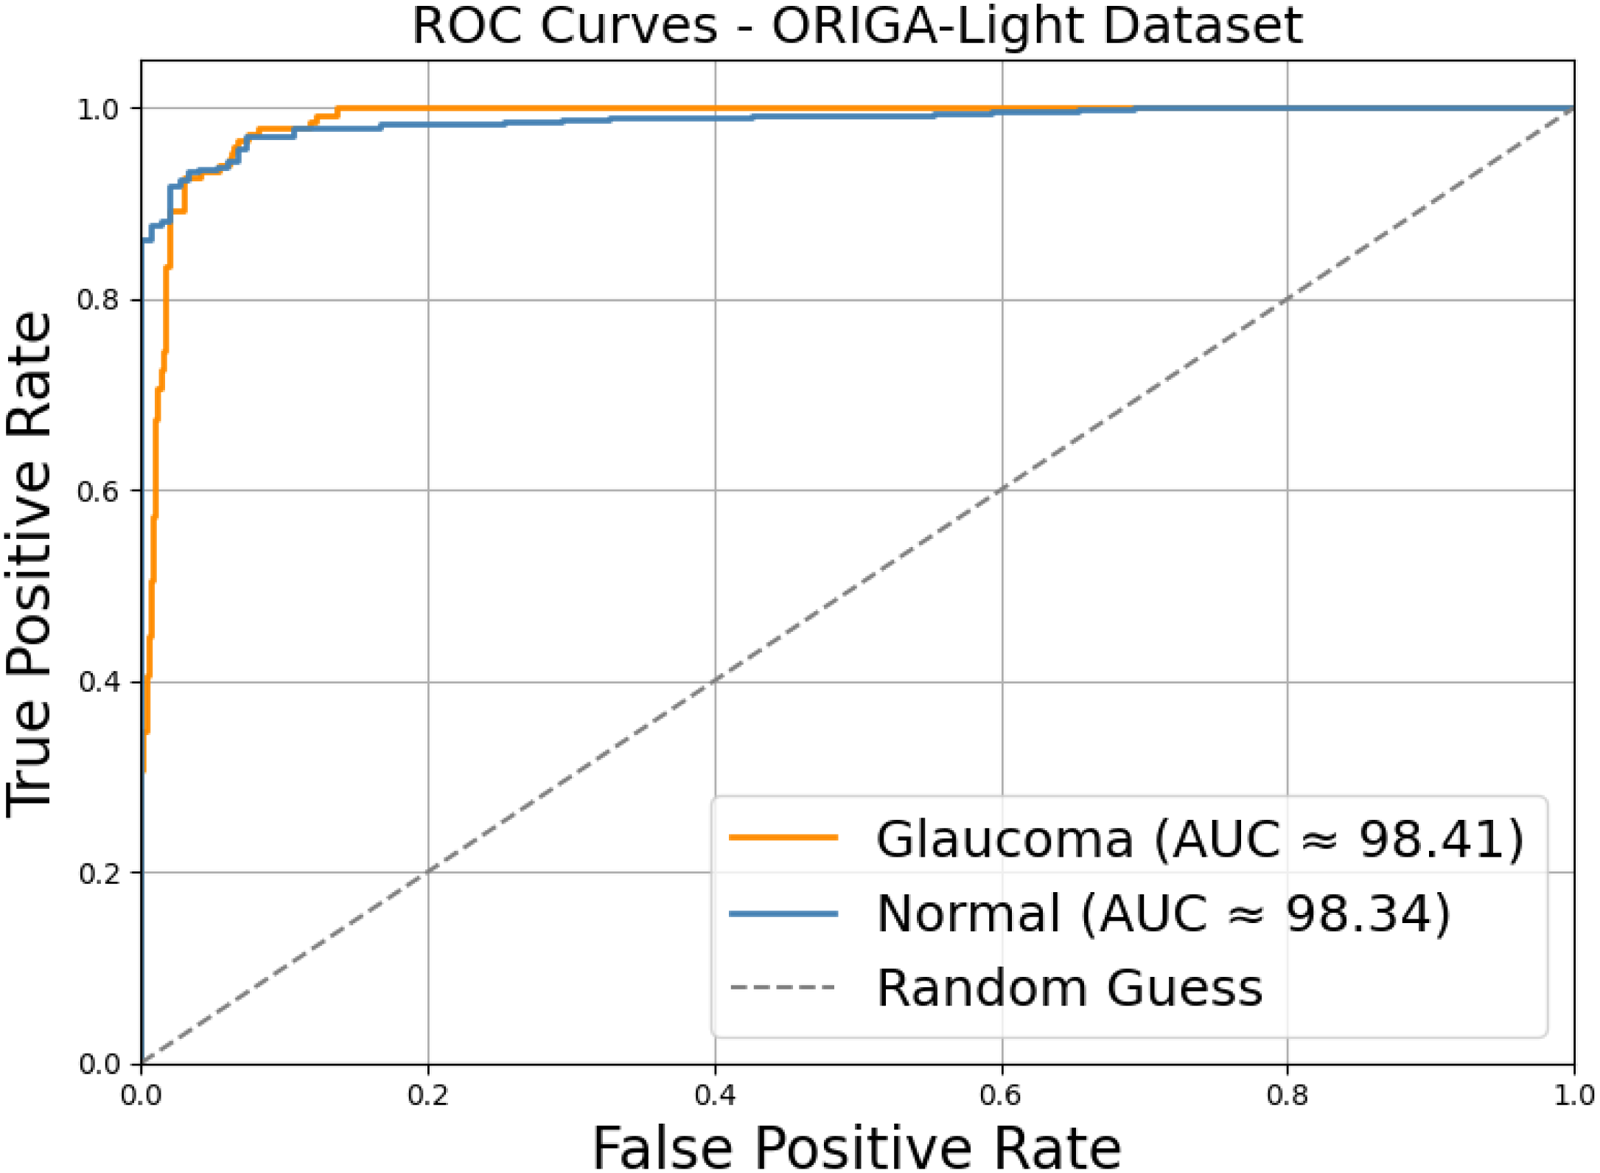
ROC curves for normal and glaucoma classification.
Results of the five-fold validation suggest that the model performs very well on all datasets of the ORIGA-Light dataset, with accuracy ranging from Fold-1 with 98.74% to Fold-5 with 99.17% while precision also issues slight variations between 98.52% and 98.94%, showing minimal dispersion across folds, and this uniformity is clearly summarized in Table 13 where the mean accuracy converges to 98.96% while recall remains stable with elevated values from 98.91% to 99.29%, while the F1-score stays tightly grouped between 98.71% and 99.14%, indicating that sensitivity and balance are preserved regardless of how the dataset is split. In addition, specificity lies within a narrow window from 98.43% to 98.92%, leading to an overall average of 98.69%, which confirms that the classifier generalizes reliably and avoids class bias across different validation folds.
Five-Fold cross-validation performance of the proposed model.
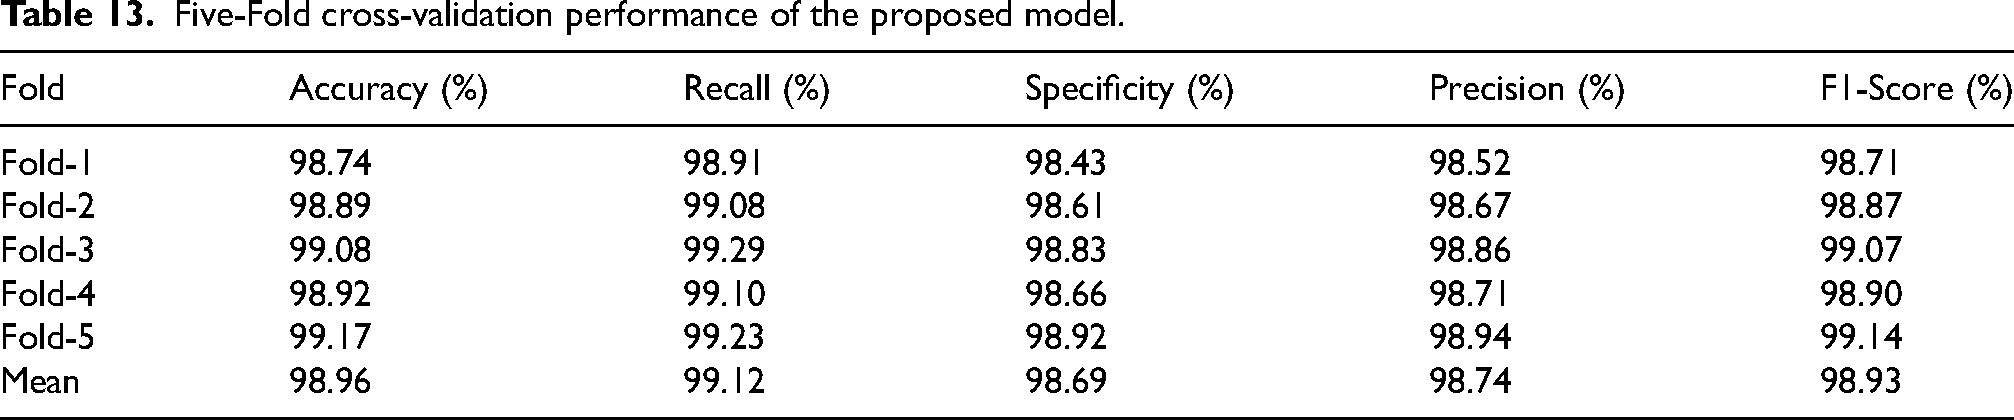
The improvement analysis demonstrates a clear and continuous increase in the classification strength with each architectural and optimization component deployed starting from SegNet baseline reaching 95.82% accuracy up to AME-SegNet which reaches 97.21% and the Bitterling-augmented version at 98.02%, while with the addition of the Conv-Transformer, the accuracy is lifted further to 98.57%, and this continuous improvement gets very well captured in Table 14 that presented the complete configuration proposed attaining maximum accuracy of 98.96%. Similar trends are also seen in precision, recall, and F1-score, which typically increase from around 95%-96% in the baseline to 98.74% precision, 99.12% recall, and 98.93% F1-score in the final model. The same goes for specificity: improving from 95.18% to 98.69% means as more refinements come, sensitivity into glaucoma gets deepened by being correctly anatomized against normal cases concerning the ORIGA-Light dataset.
Ablation study of model variants.
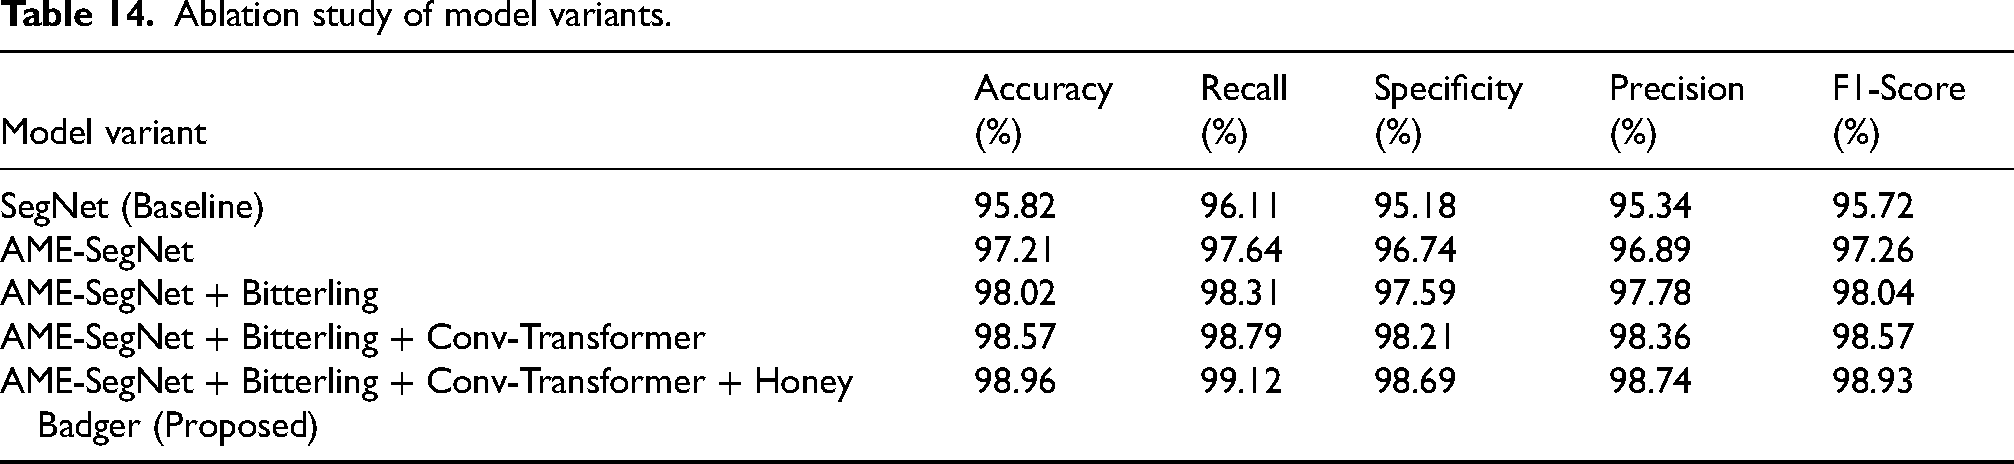
Comparative analysis
The quantitative comparison shown in Table 15 clearly demonstrates that the proposed AME-SegNet framework achieves the most balanced and reliable segmentation across both the optic cup and optic disc structures with a 97.36% Dice and 94.89% IoU for the optic disc with a 96.72% Dice and 92.13% IoU for the optic cup, both better than the ones achieved by the closest competing methods, Huang et al. 1 with 97.12% disc Dice and 91.99% cup Dice, Wang et al. 11 reporting 96.24% disc Dice, 88.49% disc IoU, 92.28% cup Dice, and 91.52% cup IoU, Kumar et al. 25 achieving 95.95% disc Dice, 92.22% disc IoU, 88.70% cup Dice, and 79.72% cup IoU, and Chen et al. 29 obtaining 96.65% disc Dice and 91.78% cup Dice, meaning that the proposed method serves in improving region overlap but also speaks to much higher consistency along the anatomical boundaries for both structures to provide a much more reliable geometric measure for glaucoma evaluation.
Comparative performance of optic disc and optic cup segmentation on drishti-GS1.
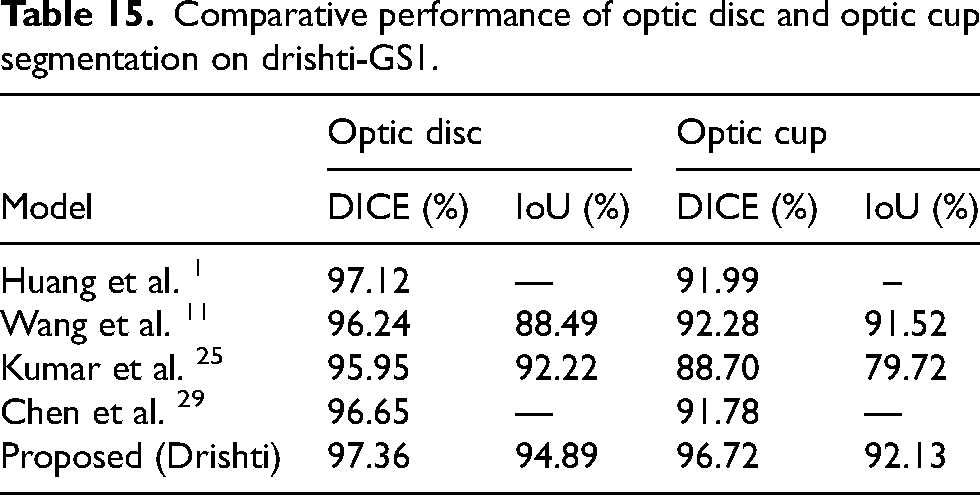
The comparative results presented in Table 16 show that the suggested framework has achieved the most reliable and superior performance in diagnosis among the models under consideration. The framework achieved 98.63% accuracy, 98.41% precision, 98.72% recall, 98.56% F1 score, and 98.34% specificity, which together exceeds Sanghavi et al. 4 's reported outcome of 96.33% accuracy, Aimmanee et al. 9 's score of 98.14% accuracy, 86.56% precision, 88.19% recall, and 86.48% F1 score, and Sreema MA et al. 22 's figures of 97.88% accuracy, 97.45% precision, 97.87% recall, and 98.51% specificity. This indicates that the proposed technique is not only more superior in overall correctness, but also effects a more balanced and reliable separation between glaucomatous and normal cases on the RIM-ONE dataset.
Comparative classification performance on the RIM-ONE dataset.
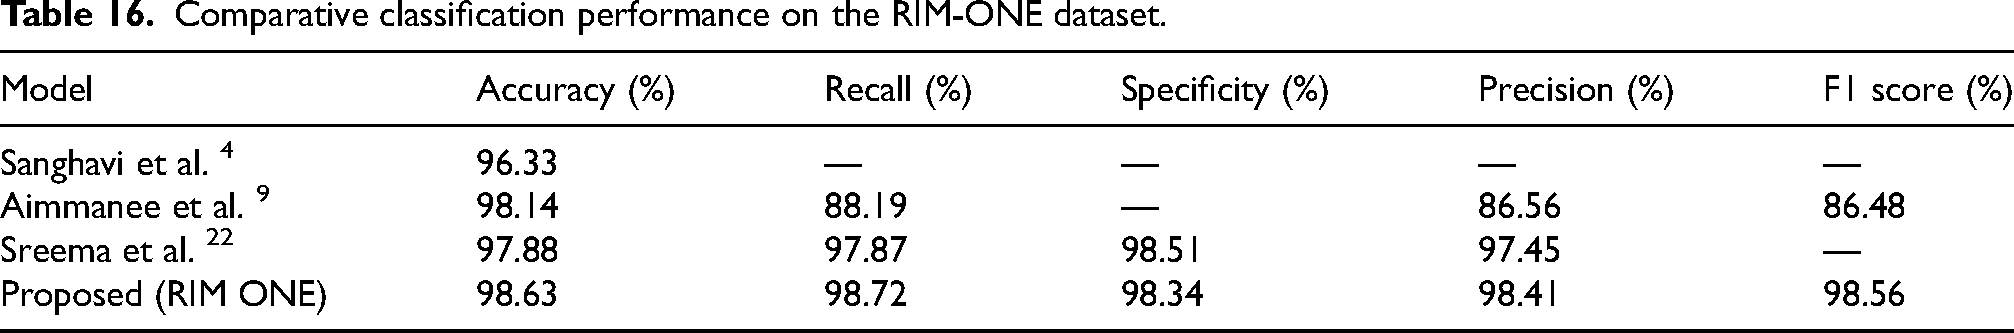
The performance comparison summarized in Table 17 highlights that the proposed framework achieves a most comprehensive and balanced set of diagnostic outcomes upon the ORIGA-Light dataset with 98.96% accuracy, 98.74% precision, 99.12% recall, 98.93% F1 score, and 98.69% specificity, which are slightly but consistently higher than the respective values of Govindharaj et al., 14 who achieved 98.90%, 98.40%, 96.40%, 97.20%, and 97.80%, and those reported by Sreema MA et al., 22 including 98.34% accuracy, 96.89% precision, 98.78% recall, and 98.45% specificity, while showing a very large margin against Sheraz et al., 26 whose accuracy and precision remain at 88.5% and 88.88% respectively. This indicated that the proposed method gives enhanced sensitivity and overall reliability in differentiating between glaucomatous and normal cases under varying imaging conditions.
Comparative classification performance on the ORIGA-light dataset.
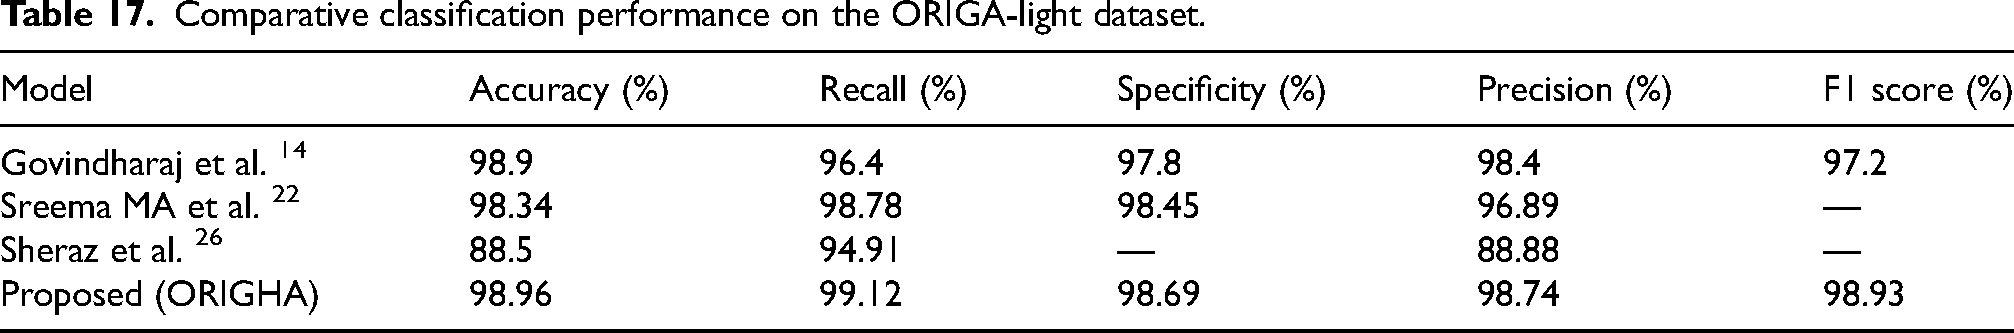
Table 18 presents a comparative analysis of recent glaucoma detection approaches alongside the proposed framework. For fair evaluation, all methods were assessed using the same RIM ONE dataset and experimental configuration to ensure consistency in training and testing conditions. Earlier approaches primarily relied on standalone CNN or transformer-based architectures, whereas the proposed method integrates edge-aware segmentation, optimized feature selection, and convolutional transformer-based classification. As observed, the proposed framework achieves superior and more balanced performance in terms of accuracy, recall, and precision. These results demonstrate the effectiveness and robustness of the hybrid multi-stage design for reliable automated glaucoma screening.
Comparative analysis of the proposed method with existing state-of-the-art techniques.
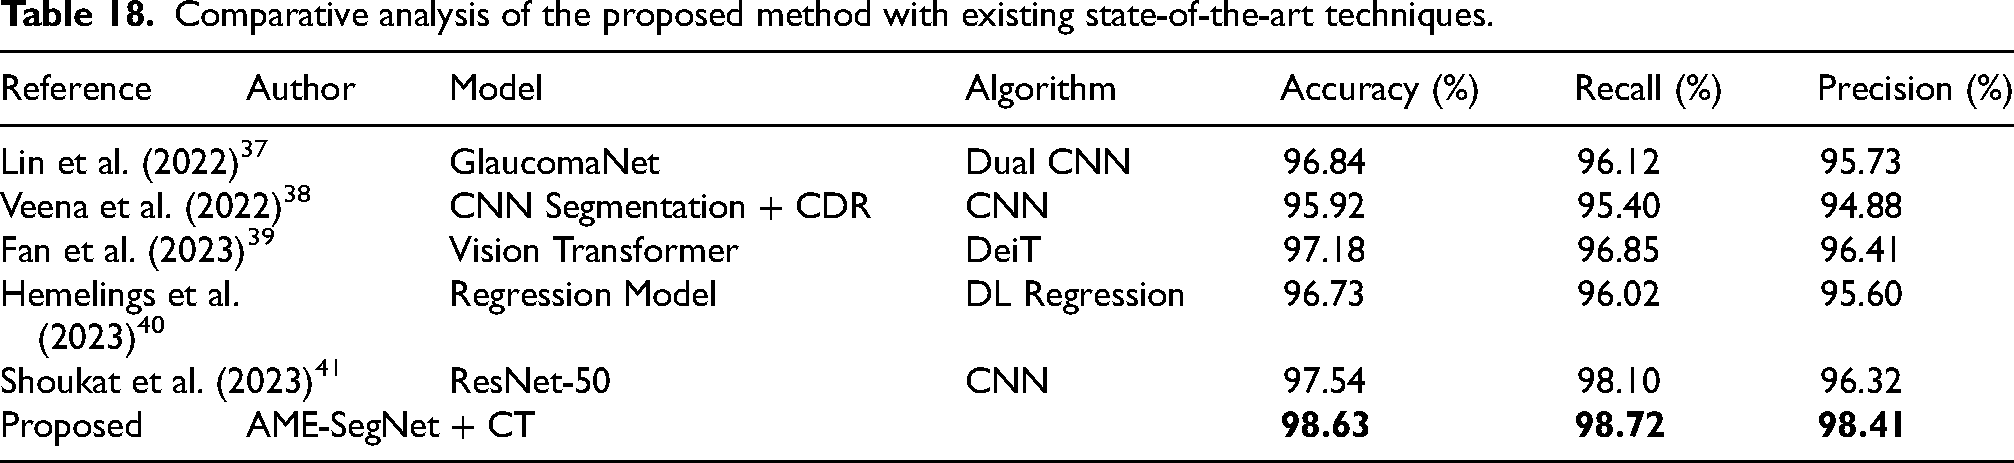
Conclusion
This study introduced a unified and anatomically guided framework for automated glaucoma detection that integrates advanced preprocessing, AME-SegNet-based optic disc and cup segmentation, optimized feature selection, and a hybrid convolutional transformer classifier. In contrast to many existing approaches that emphasize either segmentation or classification independently, the proposed method jointly optimizes boundary precision, feature discrimination, and classification robustness within a single pipeline. To ensure objective evaluation, all comparative analyses were conducted under identical datasets, preprocessing strategies, training configurations, and evaluation metrics. This standardized protocol minimizes experimental bias and enables fair performance assessment against recent CNN- and transformer-based methods. Existing techniques commonly encounter challenges such as imprecise optic cup boundary delineation, sensitivity to dataset variability, overfitting due to unstable feature learning, and limited generalization across imaging conditions. By incorporating multi-scale edge-aware segmentation, metaheuristic-based feature optimization, and automated hyperparameter tuning, the proposed framework effectively addresses these limitations while maintaining computational efficiency suitable for real-time deployment. Extensive validation on the Drishti-GS1, RIM-ONE, and ORIGA-Light datasets demonstrates consistent segmentation accuracy, balanced classification performance, and stable cross-validation behavior. The improved cup-to-disc ratio estimation further confirms enhanced anatomical reliability. The proposed framework achieved classification accuracies of 98.63% on RIM-ONE and 98.96% on ORIGA-Light, with balanced precision, recall, and specificity values exceeding 98%, along with ROC-AUC scores above 0.98 and stable five-fold cross-validation performance. For segmentation on Drishti-GS1, it attained Dice scores of 97.36% (optic disc) and 96.72% (optic cup), demonstrating improved boundary delineation, reduced cup-to-disc ratio error, and computational efficiency with only 3.2 million parameters and approximately 7 ms inference time. Overall, the proposed AME-SegNet framework advances current glaucoma screening methodologies by delivering a more generalizable, stable, and clinically applicable automated diagnostic solution.
Limitations of the proposed work
Although the proposed AME-SegNet framework exhibits high accuracy, robustness, and computational efficiency across various benchmark datasets, certain constraints must be acknowledged. First, the current study relies solely on color fundus images and thus does not incorporate structural information from other modalities such as optical coherence tomography (OCT) or visual fields. While fundus images provide very important information about the optic disc and cup morphology, combining them with depth-resolved retinal measurements may further increase the certainty of diagnosis, especially during the early stages of glaucoma.
Second, the proposed model is designed for binary classification (glaucoma versus normal) and does not explicitly estimate disease severity or progression stages. Grading glaucoma into mild, moderate, and severe is very important for treatment planning and monitoring, which the current framework does not yet address. Thirdly, although the model shows strong generalization across publicly available datasets, all evaluations are based on retrospectively collected and highly curated datasets with high-quality annotations. Real-world screening environments may see images suffering from motion blur, poor focus, or occlusions that may affect quality of segmentation and proceed to classification.
Finally, the use of biologically inspired optimization algorithms such as Bitterling Colony Optimization and Honey Badger Algorithm would enhance accuracy and stability but impose extra computational overhead during the training stage, possibly extending the optimization time compared to other fixed-parameter learning strategies. Such limitations indicate fruitful avenues for future research, including multimodal data fusion, glaucoma stage classification, real-world clinical validation, and further optimizing for computational efficiency to elevate the clinical applicability of the proposed system.
Future scope of the research
The AME-SegNet framework proposed here is designed, apart from achieving diagnostic accuracy, to become a scalable and extensible platform for glaucoma research in the future, and actual deployment. Such an architecture, consisting of preprocessing, AME-SegNet segmentation, feature optimization, and convolutional transformer classification modules, allows components to be upgraded or extended independently without affecting the redesign of other systems. This opens up the possibility of integrating further biomarkers into the assessment, such as neuro-retinal rim thickness, peripapillary atrophy, or vessel density. Also, there is an option to integrate multimodal inputs, such as OCT and visual field data, for a more comprehensive glaucoma assessment. From a research perspective, this framework provides a good platform to develop a multi-stage glaucoma grading and diseased progression modeling exercise, working toward prediction of severity and longitudinal change rather than simple binary classification. The anatomically consistent segmentation achieved by AME-SegNet will also aid in new clinically meaningful descriptors that potentially support explainable AI as well as clinical decision support systems.
For real-time implementation, the proposed model is computationally efficient, requiring only 3.2 million parameters and approximately 7 ms per-image inference time, rendering it suitable for deployment on edge devices, clinical workstations, and mobile screening units. The application of convolutional tokenization in the transformer allows for retention of high accuracy while burdening memory and processing minimally. In addition, the automated hyperparameter tuning from the Honey Badger Algorithm allows the model to be easily adapted to new datasets or imaging devices without intervention from a user. Such characteristics make the proposed AME-SegNetframework an extremely useful candidate for large-scale, low-cost glaucoma screening in hospitals, community clinics, and remote health setups while providing an adaptable yet robust infrastructure for advancing future glaucoma research and intelligent ophthalmic diagnostics.
Footnotes
Acknowledgements
The corresponding author, C. Moorthy, would like to express sincere thanks to the co-authors, D. Arulanantham, A. Suresh Babu, and S. Murugesan, for their valuable contributions, collaboration, and support throughout the course of this research work.
Funding
The authors received no financial support for the research, authorship, and/or publication of this article.
Declaration of conflicting interests
The authors declared no potential conflicts of interest with respect to the research, authorship, and/or publication of this article.