



Abstract
Interdistrict open enrollment is the nation’s largest and most widespread school choice program, but our knowledge of these programs is limited. Drawing on 5 years of student-level data from the universe of public school attendees in Colorado, we perform a three-stage analysis to examine the dynamics of student participation in the state’s interdistrict open enrollment program. First, we explore the characteristics of students who open enroll in a defined baseline year. Second, we analyze the characteristics of students who continue to participate in the program in subsequent years. Finally, we examine the characteristics of students who—conditional on not open enrolling in the defined-baseline year—choose to participate in the program in one or more subsequent years.
Introduction
The expansion of school choice represents one of the dominant trends in education policy over the past two decades. A major component of this expansion is the growth of interdistrict open enrollment policies, which allow students to attend public schools located in districts other than the one in which they reside. These policies were almost nonexistent only 25 years ago, but today interdistrict open enrollment programs exist in over 40 states and they currently serve more students than any of the more visible choice policies, including school vouchers (Campbell, West, & Peterson, 2005; Chakrabarti, 2011; Cowen, 2010; Figlio, Hart, & Metzger, 2010; Howell, 2004; Lankford & Wyckoff, 2001; Paul, Legan, & Metcalf, 2007; Witte, 2000), magnet schools, and even charter schools (Buckley & Schneider, 2007; Weiher & Tedin, 2002). Despite the broad scope of interdistrict open enrollment, research into the operations and effects of these programs is limited. Relative to other school choice programs, we know little about the characteristics of interdistrict open enrollment participants, the schooling decisions that students make through the program, or the effects of the program on outcomes of interest.
By analyzing student participation in interdistrict open enrollment, this article provides insight into a basic, yet important, dimension of the nation’s largest school choice program. In doing so, it lays the groundwork for future analyses of other features of these programs. Drawing on 5 years of student-level data—2005-2006 to 2009-2010—from the universe of students attending public schools in Colorado, we perform a three-stage analysis to examine the dynamics of student participation in the state’s interdistrict open enrollment program. First, using three grade cohorts from the 2006-2007 school year—kindergarteners, 6th graders, and 9th graders—we explore the characteristics of students who open enroll in that defined baseline year. Second, for each of the three cohorts listed above, we analyze the characteristics of students who—conditional on open enrolling in the baseline year of 2006-2007—continue to participate in the program in subsequent years. Finally, we examine the characteristics of students who—conditional on not open enrolling in the baseline year of 2006-2007—choose to participate in the program in one or more subsequent years. Put differently, we address three main questions: Who open enrolls initially? Who keeps open enrolling? And who does not open enroll initially, but participates in the program in later years?
The results of these analyses provide significant insight into a variety of important issues. For example, our analyses demonstrate that interdistrict open enrollment is not primarily used by low-income, at-risk students—often cited as the intended beneficiaries of these programs—but rather by more socioeconomically advantaged students. Although bounded by time and place, such findings have important implications for policy debates on issues such as educational stratification. Similarly, in demonstrating differences in open enrollment participation patterns over time and across grade levels, our results inform questions related to whether families view interdistrict open enrollment as a short-term educational solution—perhaps until they can physically relocate to a more desirable district—or as a long-term fix to a problem of limited educational options. Taken together, the analyses and comparisons presented in this article provide important information into the operations and effects of an oft-overlooked, yet quite important, school choice policy.
Interdistrict Open Enrollment: Background, Context, and Hypotheses
There are two primary types of formal interdistrict open enrollment policies—voluntary and mandatory. Under voluntary policies, school districts are free to decide whether to accept transfers from other districts. Mandatory policies, on the other hand, require school districts to accept transfers from other districts, although state laws generally specify a set of conditions under which districts can legally refuse to accept transfers. Both voluntary and mandatory policies generally prohibit districts from restricting student transfers out of the district.
Like other school choice policies, interdistrict open enrollment programs are a relatively recent addition to the educational landscape. Voluntary programs only began to emerge as a schooling option in the early 1980s and the first mandatory statewide program did not exist until the implementation of Minnesota’s policy in 1991 (Boyd, Hare, & Nathan, 2002). Since enactment of that program, however, interdistrict open enrollment has expanded rapidly and by 2011 only eight states and the District of Columbia were without some form of the policy (National Center for Education Statistics, 2012). 1 Table 1 presents the number of states with voluntary and mandatory interdistrict open enrollment policies. 2
Number of States With Interdistrict Open Enrollment Programs, by Program Type.

Because the empirical analyses to follow draw on data from the mandatory interdistrict open enrollment program in Colorado, we discuss this class of policy—both generally and in the specific context of Colorado—in further detail. The specifics of mandatory interdistrict open enrollment policies clearly vary across states, but there are three features that nearly all programs possess. First, and most basically, the policies create a process through which students can attend public schools located in a district other than the one in which they resided. Historically, public school students have been required—with few exceptions—to attend the school specified by their district of residence. Second, open enrollment policies generally specify a set of conditions under which school districts can refuse to accept interdistrict transfers. The list of allowable conditions for transfer refusal is uniquely determined by each state’s policy, but two of the most common conditions on these lists include a lack of capacity in the district and an applicant’s history of behavioral problems, such as suspensions, expulsions, or substance abuse. Third, interdistrict transfer programs are generally designed in a manner such that state education aid associated with a transferring student is disbursed to the district of attendance, rather than the district of residence. The precise amount of funding a district receives for each interdistrict transfer it accepts is state-specific in nature, but Reback (2008) notes that the amount is generally greater than the marginal cost of educating an additional student.
Along with these three foundational features of interdistrict open enrollment policy, two additional dimensions of the transfer programs—transportation and desegregation policies—warrant discussion. A major challenge in implementing open enrollment policies involves transporting students to schools located outside of their district of residence. In response to this challenge, a number of states place all transportation responsibilities upon the parents of transferring students while another set of states mandate that the district of residence provide all necessary transportation. A third group of states does not address the issue of transportation at all in their open enrollment policies, thus leaving the issue to be sorted out by parents, the district of residence, and the district of attendance. In addition to variance in the responsibility for providing transportation, state policies also differ in the amount of funding provided to support the transportation of interdistrict transfers. Policies range from providing no transportation funding at all to fully reimbursing districts for the costs associated with busing interdistrict transfers. 3
Finally, interdistrict transfer policies in a significant number of states explicitly permit districts to refuse transfers—both into and out of the district—if the transfer would violate the provisions of an established desegregation policy or otherwise upset the racial or socioeconomic balance of the district. The legality of such provisions, however, is in doubt after the recent U.S. Supreme Court decisions in Parents Involved in Community Schools Inc. v. Seattle School District and Meredith v. Jefferson County (Ky.) Board of Education, which prohibited schools and districts from considering race in school admissions processes.
Interdistrict Open Enrollment in Colorado
The Public Schools of Choice Act of 1990 serves as the authorizing legislation for Colorado’s mandatory statewide interdistrict open enrollment program. Beginning with the 1994-1995 school year, this legislation allowed students to attend any public schools located outside their district of residence without paying tuition to the nonresident district. However, as foreshadowed above, the policy specifies five conditions under which districts can legally refuse to accept a transfer application:
A lack of space or teaching staff required to serve the student;
The district or school is not equipped—either physically or with respect to curriculum—to serve the student;
The student does not meet established eligibility criteria for participation in a requested program;
Admission of the student would violate the terms of an established desegregation plan;
The student has been expelled from another district.
Colorado’s interdistrict transfer policy contains one more notable provision with respect to student admission. Specifically, the policy states that if the number of transfer applications received by a district exceeds the number of available seats, the district is urged—but not required—to give enrollment priority to applicants with a proficiency level of unsatisfactory in one or more academic subjects who attend a low-performing public school. With respect to funding, Colorado’s policy mirrors most programs nationally by disbursing state aid associated with a transferring student to the district of attendance. Finally, issues of transportation are not addressed in the relevant statutes.
Colorado’s interdistrict open enrollment program quickly grew to serve a significant number of students. By the 2000-2001 school year—only 6 years after the inception of the program—over 20,000 students were using the policy to attend a school located outside their district of residence. 4 Over the following decade, the program tripled in size and today it serves in excess of 68,000 students. Table 2 presents the number of students attending a school located outside their district of residence. For purposes of comparison, it also presents the total K-12 enrollment in public schools in Colorado as well as the number of students enrolled in the state’s charter schools. The table indicates that about 3.2% of students attended a school located outside their district of residence during 2000-2001 school year while approximately 8.1% of students did so in the 2011-2012 school year. The corresponding numbers for charter school enrollment are 2.9% and 9.1%, respectively.
Total Enrollment in Colorado, Interdistrict Open Enrollment (OE), and Charter Schools, by Year.

Source. Colorado Department of Education.
The results in Table 2, coupled with the previous discussion, demonstrate both the virtues and vices of relying on Colorado as the setting for our empirical analysis. On one hand, the large-scale and established nature of the program in Colorado, coupled with the state’s longstanding detailed data collection efforts, allow for an in-depth analysis that can generate valuable insights into the operations of a mature interdistrict school choice program. Most other jurisdictions with established interdistrict open enrollment programs simply lack the data required to perform any sort of systematic and rigorous analysis. At the same time, reliance on data from a single jurisdiction—including this one—has the potential to limit the generalizability of results. In this context, it seems probable that the results from analysis of Colorado’s program can be generalized with some degree of confidence to other states with mature mandatory statewide interdistrict choice programs. They likely provide less guidance, however, to jurisdictions with programs that are not statewide or mandatory in nature, or to jurisdictions that currently have no program but are considering implementing one. With the relative merits of the Colorado context in mind, we proceed to review existing research on interdistrict choice programs and use the results of previous studies to develop hypotheses for our empirical analysis.
Existing Literature and Hypotheses
Despite the expansive scope of interdistrict open enrollment policies, research into the operations and effects of these programs is limited—both absolutely and relative to the literatures on other school choice policies, such as charter schools and school vouchers. The studies that do exist generally use district-level data to explore the factors affecting interdistrict transfer flows. Although issues of ecological inference prevent these studies from providing firm information on the characteristics of the students utilizing interdistrict open enrollment or the schooling decisions they make through the program, these analyses do provide a solid basis for developing hypotheses on these topics; we present our hypotheses after a brief review of the literature.
The earliest studies of interdistrict open enrollment were conducted in the context of voluntary transfer programs in Massachusetts and Ohio (Armor & Peiser, 1998; Fossey, 1994; Fowler, 1996). The studies in Massachusetts used simple mean calculations to compare the characteristics of districts that were net senders versus net receivers (Armor & Peiser, 1998; Fossey, 1994). Both studies found that net receiving districts were more advantaged than net sending districts on several measures, including median family income, percent of adults with a college degree, achievement scores, dropout rates, and per-pupil expenditures. In Ohio, Fowler (1996) surveyed district superintendents regarding their willingness to accept transfers and found a desire to increase enrollment—and thus state funding—as a major factor driving the decision to participate. Superintendents from nonparticipating districts generally reported that a lack of classroom space was the primary reason for not accepting transfer students.
Recent scholarship on interdistrict open enrollment has used more detailed data structures and more sophisticated econometric techniques to analyze the factors affecting interdistrict transfer flows. Using district-level data from Minnesota, Reback (2008) estimates the determinants of demand for interdistrict transfer and finds that the average level of student achievement in a district is a stronger predictor of transfer demand than a district’s socioeconomic composition or its per-pupil spending level. Welsch, Statz, and Skidmore (2010) perform a similar analysis using 4 years of district-level data from Wisconsin. They detect a positive relationship between the number of transfers into a district and the percentage of students who score at the advanced level on the state standardized test. The authors also found a greater number of student transfers into districts with higher levels of per-pupil spending, lower percentages of minority students, lower percentages of students eligible for free lunch, and more extracurricular opportunities.
Two previous studies have examined the operations of Colorado’s interdistrict open enrollment program. Carlson, Lavery, and Witte (2011) use data on the number of interdistrict transfers between each pairwise combination of districts in the state for the 2003-2004 school year to demonstrate that larger numbers of students open enroll out of high-achieving districts than out of lower achieving districts. However, the analysis also indicates that they are open enrolling into districts with even higher levels of achievement. In addition, the authors find larger transfer flows into districts with a lower percentage of students eligible for free lunch, but also lower proportions of White students. Holme and Richards (2009) analyze both student- and district-level data on interdistrict transfers in the Denver metropolitan area during the 2006-2007 school year to conclude that wealthy students are more likely to take advantage of open enrollment than their less affluent peers. 5 Consistent with results presented in Carlson et al. (2011), transferring students are found to enroll in even more advantaged contexts.
Taken as a whole, the existing literature provides a fairly consistent, if somewhat small, body of evidence on the determinants of interdistrict open enrollment flows; it is clear that achievement levels, socioeconomic characteristics, and structural district characteristics all affect transfer flows. More specifically, the district-level results from Minnesota, Wisconsin, and Colorado—coupled with Holme and Richards’ (2009) Denver-area analysis—provide some evidence that open enrollment programs are disproportionately utilized by advantaged and high-achieving students. Even though the aforementioned ecological inference issues limit this existing evidence from being definitive, these earlier results provide a solid foundation for the following hypotheses about our student-level analyses 6 :
In addition to providing a basis for hypotheses about open enrollment participation in any given year, previous work can also inform hypotheses regarding persistence in open enrollment participation. Specifically, findings from the studies of open enrollment reviewed above, coupled with the body of work demonstrating high rates of attrition from school choice programs that serve low-income—and generally low-achieving—populations (Ballou, Teasley, & Zeidner, 2006; Carlson, Cowen, & Fleming, 2013; Cowen, Fleming, Witte, & Wolf, 2012; Cowen & Winters, 2013; Hanushek, Kain, Rivkin, & Branch, 2007; Howell, 2004; Wolf et al., 2010) form the basis for our predictions that
A final hypothesis is motivated by recent research on families’ schooling preferences suggesting that, all else equal, families prefer schools where the student body matches their demographic and socioeconomic profile (e.g., Hastings, Kane, & Staiger, 2008). This leads to our prediction that
Finally, we acknowledge that additional student attributes—gifted and talented status, English language learner (ELL) designation, special education status, and others—are likely to be related to interdistrict open enrollment participation, but note that existing studies do not provide a sufficient body of evidence in which to ground hypotheses. Consequently, the relationship between these factors and open enrollment participation can only be informed through empirical analysis; the following section provides a more in-depth description of the data we use to conduct such analysis.
Data
All data used in the following analyses come from records maintained by the Colorado Department of Education (CDE). Beginning with the 2005-2006 school year and extending through the 2009-2010 school year, the CDE provided us with student-level records containing information on student enrollment, demographics, achievement, and school and district characteristics for the universe of students attending Colorado public schools during this time period.
In addition to a unique student identifier, the enrollment data provided by CDE contain—for each year—measures of the school attended by each student and the district in which it is located. 7 The data also indicate whether a student attended a school located outside of his or her district of residence—a measure of open enrollment. For students who open enroll, the data identify the student’s district of residence. The data also contain a variety of relevant contextual data for the schools and districts that students attend, such as dropout rates, mobility statistics, disciplinary information, staff data, available postsecondary options, fiscal information, and socioeconomic composition. For students who open enroll, this information is also available for students’ district of residence. 8
The CDE records contain information on standard demographics—age, grade, gender, race/ethnicity—as well as measures of several other characteristics such as gifted and talented status, free or reduced lunch status, disability status, ELL status, a measure of language proficiency, and students’ primary language. The CDE records also contain multiple student test score measures. Specifically, the data contain students’ scale scores on the reading and math portions of the Colorado Student Assessment Program (CSAP), which is administered to all students in Grades 3 to 8 and 10 to meet the accountability provisions of the No Child Left Behind Act. To facilitate cross-grade comparisons, we standardized the CSAP scale scores using the statewide mean and standard deviation for the proper year, grade, and subject. Finally, to gauge the level of college readiness among high school students and to track trends in performance over time, Colorado administers the ACT to all students enrolled in 11th grade. Consequently, our data contain ACT scores—both composite and subject-specific—for all 11th-grade students in Colorado.
Taken as a whole, our data set contains nearly 4.3 million observations from approximately 1.25 million unique students. We have extensive information on each student’s demographic and achievement profile, as well as data on the schools that students attend and the districts in which they reside. Although our data are well-suited for analyses that will provide valuable insight into student participation in interdistrict open enrollment, they do not contain all information that might be desired. For example, factors such as extracurricular offerings or measures of convenience—such as location of parental workplace—are likely relevant to an analysis of open enrollment participation. Unfortunately, data on such topics are not collected by Colorado, and thus cannot be included in the analyses. Although this limits the inferences that can be drawn from our analysis, significant insight into the operations of interdistrict open enrollment can still be gained, as we demonstrate below.
Analytical Framework and Results
The empirical analyses that follow address three main topics: (a) The characteristics of students who open enroll in a given year, with a primary focus on 2006-2007; (b) The characteristics of students who—conditional on open enrolling in 2006-2007—continue to participate in the program in subsequent years; and (c) The characteristics of students who—conditional on not open enrolling in 2006-2007—choose to open enroll in one or more subsequent years.
Bivariate Analysis and Results
As a first step in gaining insight into the characteristics of students who participate in interdistrict open enrollment, Table 3 presents—for each year from 2005-2006 to 2009-2010—the percentage of students who open enroll by grade, as well as by selected demographic characteristics. For the grade results, two major trends emerge. First, high school students generally open enrolled at higher rates than students in elementary or middle school; this pattern is evident across all 5 years. Second, open enrollment rates increased across time for all grade levels, but the increases were somewhat larger for high school students than elementary or middle school students.
Percent of Students Who Open Enroll, by Grade and Demographic Characteristics: 2005-2006 to 2009-2010 School Years.

Note. ELL = English language learners.
The demographic results demonstrate that females are slightly more likely than males to open enroll, but perhaps more interesting are the results by race/ethnicity and free lunch status. In each of the 5 years of data, Black students open enrolled at higher rates than students of any other race while Hispanic students were least likely to open enroll. In addition, and consistent with Hypothesis 1, students who are eligible for free lunch are less likely to open enroll than their more affluent peers, an interesting finding given the original stated intent of open enrollment policies—a topic discussed in greater detail below. The results also demonstrate that students classified as ELL open enroll at lower rates than students who are proficient in English and that students with a disability—either physical or learning—are less likely to open enroll than their nondisabled peers. Open enrollment rates for all demographic groups increased over time.
Table 4 provides information on open enrolling students’ districts of residence. On average, students who open enroll reside in districts with a higher percentage of students eligible for free- or reduced-price lunch and a lower percentage of students who are White, relative to students who attend school in their resident district. In addition, the average open enroller resides in a district that is somewhat smaller, offers fewer AP courses, and has slightly higher dropout and truancy rates, relative to the districts in which non-open enrolling students reside. Interestingly, the average reading achievement levels in the resident districts of open enrolling students was somewhat lower than that of non-open enrollers in the first 3 years of our data, but slightly higher in the final 2 years. Full results are presented in Table 4.
Average District Characteristics, by Open Enrollment (OE) Status and Year.

Note. AYP = adequate yearly progress; AP = Advanced Placement.
Table 5 presents the achievement profile of students who open enroll. With few exceptions, students who open enroll have somewhat lower CSAP math scores than their non-open enrolling peers, but higher CSAP reading scores. In general, the magnitude of the reading advantage is larger than the size of the negative difference in math, but overall these results provide only mixed support for Hypothesis 2. This interesting pattern is further explored in subsequent analyses. As noted earlier, the ACT is administered to all 11th-grade students in Colorado. Table 4 illustrates that 11th graders who open enroll have slightly lower ACT scores than students who attend school in their district of residence.
Average Standardized CSAP Score and ACT Scale Score, by Open Enrollment (OE) Status and Grade: 2005-2006 to 2009-2010 School Years.

Note. CSAP = Colorado Student Assessment Program.
The results presented in Table 6 take advantage of the panel nature of the data set to calculate students’ interdistrict open enrollment transition probabilities. That is, the table presents the percentage of students who—conditional on their open enrollment status at time t—open enroll at time t + 1. The results demonstrate a lack of stability in interdistrict open enrollment participation. Among the full sample, only about 70% of students who open enroll in 1 year also open enroll the next year. In contrast, nearly 98% of students who do not open enroll in a given year also do not attend a school located outside of their district of residence the following year. There is significant variation in transition probabilities across demographic groups. For example, about 75% of White and Asian students open enroll in two consecutive years, but the corresponding number for Black students is only 62%. Consistent with Hypothesis 3, students eligible for free lunch are similarly (un)likely to open enroll in two consecutive years—about 65% do so—while about 75% of students not eligible for free lunch do so. Finally, although Table 5 demonstrated that students classified as gifted and talented were relatively unlikely to open enroll, the results in Table 6 indicate that those who choose to participate in the program are quite stable in their participation, a finding that supports Hypothesis 4. Taken together, the results presented in Tables 4 to 6 suggest a number of interesting trends in interdistrict open enrollment participation, which we explore further in a multivariate framework below.
Open Enrollment (OE) Transition Probabilities, by Demographic Characteristics.

Note. ELL = English language learners.
Multivariate Analysis
To gain further insight into the characteristics of interdistrict open enrollment participants—and the dynamics of their participation—we estimate a series of three models. The first model simply predicts interdistrict open enrollment participation during the 2006-2007 school year as a function of student characteristics as well as the characteristics of a student’s district of residence and can be written as follows:

where the probability that student i residing in district d open enrolls in 2006-2007 is a function of a vector of fixed student characteristics
Building on this initial model, our second analysis is designed to provide information on the characteristics of individuals who—conditional on open enrolling in 2006-2007—continue participating in interdistrict open enrollment in subsequent school years; it is intended to help develop an understanding of the dynamics of participation and provide direct evidence on the accuracy of Hypotheses 3 and 4. We perform this analysis in a survival framework—an approach that has become increasingly common in the education policy literature in recent years (e.g., Cowen & Winters, 2013; Goldhaber & Hansen, 2009; Howell, 2004; Plank, DeLuca, & Estacion, 2008; Podgursky, Monroe, & Watson, 2004). Specifically, we estimate the following model:

In this model, the hazard that student i residing in district d fails to continue open enrolling at time t is the product of a baseline hazard function k(t)—assumed to take an exponential distribution—and an exponentiated linear combination of a vector of fixed student characteristics
Whereas our first two analyses provide information about individuals who open enrolled in 2006-2007, our third analysis centers on individuals who did not open enroll in that year, but did participate in the program in subsequent years. We again perform this analysis in a survival framework and use a model identical in structure to that presented in Equation (2). However, there are two notable differences between the two analyses. First, in this analysis we estimate the model over samples that are entirely different from those used in the previous analysis. Specifically, in this analysis we estimate Equation (2) separately for (a) individuals who did not open enroll as kindergarteners in 2006-2007, (b) individuals who did not open enroll as 6th graders in 2006-2007, and (c) individuals who did not open enroll as 9th graders in 2006-2007; we again have complete data on these sample members through the 2009-2010 school year. Second, because the analytic samples consist of individuals that did not open enroll in 2006-2007—coupled with the fact that we are interested in identifying the factors that predict open enrollment participation in future years—“failure” is now defined as beginning to open enroll in a subsequent school year. Consequently, this analysis identifies student- and district-level factors associated with increases or decreases in the hazard of beginning to open enroll, conditional on not open enrolling in 2006-2007.
Taken together, these analyses will provide further insight into student participation in interdistrict open enrollment, as well as the dynamics of that participation. They will shed light on the role that a variety of student- and district-level factors play in predicting open enrollment participation in 2006-2007 and also in subsequent years. Furthermore, the analyses will explore potential heterogeneity in interdistrict open enrollment participation through the analysis of three grade cohorts and the separate analysis of students who did and did not open enroll in the defined-baseline year of 2006-2007.
Multivariate Results
Table 7 presents the results of the model predicting open enrollment participation in the 2006-2007 school year; the results—in the form of odds ratios—are presented separately for kindergarteners, 6th graders, and 9th graders. Several patterns are present across all cohorts. Depending on the specific grade, Hispanic students were anywhere from 12% to nearly 40% less likely than White students to open enroll in 2006-2007. Consistent with Hypothesis 1, the results demonstrate that students who were not eligible for free- or reduced-price lunch were almost twice as likely to open enroll as students who were eligible for free lunch. Those eligible for reduced-price lunch were also more likely to open enroll than their more highly subsidized peers. In addition, students classified as gifted and talented or with limited English proficiency were less likely to open enroll than their peers without those classifications. The precise magnitudes of the estimates are presented in Table 7.
Log Odds From Logit Model Predicting Open Enrollment in 2006-2007, by Grade.

Note. Robust standard errors in parentheses. AYP = adequate yearly progress; KG = Kindergarten.
p < .1. **p < .05. ***p < .01.
A number of district characteristics were also associated with interdistrict open enrollment participation across all grade levels. The results indicate negative relationships between open enrollment participation and both the percent of students who are White and enrollment levels; students in larger districts were less likely to open enroll in 2006-2007, conditional on the contents of the model. In addition, the results demonstrate a positive relationship between open enrollment participation and both the dropout and truancy rate of students’ district of residence.
Table 7 also reveals that several significant predictors of open enrollment participation are more grade specific in nature. For example, Black students were more likely than White students to open enroll in kindergarten and 6th grade, but less likely to do so in 9th grade. Similarly, Asian kindergartners were more likely to open enroll than their White peers, but there are no differences between these two groups in 6th and 9th grade. At the district level, Table 7 reveals a positive relationship between open enrollment participation and average reading achievement, the percent of students eligible for free- or reduced-price lunch, and the truancy rate at the 6th-grade and 9th-grade levels, but not for kindergartners. The magnitudes of these estimates are presented in Table 7.
The results presented in the form of hazard ratios in Table 8 build on those presented above by analyzing the factors associated with continuing to open enroll in subsequent school years. 10 Four main findings emerge from the results. First, the propensity to continue open enrolling varies across racial and ethnic groups—there is some evidence that Black students at all grade levels are less likely than both White and Hispanic students to continue open enrolling after 2006-2007. For Hispanic students, the propensity to continue open enrolling during high school is much different from earlier years, at least relative to their White peers. Second, across all grade levels and consistent with Hypothesis 3, students eligible for free lunch are between 15% and 20% less likely to continue open enrolling after 2006-2007 than their more affluent peers. Third, there is a negative relationship between the percentage of students eligible for subsidized lunch in students’ district of residence and the hazard of failing to open enroll after 2006-2007; students who open enroll out of relatively high-poverty districts are disproportionately likely to continue open enrolling. Fourth, students who open enroll out of high-achieving districts are disproportionately likely to continue open enrolling in subsequent years—between 57% and 33% less likely to stop open enrolling—as evidenced by the consistent, significant coefficients on the measure of average achievement.
Hazard Ratios of Halting Participation in Interdistrict Open Enrollment, by Grade.
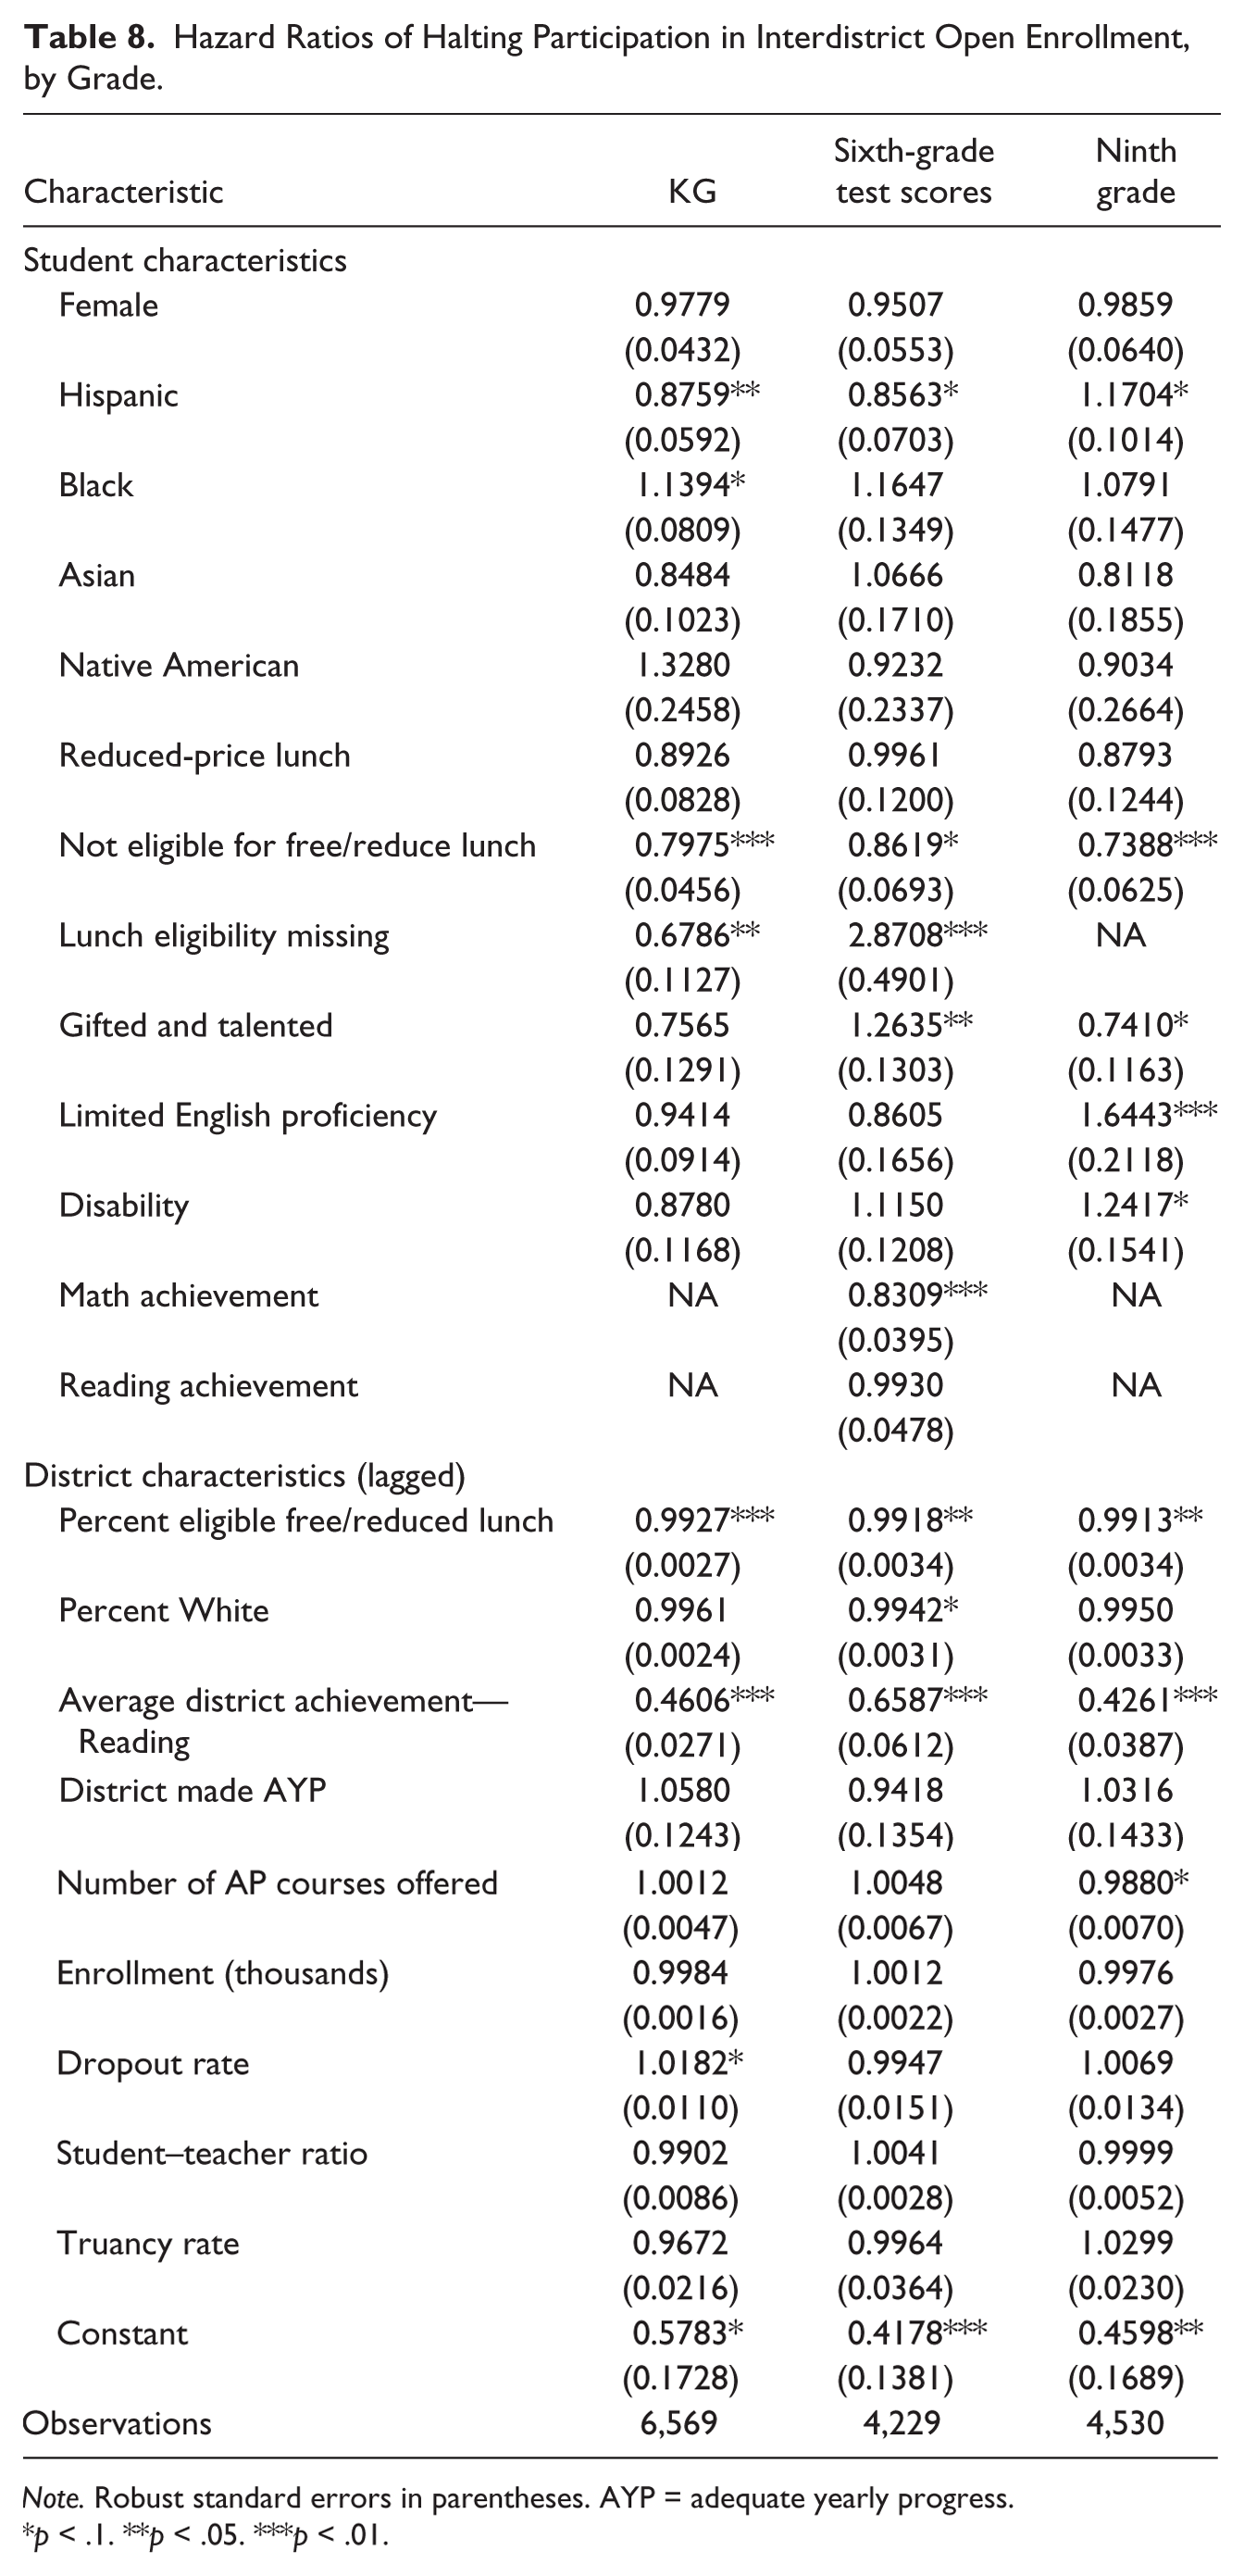
Note. Robust standard errors in parentheses. AYP = adequate yearly progress.
p < .1. **p < .05. ***p < .01.
The results presented in Table 9—again in the form of hazard ratios—further our understanding of the dynamics of interdistrict open enrollment participation by analyzing—for students who did not open enroll in 2006-2007—the factors associated with beginning to open enroll in subsequent school years. Four main findings emerge here as well. First, residing in a district with a large percentage of students eligible to receive subsidized lunch increases the hazard of beginning to open enroll. Second, residing in a district with high dropout rates and student–teacher ratios also increase the hazard of beginning to open enroll after not doing so in 2006-2007. Third, students classified as gifted and talented, limited English proficient, or learning disabled are as much as 50% less likely to begin open enrolling—after not doing so in 2006-2007—than their peers without those respective classifications. Finally, like the results of baseline enrollment models, the models predicting open enrollment take-up again demonstrate that factors associated with participation differ by grade level. For example, females are nearly 20% more likely than males to begin open enrolling in high school, but there is no difference between the sexes in earlier grades. In addition, the coefficients on both the racial/ethnic variables and the measures of subsidized lunch eligibility vary across grades. For the kindergarten and 6th-grade cohorts, students eligible for free lunch were significantly less likely than their more affluent peers to begin open enrolling. For the 9th-grade cohort, however, no such relationship is observed; if anything, students eligible for free lunch may have been slightly more likely to begin open enrolling than their ineligible peers.
Hazard Ratios of Beginning to Participate in Interdistrict Open Enrollment, by Grade.

Note. Robust standard errors in parentheses. AYP = adequate yearly progress.
p < .1. **p < .05. ***p < .01.
Supplemental Analysis
As described earlier, Hypothesis 5 is motivated by recent studies on families’ schooling preferences that have uncovered evidence that, all else equal, families prefer schools where the student body matches their demographic and socioeconomic profile (Hastings et al., 2008). This raises the possibility that students who reside in districts with demographic and socioeconomic profiles that differ from their own may exhibit distinct open enrollment participation patterns. We empirically test this theoretical proposition for three groups of students—Black students, students who are ineligible for free- or reduced-price lunch, and students with different levels of reading achievement. We perform these tests by estimating versions of Equations (1) and (2) with interactions between the relevant student characteristic and the percentage of students in the district who exhibit that characteristic. More specifically, the models contain interactions between:
An indicator that a student is Black and the percentage of students in the district who are White;
An indicator that a student is not eligible for free- or reduced-price lunch and the percentage of students in the district who are eligible to receive subsidized lunches; and
A student’s reading achievement and the average level of reading achievement in the district.
The results for these interaction terms—in log-odds and hazard ratio form—are presented in Table 10, and they generally provide support for Hypothesis 5, which hypothesizes that students who reside in a school district where the demographic profile does not match their own are disproportionately likely to participate in interdistrict open enrollment programs. For example, the results in the top panel of Table 10 indicate that Black students at all three grade levels become increasingly likely to open enroll as the percentage of White students in the district increases, although only the 6th-grade result reaches a conventional level of statistical significance. Similarly, at the 6th- and 9th-grade levels, students who are ineligible for subsidized lunch are significantly more likely to open enroll as the percentage of students who are eligible for subsidized lunches in the district rises.
Results of Interactions.

Note. Robust standard errors in parentheses.
p < .1. **p < .05. ***p < .01.
These patterns are also present in the bottom panel of Table 10, which presents—conditional on not open enrolling in 2006-2007—the characteristics associated with beginning to open enroll in subsequent school years. The results demonstrate that both Black students and those ineligible for subsidized lunch are increasingly likely to begin open enrolling as the proportion of students in the district not exhibiting those respective characteristics increases. Taken as a whole, the results provide solid support for the proposition that families use open enrollment to attend a district where the student body “looks like me.”
Discussion and Conclusion
The design of interdistrict open enrollment policies—coupled with their expansive nature and scope—provide these programs with the potential to affect several aspects of communities, including the socioeconomic composition of school districts, families’ residential location choices, and school district finances, among others. Prior to gauging any potential large-scale effects of these policies, however, it is necessary to gain an understanding of a more basic, yet no less important, aspect of interdistrict open enrollment—the characteristics of participants and the dynamics of their participation. Drawing on 5 years of student-level data from the universe of students attending public schools in Colorado, this article presents the results of analyses designed to do just that. More specifically, the results presented in the preceding sections provide insight into three main questions: Who open enrolls in a defined-baseline year? Who keeps open enrolling? And who does not open enroll initially, but participates in the program in later years? A number of notable findings emerged from these analyses—findings that have several important implications for both research and policy.
All analyses made clear that socioeconomically disadvantaged students—as measured by free lunch eligibility—were significantly less likely to open enroll than their more affluent peers. Although such a scenario has been suggested by previous work on the topic (e.g., Carlson et al., 2011; Holme & Richards, 2009; Reback, 2008), this study is the first to provide a convincing confirmation of the relationship by using multiple years of individual-level, statewide data. In providing such confirmation, the results bring to light a number of policy-relevant issues. First, such a finding is at odds with common rhetoric and conceptions regarding a primary goal of school choice programs—permitting disadvantaged students to attend higher quality schools. Although these programs undoubtedly serve that purpose for some disadvantaged students, the results presented above suggest that is not the primary way in which they are being used. Rather, it seems likely that the program’s primary use is as a public school voucher program for middle-class and upper-middle-class families. Such usage patterns are not necessarily normatively undesirable, but they need to be recognized to have an honest discussion and debate about the operations and effects of interdistrict choice policies. Second, the fact that socioeconomically advantaged students are disproportionately likely to open enroll is relevant to concerns that interdistrict choice may increase stratification along socioeconomic dimensions; the exit of socioeconomically advantaged students from districts—coupled with their presumed enrollment in more advantaged districts—may result in greater concentrations of disadvantaged students in certain school districts. 11 While recognizing the validity of such concerns, the results also indicate that it is unlikely that interdistrict open enrollment is explicitly being used as a means to increase stratification along academic or racial/ethnic lines; the relationships between open enrollment participation and test scores or race/ethnicity are relatively asystematic, if they exist at all. However, given the empirical correlations between race/ethnicity, socioeconomic status, and test scores, the ultimate result of interdistrict open enrollment could very well be increased stratification levels along all of these dimensions.
In addition to revealing differences in the likelihood of participating in interdistrict open enrollment, the results of the preceding analyses also indicated substantial variation in the stability of open enrollment participation across demographic groups. In particular, the results in Tables 6 to 9 demonstrate that Black students exhibit far less stable participation patterns than their White counterparts. Similarly, socioeconomically advantaged students display far more stable participation patterns than their less advantaged peers. Although there has been little explicit inquiry into the effect of school choice programs on student mobility, this study is the latest in a series of analyses to detect substantial rates of movement into and out of school choice programs for these student populations. As noted earlier, analyses have demonstrated very high rates of student mobility in school voucher programs in Milwaukee (Carlson, Cowen, & Fleming, 2013; Cowen et al., 2012), Washington, D.C. (Wolf et al., 2010), and New York City (Howell, 2004), as well as charter schools in several states including Florida, Texas, and Idaho (Ballou et al., 2006; Cowen & Winters, 2013; Hanushek et al., 2007). Such findings raise the possibility that increased levels of student mobility—particularly for disadvantaged populations—represent an unintended consequence of school choice policies, a possibility that is potentially troublesome given the large body of work demonstrating student mobility to have a negative effect on academic outcomes, specifically student achievement (Alexander, Entwisle, & Dauber, 1996; Engberg, Gill, Zamarro, & Zimmer, 2012; Hanushek, Kain, & Rivkin, 2004; Ingersoll, Scamman, & Eckerling, 1989; Kerbow, Azcoitia, & Buell, 2003; Lash & Kirkpatrick, 1990, 1994; Rumberger et al., 1999; South, Haynie, & Bose, 2007; Temple & Reynolds, 1999; Xu, Hannaway, & D’Souza, 2009; Zimmer & Buddin, 2009). In the light of such possibilities, the results suggest that policymakers should concentrate on not only using school choice programs to provide disadvantaged populations with access to high-quality schools but also to design such programs in a manner that maximizes the stability and continuity of that access.
The results in Tables 3, 7, and 9 make clear that students with special designations—ELL, gifted and talented, and learning disabled—are significantly less likely to open enroll than students without those designations. Less clear is whether the lower rates of participation for these populations are due to families’ choices or to districts’ refusals of transfer applications. As described earlier, districts can legally refuse transfer applications if they do not offer the programs necessary to serve a student. However, given the significantly lower rates of open enrollment by students with special designations, it may be advisable to ensure that districts are not simply using that provision to refuse the applications of students who are more expensive or difficult to serve.
Perhaps not surprisingly, the results revealed heterogeneity in the correlates of open enrollment participation across grade levels. Factors found to be related to interdistrict choice participation at some grade levels were wholly absent from others. For example, race/ethnicity was a significant predictor of open enrollment participation at the elementary and middle school levels, but not at the high school level. Similarly, test scores predicted open enrollment participation for the 6th-grade cohort, but not the 9th-grade cohort. Such heterogeneity is suggestive of a scenario where interdistrict open enrollment is being used for different purposes at different grade levels. Although our data allow us to gain significant insight into the characteristics of interdistrict open enrollment participants, they lack the detail required to determine the specific purpose of each open enrollee with certainty. For example, our data do not contain measures of convenience, such as the location of parents’ workplaces, or measures of participation in athletics or extracurricular activities, which could be related to open enrollment participation decisions.
This article presents a thorough and wide-ranging analysis of the characteristics of open enrollment participants and the dynamics of their participation, but there are also limitations that must be noted. Because this study relies on 5 years of data from students in a single state, the results of the analyses are bounded by time and space. The policy landscape is dynamic in nature and the realities of this landscape—whether they be attitudinal, political, or contextual—in one period and in a single place are not necessarily generalizable to another. Consequently, any inferences drawn from the analyses presented above must be accompanied by an appropriate degree of caution.
Further caution with respect to the inferences that can be drawn from this article is necessitated by the descriptive nature of the analyses. The results presented above describe the characteristics of open enrollment participants and the patterns of their programmatic involvement, but they do not definitively explain why participants made the observed decisions. Although not definitive, the results do provide some hints—which could serve as testable hypotheses in future research—about the motivations underlying participation decisions. For example, the results in Table 10 suggest that some families open enroll to attend a school that more closely matches their socioeconomic or demographic profile. Similarly, the results in Tables 7 and 8 indicate that families may be using interdistrict open enrollment programs to escape socioeconomically disadvantaged schooling contexts. Future research would do well to examine whether these descriptive results persist when subjected to analytical techniques designed to support causal conclusions. 12
And even descriptive findings can inform policy decisions. For example, the finding that, at least in Colorado, open enrollment is disproportionately utilized by socioeconomically advantaged students could cause policymakers who support open enrollment for its ability to provide disadvantaged students with better schooling opportunities to assess whether the design of the policy might be reconsidered to more explicitly target selected populations. Similarly, the finding of unstable program participation for certain socioeconomic and demographic groups could inform policy actions designed to achieve greater stability in schooling decisions, particularly in light of the substantial body of evidence demonstrating the negative consequences of educational instability. More generally, while the analyses presented above are limited in some respects, they still provide valuable insight into the operations of the nation’s largest school choice program—interdistrict open enrollment.
Footnotes
Declaration of Conflicting Interests
The authors declared no potential conflicts of interest with respect to the research, authorship, and/or publication of this article.
Funding
The authors disclosed receipt of the following financial support for the research, authorship, and/or publication of this article: The research reported here was supported by the Institute of Education Sciences, U.S. Department of Education, through Award # R305B090009 to the University of Wisconsin–Madison. The opinions expressed are those of the authors and do not represent views of the U.S. Department of Education.