
Abstract
The ratings given by citizens to local public schools in the United States have been rising in the last decades. Using national public opinion surveys, this study seeks to understand the determinants of public evaluations of local schools across time. Aggregate trend analyses indicate that public evaluations of local schools are influenced not only by measures of educational performance but also by presidential discourse. Individual-level analyses suggest that minorities and individuals with children may have given higher evaluations in recent years. The evidence suggests that citizens in general have moved away from more negative assessments of their local public schools, possibly as a result of perceived and real educational advances.
Slowly but steadily, citizens’ ratings of their local public schools have been increasing throughout recent decades. In particular, when asked to grade local public schools, the percentage of respondents who gave an “A” or a “B” to their schools went from 35% in 1980, to 41% in 1990, to 47% in 2000, and finally to 51% in 2011 (Phi Delta Kappa/Gallup [PDK/Gallup], 2011). Although citizens are expressing more favorable stances toward their local schools, they are not expressing increased satisfaction with schools in the nation in general. In fact, the positive disposition toward schools in the nation as a whole has trended slightly downward across recent decades, from, for example, 20% of respondents in 1981, the first year this question was asked, to 17% in 2011 (PDK/Gallup, 2011). The persistent negative evaluations of schools in the nation might be reflecting the long trend of citizen disillusion with many public institutions in the United States and the many popular accounts of school failings (Berliner & Biddle, 1995; Hochschild & Scott, 1998; Jacobsen, 2009; Loveless, 1997; Nye, Zelikow, & King, 1997; Tyack & Cuban, 1997). But why have citizens’ disposition toward local schools improved? Using national opinion surveys, the main goal of this study is to examine the determinants of public evaluations of local schools across time.
Previous research on public opinion suggests that changes in collective opinions on domestic issues tend to be gradual. Page and Shapiro (1992), examining historical opinion trends on an array of domestic issues, found that changes were often small in magnitude, with little evidence of large fluctuations. They have argued, “when public opinion has changed it has not done so wildly or capriciously or randomly; it has generally shifted in comprehensible ways, in response to new information and changing conditions” (p. 321). The steady upward trend in public evaluation of local schools may then have been based on equally slowly changing conditions, such as those from evolving educational outcomes. Given that personal experiences can mediate opinion formation (e.g., Krosnick, Holbrook, Lowe, & Visser, 2006), those with more exposure to any changing conditions in education may have been more susceptible to opinion shifts.
It is vital to examine public opinion of local schools as it has implications both for what can be hoped from educational institutions, in terms of desirable attributes, and what can result from educational institutions, in terms of immediate associated outcomes. From a normative perspective, it is important to understand the public’s views toward education to foster value coherency and legitimacy within the educational system as well as to assess its responsiveness. As some have argued, for schools to instill democratic citizenship among its students, they themselves need to encourage democratic practices that include the willingness to consider public views (Jacobsen, 2009; Mintrom, 2001). Relevant stakeholders can then help foster democratic policy-making and governance within education by recognizing the opinions of the citizenry. As Jacobsen (2009) argues, “understanding the public’s opinion towards the educational system is important as ignoring them results in increased difficulty garnering needed public support for new policy initiatives and may even threaten the stability of education as a democratically run institution altogether” (p. 308). In addition, understanding the public views on education, at the national or local level, allows society in general to grasp how education policies match expectations, or the degree of responsiveness of the educational system.
From the perspective of immediate outcomes, or a more positive perspective, it is critical to study public views on education and schools because levels of satisfaction can have very tangible consequences in a community. Citizens’ satisfaction with their public institutions and services, including schools, may influence their decision to exit a jurisdiction or “vote with their feet” (Bayoh, Irwin, & Haab, 2006; Tiebout, 1956). Withdrawal from public schools can then affect the schools themselves, in terms of funding, diversity, and educational outcomes, which in turn can affect the community more broadly. For example, housing prices have been found to vary with school quality (Black, 1999; Brasington, 1999). Citizen satisfaction, if partly resulting from performance measures, may also influence support for school reforms, school funding, and local elected incumbents (Bali, 2008; Berry & Howell, 2007; Boyne, James, John, & Petrovsky, 2009; Figlio & Kenny, 2009; Jacobsen, 2009). Finally, citizen evaluations and satisfaction with schools may influence teacher morale, in particular if dissatisfied parents opt to provide less parental support (Lumsden, 1998; National Center for Education Statistics [NCES], 1997).
This study examines both aggregate- and individual-level opinion data on positive ratings given to local school across time. The opinion data are based on PDK/Gallup polls as well as recently commissioned survey data for this study. The aggregate-level analyses span from 1974 to 2008 and seek to examine those factors that may have influenced positive evaluations of local schools, with a particular emphasis on the role of educational performance. The individual-level analyses are based on five selected single year polls, representing a given decade, and seek to identify those groups within society who may have differentially changed their evaluations of local schools across time. All in all, the analyses suggest that citizens have moved away from negative assessments of local public schools mainly as a result of educational improvements, and also in response to elite discourse. Individuals with school-age children and minorities are societal groups that seem to have distinctly improved their assessment of local public schools in recent decades.
Explaining Opinions on Schools
Theories of Opinion Formation
What influences citizens’ evaluation of their local schools? Previous research that can inform this question comes, broadly, from the literatures on political psychology and public opinion, and more specifically, from the literatures on education and public opinion. By now, there is a vast literature that has examined opinion formation and change in the American context (for recent anthologies, see Berinsky, 2012; Lewis-Beck, Jacoby, Norpoth, & Weisberg, 2008; Mutz, Sniderman, & Brody, 1996; Saris & Sniderman, 2004). In this line of research, an opinion is a political or policy attitude, where an attitude can be defined as an “overall degree of favorability” toward an object (Ajzen, 2001, p. 28; Eagly & Chaiken, 1993). Based on psychological expectancy-value theories, an attitude can be interpreted as the weighted average of positive and negative evaluations, or the “goods” and the “bads” of an object (Fishbein & Ajzen, 1975; Krosnick et al., 2006). The weights are given by subjective assessments of the likelihood of a given positive or negative attribute and the relative importance of that attribute to the individual. 1
Political scientists have also examined the role of information, in particular its source and its processing, when forming opinions. In seminal work, Zaller (1992, p.51) proposed opinion formation was the result of a process “in which people receive new information, decide whether to accept it, and then sample at the moment of answering questions.” There are several key implications rooted in Zaller’s model. First, public elites, including politicians and the media, can play a fundamental role in attitude formation as they can be the key providers of new information. Second, citizens, vary in their level of interest and knowledge of issues. Therefore, personal experience, values, and cognitive skills mediate the shaping of attitudes. Finally, citizen’s attitudes when tapped in surveys may reflect spur-of-the-moment assessments based on the most salient information they have recently received on that issue, in particular if they are not familiar with that issue.
Considering the commonalities among the different models of opinion formation, citizens can be interpreted as forming opinions by balancing “good” and “bad” considerations on the issue at hand. But which considerations make it to the balance depends on the information received (its source and its saliency), personal experiences, and cognitive skills. When applied to the arena of education policy, this would imply that citizens’ evaluation of their local schools could be shaped by the information they have acquired from elite sources (e.g., presidential statements, local politicians, or the media) or from trusted friends, their own experience with local schools, their interest in school matters, and their ability to consider arguments (e.g., positives and negatives) on school issues.
The Media and the President
As information is a key input to opinion formation, much work has been devoted to understand the role of two influential contributors to elite discourse: the media and the President. By now, there is a large and continuing literature on the effects of the media on public opinion (Bartels, 1993; Bennett & Iyengar, 2008; Iyengar & Kinder, 1987; McCombs & Shaw, 1972; Miller & Krosnick, 2000; Page, Shapiro, & Dempsey, 1987; Zaller, 1996). Whereas earlier studies of the 1940s and 1950s tended to find “minimal effects” of the media on opinions and political evaluations, with the advent of television and broader mass communication, researchers began to find more sizable effects (Bennett & Iyengar, 2008; Zaller, 1996). The media may not be able to wholesale change the opinion of large numbers of the public (i.e., large-scale persuasion), but it seems to have a significant role in influencing what individuals consider is important (i.e., agenda setting and priming), and shaping the interpretation of some of the attributes of an issue (i.e., framing; Iyengar, 1991; Iyengar & Kinder, 1987; McCombs & Shaw, 1972). Moreover, these mechanisms of influence are mediated by citizens’ interests and backgrounds (Iyengar & Kinder, 1987; Miller & Krosnick, 2000; Zaller, 1992).
In the context of education, the media has attracted attention to schooling but, according to some scholars, by often emphasizing, or priming, negative stories and attributes of schools (Berliner & Biddle, 1995; Kaplan, 1992; Loveless, 1997; Pipho, 1999; Tyack & Cuban, 1997). From this perspective, in particular in the 1980s and 1990s, the media’s portrayal of schools and education in general may have at times been distorted, overly negative, or poorly informed (Berliner & Biddle, 1995; Kaplan, 1992). According to Rothstein (1998), the dismal views on the conditions of education at the time may have built on an “overreliance on school anecdotes” without careful considerations of the complex realities of education data. However, the media’s priming of negative stories may not have just been in the arena of education. As Nye et al. (1997) argue, the changing role of the media after the 1960s, “more intrusive, editorial, and negative in their reporting” (p. 268), is a very likely causal candidate, among others, in their analysis of declining confidence in the government in general (see also, Jamieson & Waldman, 2003; Ladd & Bowman, 1998; Patterson, 1993).
The President can also play an important role in setting what is important policy-wise, or the policy agenda. According to Kingdon, from the public pulpit or by his institutional and organizational powers, the President can display his agenda-setting powers, communicating his policy priorities (Kingdon, 2003). The President’s “vantage points,” including public attention, imply that his domestic powers are often those of influence and persuasion, rather than command (Neustadt, 1976). Although the research on public opinion has generally argued for a significant influence from political elites on mass opinion (e.g., Zaller, 1992), the recent evidence on presidential influences has often emphasized conditional effects. The extent of Presidents’ power to influence opinion can be mediated by their own popularity, skills, pre-existing public opinions and predispositions, and changing media landscape (Baum & Kernell, 1999; Canes-Wrone, 2011; Edwards, 2009; McGraw & Hubbard, 1996; Page et al., 1987). Research on Presidents’ State of the Union (SOTU) speeches, which often emphasize past accomplishments and new initiatives, has found that though these addresses have little influence on a President’s approval ratings (Gallup, 2010), they draw attention to specific policy areas and therefore can influence the policy agenda (Cohen, 1995). In the context of education, Howell, Peterson, and West (2009) find experimental evidence of presidential influences on citizens’ opinion on charter schools, merit pay, and vouchers. They conclude, “Our findings suggest that a well-publicized stance taken by a popular president on an education issue might shift the opinions of large segments of the American public” (Howell et al., 2009, p. 29).
Opinion Trends on Domestic Issues
Mass aggregate opinion, though malleable to media and elite influences and subject to the conditions of the time, has proven to be quite measured in its changes. The literature on domestic policies has often suggested the prevalence of stability or slow change in policy preferences and opinions (Page & Shapiro, 1992; Wlezien, 1995). In Page and Shapiro’s (1992) classic study, they examine from the 1930s to 1990 long-term trends in public opinion across an array of domestic issues. They found that over 60% of domestic opinion trends had no significant change at all, that is, changes of 6% or more. As they state, “Collective policy preferences are generally stable; they change in understandable, predictable ways” (Page & Shapiro, 1992, p. 385). Abrupt changes in policy opinion have been found more frequently in the realm of foreign policy, as in, for example, responses to wars or terrorist incidents (Baum, 2002; Mueller, 1973).
Many trends in opinion on education issues have also displayed relative stability, although of course with evolution or eventual changes, as with other domestic issues (Frankenberg & Jacobsen, 2011; Jacobsen & Saultz, 2012). Education scholars have long noted the evolution in the opinion trends on the quality of schools in the nation, local schools, and top concerns with schools (Hochschild & Scott, 1998; Loveless, 1997; PDK/Gallup, 2011, 2012; Public Agenda, 2003; Tyack & Cuban, 1997). As already mentioned, the public has remained continuously disillusioned with schools in the nation across time, but in contrast, the public’s opinion on local schools first declined in the 1970s and 1980s and has now slowly been increasing. This contrast between opinions on schools in general and local schools might be explained as the result of a negative bias toward public institutions in general, more familiarity with local institutions, and negative media biases (Nye et al., 1997); that is, it can be part of the phenomenon of distrusting Congress but liking one’s representative, first examined by Fenno (1978).
Although there has been a lot of work describing the trends in opinions of schools, there has not been much statistical work on the longitudinal determinants of these opinions. In a critical study, Loveless (1997) puts forth four possible explanations for the decline in confidence in public schools: demographics, education performance, institutional discontent, and negative media and popular accounts. Although the four posited explanations are not tested statistically, Loveless (1997) finds more plausible evidence for the later three explanations, including “the obvious candidate” educational performance (p. 132). In a more recent study, Pride (2002) argues that critical events rather than performance measures can better explain evaluations of local schools. However, the study is restricted to opinions from a single county.
School Performance, Personal Experiences, and Opinions in Education
Clearly, it is reasonable to hypothesize that objective information on the performance of schools may be linked to the public’s opinion of them. Both the parental school choice and parental satisfaction literatures have shown individual-level linkages between performance measures and behavior and satisfaction (Greene, Howell, & Peterson, 1998; Hastings, Van Weelden, & Weinstein, 2007; Hausman & Goldring, 2000; Henderson, Chingos, & West, 2010; Kleitz, Weiher, Tedin, & Matland, 2000; Schneider & Buckley, 2002; Schneider, Marschall, Teske, & Roch, 1998). In fact, Charbonneau and Van Ryzin (2012), in a cross-sectional analysis examining parental opinion data from parents of children in about 900 schools in New York City, find that objective school performance measures are strong and significant predictors of parental satisfaction. Jacobsen, Saultz, and Snyder (2013), focusing also on New York City data, find that changes in performance measures have an immediate impact on parental satisfaction. As they state, in education, “[it] appears that public data can influence public perception and action” (Jacobsen et al., 2013, p. 364).
For respondents to be reacting to official measures of school performance implies that they have some knowledge of school conditions. Howell et al. (2009) find that the public in general, not just parents, and at least in recent times, “have a generally accurate understanding of school performance” (p. 28), though not so much of spending in education. Specifically, and relevant to this study, they find that the public has a reasonably accurate estimate of nationwide high school (HS) graduation rates. In part, this may be driven by the abundance of education data. After No Child Left Behind, there has been a dramatic increase in the requirements of school performance data collection and reporting (Jacobsen et al., 2013; Reese, 2005). At this time, compared with previous decades, it is relatively simple to access current performance reports on local schools.
Academic performance is an important criterion by which the public may assess their schools though not the sole one. For example, Rothstein and Jacobsen (2006), in a study of Americans’ views on the goals of public schools, find that out of eight possible goals, academic and cognitive skills received the highest relative importance (at 40%), but the remaining six categories, which could include goals such as citizenship or emotional health, received each comparable levels of importance (at around 10%). Have the views of what matters in education and in schools changed over time? Unfortunately, we do not have long-term consistent survey measures of Americans’ goals for education in the same way that we do have for their evaluation of the education system itself.
In some respects, there might be continuity in that from a historical standpoint, as Rothstein and Jacobsen (2006, p.270) argue, “most Americans have wanted both the academic focus and the social and political outcomes” with regard to education. This balanced, but also somewhat conservative, view may have been at the core of the public’s goals for education for long periods of time. As Plank (2005, p.15) states, “parents’ preferences are generally conservative when it comes to schooling,” and “schools that promise safety, order, and a focus on the academic ‘basics’ are attractive to parents.” However, it is also likely that new expectations have been added for schools. In particular, from an institutional perspective, now more than ever schools may be expected to be accountable and to satisfy differentiated demands (e.g., charter schools, virtual schools). 2 If that is the case, improved evaluations of local schools may also be responding to perceived improvements with regard to these (newer) criteria.
Finally, scholars of public opinion on education have also examined the role of background characteristics on opinion formation, tapping into explanations related to personal experiences and self-interest (Berkman & Plutzer, 2005; Friedman, Bobrowski, & Geraci, 2006; Klugman, Barnhouse Walters, Stuber, & Rosenbaum, 2011; Pride, 2002; Reed, 2001). For example, in the context of explaining support for school funding, across time and the nation, Berkman and Plutzer (2005) find that the young, African Americans, parents, and those college educated are most supportive of increased spending in education, whereas Friedman et al. (2006) find significant racial group differences in satisfaction with schools across the nation.
Research Questions
All in all, previous research suggests that opinions on schools may be shaped in particular by the performance of the schools themselves, elite and media accounts, and personal experiences and background. The focus of this study is on opinions on local schools, and not schools in the nation as a whole. Although the opinion trend on schools in the nation seems to echo the often observed declining trends in confidence in American governmental institutions, the opinion trend on local schools displays a different pattern that invites further examination. This study seeks to address two general research questions related to opinions on local schools. First, what are the determinants of opinions on local schools? The first hypothesis is that educational performance is the key driver of opinions on local schools. Second, given that public ratings of local schools have increased in recent decades, have any groups in society differentially changed their opinions on local schools? Previous research suggests that personal experiences, interests, and skills can mediate such attitude changes. The second hypothesis is that those who had differential access and experiences with their local schools may display distinct changes in their opinions.
Method and Data
The evolution of citizen opinion of local public schools is examined with analyses at the aggregate level and the individual level. The aggregate analyses address the first research question of what drives evaluations of local schools across time whereas the individual analyses address the second research question of who may have changed their evaluation of local schools across time. The dependent variable in either specification, aggregate or individual, is derived from a standard PDK/Gallup poll question where respondents are asked to give a grade to their community schools, from “A” to a “Fail.” 3
Aggregate-Level Data
The dependent variable in the aggregate analysis is the percentage of respondents who gave their local schools an “A” or a “B” in a given PDK/Gallup poll year. The unit of analysis is a year, and the span in years is from 1974 to 2008. The restriction to 2008 derives from the availability of selected independent variables. Methodologically, regression-based models are used to predict the yearly percentage of positive “A” and “B” evaluations. Several specifications are presented to account for possible time dependencies, such as the presence of time trends or serial correlation, and in general to ensure the robustness of the results.
The independent variables in the aggregate analyses include, broadly, educational performance, political elite activity in the arena of education, and media attention. Alternative specifications also include measures of general public mood and confidence in institutions, as well as a measure of demographic shifts. All independent variables are lagged 1 year with respect to the dependent variable, with the exception of the measure related to presidential SOTU addresses as these occur early in the year. In addition, most of the independent variables are national in scope. Although theoretically it might be warranted to include local-level related measures, aggregated in some fashion, in practice, it might be difficult to obtain such measures. 4 However, as discussed in the following section, in the individual-level analyses, state-level educational outcomes can be included.
Starting with educational performance, the key factor for the first part of the analyses, two measures of educational outcomes are included: yearly high school completion rates and SAT scores. HS Completion Rate measures the percentage of 18- to 24-year-olds who are not currently enrolled in school and who have a HS diploma or a General Equivalency Degree (GED) equivalent in a given year, based on the Current Population Surveys (Institute of Education Science [IES], 2011). SAT test scores are measures of individual preparedness or readiness for college, and are not intended as a general assessment of the schools in the nation. However, there are not many alternative educational measures that are both national in scope and with a yearly collection schedule. 5 In this study, the total national mean SAT scores in reading and math for a given year are combined (simple average) to obtain a combined score, or SAT Composite. High school completion rates and SAT scores are expected to have a positive effect on evaluations of local schools.
To capture political elite discourse and activity in the arena of education, three measures are considered: (a) the number of statements on education issues in the President’s yearly SOTU address, (b) the number of laws passed by Congress pertaining to education in a given year, and (c) the percent change in the U.S. federal budget allocated to elementary, secondary, and vocational education. These data were obtained from the Policy Agendas Project (PAP) that houses multiple historical measures and trends related to public policy. 6 The variable SOTU on Education is the number of times a President makes a “positive” or “neutral” statement (or quasi-sentence) on an education-related topic during the SOTU address. The focus on “positive” or “neutral” statements is because SOTU addresses in many instances showcase past accomplishments and present new initiatives, such that more favorable statements may prevail. 7 Laws on Education is the number of public laws related to education in a year as listed in the Congressional Quarterly Almanac. Percent Change K-12 Budget is the percent change in the federal budget appropriated to elementary, secondary, and vocational education from 1 year to the next. The general expectation is that positive (or, at least non-negative) mentions from the President on issues related to education will positively frame the issue for citizens and therefore increase their evaluation of schools. Moreover, any increased activity from the government in the arena of education, be it in the form of laws or budgetary allocations, will be part of the news and may translate into more positive evaluations of schools in general, including local schools.
To address the media’s attention to educational issues, an index constructed by the PAP and derived from the New York Times (NYT) is used (PAP, 2012a). From a random sampling design of the New York Times Index, the PAP identified news items dedicated to education on a yearly basis. A brief substantive description is given of each sampled education news item. For this study, sampled descriptions that could be interpreted as “negative” news stories, or stories suggestive of problems in the arena of education, were summed up by year. For example, negative NYT items included accounts on poor educational outcomes, problems with discipline in schools, problems with drugs in schools, protests by students, disputes about education funding, and bureaucratic malfeasance, among others. The focus specifically on negative stories is because, as previously discussed, it has often been argued that the media has contributed to the unfavorable portrayal of American schools. NYT on Education is then the number of sampled “negative” education news items derived from the yearly New York Times Index. 8 There are disadvantages to using an index based on the NYT: It is based on a single news outlet, this outlet has a specific ideological orientation, and regional stories are also included. However, it is a nationally recognized outlet. The drawbacks suggest that the results on the media should be considered with some caution. The expectation is that more negative media accounts correspond to decreased levels of satisfaction with schools in general, including local schools.
Concerns with the conditions of schools could be influenced by more general trends in public opinion, related to broader themes of the proper role of government and the general level of trust in institutions. To address this, an alternative specification was considered where general opinion trend indicators were included in addition to the previous independent variables. More specifically, General Public Mood is the customary measure of left–right general attitudes toward more or less government as originally conceptualized by Stimson (1991), but now further extended and obtainable from the PAP (2012b). With a scale between 0 and 100, higher values correspond to more liberalism, or a preference for a bigger role for government. Confidence in Legislators is the percentage of respondents from the General Social Survey (GSS) who when asked about their confidence in the people running Congress answered “a great deal.” When comparing confidence levels for different public institutions, those for Congress have particularly suffered. The expectation is that public opinion trends leaning toward a smaller role for government and less confidence in institutions may correspond to decreased levels of satisfaction with public schools.
Finally, to address influences from demographic shifts, an alternative specification was considered including the percentage of the U.S. population 5 to 17 years of age (% 5- to 17-Year-Olds) from the U.S. Census Bureau. Across the period of study, the percentage of 5- to 17-year-olds has gone from 24% in 1974 to 17.5% in 2008. Families with children may display more consistent responses about schools as they may have more direct involvement and knowledge. Previous evidence shows that respondents with children tend to display more favorable evaluations of schools (PDK/Gallup, 2010, 2011). The expectation is that as the number of school-age children decreases, personal interest and involvement with schools may decline, leading to drops in favorable evaluations of schools.
Individual-Level Data
The dependent variable in the individual-level analyses is a binary discrete indicator (1-0) reflecting whether a respondent gave high grades (“A” or “B”) or not in five selected polls: 1983, 1992, 2001, 2012 (phone based), and 2012 (Internet based). The data for the 1983, 1992, and 2001 surveys are from PDK/Gallup. The 2012 data were commissioned for this study and collected out by the Harris Group (phone based) and Russell Research (Internet). The choice of the years is determined by data availability and the aim to analyze opinions as close as possible to once a decade, up to recent times. 9 Drawing inferences from two surveys for 2012 can hopefully provide more confidence in the interpretations for recent times. Methodologically, the analyses consist of probit model specifications with sampling weights that are appropriate for binary discrete dependent variables.
The independent variables in the individual-level analyses include standard socio-demographic controls (White, Female, College Degree, High Income, Children in Household) as well as party ID (Republican and Democrat), urban dweller (Central City), and an indicator for state-level educational performance (HS Graduation Rate). 10 The later control, HS Graduation Rate, is the average freshman graduation rate by state, as derived from the Common Core Data from the National Center of Education Statistics. 11 The initial expectation is that socio-demographic groups for whom the quality of local schools can be personally more salient may display statistically significant associations. In particular, respondents with children, middle age, and residing in urban areas may have more consistent opinions with regard to their local schools. Furthermore, individuals with more resources (income or education) may display more positive evaluations if these life advantages translated into living in communities with better schools. Finally individuals residing in states with better educational outcomes (i.e., higher high school graduation rates) and outside of urban cores may be more positive toward their local schools. In general, some caution must be taken in the interpretation of the individual-level analyses as each socio-demographic group examined may not be thoroughly represented in the sample, in particular if the group’s size is small. The one exception to this are parents in the PDK/Gallup polls as they are over-sampled.
Summary Trends
Before proceeding to the multivariate analyses, time trends of positive evaluations of local schools and key educational outcomes (HS Completion Rate and SAT Composite) are presented. Figure 1 shows aggregate levels of positive evaluations of local schools from 1974 to 2011, based on PDK/Gallup polls. As can be seen, the approval of local schools dipped dramatically in the early 1980s, reaching 31% in 1983. Close to 10 years earlier, positive evaluations of local public schools had been much higher: For example, in 1974, they reached 48%. After 1983, an upward trend is established, with the percentages in the 1990s being in the mid-40s, and the percentages in the 2000s being in the high 40s. The assessment of schools in the nation as a whole hovered between 20% and 30%, dipping below 20% in the last 3 years.
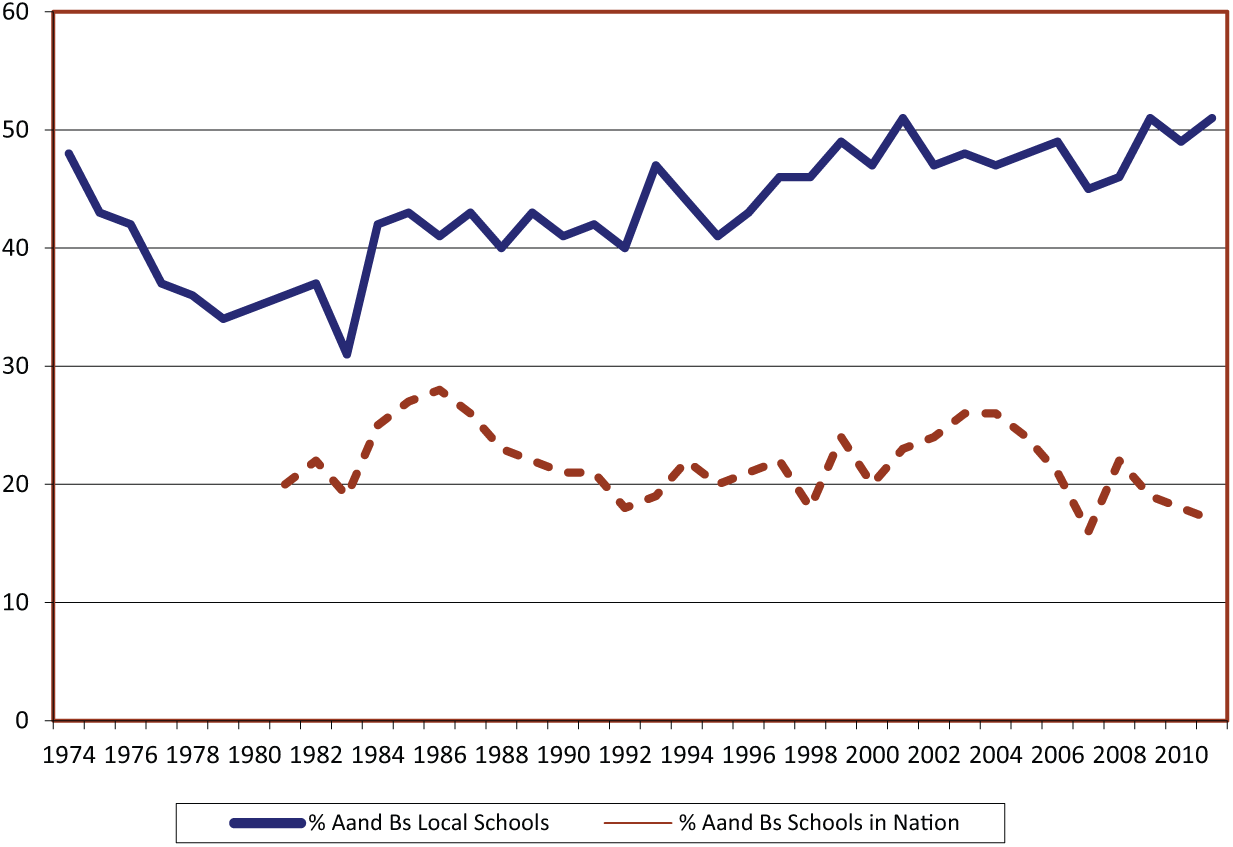
Percentage of respondents grading local schools and schools in the nation with “A” and “B,” 1974-2011.
Figures 2 and 3 present trends in educational performance, as measured by high school completion rates and SAT (math and reading) scores. Up to the early 1980s, both completion rates and SAT scores gave an unsatisfactory picture of the conditions of education: The completion rate remained relatively flat, and SAT scores in reading and math both substantially dipped. Results such as these triggered at the time reports like A Nation at Risk (1983) which warned of a national educational decline, or a “rising tide of mediocrity” (National Commission on Excellence in Education, 1983). Thereafter, completion rates display a general upward tendency that intensifies after 2000. Similarly, after mid-1980, there is an upward trend in math SAT scores. SAT reading scores have remained, by comparison with the other trends, relatively flat. Alternatively, if we consider National Assessment of Educational Progress (NAEP) scores from the early 1970s to those from 2008 (not shown), they also reflect improvements, specifically for 9- and 13-year-olds overall, and African Americans and Hispanics in particular (IES, 2009). In general, there have been modest but measurable educational improvements across the decades by some of these indicators that receive both media and academic attention.
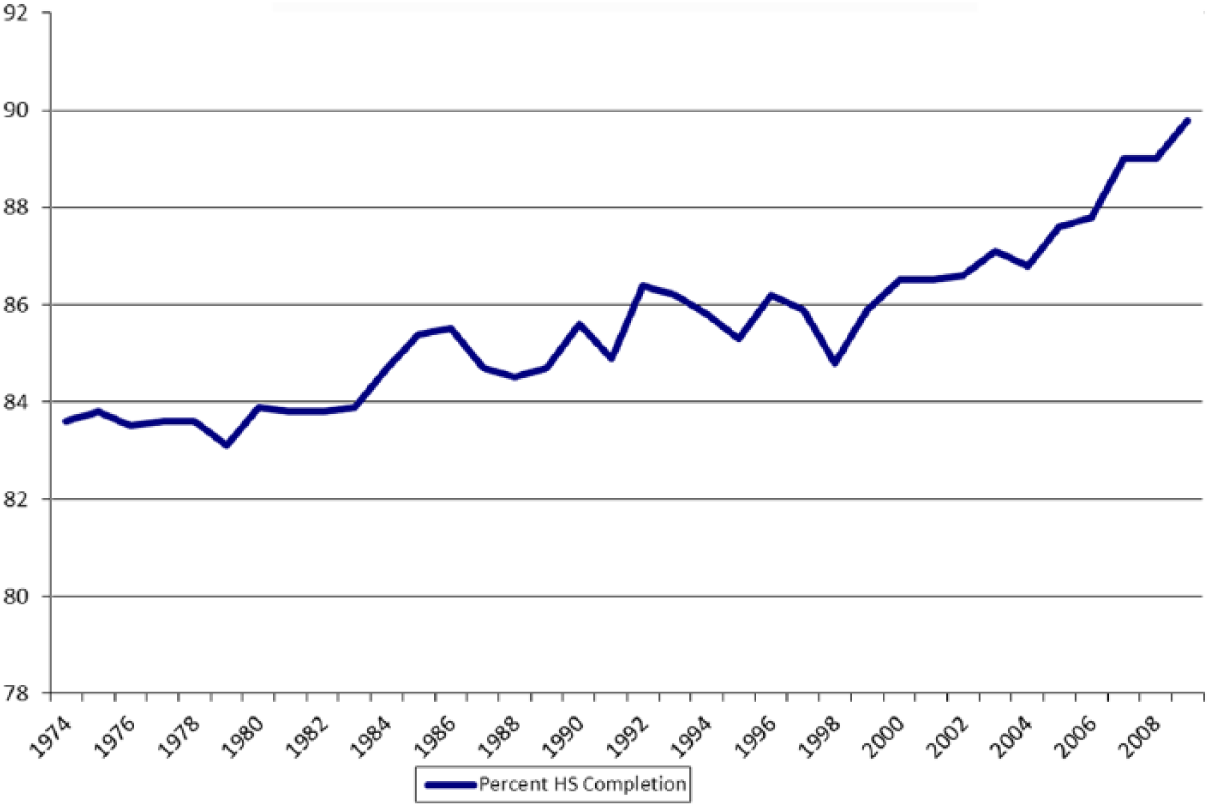
Percent HS completion rates (%), 1974-2009.
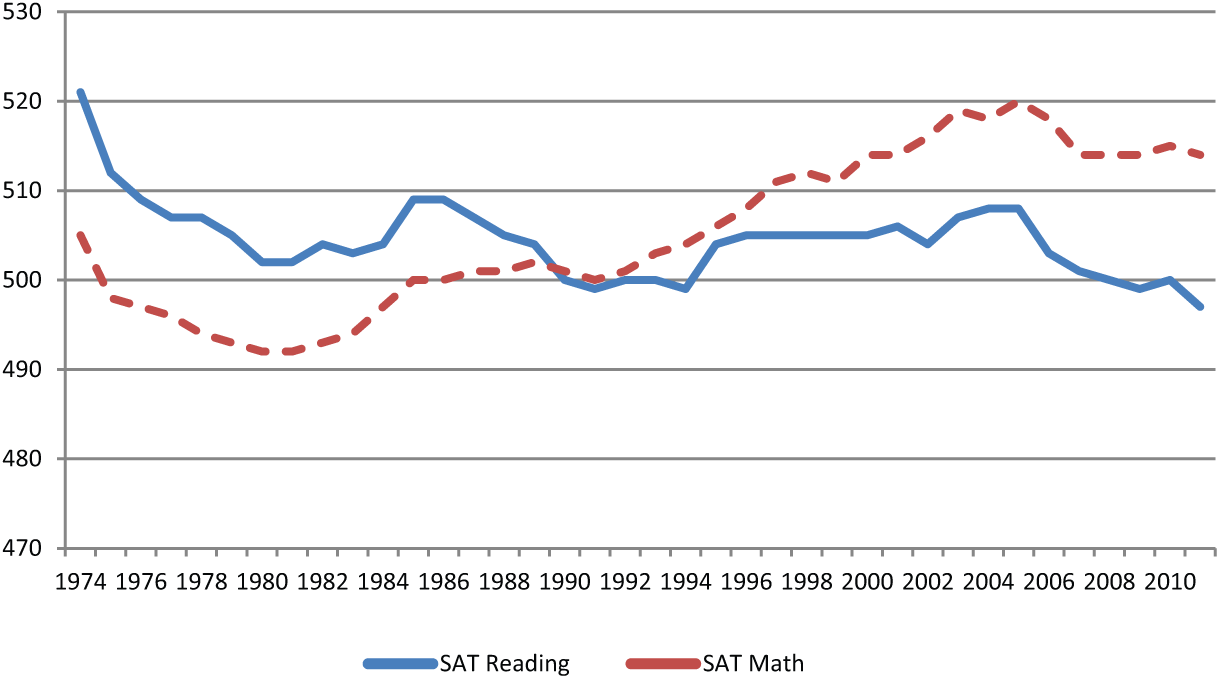
Average math and reading SAT scores for college bound students, 1974-2011.
Results
What Drives Improved Evaluations?
Table 1 presents multivariate regression results from predicting aggregate positive evaluations of local public schools across different specifications. Model 1 is a basic ordinary least squares (OLS) regression model. Model 2, the benchmark model for this part of the analyses, is a regression model with a time trend. Model 3 is a Prais–Winsten regression model that accounts for potential serial correlation. Models 4 through 6 consist of the benchmark Model 2 but with the inclusion of different or additional independent variables: NAEP scores of 17-year-olds are included instead of SAT scores in Model 4, general public mood measures are added in Model 5, and a measure of demographic shifts is added in Model 6.
Regression Models Predicting Aggregate Positive Evaluations (“A” and “B” Grades) of Local Public Schools, 1974-2008.
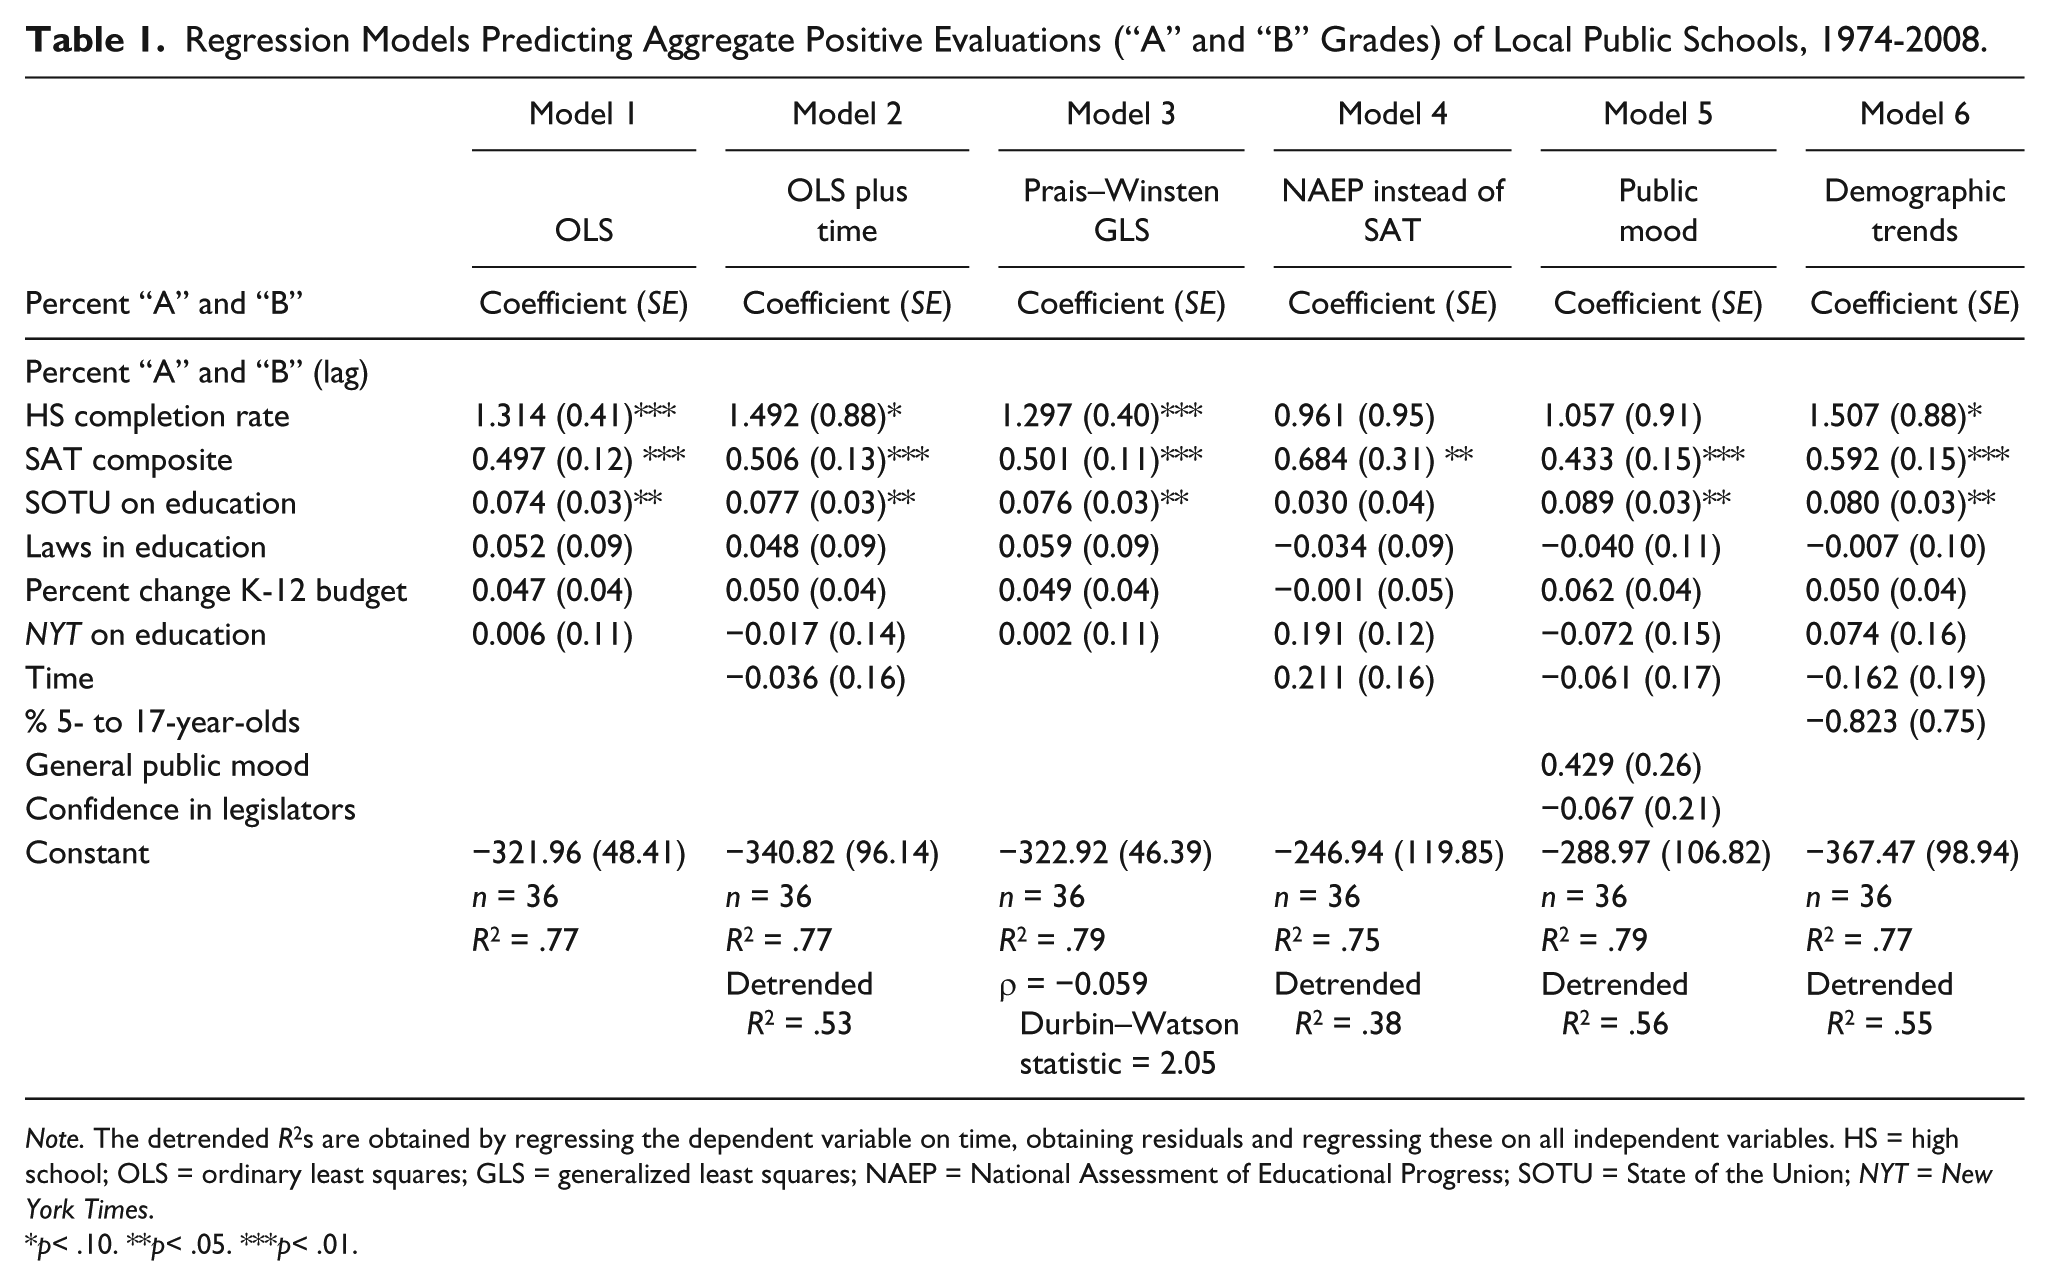
Note. The detrended R2s are obtained by regressing the dependent variable on time, obtaining residuals and regressing these on all independent variables. HS = high school; OLS = ordinary least squares; GLS = generalized least squares; NAEP = National Assessment of Educational Progress; SOTU = State of the Union; NYT = New York Times.
p< .10. **p< .05. ***p< .01.
With time-series data, it is necessary to examine the nature of any time dependencies. Tests for the presence of unit roots and stationarity reveal that the dependent variable and many of the independent variables have a time trend dependency in them; however, they do not display correlations across long periods. 12 Therefore, only a time trend term is needed to address time-related dependencies. Model 2 is the benchmark model with such a specification. Another concern that may arise with time-series analyses is serial correlation or time dependencies in the residual error terms of the regression. The Prais–Winsten specification (Model 3) addresses this by explicitly accounting and estimating for correlation in the errors across periods. However, the results show no evidence of serial correlation, as seen by the estimate rho statistic of the correlation and the Durbin–Watson statistic. The model fit or R2 across the models is quite high, above 75%. However, this in part reflects the presence of a time trend. Detrended R2s that subtract the contribution from the time trend are still quite substantial and range between 38% and 56% (see bottom of Table 1).
Quite starkly, the message from the analyses in Table 1 is that educational performance is associated with positive evaluations of local public schools. Focusing on Model 2, the benchmark model, a 1 percentage point increase in the high school completion rate above its long-run trend corresponds to a 1.5 percentage point increase in positive evaluations. For the SAT composite score, a 1 point increase above its long-run trend increases positive evaluations by around 0.5 percentage points. These are non-negligible effects. The standard deviation of the detrended high school completion rate is 0.6, and for the detrended composite SAT score, it is 4.5. This means that a one standard deviation change in completion rates, beyond the long-term trend, increases positive evaluations by about 1%, and a one standard deviation change in SAT composite scores, beyond their trend, increases positive evaluations by over 2%.
The only other independent variable to have a statistically significant effect across models is the number of positive (or neutral) mentions on education topics by the President in SOTU speeches. 13 One extra positive/neutral statement on education by the President, beyond the long-run trend, raises positive evaluations by around 0.07 percentage points. The average number of positive/neutral SOTU statements on education across the period of study is around 14, and the standard deviation in detrended education statements, beyond their long-run trend, is around 16. This means that a 1 SD change in detrended favorable SOTU education statements increases positive evaluations by over 1%.
Clearly, a President’s pronouncements may also reflect growing interest in the public with education topics. To assess the possible two-way relationship between citizens’ attitudes on education and presidential statements, Granger causality assessments were carried out. Specifically, a regression was run predicting positive/neutral SOTU statements, and including all of the independent variables in Model 2 plus the following variables: the percentage giving positive evaluations to local schools, a lag of this variable, and a lag of the dependent variable. In essence, this is a Granger causality assessment between attitudes toward local schools and presidential addresses. Only two variables achieved statistical significance: the lag of positive/neutral SOTU statements and budgetary changes. Presidents’ statements on education then were not linked to the public’s evaluations of local schools and also they were not linked to educational outcomes. Next, a comparable analysis was run with a more general measure of the public’s concern with education: the percentage of respondents who consider education the most important problem facing the country. In this instance, the public’s concerns were found to affect positive/neutral SOTU statements in education. In a preliminary fashion, this suggests that only overall preoccupation from the public on education affects presidential addresses.
Model 4 estimates the benchmark model with NAEP scores of 17-year-olds (a composite of reading and math) instead of SAT scores. After detrending, a 1 point increase in NAEP scores corresponds to a 0.7 percentage point increase in positive evaluations. Model 5 examines the benchmark model with general public opinion trends added. Neither the global public mood indicator nor the level in trust in Congress has a statistically significant effect on evaluations of local schools. Importantly, the statistical significance of the SAT composite measure and the President’s SOTU statements remain after the inclusion of these general trend factors. Finally, Model 6 adds to the benchmark model the percentage of 5- to 17-year-olds in the population. Again, the SAT composite measure and the President’s SOTU statements remain statistically significant after accounting for demographic shifts.
All in all, the aggregate analyses establish that educational performance is a key driver of the public’s assessment of their local schools across time. The President’s pulpit, as captured by his statements in the SOTU speeches, can also influence evaluations of local schools, though these statements themselves may be driven by the public’s overall preoccupations with education. 14
Who Has Improved Their Evaluation of Local Schools?
Turning next to the individual-level analyses, Table 2 presents probit models predicting respondents’ positive evaluation of local schools for the years 1983, 1992, 2001, and 2012 (two polls for this year, phone and online). After the coefficient and standard errors, each model includes a column with first difference effects for those variables that achieve statistical significance. These effects are the change in the predicted probability of a positive evaluation when toggling one independent variable at a time, holding all others constant at a baseline level. 15 In contrast to the aggregate models, the predictive power of the individual-level analyses is much more limited. For example, the percent reduction of error in the specifications hovers around 6% and 14%. The individual analyses do not have a measure of a respondent’s local schools’ performance. Such a measure is not available, but it is approximated by state-level graduation rates and type of residence of a respondent (i.e., city dweller or not).
Probit Models Predicting Individual Positive Evaluations (“A” and “B” Grades) of Local Public Schools in 1983 and 2012.
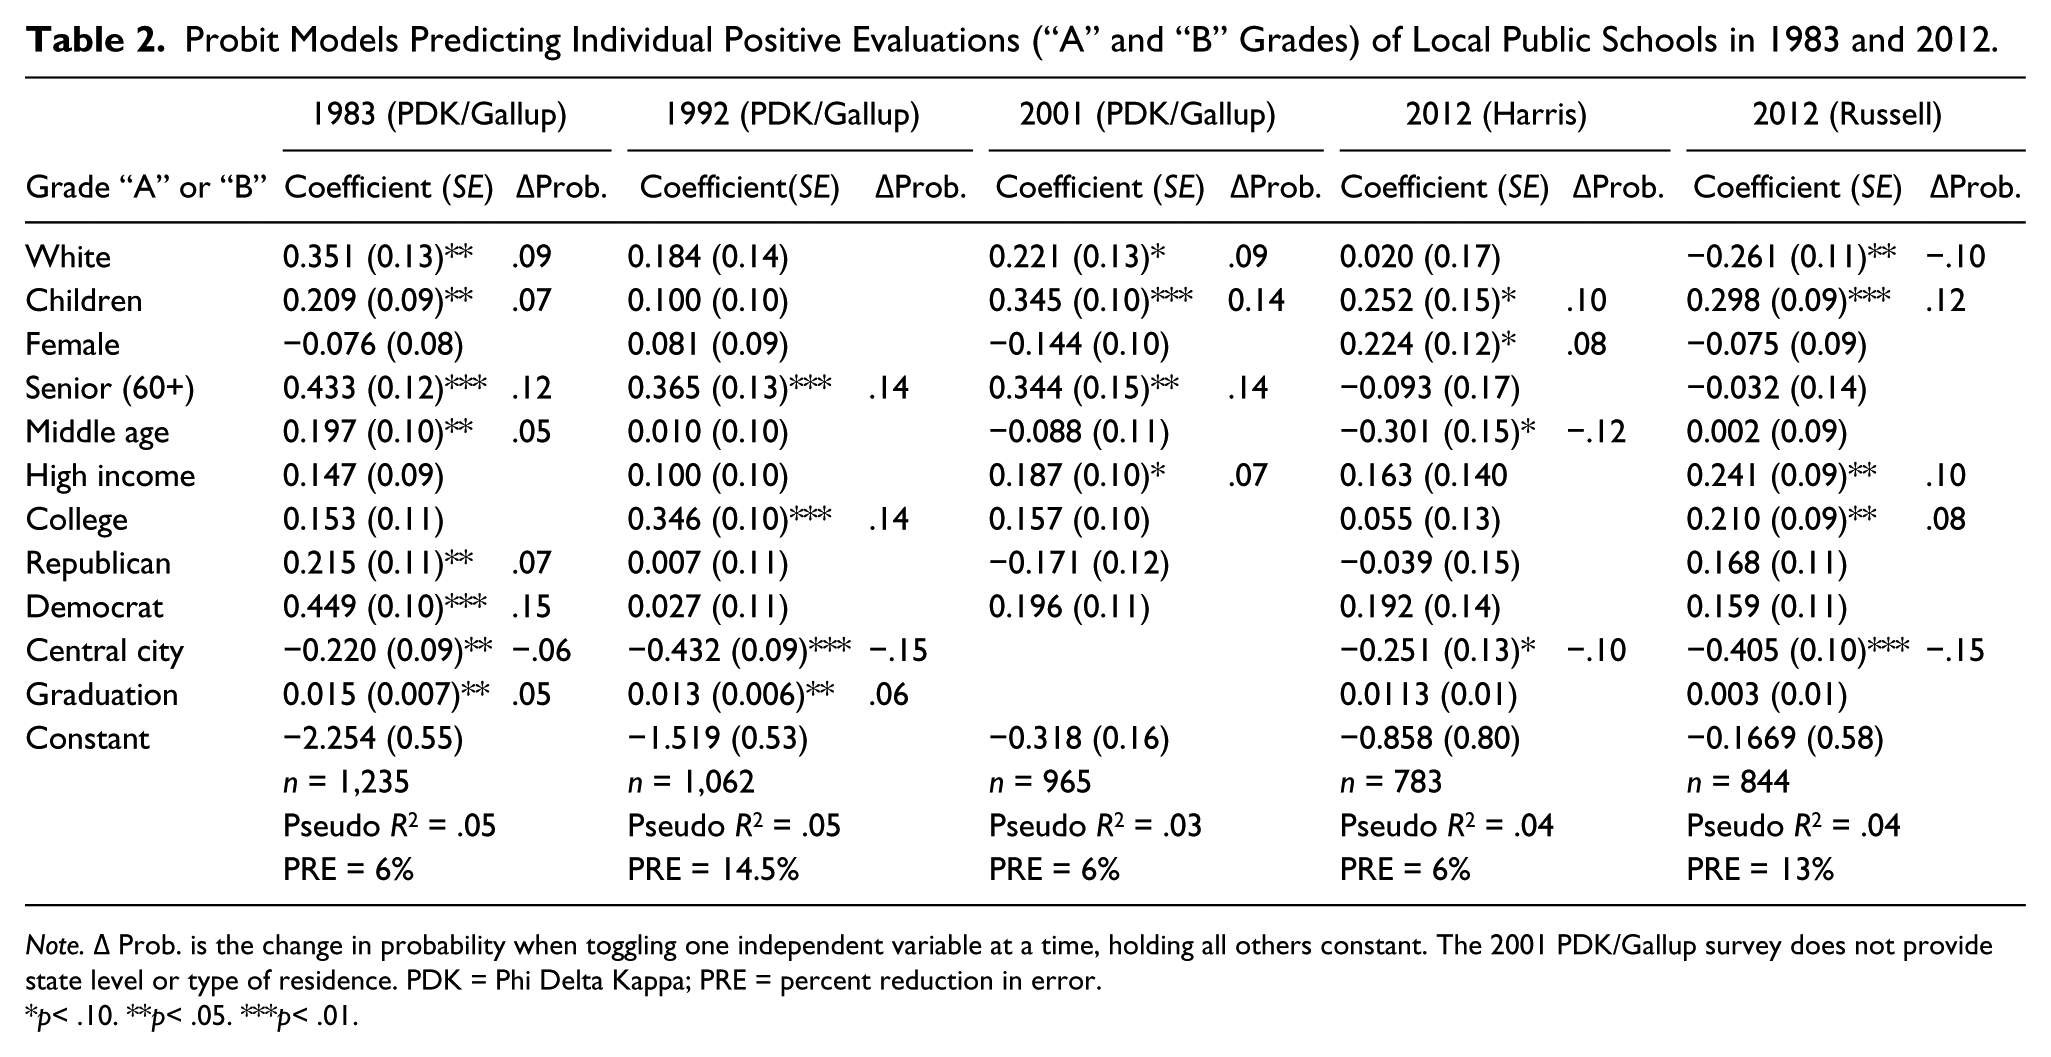
Note. ΔProb. is the change in probability when toggling one independent variable at a time, holding all others constant. The 2001 PDK/Gallup survey does not provide state level or type of residence. PDK = Phi Delta Kappa; PRE = percent reduction in error.
p< .10. **p< .05. ***p< .01.
To assess whether any particular societal group has changed its opinion of local schools across time, the strategy is to examine the evolution of each factor across the models. Beginning with race, White respondents were more likely, compared with non-Whites, to give a positive evaluation in 1983 and 2001. Specifically, the probability of giving a high grade increases by .09 in both of these years among White respondents. In 1992, the coefficient for Whites is positive and large though not statistically significant. By 2012, White respondents are indistinguishable from non-Whites in the Harris (phone) survey, and statistically significantly less likely to give positive evaluations in the Russell (online) survey. In the Russell survey, White respondents are less likely to give high grades than non-Whites by .10.
Another way of looking at the results for race is to examine average predicted probabilities of giving a positive evaluation. Figure 4 below presents these averages for Whites and non-Whites (as well as for those with and without children) from 1983 to 2012. In 1983, the average predicted probability of giving a high grade is .40 for White respondents and .25 for non-White respondents. Non-Whites, who were mainly African Americans in the 1983 survey, were giving much lower grades to their local schools than White respondents. By 2012, in the Harris survey, the average predicted probability of giving a high grade is .54 for the whole sample, the same value for White respondents and .53 for non-White respondents. In the Russell 2012 sample, in the predicted probabilities Whites average .54 and non-Whites average .59. These results suggest minorities (or non-Whites) have improved their opinion of local schools across time even more than White respondents.
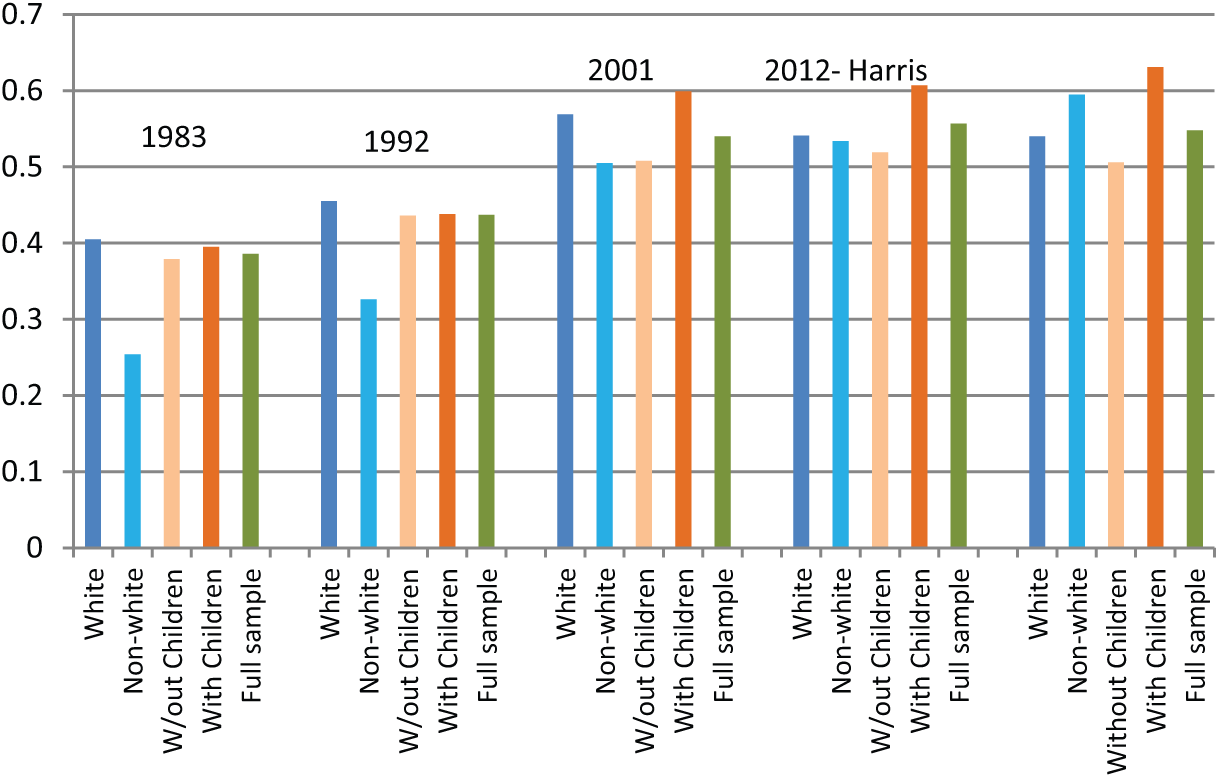
Average predicted probabilities of positive evaluations.
Whether a respondent has children, their gender, and their age may have an impact on their inclination to give high grades to local schools. These background characteristics can mediate their exposure and familiarity with local schools. Respondents with children are through the years more likely to give higher grades. Statistically significant effects are found in 1983, 2001, 2012 (Harris), and 2012 (Russell). In fact, their propensity toward positive evaluations seems to have increased with time. In 1983, the probability of giving a positive evaluation was .07 higher among those respondents with children than those without children. By 2001, this propensity had increased to .14. In terms of general group probabilities, as seen in Figure 4, in 1983 the average predicted probability of giving a high grade was .40 for those with children and .38 for those without children. By 2012, in the Harris poll, the average predicted probability was .60 for those with children and .52 for those without children. Individuals with children may have become even more predisposed to give positive evaluations to their local schools.
Female respondents compared with male respondents do not display any differential inclinations toward giving high grades throughout the surveys. In terms of age, senior respondents were more likely than younger respondents (those less than 40) to give higher grades in 1983, 1992, and 2001. But by 2012, this differential was gone. From the perspective of average group probabilities (not shown), in 1983 the average predicted probability was .46 for seniors and .37 for non-seniors. By 2012, in the Harris poll the average probability was .54 for seniors and non-seniors. Seniors are now as predisposed as non-seniors to give higher grades to their local schools.
Having a high income is statistically significant in 2001 and 2012 (Russell), and having a college degree is statistically significant in 1992 and 2012 (Russell). Respondents with more income and better education may be able to locate themselves and their families in communities with better local schools. There does not seem to be a change across time in the propensities of respondents with higher socio-economic status to give positive evaluations. Party identification can capture ideological preferences as well as level of engagement with politics and policies in general. Only in 1983 is party identification, for both parties, statistically significant and positive. Thereafter, party identification does not influence dispositions to give higher grades.
Finally, whether a respondent resides in an urban center matters in all of the surveys for which this variable is available. In general, city dwellers are significantly less likely to give higher grades to their local schools. Given that many urban school districts have been notorious for struggling in terms of educational outcomes, this result again confirms the linkage between educational performance and the public’s opinion on local schools. In addition, the measure of state-level graduation rate is statistically significant in the earlier surveys, 1983 and 1992.
Overall, though positive evaluations for local schools have increased across the years, not all societal groups ramped up their favorable dispositions in comparable ways. In particular, the opinions of minorities or non-Whites, individuals with children, and seniors display differences from previous instances. Non-Whites are now as positive (Harris survey), if not more positive (Russell survey), toward local schools than White respondents. Individuals with children have always been more favorably disposed to their local schools than individuals without children, but the differences have now increased. Older individuals are now as likely as non-seniors to give positive evaluations. 16
Is the Story (Causal Mechanism) Right?
One key expectation examined in this project is that changes in educational performance across the last decades translated into changes in the approval of local schools. In this section, a preliminary examination of this linkage at the respondent level is carried out by re-examining the prediction of positive evaluations of local public schools, but now adding an extra measure of perceived improvements by the respondent. More specifically, the data are from the online Russell survey carried out in 2012. In this survey, respondents were asked not only to grade their local schools but also whether they thought their local schools had gotten better in the last 5 years. 17 In that sample, 15% of respondents stated that local schools have improved in recent times, 43% stated that they have remained the same, and 27% stated that they have gotten worse (14% did not know/refused). The first model in Table 3 presents the results from a probit model predicting positive evaluations, as in Table 2, but now adding the measures Got Better and Got Worse that flag, respectively, whether they thought local schools had improved or worsened in recent times.
Probit Models Predicting Positive Evaluations (“A” and “B” Grades) and Perceived Improvement of Local Public Schools in 2012.
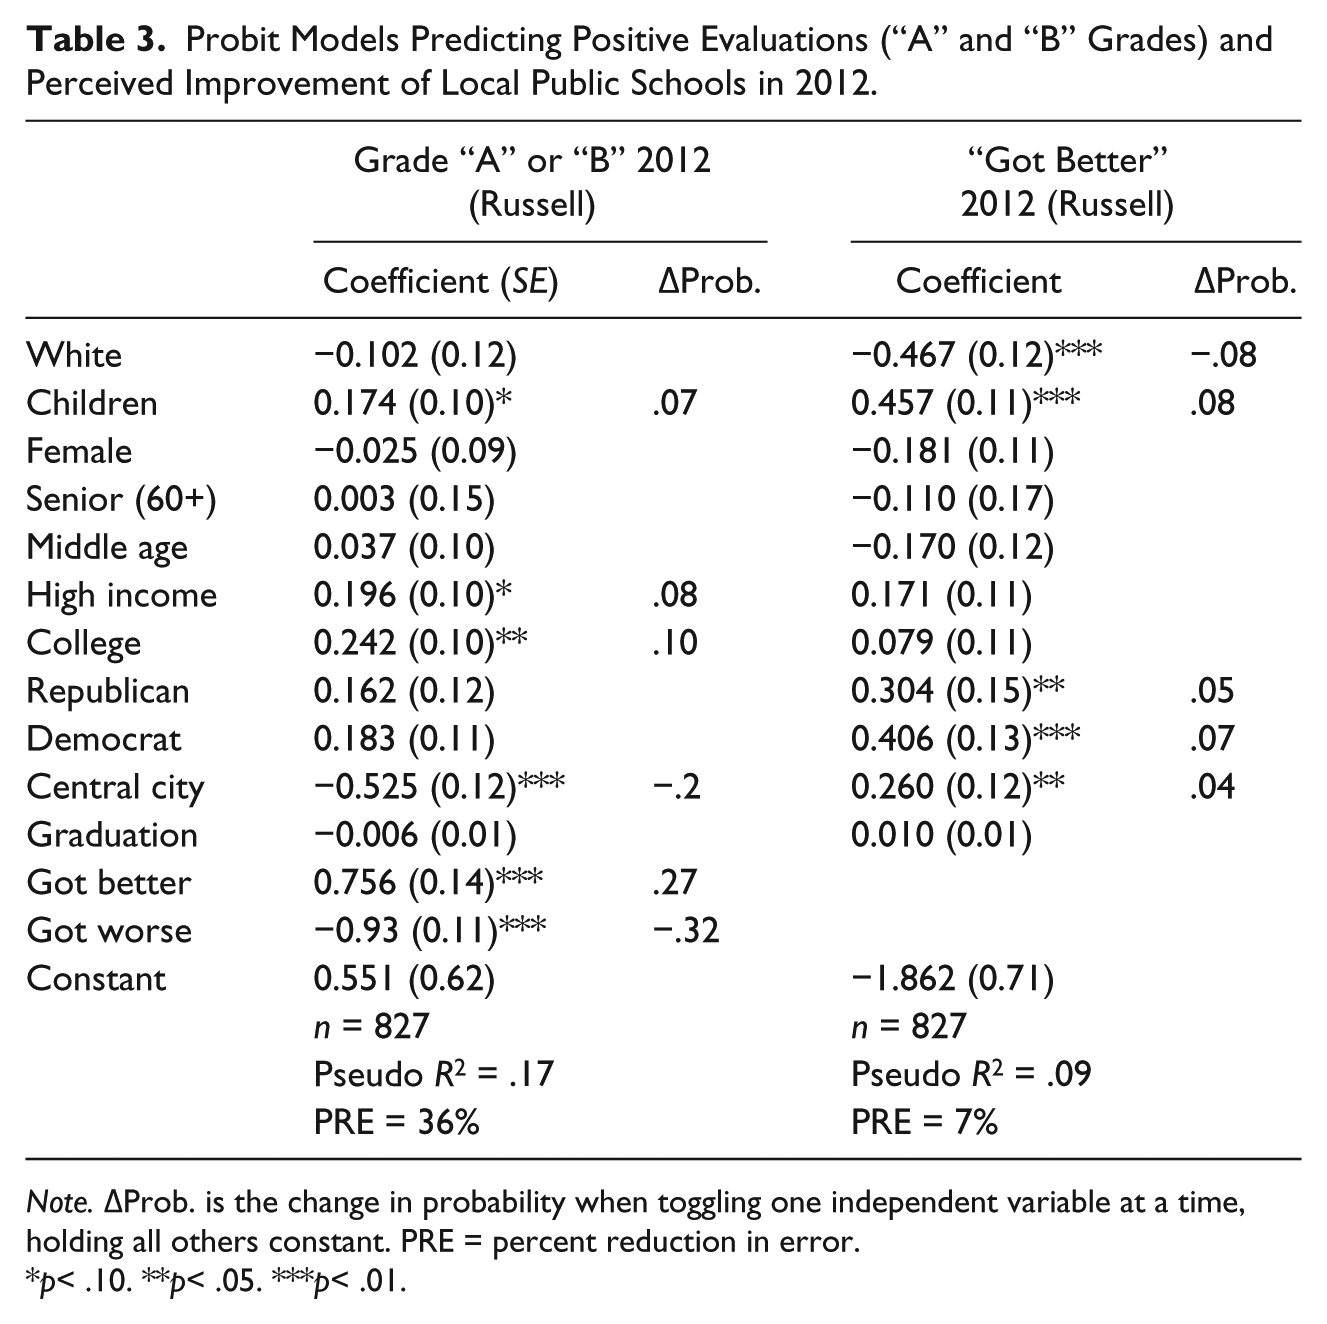
Note. ΔProb. is the change in probability when toggling one independent variable at a time, holding all others constant. PRE = percent reduction in error.
p< .10. **p< .05. ***p< .01.
As seen in Table 3, there is a statistically significant and substantial relationship between having perceived recent changes in local schools and the assessment of such schools. Those who believe that schools have recently improved are 0.27 points more likely to give high grades whereas those who think that they got worse are 0.32 points less likely to give such an assessment. In addition, the general predictive power of the model is as expected now higher than in the models in Table 2. This exploration suggests that citizens provide overall assessments that are indeed linked to their perceptions of trends in their local schools.
The second model in Table 3 examines in a probit specification who among respondents thought local schools have improved in the last 5 years. The results indicate that White respondents are less likely to have found recent improvements, whereas those with children, with a party identification, and city dwellers are more likely to have found recent improvements with their local schools. These results resonate with those from the previous section in that non-Whites and those with children can be differentiated from the general public in terms of their positive and improved assessment of local schools. It is quite notable that city dwellers are also finding improvements in their local schools.
The fact that both knowledge and personal experiences may have played a significant role in shaping the evolution of public evaluations is further suggested by follow-up questions that PDK/Gallup pursued in its 2011 survey. Specifically, respondents were asked to volunteer an explanation (open-ended) for the discrepancy between more positive evaluations of local schools and more negative evaluations of schools in the nation as a whole. The result: “Americans overwhelmingly said they based the grade of their local schools on their knowledge about the immediate community and the local schools, and their pride in their community” (PDK/Gallup, 2011, p. 18). In fact, in explaining a higher grade for local schools, 44% of respondents said that it was due to familiarity with local schools, 17% said that it was due to pride in the community, whereas only 7% said that it was the result of negative media portrayals.
Limitations
The literature on public opinion in education has many open areas for further examination and is still evolving. Certain aspects of the present study may also be considered as subject for additional exploration. In general, the focus on the public’s assessment of local schools was undertaken with the expectation that local evaluations are in part shaped by knowledge of and/or experience with local schools. Although the 2011 PDK/Gallup survey described above suggests that familiarity may have been critical in shaping local assessments, some caution must be taken in the interpretation of the aggregate trend analyses that operationalize this assumption.
First of all, the objective education performance measures used in the aggregate trend analyses, SAT scores, and high school completion rates are clearly by aggregation reflecting in some way local circumstances; however, they are not aggregating the objective performance of each respondent’s local schools. 18 One area for more work then involves the systematic collection of school district identifiers for respondents, which is hardly the norm in survey research, but is much needed for research in public opinion on education.
Next, an implied assumption in this study was that citizens can be aware of SAT scores and high school completion rates as metrics of education. This may need some qualifications. These metrics have been mentioned in past SOTU presidential addresses (e.g., 1984, 1999, and 2008), are discussed in the media, and are likely to be across time correlated with aggregates of other performance measures. Nevertheless, respondents may be more aware of state-based assessments, and more increasingly so in recent times. This is a promising line of future research that could seek to tease out more carefully what metrics of education performance citizens are aware of and how these relate to their assessments.
Finally, though general trends of discontent with public institutions may have driven the long-term declining trends on national assessments of schools, evolving views on education may also have contributed to the recent improved assessments of local schools, as discussed in the background section. There is a long survey tradition tracking the problems in education and the assessment of education (in particular, of schools). But there are no quite comparable nor plentiful, long-term, measures on the goals of education. A promising line of research might seek to uncover, for example, how accountability and choice, the two tenets of the market-based reforms of recent decades, have shaped the public’s views and assessments of schools.
Conclusion
The first objective of this study was to understand what influences the opinion trends on local public schools, placing a particular emphasis on educational performance as an explanatory factor. The findings are consistent with changes in educational performance being associated with improved evaluations. This was conjectured in previous research but never statistically shown. Presidential statements, in particular positive/neutral pronouncements on education given during SOTU addresses, were also found to influence evaluations of local schools. Given that SOTU speeches mainly emphasize past accomplishments and prospective actions, that is, all good news, this would suggest that citizens are responding both to real and perceived messages of educational improvements.
The second objective of this study was to understand whether opinions of local schools evolved differentially across social groups. The evidence suggests that only selected groups displayed differences. This seems reasonable if indeed actual conditions of the local schools are key drivers of opinions. Two personal dimensions seem to have been distinctive in terms of improvements: having children and being a minority (non-White). The fact that minorities may be now more satisfied with their local schools is ground for more investigation and future research. According to some educational statistics, such as NAEP test scores, African Americans and Hispanics have experienced larger gains than Whites in the last 30 years (IES, 2009). Minority respondents may then be reacting to educational improvements experienced by their children at their local schools though they may also be responding to other concurrent educational processes, such as the increase in charter schools, and the messages of across-the-board accountability from No Child Left Behind.
In general, the implications of the study are preliminarily encouraging. If schools improve academically, citizens might respond with better evaluations. Those closest to the educational institutions (e.g., parents) may be in a better position to assess them, and they tend to do so more favorably. Moreover, those who may have experienced some of the larger recent gains (e.g., minorities) are now also more likely to give positive evaluations to their local schools. These should be, with caution, promising results for those involved in the administering of and teaching in schools.
These results are also in line with how the opinion trends on the top problems facing local schools have evolved. Between 1970 and 1995, lack of discipline/control and drugs in the schools were the top concerns among the public (PDK/Gallup, 2010). In stark contrast, throughout the last decade school funding has consistently and by a large margin been identified by the public as the top problem faced by the schools in their community (PDK/Gallup, 2010). If the public now views funding, arguably a more external problem compared with discipline, as the top concern, this may also have contributed to the recent improved ratings of local schools.
Public institutions in the United States have suffered from long-term trends of negative assessments, some of them stemming from the 1970s era of disenchantment. Schools were no exception to that discontent, but in contrast to other public institutions, they have, slowly, improved their ratings when respondents are asked to evaluate them locally. Under the radar, these opinions trends have displayed “healthy” levels of responsiveness to the conditions of education.
Footnotes
Declaration of Conflicting Interests
The author declared no potential conflicts of interest with respect to the research, authorship, and/or publication of this article.
Funding
The author received no financial support for the research, authorship, and/or publication of this article.