
Abstract
Desegregated schools are linked to educational and social advantages whereas myriad harms are connected to segregated schools, yet the emphasis on school desegregation has recently receded in two North Carolina city-suburban school districts historically touted for their far-reaching efforts: Charlotte and Raleigh. In this article, we use cross-case analysis to explore segregation outcomes associated with policy changes by analyzing enrollment and segregation trends from 1989 to 2010 in metro Charlotte and metro Raleigh. Both Charlotte-Mecklenburg and Wake County school systems are experiencing a growing share of intensely segregated schools, decreasing exposure of Black and Latino students to White students, disproportionately large exposure of Black and Latino students to poor students, and an increase in segregated charters. Segregation in the districts surrounding Charlotte-Mecklenburg and Wake County is less extreme. An understanding of how policies have contributed to segregation patterns in both metros informs future education reform efforts.
Over the past 30 years, a host of different forces has shaped and reshaped an enduring struggle for equal educational opportunities in U.S. schools. These forces include the dramatic demographic transformation of the nation’s metro areas and their school enrollments (Frey, 2014; National Center for Education Statistics [NCES], 2015), judicial and political retrenchment on race-conscious policies (Chemerinsky, 2005; McDermott, Frankenberg, & Diem, 2015), and a shifting education policy paradigm (Mehta, 2013) emphasizing accountability and competition over equity and access (Petrovich & Wells, 2005). With the educational and life outcomes of future generations of students on the line (see, for example, Linn & Welner, 2007; Mickelson & Nkomo, 2012), understanding how those forces relate to patterns of school segregation becomes increasingly critical.
Drawing on the cases of Charlotte and Raleigh, two North Carolina metro areas once nationally lauded for their comprehensive, city-suburban approach to school desegregation (Mickelson, Smith, & Nelson, 2015; Parcel & Taylor, 2015), we use multiple measures to explore patterns of metropolitan school segregation during an era of substantial diversification and exurban growth, increasing preoccupation with market-based school choice, and political and legal backsliding on the principles of Brown v. Board of Education (1954). In doing so, we offer a unique window into the complex dynamics of segregation in two rapidly changing contexts—contexts that once represented a best case scenario for desegregation and that now have, as we will show, regressed. As both of these metros—among others (McDermott, DeBray, & Frankenberg, 2012; Siegel-Hawley & Frankenberg, 2011)—continue to debate the merits of student assignment policies to promote diversity, we argue that lessons for the future can, in many ways, be found in their groundbreaking pasts.
We begin with an overview of the effects of school desegregation, the legal history of desegregation, changes in and impacts of metropolitan desegregation efforts, shifting priorities in student assignment policy, and the expansion of school choice developments. Next, we trace the historical trajectory of desegregation policy in Charlotte and Raleigh. We link those different policy developments to enrollment and segregation patterns at the district and metropolitan level in Charlotte and Raleigh, in addition to identifying key differences based on school type (i.e., traditional, magnet, and charter). We conclude with implications for future research and policy.
Literature Review
Decades of social science research highlights the benefits of desegregated schools and the harms of segregated ones. Studies have also concluded that the most effective way to desegregate is to do so on a metropolitan-wide basis, rather than limit efforts to central cities. Despite the evidence, beginning in the mid-1970s, legal barriers have limited the tools available for achieving any kind of school desegregation—let alone metropolitan desegregation. And, even in places that did implement city-suburban desegregation, recent rapid exurban development has changed the landscape for metropolitan desegregation efforts across the country, including in Wake County and Charlotte-Mecklenburg, both of which are county-wide school districts. Furthermore, recent student assignment policies, with a renewed emphasis on proximity and choice and a decreased emphasis on diversity, often exacerbate segregation patterns. The expansion of alternative forms of choice outside of traditional public schools additionally complicates matters.
Effects of School Segregation
Benefits of desegregated schools
A synthesis of research on the cognitive impact of racially desegregated schools reveals three main findings (Hawley, 2007). First, Black and Latino students, on average, learn more in schools that are majority White (and higher socioeconomic status) than they do in schools that are predominantly non-White (and lower socioeconomic status; Borman et al., 2004; Kain & O’Brien, 2002). Second, the earlier that students experience desegregated learning environments, the greater the positive impacts on academic success for the students (Mickelson, 2005). Third, there is no negative academic effect of desegregated experiences on White student achievement (Crain & Mahard, 1983).
Based on intergroup contact theory, and more than 500 confirming studies, another benefit of desegregated schools is that increased contact that is well structured and positive can impact all groups by reducing prejudice, negative attitudes, and stereotypes; intergroup contact can also lead to increases in friendships among members of different groups (Pettigrew & Tropp, 2006). In the long term, attending schools that are racially desegregated has a perpetuating effect. Perpetuation theory posits that segregation repeats itself across different stages of life such that when individuals have early and sustained experiences in desegregated schools, they are more likely to live and work in desegregated environments later in adulthood (Braddock & McPartland, 1989; Wells & Crain, 1994).
Harms of segregated schools
Conversely, segregated, predominantly non-White schools tend to be schools with high levels of poverty that are systematically linked to unequal educational opportunities and outcomes (Orfield & Lee, 2005). As early as 1966, research from the Coleman report found that the socioeconomic background of students in a school is more highly correlated with student achievement than any other school characteristic (Coleman, 1966).
Students who attend minority segregated schools have access to more limited and insufficient resources. There are fewer experienced and less qualified teachers (Clotfelter, Ladd, & Vigdor, 2005; Jackson, 2009). There is also less stability in minority segregated schools. The teachers who work in minority segregated schools often do not remain there for long, resulting in high levels of teacher turnover (Clotfelter, Ladd, & Vigdor, 2010), and there is more mobility in the student enrollment (Rumberger, 2003). The facilities and learning materials in minority segregated schools are often inadequate; there also tend to be limited and less advanced curricular options (Yun & Moreno, 2006). All these inequalities result in limited opportunities for students. Consequently, academic outcomes are worse in segregated schools than in desegregated schools. Students who attend minority segregated schools have lower academic performance (Mickelson, Bottia, & Lambert, 2013; Mickelson & Heath, 1999) and are more likely to drop out before completing high school (Balfanz & Legters, 2004; Swanson, 2004).
Despite the recognized benefits of desegregated schools and harms of segregated schools, the legal context in which schools exist has not been conducive to creating and maintaining racially desegregated schools in recent years.
Evolution of the Law
Supporting desegregation efforts
In 1954, the Supreme Court’s ruling in Brown v. Board of Education struck down Plessy v. Ferguson (1896) by declaring segregation unconstitutional and stating that “separate educational facilities are inherently unequal.” For about a decade, many schools delayed desegregation efforts and instead implemented token forms of integration. When President Johnson signed the 1964 Civil Rights Act into law, it took only 5 years for the South, which had been the most segregated area in the country, to become the most desegregated region (Orfield, 2000). For many Southern schools, which received large amounts of aid tied to low-income populations under Title I of the Elementary and Secondary Education Act, the threat of losing this funding under Title VI of the Civil Rights Act was enough to make them begin the process of desegregation. For about 6 years, courts continued to rule in ways that facilitated more expansive and successful school desegregation. The 1971 Swann v. Charlotte-Mecklenburg Board of Education decision, based out of Charlotte, required that districts desegregate their schools to the greatest extent possible and approved busing as a tool for doing so.
Limiting desegregation efforts
In the mid-1970s, however, a shift occurred that began to limit the extent to which desegregation could and would occur. The 1974 Milliken v. Bradley decision made metropolitan-wide desegregation more difficult to achieve because it required plaintiffs to show that individual suburbs were guilty of intentional discrimination, thus limiting the ability of predominantly minority central-city school districts to achieve desegregation by crossing district lines to include the predominantly White suburbs. During the 1990s, Supreme Court decisions continued to dismantle desegregation efforts. Three cases between 1991 and 1995 determined that once a district achieved unitary status, the district was no longer obligated to maintain desegregation (Board of Education of Oklahoma v. Dowell, 1991), districts could be partially released from desegregation responsibilities even if full desegregation, as specified in Green v. County School Board of New Kent County, had not been achieved (Freeman v. Pitts, 1992), and equalization remedies should be limited in time and extent because rapid restoration of local control was the primary goal in desegregation cases (Missouri v. Jenkins, 1995). In 1999, the Fourth Circuit Court of Appeals, which has jurisdiction over North Carolina, issued two decisions that restricted the use of race in student assignment policies (Eisenberg v. Montgomery County Public Schools; Tuttle v. Arlington County School Board). Although districts in North Carolina had not yet come under scrutiny for race-based student assignment policies, these two decisions prompted school districts, including Wake County, which was well known for its assignment policy that prioritized racial diversity, to change their policies so that they no longer considered race as a factor. The 1999 declaration of Charlotte-Mecklenburg Schools as unitary also likely influenced Wake County’s shifting student assignment plan (Capacchione et al. v. Charlotte-Mecklenburg Board of Education, 1999). Most recently, in the 2007 Parents Involved in Community Schools v. Seattle decision, the Supreme Court declared that voluntary race-based student assignment policies in Seattle and Louisville were unconstitutional and that school districts could no longer solely consider the race of individual students when making school assignment decisions.
Metropolitan Desegregation
Although Milliken prevented school districts in many areas from pursuing city-suburban desegregation, some districts, particularly those located in the South, consolidated city and suburban districts to form metropolitan-wide school districts, which have benefits for desegregation (Orfield, 2001). The metropolitan-wide, or county-wide, structure is more common in states that were historically rural because county legal structures were better suited for the less urban, agricultural economy; whereas, in the more urban and industrialized states in the Northeast and Midwest, new municipalities continuously grew in metropolitan areas and urban and town legal structures were more common (Orfield, 2015). Of interest with regard to the following study, in North Carolina, state policies incentivized the consolidation of city and suburban districts into systems that would serve all, or much, of a metropolitan area (Flinspach & Banks, 2005). The North Carolina state government did not propose consolidation for desegregation purposes; instead, these metropolitan-wide districts were believed to be more efficient and more effective in providing strong educational programs (Orfield, 2001). Although not the primary purpose for consolidating districts in many cases, this organizational structure often ensured that county-wide districts were more diverse than they would have been if there had been separate city and county districts, making desegregation efforts more feasible. It also meant that when desegregation efforts were underway, it was more difficult for White families to flee the desegregating schools to attend other nearby schools because all public schools were part of the same district and all were participating in desegregation (Orfield, 2001; U.S. Commission on Civil Rights, 1977).
When metropolitan areas are fragmented with multiple separate school districts, school segregation patterns between urban and suburban districts often differ, with more students of color attending intensely segregated schools in urban districts than in suburban districts (Orfield & Frankenberg, 2008). A recent case study of Birmingham, Alabama, found that the growing number of separate school districts in the metropolitan area had the same stratifying effect as earlier laws that mandated racial segregation (Frankenberg, 2009). However, when school districts cover entire metropolitan areas, they are associated with stably desegregated schools (Orfield, 2001). But although consolidated city-suburban districts provide more potential for desegregation to occur, the absence of district boundary lines is not enough to guarantee desegregation; districts must also implement comprehensive and cohesive desegregation plans (Siegel-Hawley, 2014).
It is not yet clear how the relatively recent and rapid growth in exurban communities impacts the ability of metropolitan school districts to maintain racially diverse schools. Since the 1990s, growth in exurban areas has exceeded that of urban and suburban areas (Berube, Singer, Wilson, & Frey, 2006). Between 2000 and 2010, the total U.S. population grew 10% whereas the exurban population increased by more than 60% (Gardner & Marlay, 2012). This phenomenon is particularly important in the South, as the largest portion of exurban population (47% in 2005) is in the South (Berube et al., 2006). Between 2000 and 2010, in Raleigh the annual percentage change in the exurban population was 5.9% whereas the annual population growth in the metro was only 3.6%; in Charlotte, the difference in growth between the exurbs and the metro was even greater, with an annual percentage change of 6.2% in the exurban population and only 2.8% in the metro (Gardner & Marlay, 2012). For a brief period following the recession, between 2009 and 2013, growth in urban areas outpaced that of exurban areas; however, this trend has recently been reversed with exurbs again growing faster than urban cores (Frey, 2015). This metropolitan development is an important consideration for the racial diversity of schools because the average resident in an exurban community is White and middle class (Berube et al., 2006). Racialized movement between the cities, suburbs, and now exurbs has widened the scale of contemporary school segregation and may in turn call for broader perspectives on how best to ameliorate segregation.
Contemporary Student Assignment Policies and School Choice
Over the last two decades, more than 200 school districts have been declared unitary and released from court-ordered school desegregation plans; racial segregation in these districts has gradually increased since their release from mandatory desegregation (Reardon, Grewal, Kalogrides, & Greenberg, 2012). In the absence of court oversight, school districts have the opportunity to and responsibility for designing student assignment policies that are reflective of the interests and desires of the local residents and policy makers. In doing so, school districts’ student assignment policies often reflect the competing values of diversity, proximity, and choice. In many cases, school districts are now placing great importance on proximity (Holley-Walker, 2010), and the rapid growth in charter schools over the last 25 years underscores the importance placed on choice (Wohlstetter, Smith, & Farrell, 2013).
Diversity
In response to legal rollbacks and restrictions, school districts across the nation are reconceptualizing diversity and changing their student assignment policies accordingly (Siegel-Hawley & Frankenberg, 2011). Despite the Court’s restrictions on using an individual student’s race for making school assignments, there are ways in which school districts can continue to implement race-conscious student assignment plans within these constraints. Using various characteristics, such as income, educational attainment, and share of students of color in the neighborhood where the student resides, some school districts, such as Berkeley, California, have developed multifactor, race-conscious student assignment policies that are successful in creating diverse schools while abiding by current legal restrictions (Frankenberg, 2013a). An analysis of the potential effectiveness of this type of multifactor student assignment plan in the 10 largest metropolitan districts in the country found that neighborhood diversity indices are, in fact, relatively accurate proxies for race and have the potential to increase school racial diversity (Richards, Stroub, Vasquez Heilig, & Volonnino, 2013). This legally viable alternative could be effective in achieving meaningful desegregation across the nation, particularly in large, racially diverse school districts.
Taking a different approach, instead of attempting to achieve racial diversity, other districts have shifted to trying to achieve socioeconomic diversity in their schools. For example, Wake County, North Carolina, implemented a race-neutral, class-based student assignment plan that also sought to balance academic achievement levels (Grant, 2011). A class-based student assignment plan can achieve racial diversity when race and class are highly correlated; however, in many cases racial desegregation will not be achieved from this approach (Reardon, Yun, & Kurlaender, 2006). Although there are still multiple ways in which school districts can create racially diverse schools, the decreased emphasis on diversity as a priority is often connected to heightened segregation (Orfield & Eaton, 1996).
Proximity
Many school districts assign students to schools based on students’ residential location and the proximity of the closest school. This type of plan is based on the idea that the neighborhood is a potential source of school improvement and school quality; neighborhood schools are intended to enhance the community attachment to a school, encourage the sharing of resources, and allow for increased parental involvement and social capital (Smrekar & Goldring, 2009). However, in the case of neighborhood schools, it is important to consider that school and neighborhood segregation are interrelated processes (Denton, 2001). Thus, geographically based school assignments that are made in residentially segregated areas will result in racially segregated schools. For example, after achieving unitary status in 1998, Nashville adopted a neighborhood school-based student assignment policy, which resulted in minority students being more likely to go to schools in impoverished communities that had more limited financial and human capital, fewer institutional assets, and higher crime rates (Goldring, Cohen-Vogel, Smrekar, & Taylor, 2006). By prioritizing proximity over diversity, this plan not only led to increased racial segregation but also failed to distribute the potential community benefits of neighborhood schools equally to all students, as minority students’ schools were in low-resource communities. More broadly, research demonstrates that the relationship between residential and school segregation grew stronger between 2000 and 2010 (Frankenberg, 2013b). As school districts prioritize proximity over diversity, they often create more segregated schools.
Choice
For decades, choice has been a central theme in education policy. Two competing theories of choice—the integration theory of choice and the market theory of choice—lead to very different outcomes for school segregation.
The integration theory of choice emerged from the civil rights era and focuses on regulated choice as a tool for pursuing equity and equality of opportunity (Cobb & Glass, 2009; Goldring & Smrekar, 2000; Orfield, 2013). This theory is based on the idea that social inequality underlies school inequality; therefore, rather than viewing choice as an end goal, the integration theory of choice uses a voluntary approach to achieve integration. It relies on providing highly attractive, innovative schooling options so that students ultimately choose to attend schools with more diverse groups of peers. Magnet schools, originally designed in the 1970s as the first policy option to combine school choice with the goal of achieving desegregation, were created based on the integration theory of choice. As a result, many magnet schools historically included civil rights protections, such as open enrollment, outreach efforts, and free transportation (Goldring & Smrekar, 2000). Today, magnet schools account for the largest set of schools of choice in the country. Although not all magnets remain focused on the pursuit of racial diversity (Frankenberg & Le, 2008), they continue to offer unique curricula and innovative teaching methods that can attract a diverse set of students from across traditional attendance zones (Siegel-Hawley & Frankenberg, 2013). Magnets that include diversity goals, conduct outreach to diverse communities, and provide free transportation are associated with higher levels of racial desegregation (Siegel-Hawley & Frankenberg, 2013).
In contrast, the market theory of choice has been the dominant theory in practice in the United States for the last three decades (Betts, 2005; Witte, 2000). The market theory of choice supports the deregulation and privatization of large bureaucratic systems and the introduction of competition, incentives, and consumer choice to improve education. This theory is based upon the premise that government’s involvement, or intrusion, into the daily operation of schools is a central problem because it prevents schools from being influenced by beneficial market forces—namely competition (Chubb & Moe, 1990). The market theory focuses on the individual and choice as its end goal. However, unregulated choice based on the market theory is associated with increased segregation (Fuller & Elmore, 1996; Saporito & Sohoni, 2006). For example, White and wealthy families avoid choosing schools with higher percentages of non-White and low-income students; these choices, which appear to be based on race and class, in fact, cannot be explained by any other school characteristics, such as test scores, safety, school appearance, or poverty rates (Saporito, 2003). That is, when wealthy, White families choose schools, consideration of the racial and socioeconomic makeup of a school often supersedes concern for other school characteristics (Holme, 2002).
Charter schools, which were developed in 1991 as autonomous public schools outside of the established public school system, grew out of the market theory of choice and are currently the most rapidly growing sector of schools of choice. Without civil rights standards, charter schools are often more segregated than comparable traditional public schools (Frankenberg, Siegel-Hawley, & Wang, 2011). Nationwide, charter schools enroll a disproportionate share of students of color except in the West and in North Carolina where their enrollment is disproportionately White; they also tend to limit access for special needs students, English learners, and free-and-reduced lunch-eligible students (Frankenberg & Siegel-Hawley, 2013).
Depending on the underlying purpose for creating a system of choice, choice-based student assignment policies can be used to achieve the goals of desegregation or to further stratify students based on their race, class, and/or language. Therefore, it is essential to be clear about which choice policies tend to further the goals of desegregation and under what conditions these goals can be achieved.
These key issues provide a basis for understanding the broad context in which states and school districts have been designing policies and addressing desegregation. This study examines two districts once renowned for metropolitan desegregation efforts as they go through an era of substantial exurban growth, increasing preoccupation with market-based school choice policy, and legal complexity and retrenchment on the principles of Brown. This study contributes to existing desegregation research by bringing together three important strands of research: the metropolitan-level examination of segregation, the shift toward race-neutral policymaking, and the analysis of choice, particularly charter, trends. This study extends earlier research comparing desegregation efforts and trends in Charlotte-Mecklenburg and Wake County. This study also begins to fill an important gap in the existing literature by describing how recent, rapid growth in exurban communities is related to segregation patterns in neighboring, city-suburban school districts. We now turn to a discussion of how these elements manifested themselves more specifically in the metropolitan areas of Charlotte and Raleigh.
History of Desegregation in Charlotte and Raleigh
Immediately following the landmark Brown decision, legislative leaders in many Southern states designed policies with the intent to obstruct school desegregation (Chemerinsky, 2005). Unlike leaders in other Southern states who employed overtly defiant tactics to oppose the federal government, North Carolina’s state and local politicians implemented a number of subtle strategies to delay school desegregation. These strategies resulted in a limited number of students attending desegregated schools in the state a decade after Brown, indicating that desegregation would be both gradual and complex. In 1965, only 1% of Black students attended desegregated schools in North Carolina (Chemerinsky, 2005). However, by the 1970s, North Carolina and the South witnessed considerable progress toward desegregation, in part due to pressure by the federal government (Orfield, 1978, 1983; Orfield & Montford, 1992).
For the state of North Carolina, consolidating city and suburban school districts, although not originally intended to address desegregation in all cases, facilitated the desegregation process because consolidation created a more diverse school district than would have existed if city and county schools were separate, a shared commitment to the school system between city and county residents, and a decreased likelihood of White flight. Furthermore, Charlotte-Mecklenburg and Wake County garnered national attention for utilizing innovative strategies that resulted in these school districts becoming models of successful desegregation for districts throughout the country to emulate. The next section highlights the paths that Charlotte-Mecklenburg and Wake County school districts embarked upon before reverting back to resegregated systems.
Charlotte
In an effort to ensure compliance with Brown, North Carolina passed the Pupil Assignment Act in 1955 and the Pearsall Plan in 1956. These two state legislative responses to the federal desegregation (a) transferred student assignment, enrollment, and transportation authority from the state board of education to the local boards and (b) made the procedure for appealing a school board’s decision as complicated as possible to stall desegregation (Hawkins & McDowell, 2008). As statewide legislators passed “token” desegregation policies, so too did school board officials within the Charlotte metropolitan area.
The Charlotte and Mecklenburg County school boards were complicit in delaying desegregation by adopting freedom-of-choice plans that allowed a limited number of Black students to transfer to formerly all-White schools, which provided the appearance of cooperation to avoid unwanted judicial oversight (Douglas, 1995). This tactic resulted in only one Black student attending a White school in Charlotte in 1959, while the Mecklenburg County school board continually rejected every transfer request submitted by a Black student who wanted to attend an all-White school (Douglas, 1995).
In 1960, the Charlotte city schools merged with the Mecklenburg county school district, consolidating the two largest school systems in the state. The primary purpose of the merger was to support the expansion of the city of Charlotte but to do so without financially damaging the county schools. As had been the case in other parts of North Carolina since the late 1940s, civic leaders pushed to consolidate the city and county schools in an effort to improve the rural schools, while also improving administrative, financial, and educational efficiency (Douglas, 1995; Smith, 2004). The voters decided to create Charlotte-Mecklenburg Schools, which became, and still is, one of the largest school districts in the country. Largely due to the increased size of the new city-suburban school district, one unintended consequence of the merger was the ability to limit White flight of families attempting to avoid desegregation (Douglas, 1995).
In 1965, Vera and Darius Swann filed a lawsuit against the district for not allowing their Black son to attend the all-White school, which was closest to their home. Six years later, in 1971, the Supreme Court upheld Judge McMillan’s district court ruling in Swann v. Charlotte-Mecklenburg Schools, and busing became a tool for desegregation employed by school districts across the nation. By the mid-1970s, busing became mandatory in the district to support a student assignment plan that included (a) geographic zones to maximize racial diversity, (b) busing Black students from urban neighborhoods to the predominantly White suburbs for kindergarten through third grade followed by busing White children from the same school to the predominantly Black urban schools for fourth through sixth grades, (c) satellite assignment of Black students at predominantly White schools for the duration of their elementary schooling in cases where pairing was unsuccessful in achieving diverse schools, and (d) the creation of five magnet schools to draw a diverse group of students from across the district (Morantz, 1996). By utilizing transportation alongside magnet schools, the district was able to successfully achieve desegregation, and from 1969 to 2002, at some stage in their education, Charlotte-Mecklenburg students attended a racially desegregated school (Mickelson, 2001).
Despite the desegregation success, the political stance on education began to shift at the federal level and trickled down to the state and local levels. During the 1980s, efforts to continue desegregation waned as priority shifted toward a focus of equalizing schools by applying test-based accountability methods (The National Commission on Excellence in Education, 1983). By the 1990s, as the city of Charlotte experienced population growth, support for mandatory busing as a tool to maintain desegregated schools diminished. Many White families who moved into the area were not only disconnected from the desegregation history of the city but also moved to areas that were further away from the city center where many Black families resided (Mickelson, Smith, & Southworth, 2009; Morantz, 1996). These families were less likely to go along with the inconveniences (i.e., busing) required to sustain desegregation. Furthermore, there was concern that the district was not meeting high academic standards, which some saw as a consequence of the desegregation system (Mickelson et al., 2015). Finally, there was a belief that Black students were at a disadvantage due to the burden of taking long bus rides at the elementary level (Morantz, 1996). All these factors culminated into a shift away from mandatory busing for the purposes of desegregation to a desegregation plan based on choice. In 1992, Superintendent Murphy’s new plan included specialized magnet schools, midpoint schools—those located between Black and White residential areas—and neighborhood schools in areas that were racially balanced. The magnet schools served a student body that was representative of the demographics of the district, which at the time was nearly 40% Black and 60% White. Following the implementation of the plan, schools that converted into magnet schools remained racially balanced, yet the number of racially imbalanced schools across the district increased (Morantz, 1996).
At the national level, Supreme Court decisions in the early 1990s were unsupportive, even hostile, to desegregation efforts by absolving districts of desegregation responsibilities once they were declared unitary (Board of Education of Oklahoma v. Dowell, 1991), allowing for partial release from desegregation efforts without having achieved full desegregation (Freeman v. Pitts, 1992), and limiting the time and extent of equalization remedies (Missouri v. Jenkins, 1995). Within this national context, in 1997, William Capacchione sued the district, claiming that his daughter was denied admittance into a magnet program because she was not Black. A year later, six other White parents joined the suit and successfully challenged the use of race in upholding desegregated schools in Charlotte-Mecklenburg Schools. In addressing the Capacchione et al. v. Charlotte-Mecklenburg Board of Education case, U.S. District Court Judge Robert Potter reactivated the Swann case. Charlotte-Mecklenburg fought to remain under court-ordered supervision; however, in 1999, Judge Potter declared the district unitary and issued an injunction against the use of race in Charlotte-Mecklenburg’s student assignment plan. Thus, the district was tasked with developing a new student assignment plan (Mickelson et al., 2009).
In 2002, following the Supreme Court’s mandate to revise the district’s student assignment policy, Charlotte-Mecklenburg implemented the Family Choice Plan. This student assignment plan guaranteed students’ attendance at their neighborhood school, allowed for choice among magnet schools, and provided transfer options for poor-performing or low-income students at schools with high concentrations of similar students (Mickelson et al., 2009). Admission to the district’s magnet schools was determined through a race-neutral lottery system (Mickelson et al., 2009). Given that the plan primarily relied on neighborhood schools—which were often embedded in segregated residential areas—the board also adopted the Equity Plan. According to the Equity Plan, high-poverty, low-performing schools would not only receive extra funding for renovations, learning materials, and supplies, but they would also be guaranteed a lower teacher-to-student ratio, salary supplements for teachers, and tuition for teachers pursuing advanced degrees (Mickelson et al., 2009).
Despite the name of the new student assignment policy—“Family Choice Plan”—parents were limited in their ability to choose to enroll their children into high-performing schools for a number of reasons. First, a limited number of seats was available in high-performing schools because of the growth of the suburbs, which limited the number of transfers available to students from the central-city schools. Second, parents lacked the information necessary to make informed choices. Furthermore, the Family Choice Plan did not address the inequitable opportunities available to students based on their socioeconomic status. Therefore, students living in segregated non-White neighborhoods who could not transfer to a high-performing school were relegated to segregated schools of concentrated poverty, whereas the default in many Whiter neighborhoods was a middle-class school. In recognition of the limited choices available, the Family Choice Plan was renamed the Student Assignment Plan in 2004 (Mickelson et al., 2009).
Over the last decade,Charlotte-Mecklenburg’s student assignment policy has consistently emphasized neighborhood schools, magnet options, and stability. In 2006, the district altered its vision statement and began using the wording, “provides all students the best education available anywhere.” In doing so, Charlotte-Mecklenburg eliminated the previous reference to the district’s commitment to desegregation and again signaled its move away from prioritizing diversity (Mickelson et al., 2009). Charlotte-Mecklenburg, which was once a national symbol for successful school desegregation, has resegregated rapidly following the declaration of its unitary status more than a decade ago and efforts to implement student assignment policies that emphasize diversity have largely disappeared.
Raleigh
The statewide “token desegregation” response immediately following the Brown decision manifested in the Raleigh metropolitan area in ways similar to those in the Charlotte metro. A decade after the federal mandate to desegregate schools, only 70 of Raleigh’s approximately 5,800 Black students and just seven of nearly 7,700 in the Wake county schools were enrolled in predominantly White schools (Parcel, Hendrix, & Taylor, 2015). In the midst of talks dealing with the merger of the two school systems, both Raleigh and Wake began facing pressure at the federal and state level to escalate desegregation efforts. In 1968, in Green v. County Board of New Kent County, the Supreme Court ruled that districts had to eliminate identifiably White and Black schools. This ruling, along with the threat that federal funds would be cut off to non-compliant school districts, propelled the Raleigh and Wake County schools to begin revising their student assignment plans.
In 1971, a federal district judge, Judge John Larkins, Jr., rejected a Raleigh assignment plan to desegregate the city’s schools. Following the ruling, the U.S. Department of Health, Education, and Welfare notified the Raleigh school system that due to its “foot dragging” on desegregation, the district was ineligible for nearly $1 million in funding (Mickelson et al., 2015).
Under federal and state pressure, the Raleigh school board began to consider other options for desegregation; however, by the 1970s, White flight from the city of Raleigh created a demographic challenge for desegregation. Thus, officials turned to the idea of a city–county merger (Flinspach & Banks, 2005). The merger drew great support from Raleigh’s business elites who believed that a high-quality, desegregated school district could help prevent further decline in the city’s downtown area (Benjamin, 2012; Flinspach & Banks, 2005). Since the 1920s, Raleigh’s schools and neighborhoods had been spatially segregated with White schools in the northwest section of the city and Black schools in the southeast. As poor Black communities in the southeast quadrant of the city began to encroach upon the valuable property near the Capital Square, Raleigh’s business elite became concerned that having a Blacker, poorer city school district surrounded by a Whiter, wealthier county district would further damage the economic vitality of the downtown. Thus, in spite of strong voter opposition to the city–county merger, officials and business elite appealed to the state legislature, which approved the merger (Benjamin, 2012). In 1976, the largely White county school district and the predominantly Black Raleigh City school district voluntarily merged to form one county-wide school system—Wake County Public School System (Flinspach & Banks, 2005).
The new Wake County school board, under the guidance of John Murphy, began operating magnet schools in low-income and Black neighborhoods (Parcel & Taylor, 2015). The magnet strategy was a deliberate plan to encourage White students to attend schools in the central city (Flinspach & Banks, 2005). In 1982, in an effort to pursue desegregation, Wake County converted 27 schools into new magnet schools; the effort was successful and one year later all 27 magnets were racially diverse and filled to capacity, many with waiting lists (Grant, 2011).
In addition to magnets, the consolidated system in Wake County implemented a 15% to 45% balancing policy mandating that Black enrollment in each school should not be below 15% or above 45%. The 15% to 45% policy was established in 1981 and lasted until the end of the 1990s. In 1999, only 21% of the county’s Black children attended a school in which a majority of students were of a minority race. Throughout the 1980s and 1990s, the business community supported the board of education’s integrative policies, primarily because these policies did not have an adverse effect on the economic growth of the county (Parcel et al., 2015).
As the federal courts began to retrench on desegregation (Board of Education of Oklahoma v. Dowell, 1991; Freeman v. Pitts, 1992; Missouri v. Jenkins, 1995), along with numerous urban school districts being granted unitary status, including nearby Charlotte-Mecklenburg, the Wake County school board designed a student assignment policy based on income rather than race. In 2000, the new student assignment policy stated that no school could have more than 40% of students receiving free or reduced priced lunch and that no more than 25% of the students could be performing below grade level (Siegel-Hawley, 2011). By removing the explicit goal of racial balance among the schools, Wake County was the first metropolitan school district to focus on economic balance (Silberman, 2002).
Throughout the late 1990s and early 2000s, Wake County’s population grew dramatically, particularly in the suburbs. To prevent overcrowding, the school board implemented a reassignment plan that transferred large numbers of students and also created year-round schools. Year-round schools initially reversed desegregation gains because these schools were typically comprised of White and affluent students (Parcel et al., 2015). Minority parents were reluctant to send their children to these schools because of the unusual schedules and the physical distance between the suburban schools and their homes (Parcel et al., 2015). Parental concerns arose that these policies were contributing to educational inequities in the district.
Racial diversity decreased in Wake County, partly because of the removal of race as an explicit criterion for student assignment and also due to the rapid population growth in the suburban and western part of the district during the 1990s (Silberman, 2002). Since that time, racial diversity in the district’s schools has decreased such that by 2006, approximately two of five schools in the district would not have been in compliance had the district continued to pursue its previous goals for racial diversity (Siegel-Hawley, 2011). Even with the recent decline in racial diversity, Grant (2011) maintains that focusing the student assignment policy on income instead of race has helped to preserve some racial desegregation and also aided in reducing the achievement gap.
Over the last half decade, the school board has been divided between continuing to pursue diversity goals and reverting back to a neighborhood-based focus. Proponents in favor of neighborhood schools argued that the long bus rides necessary to accomplish diversity goals were detrimental to students’ educational success. In addition, supporters of neighborhood schools asserted that neighborhood schools would encourage stronger ties between families and schools. Parcel and Taylor (2015) note that advocates of the diversity plan claimed that the neighborhood school efforts “were racially tinged and were designed to roll back years of progress” (p. 38). Other proponents of the diversity plan maintained that the “real issue” had less to do with the assignment and more to do with the type of student (i.e., minority and low income) in the various schools and neighborhoods. In 2010, a newly elected school board voted to end Wake County’s class-based diversity policy and adopted a controversial controlled choice plan. The plan allowed parents to rank their top five choices from a list of 10 elementary schools, five middle schools, and five high schools. Under the new policy, student assignments were based on the following criteria: whether or not a sibling attends the school, proximity to the school, school type desired (i.e., magnet, traditional, year-round calendar), and whether the school’s student achievement would be benefited by the child’s admittance. If needed, a lottery would be used to make the final decision. Currently a student’s home address determines the child’s corresponding school assignment, thus eliminating the element of choice.
North Carolina Charter Landscape
Alongside changes in desegregation policies during this 20-year time period, choice policies, namely charter schools, that were not focused on desegregation also developed across the state. Charter school legislation was adopted in North Carolina in 1996. At that time, the legislation specified that no more than 100 charter schools could be created and no more than five charter schools could be authorized in a single district during the same school year. In 2010, North Carolina received $400 million in funding from Race to the Top, which was based, in part, on the state’s guarantee to allow more charter schools. Thus, the cap on charters was lifted in 2011. In 2014-2015, Charlotte-Mecklenburg and Wake County had the most charter schools and the largest number of students attending charter schools in the state (North Carolina Department of Public Instruction, n.d.).
North Carolina’s charter legislation originally required proactive steps toward achieving racial diversity. Legislation stipulated that charter schools must comply with any existing desegregation orders for the school district and that within one year of opening, the charter school must “reasonably reflect” the racial and ethnic composition of the local school district or the “special population” within the local school district that the charter was seeking to serve. However, in 1998, a suit was filed that challenged these diversity provisions, and as a result, the North Carolina Board of Education agreed not to enforce the diversity requirements (Siegel-Hawley & Frankenberg, 2010-2011).
Initially, North Carolina’s charter schools served a disproportionately large share of Black students but more recently they have begun to enroll a disproportionately large share of White students (Ladd, Clotfelter, & Holbein, 2015). Since their inception in the state, charter schools have become increasingly racially imbalanced, such that by 2014, more than 70% of North Carolina’s charter schools were either predominantly White—enrolling 80% or more White students—or predominantly non-White—enrolling 80% or more students of color (Ladd et al., 2015). Although charter schools are currently a popular form of education reform, they often further stratify students.
Method
Our study explores segregation outcomes associated with policy changes in the two North Carolina metropolitan areas of Charlotte and Raleigh, using a multiple-case study design with cross-case analysis. A multiple-case study design allowed us to conduct an in-depth analysis of cases within their real-life context and is appropriate when exploring descriptive or explanatory questions (Yin, 2006). We selected Charlotte-Mecklenburg and Wake County for comparison because both school districts have a strong history of successful desegregation; however, each district has implemented different diversity-related student assignment policies over the last 20 years. By comparing these two cases, we are able to draw more general conclusions about the types of policies that are likely to result in either maintaining desegregation or spurring resegregation and the conditions under which these outcomes are likely to occur (Borman, Clarke, Cotner, & Lee, 2006).
In this study, we focus on the following research questions:
Data
The data in this study consisted of 1989-1990, 1999-2000, and 2010-2011 Common Core of Data (CCD), Public Elementary/Secondary School Universe Survey, and Local Education Agency data files from NCES. These time points capture important policy shifts in both districts. Between 1989 and 1999, both districts implemented controlled choice plans and magnet schools with strong racial diversity goals. Between 1999 and 2009, Charlotte-Mecklenburg was granted unitary status and experienced growth in charters and neighborhood schools whereas Wake County shifted away from racial diversity to a socioeconomic-based diversity plan and also embraced growth in the charter sector. Using these data, we explored demographic and segregation patterns for the largest (hereafter referred to as “main”) districts in each metropolitan area—Charlotte-Mecklenburg Schools in metro Charlotte and Wake County Public School System in metro Raleigh. In addition, we analyzed enrollment and segregation patterns for surrounding school systems (referred to as “non-main districts”) in each metropolitan area. Non-main districts include school districts that were part of the census-defined Core Based Statistical Area (CBSA) but were not the largest (i.e., Charlotte-Mecklenburg and Wake County); we also refer to these interchangeably as “non-CMS” and “non–Wake County” districts. 1 Analysis of trends in non-main districts adds to our understanding of enrollment and segregation trends at a broader metropolitan level because patterns outside of the central core of metropolitan areas can impact what is occurring within the core—particularly if exurban systems are growing rapidly. To compare changes over time, we used the 2013 CBSA definitions/boundaries defined by the Office of Management and Budget for each time period. The CBSA definition is what we are using when we refer to “metro Charlotte” and “metro Raleigh.”
We also explored patterns by school type (i.e., traditional, magnet, and charter) within each metropolitan area. Over the 20-year time period, the focus on school choice options has shifted from magnet schools to charter schools; thus, an analysis of enrollment and segregation patterns by school type adds nuance to our understanding of the overall patterns.
Analysis
To determine segregation trends, we calculated three different dimensions of school segregation over time: the concentration of students in segregated schools, typical exposure or contact with racial group members and low-income students, and evenness or even distribution of racial group members. For concentration, we computed the percent of Black and Latino students in intensely segregated schools—schools where 90% to 100% of students are minority. Although we recognize that there are differences in the experiences of Black and Latino students and also great variety within each racial/ethnic group, we combined Black and Latino students for our measure of concentration because traditionally both of these groups have been underserved and denied access to equal opportunities in schools (Carter & Welner, 2013; Gándara & Contreras, 2009; Howard, 2010; Noguera, 2003); thus, a student attending a school with a high concentration of Black students, a high concentration of Latino students, or a high concentration of both Black and Latino students would likely be attending a school with limited educational opportunities and outcomes, as described above.
To measure exposure or isolation rates, we explored the percentage of a certain group of students (e.g., Latino students) in school with a particular student (e.g., White student) in a larger geographical area, and computed the average of all these results. That score is a rough measure of the potential contact between these groups of students. Exposure of one group to other groups (e.g., White students to Black students) is called the index of exposure, whereas exposure of a group to itself (e.g., Black students to other Black students) is called the index of isolation. A measure of exposure might show that the typical White student in a particular district attended a school with 5% Latino students. If Latino students make up 15% of the district’s overall enrollment, then one would conclude that the schools attended by the typical White student served disproportionately fewer Latino students.
Finally, we explored the segregation dimension of evenness using Theil’s entropy index. Theil’s entropy index of segregation (H) measures the degree to which students of multiple groups are evenly distributed among schools. More specifically, the index measures the difference between the weighted average diversity (or racial composition) in schools to the diversity in the larger geographical area. Higher score values (up to 1) indicate that multiple racial groups are unevenly distributed across schools across a geographic area whereas lower values (closer to 0) reflect a more even distribution.
H has often been viewed superior to other evenness indices, as it is the only index that obeys the “principle of transfers” (the index declines when an individual of Group X moves from Unit A to Unit B, where the proportion of persons of Group X is higher in Unit A than in Unit B; Reardon & Firebaugh, 2002). In addition, H can be statistically decomposed into between-unit and within-unit components, allowing us, for example, to identify how much of the total segregation depends on the segregation between or within districts. A rough heuristic for interpreting score value includes above .25 indicating high segregation (above .40 is extreme), between .10 and .25 indicating moderate segregation, and a value below .10 indicating low segregation (Reardon & Yun, 2002-2003).
In combination, these three measures provide a nuanced understanding of the complex nature of school segregation (Orfield, Siegel-Hawley, & Kucsera, 2014). Concentration and exposure describe the student’s lived experience with segregation and measure progress on the legal and policy goals of desegregation. Evenness provides information about how randomly students are distributed across schools and can be helpful for developing feasible policy solutions. The measures of segregation—concentration, exposure, and evenness—describe what is occurring and are helpful for understanding the degree of segregation that exists in Charlotte and Raleigh. However, these measures are not causal and cannot be used to identify the causes of segregation.
Findings
We begin with an analysis of enrollment and segregation trends for the main and non-main districts in metro Charlotte and metro Raleigh. That is, we explore Charlotte-Mecklenburg and its surrounding districts within the Charlotte CBSA as well as Wake County and its surrounding districts within the Raleigh CBSA. We then explore similar trends by school type (i.e., traditional, magnet, and charter) for each of the metropolitan areas.
Total Schools
Enrollment
In Charlotte-Mecklenburg and Wake County, as well as in the non-main districts in both metropolitan areas, the number of schools as well as the total public school enrollment increased over the last two decades (Table 1). Interestingly, in both metro areas, between 1999 and 2010, enrollment growth in non-main districts outpaced that of the main districts. Enrollment increased by 43.2% in non-CMS districts compared with 35.4% in Charlotte-Mecklenburg whereas enrollment increased by 59.7% in non–Wake County districts and 51.5% in Wake County. Growth in the school systems surrounding Charlotte-Mecklenburg and Wake County is consistent with national trends of exurban growth (Berube et al., 2006; Frey, 2015). The number of districts also grew substantially; this growth is driven by the increasing number of charters, which are established as separate local educational agencies in North Carolina.
Public School Enrollment by District.
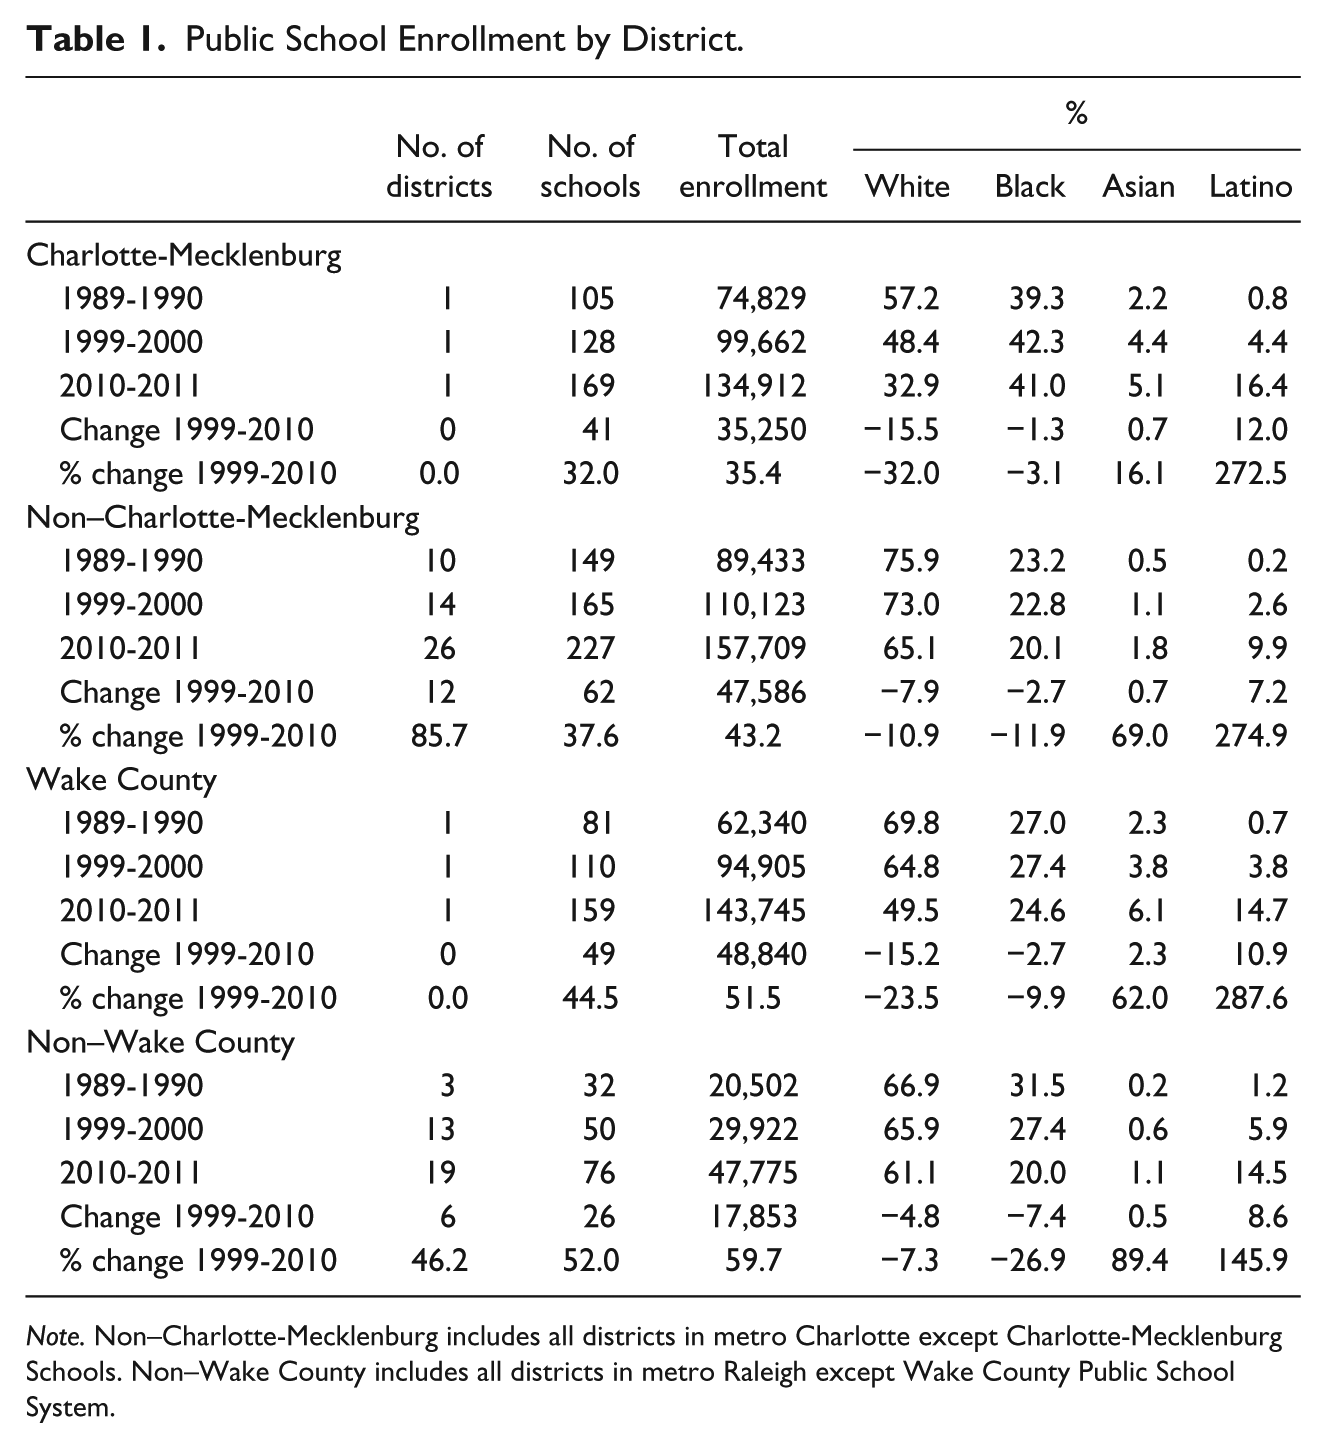
Note. Non–Charlotte-Mecklenburg includes all districts in metro Charlotte except Charlotte-Mecklenburg Schools. Non–Wake County includes all districts in metro Raleigh except Wake County Public School System.
Over the last two decades, the typical pattern for racial enrollment in the main and non-main districts reflected an increase in the Asian and Latino shares of enrollment alongside a decrease in the White and Black shares of enrollment (Figures 1 and 2). Although the patterns were similar in main and non-main districts, the degree to which the changes occurred differs. For example, the decrease in White enrollment was substantially greater in Charlotte-Mecklenburg and Wake County than in the non-main districts of the two metros, whereas the decrease in the Black share of enrollment was greater in the non-main districts. In fact, the Black share of enrollment increased slightly in Charlotte-Mecklenburg. In both metropolitan areas, the main districts—Charlotte-Mecklenburg and Wake County—were more diverse than the non-main districts, which enrolled larger shares of White students in 2010.
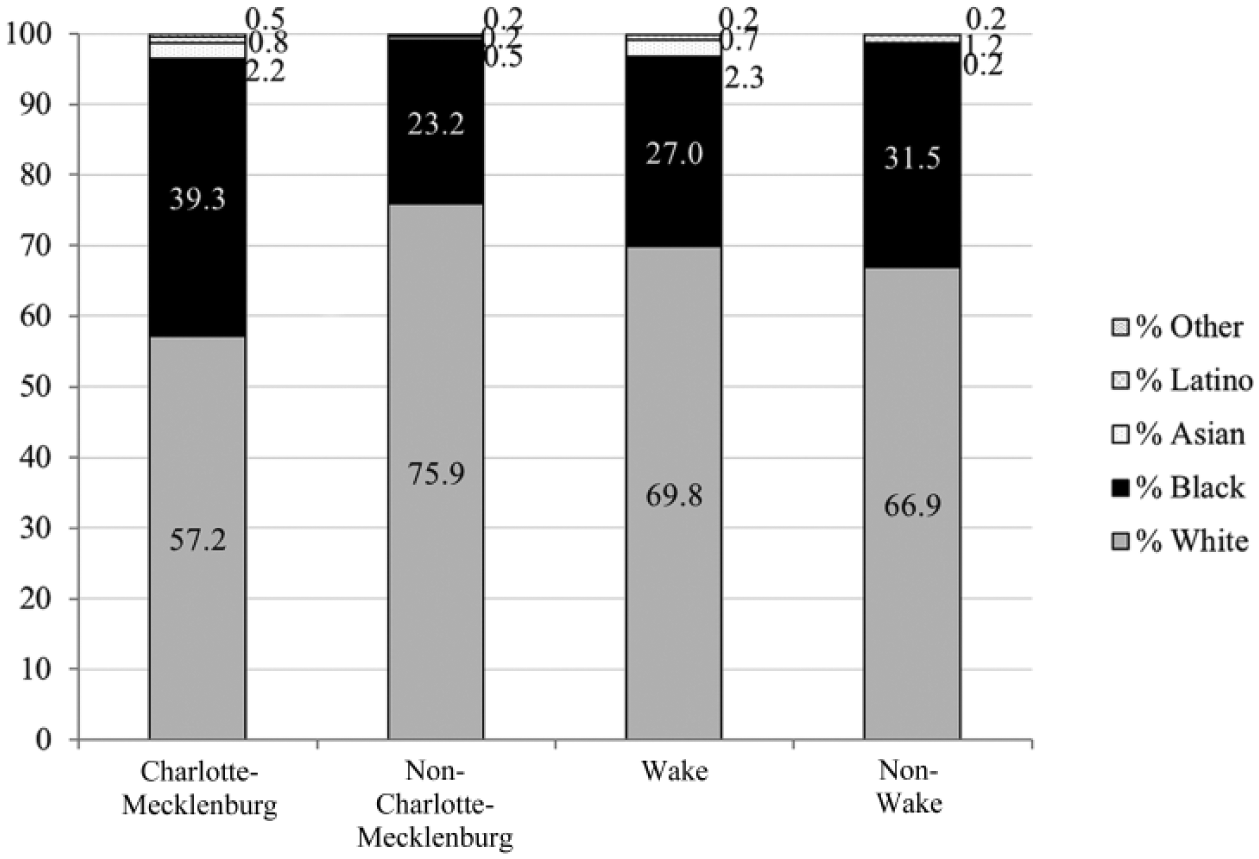
Public school enrollment by race, 1989-1990.
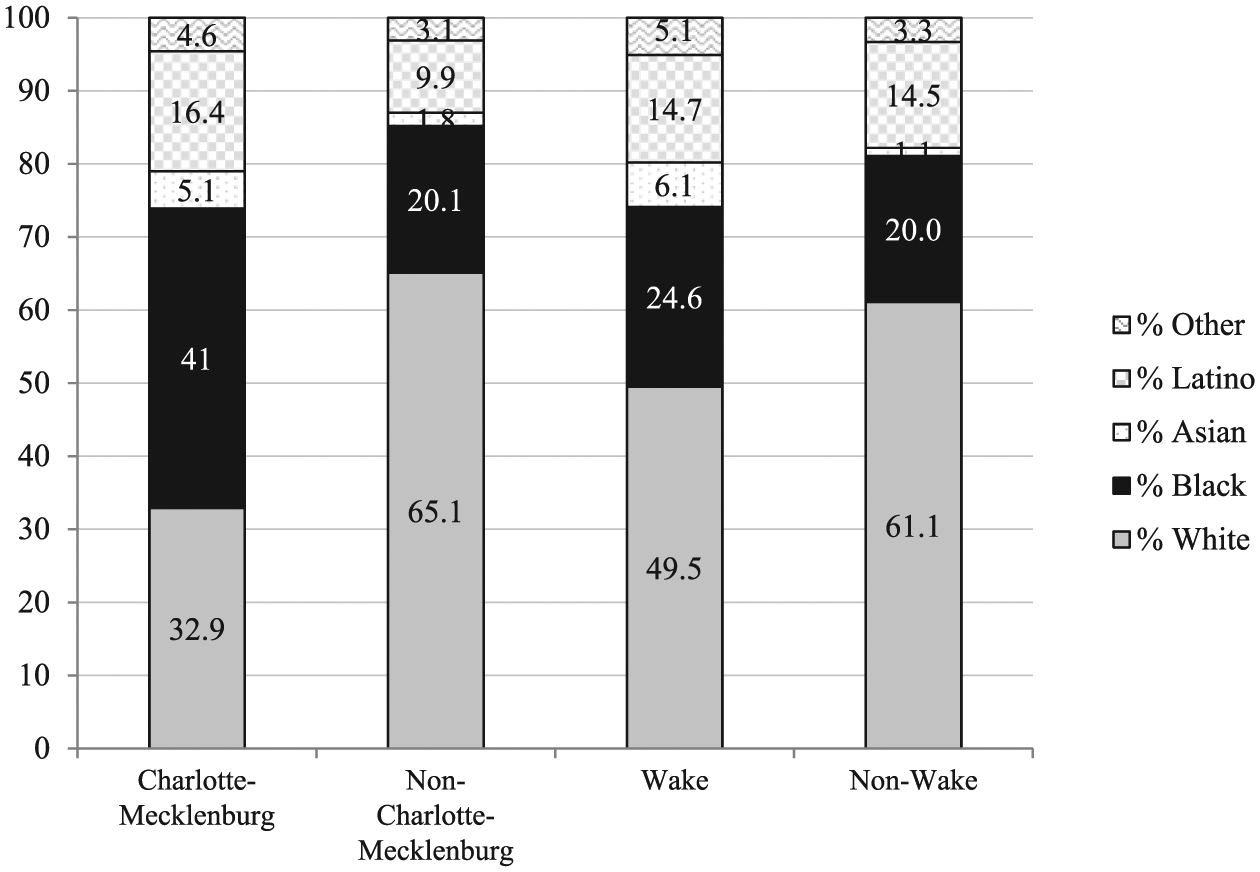
Public school enrollment by race, 2010-2011.
Concentration
Over the last 20 years, the share of intensely segregated schools—those that enroll 90% to 100% minority students—has increased in both the Charlotte-Mecklenburg and Wake County districts (Table 2). The share of Black and Latino students attending intensely segregated schools has also increased in both main districts, though to extremely different degrees.
Percentage of Racial Group and Low-Income Students Enrolled in 90% to 100% Minority Schools.
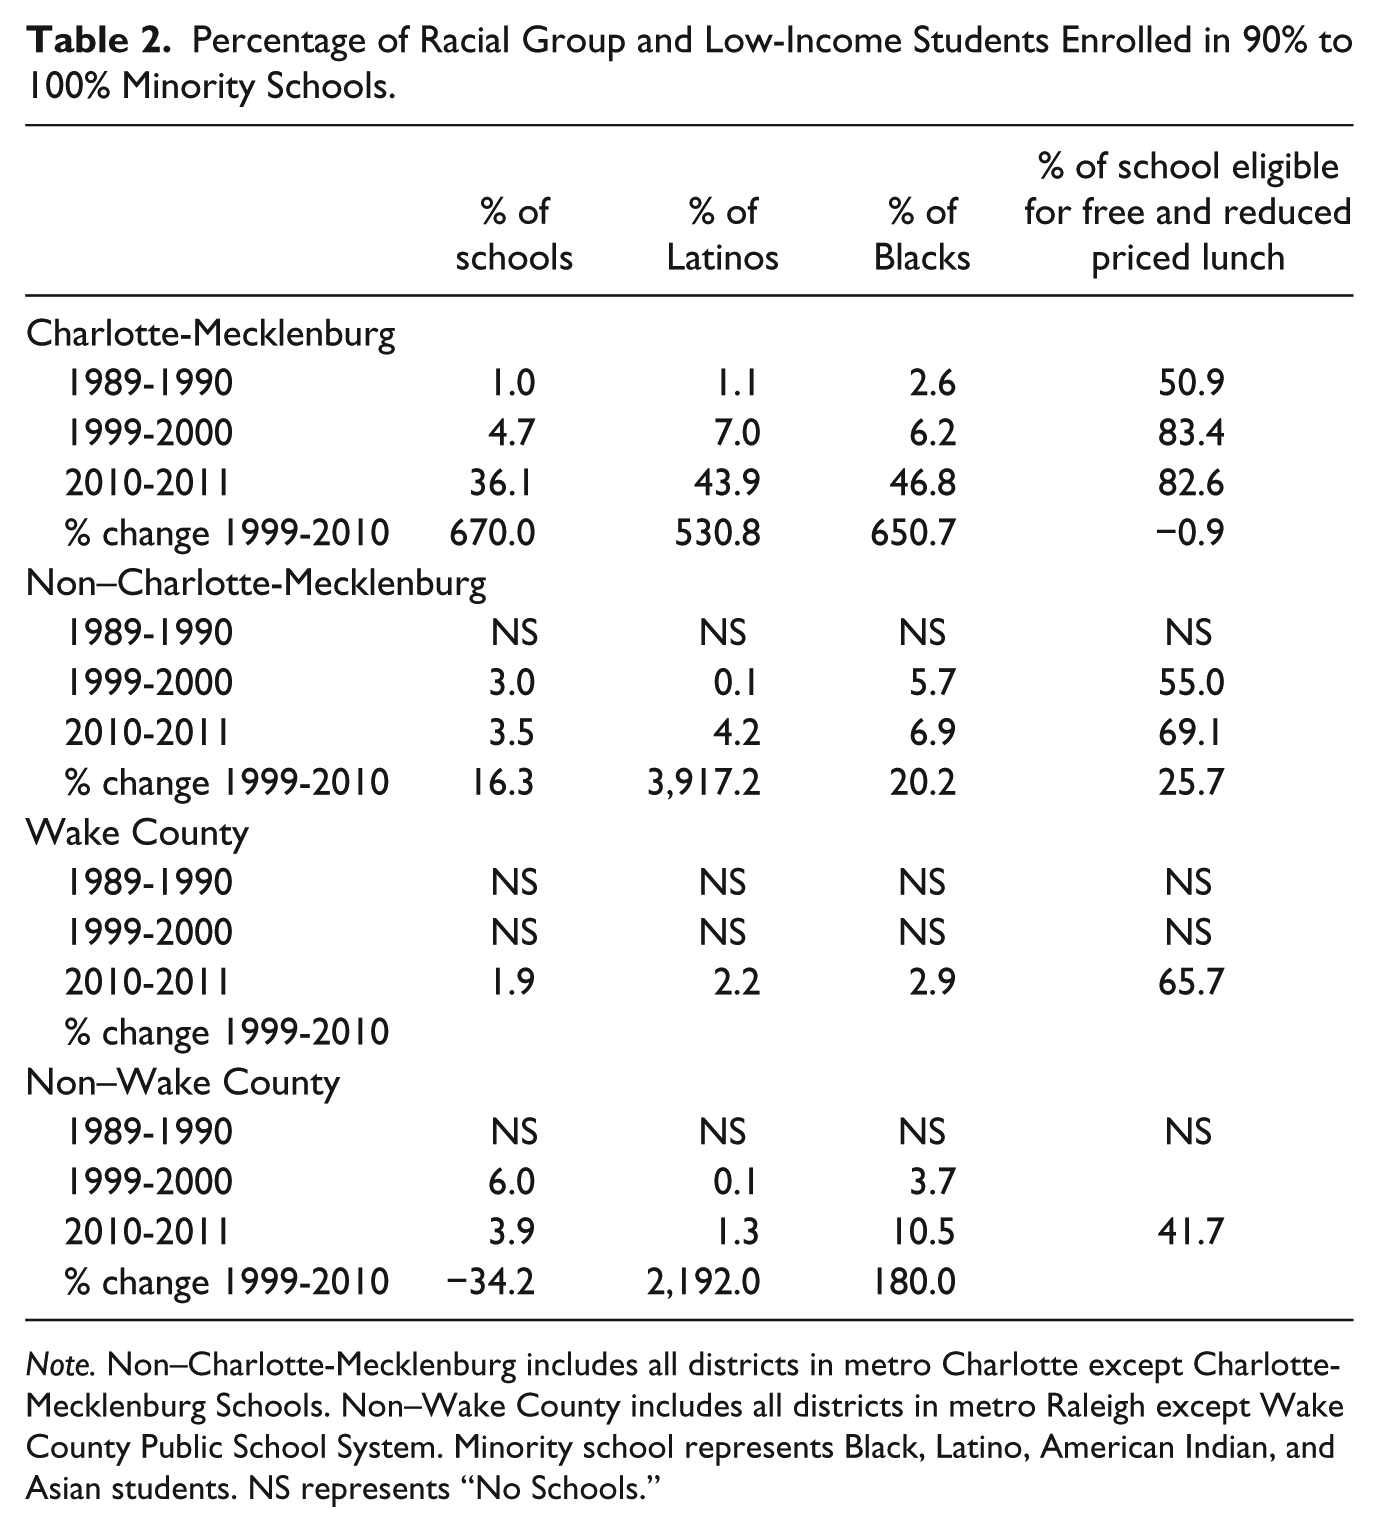
Note. Non–Charlotte-Mecklenburg includes all districts in metro Charlotte except Charlotte-Mecklenburg Schools. Non–Wake County includes all districts in metro Raleigh except Wake County Public School System. Minority school represents Black, Latino, American Indian, and Asian students. NS represents “No Schools.”
The growth of intensely segregated schools in Charlotte-Mecklenburg is particularly noteworthy, as the district experienced a 670% increase over the last 10 years. Those changes corresponded to the declaration of unitary status in 1999 and the adoption of a student assignment plan that dropped the pursuit of racial diversity in 2002. In 2010, almost half of Black and Latino students attended intensely segregated schools in Charlotte-Mecklenburg. Wake County had the smallest share (1.9%) of intensely segregated schools and also a very small share of Black (2.9%) and Latino (2.2%) students who attended intensely segregated schools. However, because there were no intensely segregated schools in Wake County in 1989 or 1999, the fact that any student was attending an intensely segregated school in 2010 was a new trend. This low proportion of intensely segregated schools corresponds to Wake County’s long-standing commitment to diversity in the district’s schools, but the development of a small number of intensely segregated schools in Wake County is linked to the district’s shift in focus from racial diversity to socioeconomic diversity in 2000.
In metro Charlotte, Charlotte-Mecklenburg had a substantially larger share of intensely segregated schools than the non-main districts. In metro Raleigh, Wake County had a slightly smaller share of intensely segregated schools than the metro’s non-main districts, although both Wake County and the non-main districts had a very small (less than 4%) share of intensely segregated schools. Over time, the share of intensely segregated schools decreased in non-main districts of metro Raleigh and remained fairly stable in non-main districts of metro Charlotte—a different pattern than in the main districts of each metro area where the share of intensely segregated schools increased (though to different levels in Charlotte-Mecklenburg and Wake County).
Despite divergent patterns in the growth of intensely segregated schools, in both the main and non-main districts of metro Charlotte and metro Raleigh, the shares of Latino and Black students attending intensely segregated schools increased. In addition to having high concentrations of Black and Latino students, intensely segregated schools also enroll very large shares of low-income students. For example, in 2010, 82.6% of students in Charlotte-Mecklenburg’s intensely segregated schools and 65.7% of students in Wake County’s intensely segregated schools were low-income, indicating that intensely segregated minority schools also tend to be schools with high concentrations of poverty.
Exposure
In both Charlotte-Mecklenburg and Wake County, the typical Black student attends a school with a smaller share of White students now than 20 years ago, indicating that the typical Black student has become less exposed to White students over time (Figures 3 and 4). In fact, over the last decade, the decrease in Black exposure to White students has also outpaced the decrease in the White share of enrollment in each of the districts, an increase in segregation beyond what could be expected as a result of changes in the racial composition of the school districts. This trend was more pronounced in Charlotte-Mecklenburg Schools, where the typical Black student exposure to White students decreased by 51% from 1999 to 2010 whereas the White share of enrollment only decreased by 32% (Table A2 in the appendix). This discrepancy is likely related to the abandonment of diversity goals when Charlotte-Mecklenburg Schools adopted the Family Choice Plan in 2002 and the Student Assignment Plan in 2004, focusing more on proximity than on achieving racial diversity. By contrast, in Wake County between 1999 and 2010, the typical Black student’s exposure to White students decreased by 30% and the White share of enrollment decreased by 24%. The difference is likely less pronounced in Wake County because the district maintained its socioeconomic-based diversity plan through 2010.
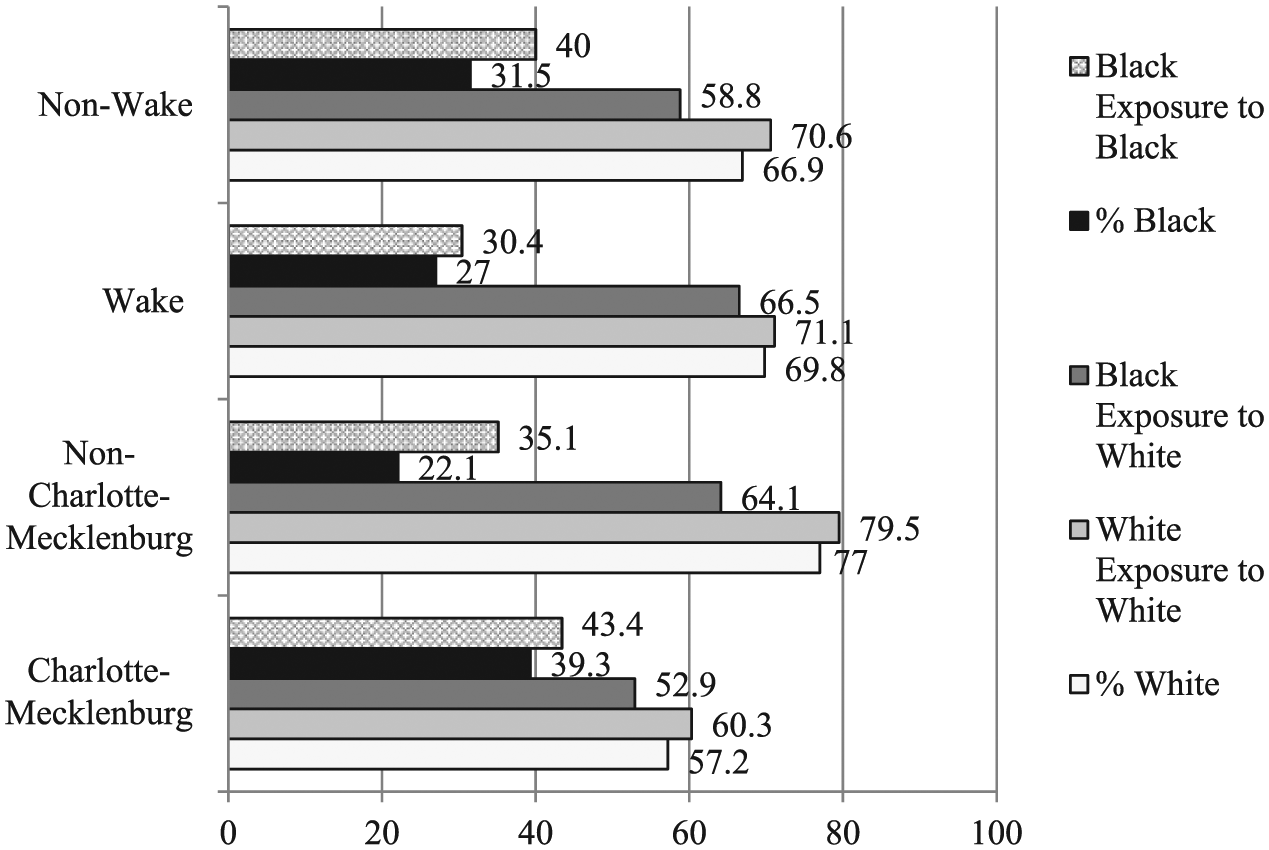
Exposure rates to White and Black students, 1989-1990.
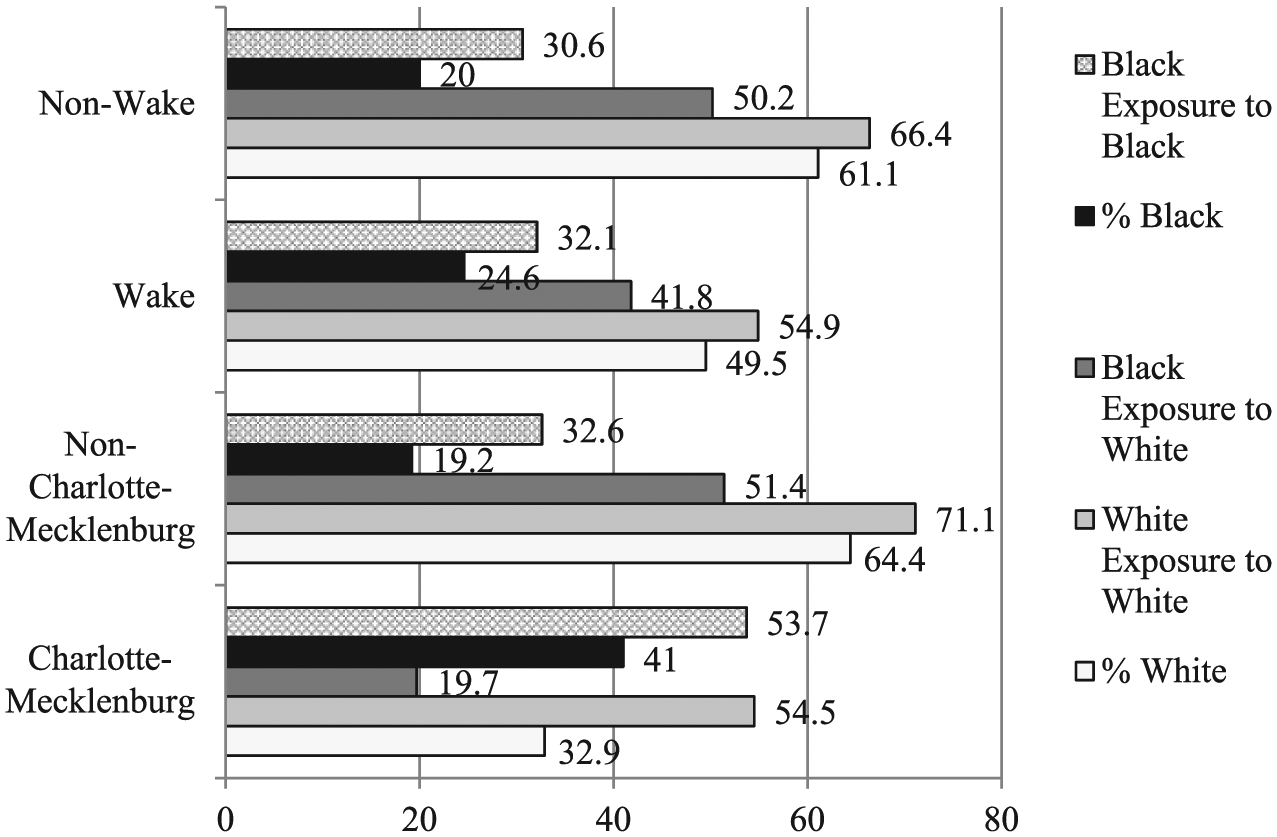
Exposure rates to White and Black students, 2010-2011.
Isolation
In both of the main districts, the typical White student attends a school with a larger share of White students than the overall share of White students in the district. For example, in Charlotte-Mecklenburg during the 2010-2011 school year, the typical White student attended a school where White students made up more than half of his or her peers, even though Whites accounted for less than one third of the district’s enrollment.
Patterns of isolation for the typical Black student differ. In Charlotte-Mecklenburg, the typical Black student has become more isolated with other Black students over the last two decades despite maintaining a relatively stable share of the total enrollment, which is likely related to the adoption of proximity-based student assignment plans beginning in 2002. In Wake County, changes in Black isolation rates are likely related to changes in the Black share of enrollment, which has decreased slightly. Over the last two decades, there was an overall increase in Black isolation in Charlotte-Mecklenburg but a small decrease in Wake County.
When comparing the main districts of Charlotte-Mecklenburg and Wake County with the non-main districts in both metro areas, the typical Black student is exposed to a larger share of White students in the non-CMS and non–Wake County districts than in Charlotte-Mecklenburg and Wake County. Also, the typical Black student is isolated with a smaller share of Black students in the non-main districts compared with the main districts. In the non-CMS and non–Wake County districts, the typical Black student’s isolation with other Black students has decreased over the last two decades, suggesting that Black students are becoming less isolated in non-CMS and non–Wake County districts.
Across all main and non-main districts, in comparison with the overall share of low-income students in the district, the typical White student is exposed to a smaller share of low-income students than the typical Black and Latino students, who are exposed to a larger share of low-income students, indicating a double segregation of students by race and class. In Charlotte-Mecklenburg, the typical Black and Latino students are exposed to more than double the share of low-income students as the typical White student (Figure 5, Table A4 in the appendix). In Wake County, there is a smaller, but still disproportionate, difference between the typical White student’s exposure to low-income students and the typical Black and Latino students’ exposure to low-income students. This double segregation of students by race and poverty means that students attending racially segregated schools, which are associated with numerous unequal educational opportunities as described above, are also attending schools of concentrated poverty, which often compounds the inequalities of segregated schools.
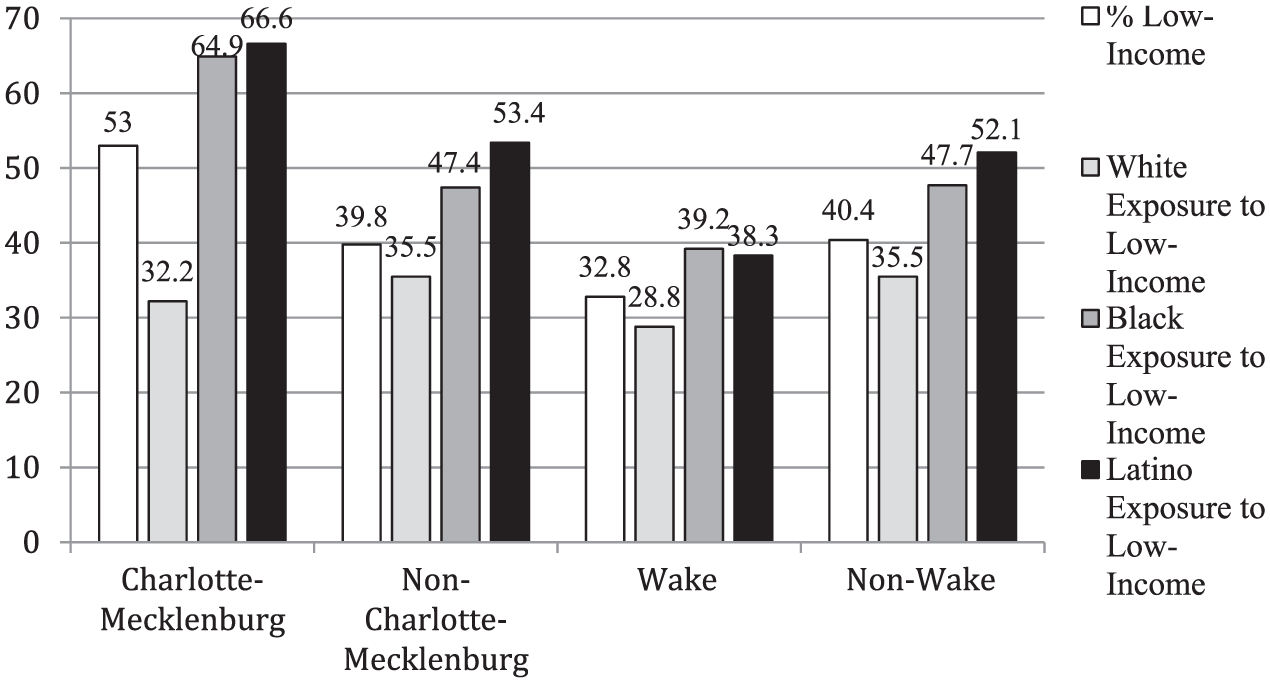
Exposure rates to low-income students, 2010-2011.
Evenness
At present, the distribution of students by race in metro Charlotte is moderately uneven whereas the distribution of students by race in metro Raleigh is low. 2 Over the last 20 years, the level of unevenness has increased in both the Charlotte and Raleigh metropolitan areas, indicating that students are becoming less evenly distributed by race in these metros.
In both metros, the majority of unevenness is due to an uneven distribution of White and Asian students from Black, Latino, American Indian, and multiracial students (Figure 6). This component of unevenness accounts for over 70% of the total unevenness in metro Charlotte and 55% in metro Raleigh. In other words, most of the segregation can be attributed to separation of historically under-represented groups from non-under-represented groups. This component of the unevenness value has been increasing in metro Charlotte and metro Raleigh, where efforts at achieving racial diversity were largely abandoned in the early 2000s. In addition, segregation among Black, Latino, American Indian, and multiracial students has been increasing over the last two decades and is currently responsible for almost one fifth of the unevenness in the metro areas. Segregation between White and Asian students has been fairly stable and low over the last two decades.
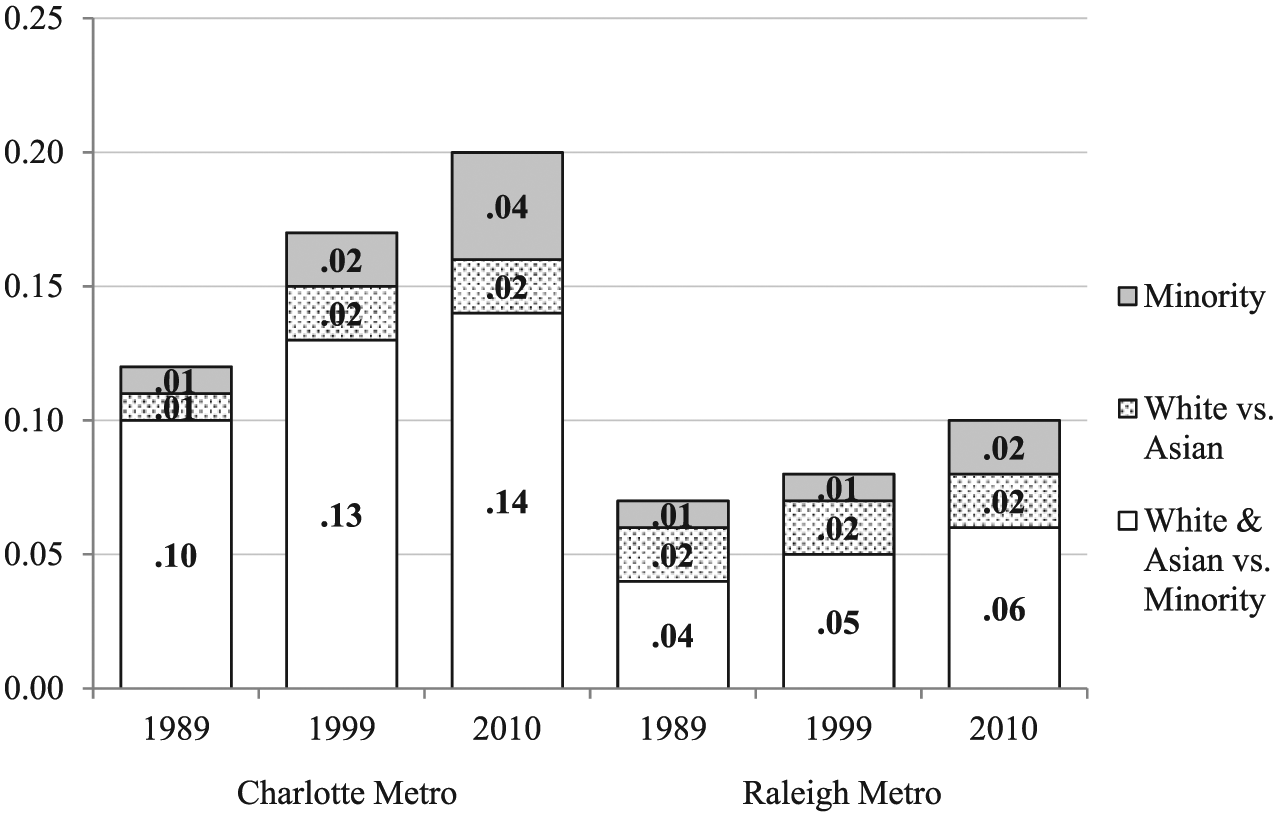
Multiracial metropolitan segregation (H) and racial components, 1989-2010.
In addition to decomposing the unevenness measure by race, it is also possible to decompose it into its geographic components (Figure 7). In doing so, it becomes clear that in both metro areas, more segregation occurs within school districts rather than between school districts. There is also a greater increase in within-district segregation than between-district segregation. It is likely that these patterns are related to the county-wide districts that encompass both city and suburban areas in metro Charlotte and metro Raleigh as well as a shift away from desegregation efforts. These patterns differ from national patterns in which the majority of segregation occurs between school districts rather than within school districts, and between-district segregation increased but within-district segregation decreased between 1998 and 2009 (Stroub & Richards, 2013).
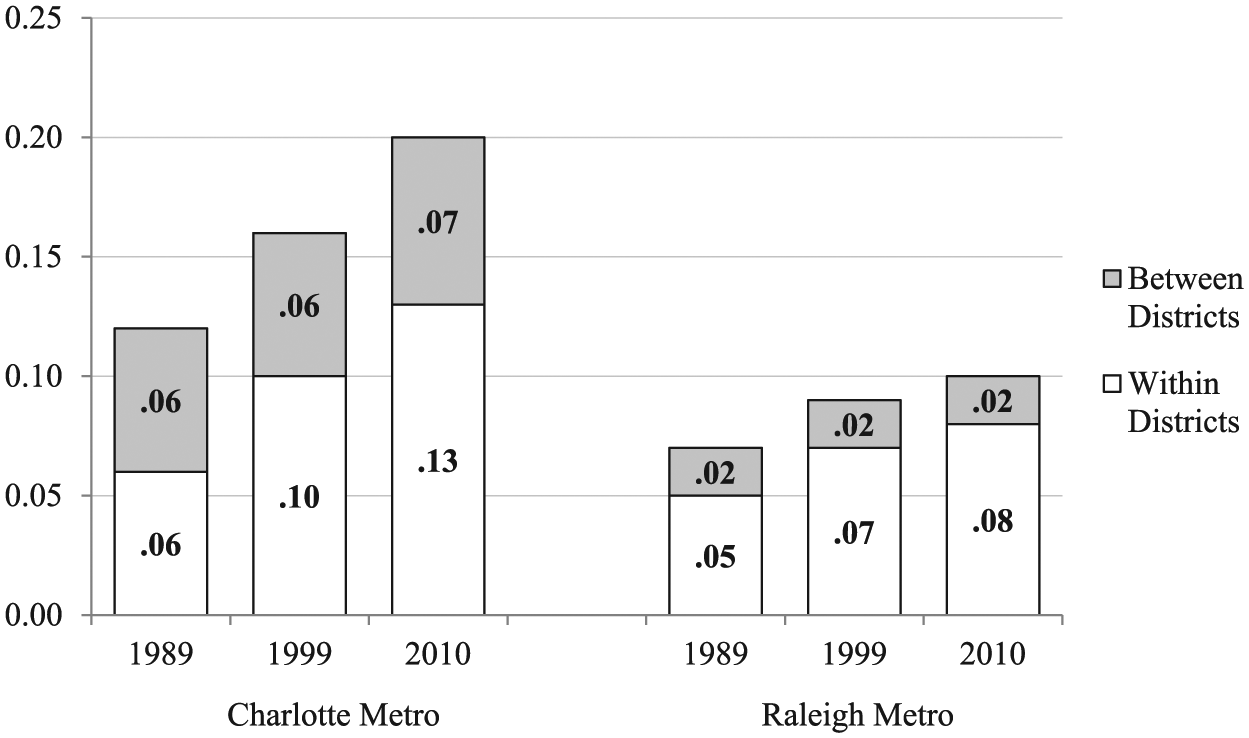
Multiracial metropolitan segregation (H) and geographic components, 1989-2010.
Traditional, Magnet, and Charter Schools
Over the last 20 years, school choice options in school districts of both metropolitan areas have evolved dramatically. Thus, it is important to understand how the shifting focus of choice options is related to enrollment and segregation patterns in various types of schools.
Magnets
Between 1999 and 2010, the number of magnet schools decreased in the Charlotte metro from 42 to 21 but increased in the Raleigh metro from 25 to 34. In terms of racial makeup, in 2010, in comparison with traditional schools, Charlotte’s magnet schools had a disproportionately large share of Black students (51.6%) and a disproportionately small share of White students (25.9%; Figure 8). Similarly, but to a lesser extent, Raleigh’s magnet schools had larger shares of Black students (36.8%) and smaller shares of White students (37.0%) in comparison with traditional schools (Figure 9). The same pattern also existed in 1999. This pattern is likely related to relaxing desegregation standards as well as the historic design of magnets, which were sited in high-poverty, high-minority neighborhoods, so that when the districts transitioned to neighborhood schools plans, these magnet schools were more impacted. For example, when Charlotte-Mecklenburg adopted the Family Choice Plan in 2002 and the Student Assignment Plan in 2004, entrance to magnet schools was determined through a race-neutral lottery system (Mickelson et al., 2009); thus, Charlotte-Mecklenburg’s magnets that were located in inner-city neighborhoods of color were likely to experience increased enrollment of students of color from the surrounding neighborhood.
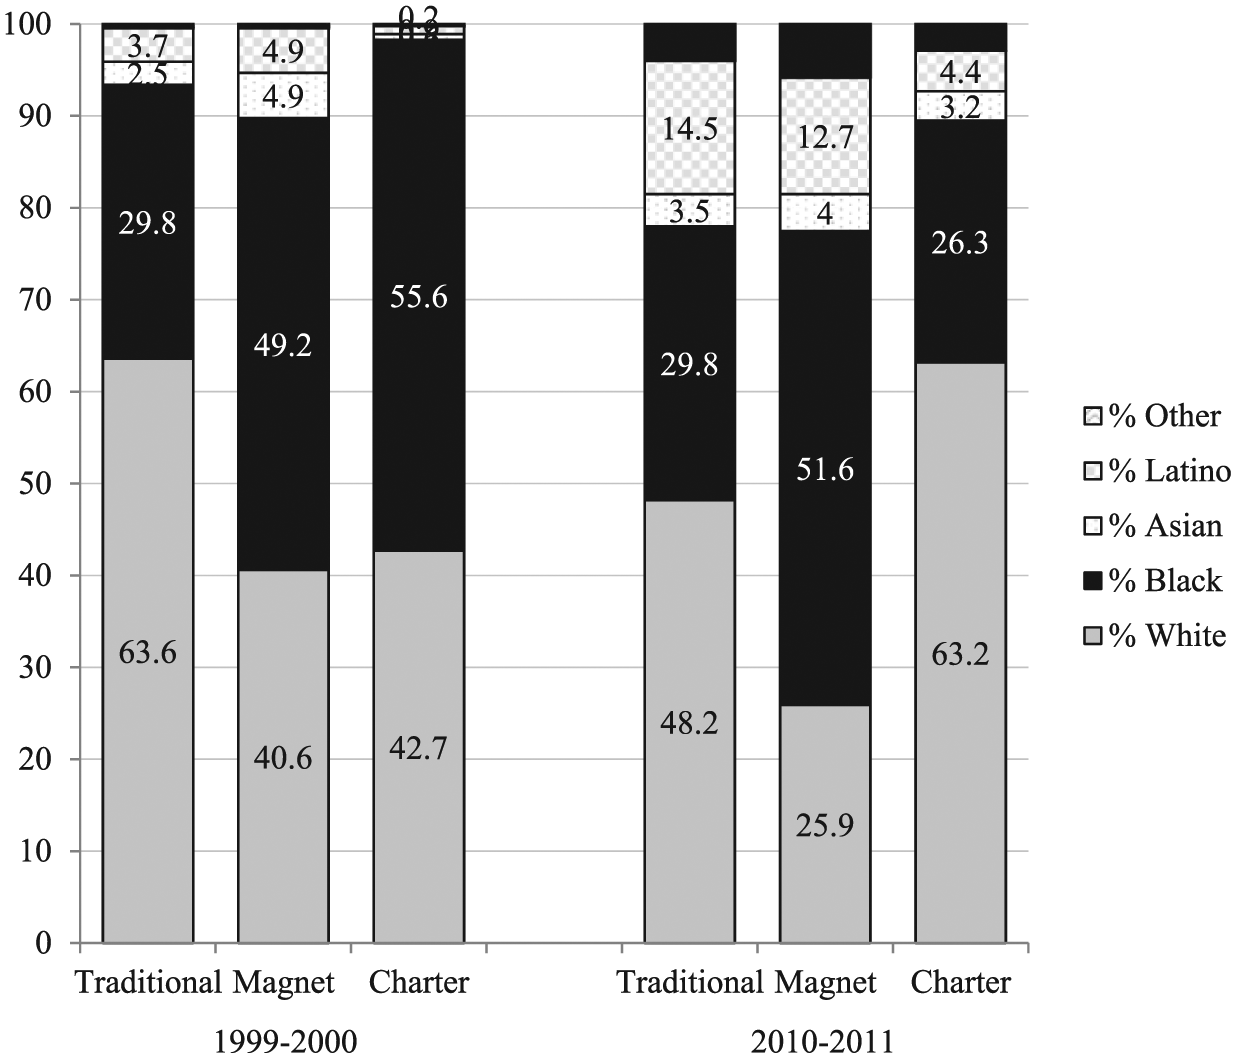
Public school enrollment by school type, Charlotte metro.
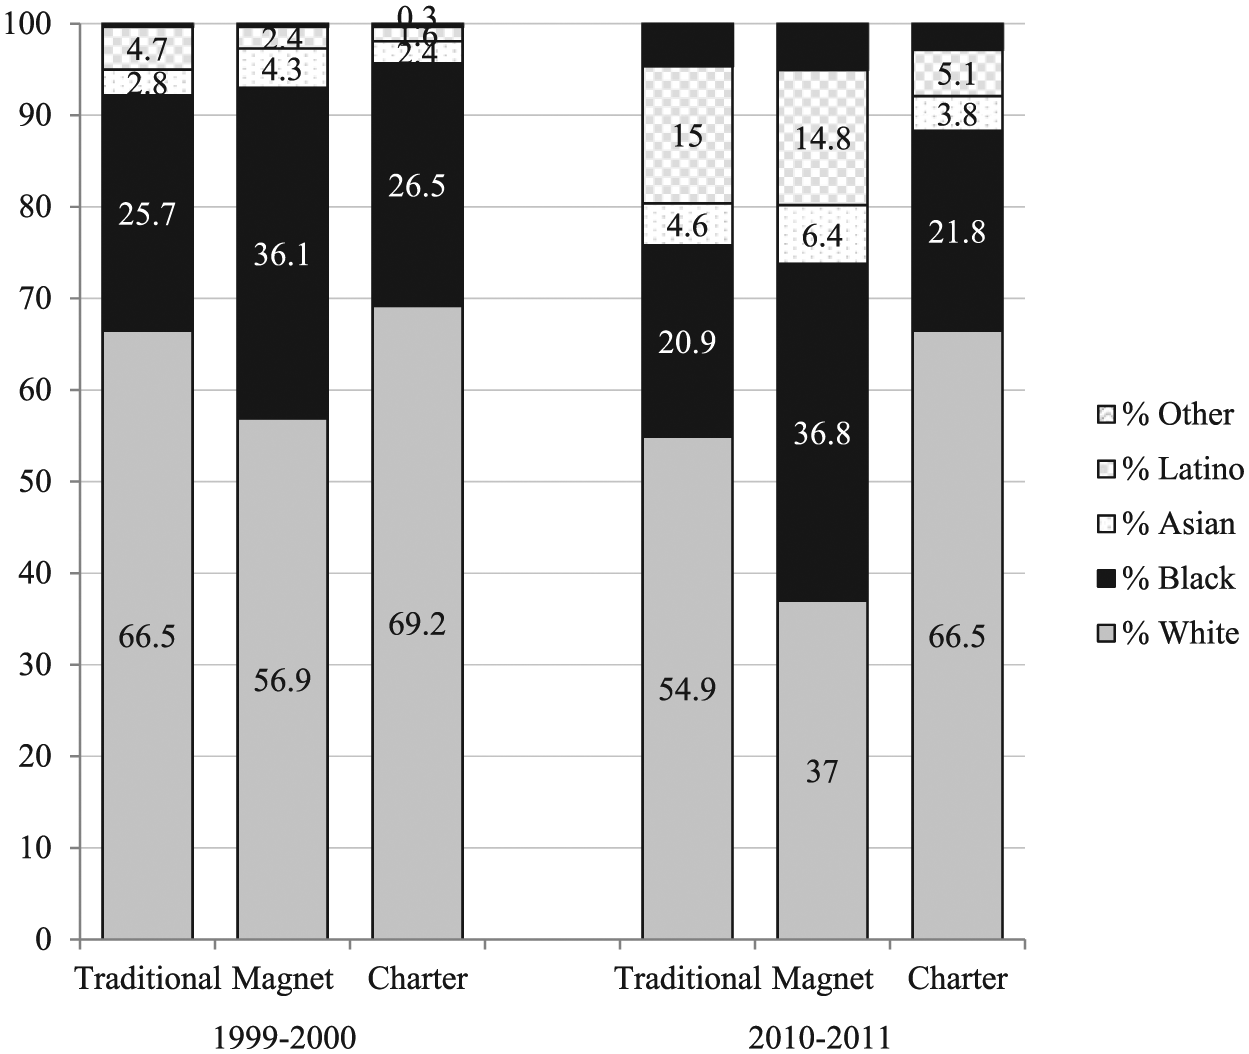
Public school enrollment by school type, Raleigh metro.
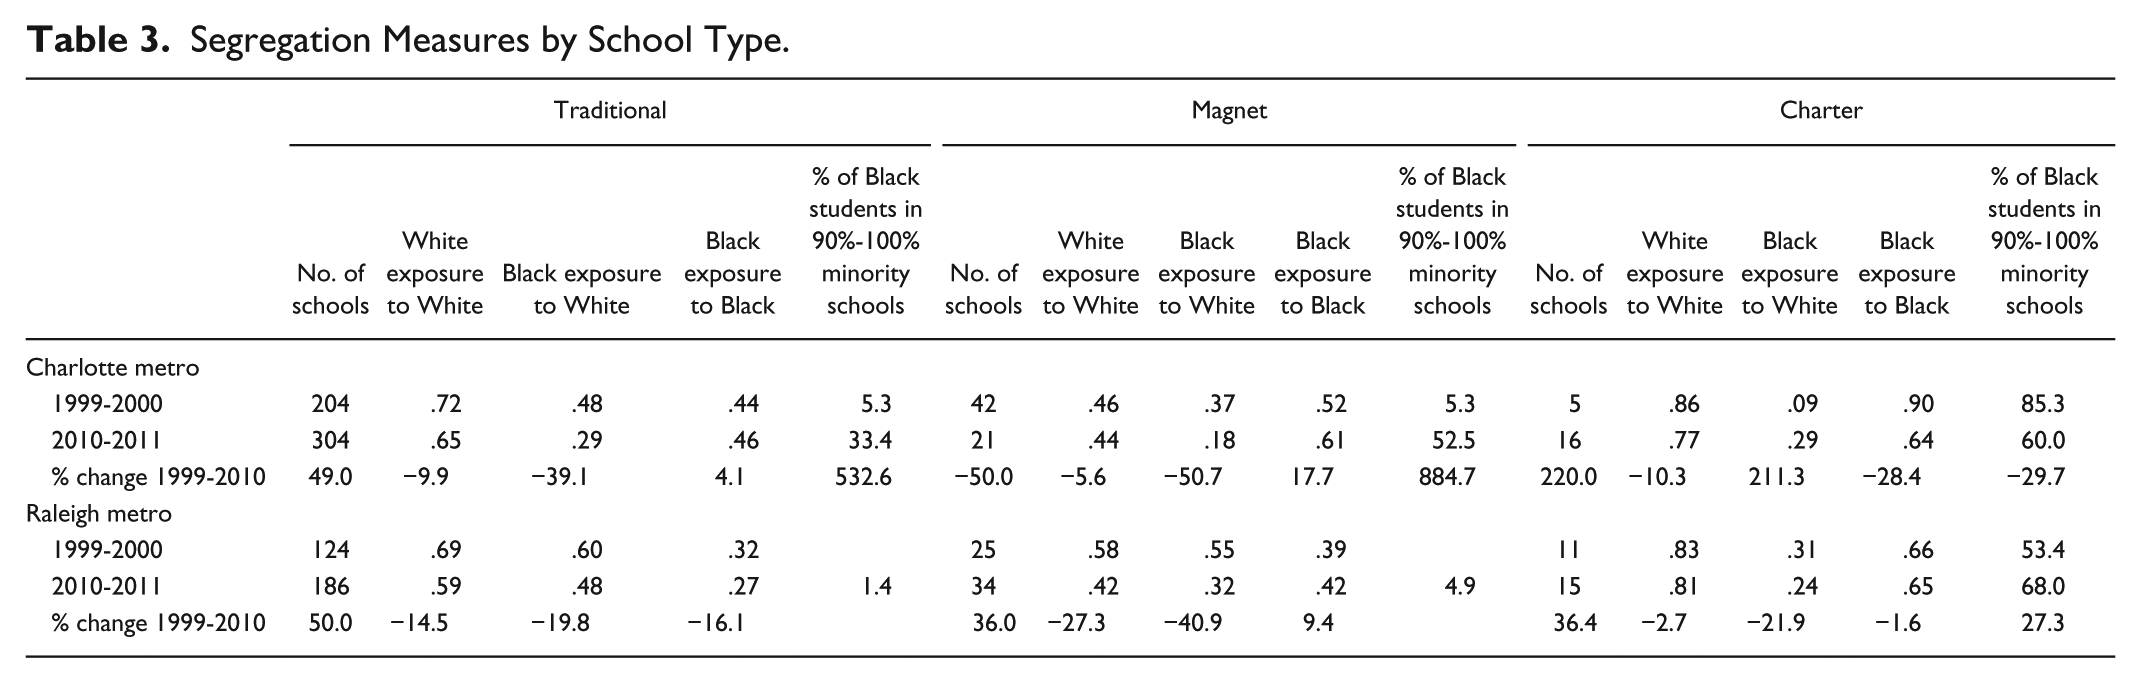
In both metro Charlotte and metro Raleigh, when magnets are compared with traditional schools, magnets have lower exposure to Whites for the typical Black student alongside greater Black isolation and a higher concentration of Black students in 90% to 100% minority schools (Table 3). In Charlotte, in 2010, the typical Black magnet school student attended a school with only 18% White peers but was isolated with 61% other Black students. In Raleigh, in 2010, the typical Black magnet school student attended a school with only 32% White peers and was isolated with 42% Black peers. At the same time, magnet schools in both metros, in contrast to traditional and charter schools, have less White isolation. In 2010, the typical White magnet school student attended a school with 44% White peers in Charlotte and 42% White peers in Raleigh. In contrast, White students in traditional schools were isolated with 65% White schoolmates in Charlotte and 59% White schoolmates in Raleigh.
Segregation Measures by School Type.
Charters
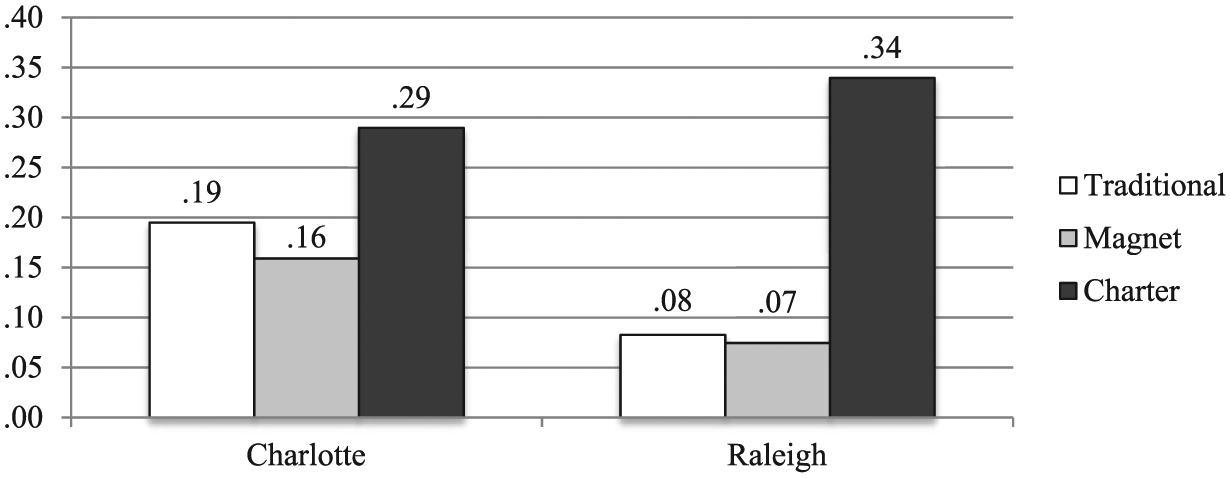
In both metro Charlotte and metro Raleigh, the number of charter schools increased between 1999 and 2010. In Charlotte, the number of charters increased threefold over the last 10 years, from 5 to 16. In Raleigh, the growth of charters from 11 to 15 during the last decade was less substantial; however, because Raleigh had twice as many charters as Charlotte in 1999, both metros had similar numbers of charter schools in 2010: 16 in Charlotte and 15 in Raleigh. In terms of racial composition, charter schools in both metro areas enrolled disproportionately large shares of White students and disproportionately small shares of Latino students in 2010 (Figures 8 and 9). This pattern stands in contrast to magnet schools, which enrolled disproportionately large shares of Black students and small shares of White students.
A notable shift in racial enrollment occurred in Charlotte’s charter schools between 1999 and 2010. Similar to statewide findings that North Carolina’s charter schools originally enrolled a disproportionately large share of Black students and now enroll a disproportionately large share of White students (Ladd et al., 2015), Charlotte’s charter schools were 55.6% Black in 1999 but only 26.3% Black in 2010, a 52.7% decrease, whereas the White share of enrollment in Charlotte’s charters increased from 42.7% in 1999 to 63.2% in 2010. Charters in Raleigh were disproportionately White in 1999 and have remained that way, though to a slightly lesser extent into 2010. It is possible that as desegregation efforts have fallen out of favor in both metros, charter schools are now being used for White flight from traditional schools.
Of the three school types, charter schools in the Charlotte and Raleigh metros have the highest isolation rates for White and Black students, as well as the highest concentration of Black students in intensely segregated schools (Table 3). In metro Charlotte, in 2010, the typical Black charter school student attended a school in which he or she was isolated with 64% Black peers, and in metro Raleigh, the typical Black charter school student attended a school with 65% Black peers. Isolation rates in charter schools were even higher for White charter school students. In metro Charlotte, in 2010, the typical White charter school student attended a school in which he or she was isolated with 77% other White peers and in metro Raleigh, the typical White charter school student’s school was 81% White. These patterns indicate that there is a large share of charter schools in both metro areas that are either predominantly Black or predominantly White.
We also explored the degree of unevenness, or the distribution of students by race, across school types within the Charlotte and Raleigh metros (Figure 10). In both metros, charter schools have a substantially higher degree of unevenness compared with both traditional schools and magnets. Again, this finding indicates that charter schools tend to be either predominantly White or predominantly non-White rather than diverse. This finding is consistent with the most recent charter school research, which found increasing and relatively high racial imbalance in North Carolina’s charter schools (Ladd et al., 2015). Given the State Board of Education’s decision not to enforce the racial diversity provisions of the original charter legislation, it is not altogether surprising that there are higher levels of racial isolation for Black and White students, large shares of Black students in intensely segregated schools, and considerably higher levels of racial imbalance in charter schools.
Multiracial metropolitan segregation (H) by school type, 2010-2011.
Discussion
Intensifying Segregation in Charlotte, Increasing but Modest Segregation in Raleigh
Student enrollment is growing and becoming more diverse and multiracial in both Charlotte-Mecklenburg and Wake County. This increased diversity presents the districts with an important opportunity to develop and maintain desegregated schools. However, as our data demonstrate, the reverse is occurring in both districts. As these city-suburban districts—structures that tend to facilitate greater potential for desegregation—have shifted their focus away from racial diversity and have embraced growth in the charter sector, resegregation by race and poverty has occurred. Both Charlotte-Mecklenburg and Wake County have experienced a growing share of intensely segregated schools, less exposure to White students, overexposure to poor students for the typical Black or Latino student, increasing unevenness, and a greater number of segregated charter schools, all of which can create school environments for minorities where educational opportunities are limited.
The degree to which segregation has intensified in the two districts differs, however. Around 2000, both districts were operating within the same legal and political context of retrenchment on race-conscious law and policymaking. It was within this context that both districts changed or abandoned their previously successful race-based desegregation policies. In the aftermath of the 1999 unitary status decision, Charlotte-Mecklenburg abandoned its desegregation plan altogether. Meanwhile, Wake County maintained a commitment to diversity but shifted from a race-based to a socioeconomic-based diversity plan in 2000.
Charlotte-Mecklenburg experienced the largest growth in intensely segregated schools—nearly 700% growth from 1999 to 2010. In 2010, about half of all Black and Latino students in Charlotte-Mecklenburg attended an intensely segregated school. In addition, there was an overall decrease in Black exposure to White students and an increase in Black isolation rates, even though the share of Black students decreased. The uneven distribution of students by race across the metro area increased and reached a moderate level of unevenness. These changes correspond with the declaration of unitary status and the end of the district’s desegregation plan in 1999.
In Wake County, the increases in segregation were much less extreme, likely due to the district’s emphasis on maintaining socioeconomic diversity. Although intensely segregated schools developed for the first time between 2000 and 2010, less than 2% of the district’s schools were intensely segregated and less than 3% of all Black and Latino students attended such schools in 2010. Black students were exposed to a smaller share of White students in 2010 than in earlier time periods, but again, this shift was less extreme than in Charlotte-Mecklenburg. Unlike Charlotte-Mecklenburg, Black students in Wake County experienced a decrease in isolation between 2000 and 2010. Although the uneven distribution of students by race increased in metro Raleigh between 2000 and 2010, the level of unevenness remained low. As Wake County shifted from a race-based to a socioeconomic-based student assignment policy, the district was able to maintain relatively low levels of segregation. However, Wake County ended its socioeconomic-based diversity plan in 2010; thus, it is possible that the more extreme increases in segregation that occurred in Charlotte-Mecklenburg between 2000 and 2010 could be occurring in Wake County post-2010.
In addition to the difference in diversity-related policies, the development of choice differed in the two metro areas, with both metros supporting the growth of charter schools but with Raleigh maintaining its commitment to magnet schools whereas magnet schools in Charlotte decreased. Although both metro areas continued to have more magnet schools than charter schools in 2010, the growth in the charter sector outpaced that of the magnet sector between 1999 and 2010, particularly in metro Charlotte where the number of magnet schools decreased. This shift is important because in both metro areas, magnet schools are generally less segregated than charter schools. Lower levels of segregation in magnet schools are likely due to the history of magnet schools and the original intent of magnets as a mechanism for facilitating diversity. However, charters, which were not developed as tools for desegregation, tend to be the most segregated of all three school types in both metro Charlotte and metro Raleigh. Thus, the growth of charter schools in both metro areas is likely related to increased segregation. Although both districts were operating within similar legal and political contexts, it is likely that the differences in diversity-related student assignment and choice policies led to more extreme segregation in Charlotte-Mecklenburg and more modest increases in segregation in Wake County.
The Role of Non-Main Districts
In some respects, patterns in the non-main districts in metro Charlotte and metro Raleigh were similar to patterns in the main districts of Charlotte-Mecklenburg and Wake County. Similar to Charlotte-Mecklenburg and Wake County, non-main districts experienced growth in enrollment and an increasingly diverse student enrollment. However, important distinctions are also in evidence. The growth in enrollment of non-main districts outpaced that of the main districts and the decrease in White enrollment was less extreme in non-main districts.
Patterns of segregation were also less extreme in the non-main districts. Between 1999 and 2010, non-main districts in metro Charlotte maintained a relatively stable and substantially smaller share of intensely segregated schools than Charlotte-Mecklenburg. In metro Raleigh, the share of intensely segregated schools in non-main districts decreased. However, during the same time period, the share of intensely segregated schools increased in both the main districts. When the non-main districts were compared with the main districts, the typical Black student experienced greater exposure to White students and less isolation with Black students in the non-main districts. Our findings indicate that non-main districts are generally less segregated than the main districts.
Consistent with prior research demonstrating growth in exurban areas, which tend to be White and middle class (Berube et al., 2006), it may be that White families were moving from the main districts into the non-main districts, adding to the more extreme growth in enrollment and the smaller decrease in the White share of enrollment in non-main districts (although the limitations of our data do not allow us to make a definitive claim here). The growth also corresponds to important shifts in student assignment policies. Earlier research indicated that White flight was less likely to occur in city-suburban districts because all families were guaranteed access to a desegregated school comparable with the other schools in the metro area (Orfield, 2001; U.S. Commission on Civil Rights, 1977). Our data suggest that as these two city-suburban districts abandoned their diversity goals, there was corresponding growth in non-main districts that outpaced that of the main districts. It is possible that families no longer felt the assurance that their children would be able to attend desegregated schools and chose to move out of the main districts. Future research should explore this trend more fully.
Future Research
As these metropolitan areas become increasingly diverse, it is important for researchers to continue monitoring segregation trends in the metropolitan areas, paying attention to differences between main and non-main districts, or distinguishing between urban, suburban, and exurban areas. In addition, much of the research on school segregation deals with segregation between Black and White students, but as the nation and these metropolitan areas become more multiracial, it is important to understand how segregation is manifested in these multiracial contexts.
Alongside this demographic change, districts in each of these metropolitan areas have often changed their student assignment policies. For example, although the data analyzed in this article indicate that Wake County is becoming slightly more segregated through 2010, with a shift from their socioeconomic-based diversity plan to a controlled choice plan without diversity goals in 2012, it is likely that segregation will intensify in Wake County as it did in Charlotte-Mecklenburg when the district adopted the Family Choice Plan in 2002 and the Student Assignment Plan in 2004. Future research should examine trends in the aftermath of the Wake County shift. In addition, in both districts, greater Black isolation and concentration of Black students in intensely segregated minority schools in magnets compared with traditional schools should be further investigated as it may be that some magnet schools are failing to recruit and retain White students. It is important to continue monitoring segregation trends in each of these metropolitan areas as they change their student assignment policies and prioritize proximity and choice over diversity.
Policy Implications
The policies implemented alongside racial change have significant effects as to whether or not schools are able to create and sustain stable desegregation. Without proactive policies to address demographic change, communities and schools can quickly transition from being diverse to resegregating to predominantly non-White, a process which appears to be underway in the main districts of these metros—most strikingly in Charlotte-Mecklenburg. Thus, although there is neither a singular solution to the complexity of segregation in our multiracial society nor one set of solutions that will be successful in achieving desegregation for all schools and communities in these two metro areas, various types of policies merit close consideration.
Unlike many other parts of the nation, segregation within school districts accounts for the majority of segregation in Charlotte and Raleigh. Therefore, developing intradistrict programs with a diversity focus could help to reduce segregation in these metro areas. At the same time, as the growth in non-main districts outpaces that of Charlotte-Mecklenburg and Wake County, and these non-main districts continue to retain large shares of White enrollment, interdistrict programs with a desegregation focus, such as regional magnet schools and interdistrict transfer programs, could also address segregation between the city and suburban/exurban districts.
Although it is more difficult to construct race-conscious student assignment policies in light of the 2007 Parents Involved in Community Schools decision, it is still possible and could be beneficial for supporting desegregation in each of these metro areas. Although the individual race of a student cannot be the deciding factor in the student’s assignment, multifactor policies that include race among other factors such as family income or education level, such as the one in Berkeley, California (Frankenberg, 2013a), can be successful in creating diverse schools while abiding by current legal constraints.
School choice options are growing in both of these metro areas. School choice can be used to promote, rather than detract from, racial diversity if intentional efforts are made to attract diverse groups of students (Siegel-Hawley & Frankenberg, 2013). Thus, policies that aim to create and maintain diverse enrollments in schools of choice could make an impact in these regions. Schools of choice can achieve diversity if they provide outreach and information to families in ways that are accessible, including advertising in neighborhoods throughout the district and providing information in multiple languages. Districts can create more equitable opportunities for students to attend magnet and charter schools by providing free transportation and services, such as free and reduced-priced lunch as well as resources for English Learners (Fuller & Elmore, 1996; Orfield & Frankenberg, 2013). By including explicit diversity goals and civil rights protections, magnet and charter schools could help promote racial diversity.
In addition to education policies that focus directly on schools, it is important to remember that school and neighborhood segregation are interrelated processes; thus, policies attempting to address either type of segregation must also consider the other (Denton, 2001). There are multiple ways in which communities can strive to reduce residential segregation, including auditing discrimination in housing markets and prosecuting those who are violating fair housing laws as well as monitoring land use and zoning decisions to ensure they do not create further segregation.
Promise for the Future?
Although Charlotte and Raleigh have two unique histories with school desegregation efforts, their histories have begun to converge and they now face a common future of highly segregated schools. Rather than submitting to this future, with strong leadership, thoughtful planning, and careful, reflective implementation, communities and schools in metro Charlotte and metro Raleigh could instead harness the opportunity provided by demographic change to build and sustain desegregated learning environments.
Footnotes
Appendix
Declaration of Conflicting Interests
The author(s) declared no potential conflicts of interest with respect to the research, authorship, and/or publication of this article.
Funding
The author(s) received no financial support for the research, authorship, and/or publication of this article.