
Abstract
Executive leadership of the U.S. Department of Education (USDOE) initiated a flexibility offering from No Child Left Behind. Our work explores specific design decisions made in these state-specific accountability systems as associated with state political environments, resources, and demographic characteristics. Our analysis, focused on 42 states with approved flexibility waivers, provides some evidence that design decisions are associated with prior education policies, political leanings, and financial resources within each state. Policymakers should also take note, as these results suggest that state political factors may influence how state policymakers will react in future negotiations with the USDOE.
Keywords
The federal government relies on the cooperation of state departments of education to implement policy and enact the federal education agenda (McGuinn, 2012). No Child Left Behind (NCLB) is one example of states implementing federal policy initiatives. NCLB, passed in 2001 as the reauthorization of the Elementary and Secondary Education Act (ESEA), created the first major national accountability structure that mandated states to hold schools and districts responsible for student achievement (Sunderman & Kim, 2007). Because the U.S. Department of Education (USDOE) has no constitutional authority to force states to comply, the USDOE connected the policy to federal Title I monies, which make up approximately 10% of the typical state’s K-12 education spending (Manna, 2007). Thus, all states, but not necessarily every school, were subjected to NCLB accountability.
Prior to NCLB, although the federal government provided incentives for states to hold schools accountable for student outcomes, school accountability had been under the purview of individual states (McDonnell, 2005). The new and expanding federal involvement caused tension between states and the USDOE (Shelly, 2012). For example, states were required to implement NCLB’s accountability provisions regardless of existing state accountability policies, some of which conflicted with NCLB’s measures and requirements (McGuinn, 2006; Shelly, 2012). Further aggravating the relationship between state and federal government education officials, NCLB was fraught with design problems from the beginning (see Linn, 2003), and the policy has since been associated with unintended negative consequences that have been well documented in the research (Balfanz, Legters, West, & Weber, 2007; Booher-Jennings, 2005; Kim & Sunderman, 2005; Novak & Fuller, 2003; Porter, Linn, & Trimble, 2005).
When NCLB was introduced, the USDOE refused to consider state requests for flexibility from the new federal guidelines. This stance was a departure from previous practice. States had become accustomed to some flexibility from federal policy mandates to implement the policy at the state level (Shelly, 2012). Eventually, the USDOE allowed minimal departures from the NCLB legislation to address state-level implementation challenges—for instance, the USDOE allowed states to implement limited types of growth models (Weiss & May, 2012). In 2011, the USDOE announced the opportunity for states to apply for extensive flexibility from NCLB (subsequently referred to as ESEA flexibility waivers). States could request release from most NCLB accountability rules in exchange for enacting various education policy reforms, including revised state-specific school accountability systems.
Research on state accountability systems has analyzed the effects of, and outcomes associated with, the specific design decisions states have selected (Balfanz et al., 2007; Ho, Lewis, & Farris, 2009; Linn & Haug, 2002; McEachin & Polikoff, 2012; Porter et al., 2005). NCLB’s performance calculations have been shown to unduly target schools that were large, urban, racially diverse, serving mostly low-income students, as well as those schools with high proportions of low-performing students when NCLB was instituted (Balfanz et al., 2007; Novak & Fuller, 2003). NCLB measures have also been criticized for not focusing on school improvement or accounting for the characteristics of students within schools (Heck, 2006; Kim & Sunderman, 2005).
Early research on the waiver applications has examined variation among states in their waiver designs and how the new accountability systems compare to school accountability under NCLB (Chubb & Clark, 2013; Polikoff, McEachin, Wrabel, & Duque, 2014; Riddle, 2012). For example, Polikoff et al. (2014) found that many states continue to emphasize proficiency rates in the process of identifying low-performing schools despite evidence from research on NCLB regarding the poor quality of this measure as an indicator of school performance. Although early studies on the waivers are instructive, the extant literature provides relatively little information as to why states made the choices they did in constructing their accountability systems in response to the ESEA waivers. In particular, there is little work that examines the connection between state political environments, resources, and demographic characteristics and the specifics of state education policies (see Manna & Ryan, 2011; Nicholson-Crotty & Staley, 2012; Shelly, 2012). Our work extends the examination of accountability and state political environments by analyzing waiver applications submitted under the ESEA flexibility policy. ESEA waivers are of particular interest in the context of ever-changing relationships among local, state, and federal governments. Given the wide disparity in the quality of states’ waiver accountability systems (see Polikoff et al., 2014), we explore which factors influence state-level design choices when given flexibility by the USDOE. Specifically, we address our main research question:
As of March 2015, 42 states and the District of Columbia 1 have received approval for the accountability framework submitted through the ESEA flexibility policy, with another two states awaiting approval. Similar to the extensive variation in state decisions regarding NCLB implementation (see Davidson, Reback, Rockoff, & Schwartz, 2013), a substantial amount of variation exists across accountability plans and design choices as established in the state waiver applications (Polikoff et al., 2014). We exploit this variation in our analysis.
Research Framework
Federalism in Education
Federalism is a broad term that refers to the tensions among various levels of government (Gerston, 2007; Manna, 2007). Scholars of federalism acknowledge the blending nature, and difficult legibility, of resources, power, and authority between levels of government (Grodzins, 1966) and the varying authority relationships across government levels depending on the policy area, as well as state and local preferences (Wildavsky, 1998). Although many analogies exist to depict these dynamics, what is clear is that the relationships among levels of government in the United States’s educational system are complex and ever changing (Grissom & Herrington, 2012).
Intergovernmental relationships are unique in the United States, where the different levels of government have, at various times throughout history, worked in coordination to deliver resources and policies for public education. Within educational policy, the relationships among the local, state, and federal governments have changed significantly over time (Cohen & Moffitt, 2009; Grissom & Herrington, 2012; Henig, 2009). Educational policy was initially set up to be a local endeavor. Although early education was controlled overwhelmingly by local school boards, in both policy and finance, state constitutions generally included language ensuring public education in one form or another (Grissom & Herrington, 2012). As schools were challenged in the courts for financial inequities, state governments began to assume more direct responsibility for the funding and oversight of public education (Manna, 2007).
With the passage of ESEA in 1965, the federal government expanded its role in education policy. Albeit small and primarily focused on supplemental funds for programs targeting children living in poverty, the passage of ESEA marks the beginning of the federal role in national education policy (Cohen & Moffitt, 2009). Initial federal efforts primarily focused on providing resources and safeguards for targeted groups of students, including students with disabilities, students living in poverty, and racial/ethnic minorities (Cohen & Moffitt, 2009; Sunderman & Kim, 2007). NCLB altered the relationship between federal and state governments by shifting from a compliance-driven and input-focused model to a performance-based and output-focused model of federalism that set clear school performance targets, created standards for adequate yearly progress, defined who should be tested, and established consequences for not meeting academic targets (Wong, 2008).
Executive Federalism
Executive federalism emphasizes the importance of the executive branch to the relationship between the state and federal government (Shelly, 2012; Thompson & Burke, 2009). A key component of executive federalism is the federal government’s willingness to grant flexibility in the implementation of federal programs. In fact, state officials have come to expect a certain amount of bargaining when it comes to implementing federal policy. For example, states have sought waivers to allow more discretion from federal laws in health care, education, and environmental policy (Gormley, 2006). Although the success rates of these waiver requests have varied substantially, they do represent a complex negotiation that occurs between states and the federal government.
Educational policy and governance has historically fallen outside of the realm of executive politics (Henig, 2009). However, the executive branch at all levels has incorporated education into general-purpose government, thereby increasing its role and authority. Following the examples of Henig (2009, 2013) and Wong (2008), we use executive federalism as the frame for this study because the federal and state executive branch officials have controlled the vast majority of the dialogue throughout the ESEA waivers process. The ESEA flexibility waivers can be seen as a negotiation between the federal and state executive branches. Congress was expected to reauthorize ESEA on a number of occasions but failed to pass legislation. Without consensus on school accountability policy, the USDOE stepped in to provide states with new opportunities for flexibility, thus asserting authority for the federal government vis-à-vis the executive branch.
Politics in Education
The extant literature in education provides limited guidance on what best captures the political dynamics within a state and the resulting decisions states make in federally driven policy. Some researchers suggests that policy making still exists in a black box, prohibiting researchers from truly understanding the political dynamics involved in state-level policy development (Furgol & Helms, 2012). As such, researchers who examine state politics in relation to education policy utilize a wide array of political indicators: governor political party (Manna & Ryan, 2011; Nicholson-Crotty & Staley, 2012); degree of Congressional liberalism within the state and tax efforts (Burbridge, 2002); percent of population voting for the President in recent election, size of the state population, and percent of teachers participating in a union (Shelly, 2012); dependence on federal monies for education in the state (Nicholson-Crotty & Staley, 2012; Shelly, 2012); whether a new governor was voted into office during last election; and teacher union contributions to political campaigns (Nicholson-Crotty & Staley, 2012).
Berry, Ringquist, Fording, and Hanson (1998) suggested that static measures of political ideology do not capture longitudinal variation and change over time. Similarly, when using the political party of power as an indicator of state political ideology, research ignores the complex decision-making process that involves members of all political parties (Berry et al., 1998). With this perspective in mind, it is unsurprising to see that, in the aforementioned research, few of the political indicators were significantly associated with state-level policy decisions; a state’s Congressional liberalism rank was associated with per-pupil funding, and both tax efforts (a ratio of state tax to personal income) and Congressional liberalism rank were related to a state’s reliance on federal monies for education (Burbridge, 2002). In addition, increased union contributions to political campaigns were associated with lower scores on Race to the Top (RTTT) applications (Nicholson-Crotty & Staley, 2012). Based on the limited findings in previous research, we introduce the use of Berry, Fording, Ringquist, Hanson, and Klarner’s (2010) and Berry et al. (1998) measure of state political environment to measure state-specific decisions on a federally driven policy initiative.
Policy Background
ESEA Flexibility Policy
In September 2011, Secretary of Education Arne Duncan announced a new ESEA flexibility policy. The flexibility offering arose in response to two conditions. The first was NCLB’s rapidly approaching deadline for all students to have reached grade-level proficiency in 2014. This target was widely seen as unattainable. In 2011, with just 3 years before the 2014 deadline for all students to reach grade-level proficiency, almost half (48%) of schools nationally were labeled as failing (Usher, 2012). The second was the lack of an ESEA reauthorization by Congress, despite the fact that a reauthorization had been due since approximately 2007 (USDOE, 2013). Meanwhile, states continued to advance innovations around improving low-performing schools and integrating teacher accountability systems into accountability while awaiting ESEA to be reauthorized (Duncan, 2011).
The USDOE suggested that NCLB was inhibiting innovation by individual states and creating confusion due to the dual accountability structures present in many states. According to the USDOE, flexibility was offered to continue advancing improvements in education while the next generation of the ESEA legislation languished in Congress. In the official policy announcement to chief state school officers, Secretary of Education Arne Duncan (2011) wrote that one of the “highest priorities is to help ensure that Federal laws and policies can support these reforms and not hinder state and local innovation aimed at increasing the quality of instruction and improve student academic achievement” (p. 1).
A peer review panel examined each state’s waiver and, where necessary, outlined areas where the state plans did not meet federal requirements. Once states appropriately met federal waiver criteria, the state received approval to move forward with their proposed reforms. States in the process of seeking approval or which did not seek flexibility remained responsible for school accountability rules as set forth by NCLB. However, some states requested, and received, interim flexibility from the performance targets established under NCLB until a decision on the waiver application was finalized.
The USDOE required each state to outline how four aspects of education would be addressed: college- and career-ready expectations for all students; state-developed differentiated recognition, accountability, and support; supporting effective instruction and leadership; and reducing duplication and unnecessary burden (USDOE, 2013). School accountability is placed within the “differentiated recognition, accountability and support” strand. Here, states had to make decisions regarding at least five key aspects of accountability: the academic subjects included in the calculation of school performance, the setting of annual targets for schools, the types of subgroups a state will use in disaggregating performance, how those subgroups will then be used in calculating school performance, and the ways in which low-performing schools will be identified. The USDOE required states to identify two types of low-performing schools. The first group, the Priority schools, is at least the bottom 5% of schools with the lowest overall performance. The second, Focus schools, are at least the 10% of schools with the largest achievement gaps. States had flexibility in defining overall performance and achievement gaps.
These five key aspects of accountability a state had to identify in the waiver process were all included in NCLB school performance accountability. Under NCLB rules, states had varying levels of control over how each aspect would be implemented. The waivers expanded on this initial control and allowed for information gleaned over the last decade of NCLB to be incorporated into each state’s plan.
Focusing on accountability
The waivers include numerous state-level decisions that can be analyzed and evaluated (e.g., testing consortiums or weight given to proficiency measures). We focus on whether states (a) set different annual measurable objectives (AMOs) or performance targets for different subgroups of students, (b) identify super subgroups rather than (or in addition to) traditional NCLB subgroups, (c) incorporate test scores for subjects other than math and English/language arts (ELA) in accountability decisions, (d) determine a composite performance index (e.g., an A to F grade based on a combination of measures), (e) include any non-test-based measures other than graduation rates in performance calculations, and (f) use any measure of student growth in their Priority and Focus classifications or composite indices.These six decisions represent opportunities for states to make marked improvement over accountability under NCLB regulations or have been the center of public controversy since the waivers became public. We focus our attention on how states use these six decisions in the identification of low-performing (i.e., Priority and Focus) schools, as these are the only schools subject to consequential accountability under the waiver guidelines.
The first decision we consider is whether a state set different AMOs for different subgroups of students. States were allowed to create their own AMO structure or choose between two options: AMOs that increase in equal annual increments up to 100% proficiency by 2019-2020 or reduce by half the percentage of below-proficient students in the “all students” group and in each subgroup within 6 years. The argument against using different AMOs suggests that setting different goals for different groups of students lowers standards for historically low-performing groups rather than focusing on promoting the success of all students (Kober & Riddle, 2012; Southern Poverty Law Center, 2013). By contrast, setting different proficiency targets for each subgroup treats schools more fairly 2 : acknowledging the starting proficiency levels of subgroups within a state and reducing the identification of schools as low-performing based on student inputs rather than school processes (Polikoff et al., 2014).
Second, states were to determine how subgroups will be included in accountability policy. Under NCLB, states were required to disaggregate achievement by major racial/ethnic groups as well as by language, economic, and disability classifications. In the waivers, states maintained NCLB subgroups or decided to use one of two types of super subgroups. Super subgroups are either achievement-based (i.e., all students from the lowest quartile of performance, defined by the within-school or within-state distribution) or demographics-based (i.e., all students from historically disadvantaged NCLB subgroups). On one hand, using super subgroups has been criticized because it created the potential that the performance of students who need the most help may be masked by higher performing students, reducing state support for the most underserved students (Hernández, 2013). On the other hand, NCLB accountability was shown to target large, ethnically and economically diverse schools, largely because of the subgroup rules (Balfanz et al., 2007; Krieg & Storer, 2006; Sims, 2013). Aggregating performance in the form of super subgroups may reduce the rate of identifying highly diverse schools as low-performing and increase the fairness of accountability measures. Furthermore, the use of super subgroups in some cases increased the number of subgroup students for whom schools were to be accountable, because individual subgroups often did not have enough students to count for accountability purposes (Hernández, 2013).
Third, states had to identify which subject areas will be assessed and used for accountability. Similar to NCLB regulations, only math and ELA are required for identifying the lowest performing schools in the state. NCLB was frequently criticized for narrowing the curricular focus in schools to math and ELA (Berliner, 2011; Zhao, 2009). The waivers created the opportunity for states to expand the academic focus of accountability in all tested grades and include subjects such as science and history in school performance calculations.
Fourth, states outline how they plan to evaluate school performance using the new AMOs and performance indicators. Proficiency measures alone, such as those in NCLB, do not account for school processes that contribute to student learning (Heck, 2006; Krieg & Storer, 2006; Weiss & May, 2012). Flexibility guidelines require a measure of student growth be included in the calculation of school performance to reduce the misidentification of progressing schools and more appropriately identify and support chronically low-performing schools (USDOE, 2013). However, the policy allows for substantial flexibility in how a state identifies the lowest performing schools and, as such, not all states utilize a measure of growth for identifying Priority and Focus schools.
In line with the argument that proficiency measurements do not account for a school’s contribution to student learning, states were able to move away from identifying the lowest performing schools based on proficiency alone. Many states developed a composite index of performance measures, incorporating attendance and participation rate measures along with test performance to identify low-performing schools. The use of a composite index is the fifth decision we analyze in state waiver applications.
And finally, the sixth decision we explore is whether states have incorporated non-test-based measures into the identification process for low-performing schools. NCLB focused solely on test-based accountability. Opponents of NCLB-style accountability have argued that standardized tests are not the only important student outcomes and sole reliance on test scores does not acknowledge all learning that occurs within a school (Figlio & Ladd, 2008; Houston, 2007). To improve on NCLB accountability and expand the focus to include non-academic performance outcomes, states could consider measures of school performance such as college- and career-readiness indicators in the new system.
In sum, there is considerable flexibility within the waiver applications, and the required rules for accountability provide states the opportunity to implement unique and potentially innovative accountability reforms. This study will focus on how states measure performance for the process of identifying Priority and Focus schools. In the next section, we describe the data and methods we use to investigate descriptive relationships among states’ political and policy climates and the specific decisions they made within the accountability requirements.
Data and Method
Our analyses rely on numerous sources of publicly available data, which we describe below. We utilize linear probability models (LPMs) to conduct an exploratory analysis of six decisions state departments of education made in the accountability section of their respective ESEA flexibility waivers. We use LPMs because of their ease of interpretation and because the small sample size makes maximum likelihood estimation challenging. We use robust standard errors to account for the inherently heteroskedastic nature of aggregated state-level data. The six focal outcomes discussed above were identified through a process of coding each state’s method of identifying low-performing schools in the respective approved ESEA waiver (see Polikoff et al., 2014 for more details). Table 1 provides an overview of each decision by state.
States Choosing Each Focal Waiver Decision.
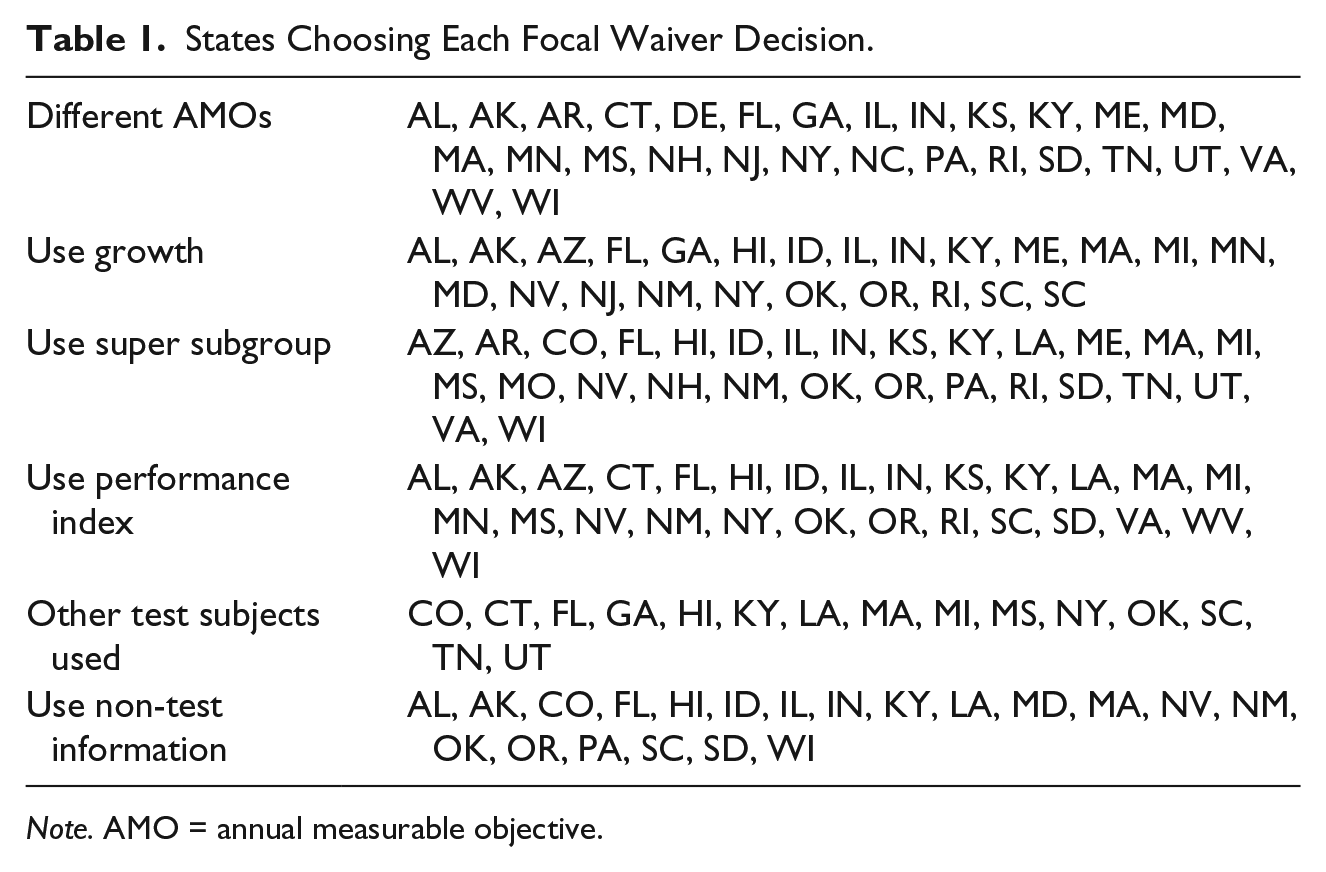
Note. AMO = annual measurable objective.
Independent Variables
We include six independent variables in our analysis to represent the education policy context within each state. First, we include two dichotomous indicators of education reform in the state. Our RTTT variable identifies whether the state received a grant during any round of the RTTT Assessment Program; this measure is taken from the USDOE website. Our dual accountability indicator reflects whether a state accountability system was implemented in addition to NCLB; we take this indicator from Dee and Jacob (2011). We consider these variables to be an indication of the state’s capacity for education reform and the extent to which the state already had in place an accountability system that might have contributed to their design decisions for the new waiver systems.
Second, we include a state demographic indicator using data from the National Center for Education Statistics (NCES). State demographics are represented by the proportion of students in grades K-12 who identify as a race/ethnicity other than White, non-Hispanic. We also tested the inclusion of prior achievement (the average of a state’s eighth-grade mathematics and reading National Assessment of Educational Progress (NAEP) mean scale scores in 2011) and the proportion of students who qualify for free- or reduced-price lunch in the state. Neither variable altered our results, improved model fit, or was significant in any of our six models. As such, we did not include these demographic variables in the final model to improve model parsimony.
Third, we include two variables that reflect state education spending. We examine the state’s education funding level by using the percentage of the education budget that is federally financed; this statistic is taken from the National Education Association’s Rankings of States and Estimates of School Statistics (NEA Rankings; 2010-2011). A state’s reliance on federal dollars not only captures the relative wealth of the state but is also a prominent explanation for state decisions aligning with federal priorities and policy mandates (Nicholson-Crotty & Staley, 2012; Shelly, 2012). We also include the state’s average per-pupil expenditure (PPE) adjusted for regional cost of living. This measure also comes from NCES. Based on the extant research, funding resources and the per-student funding allocations reflect the political leaning in the state: liberal-leaning voters are generally more willing to increase spending on public education (Burbridge, 2002). In addition, PPEs are operationalized as measures of a state’s resource capacity and thus represent the state’s ability to develop policy and provide supports within the education system (Weiss & May, 2012).
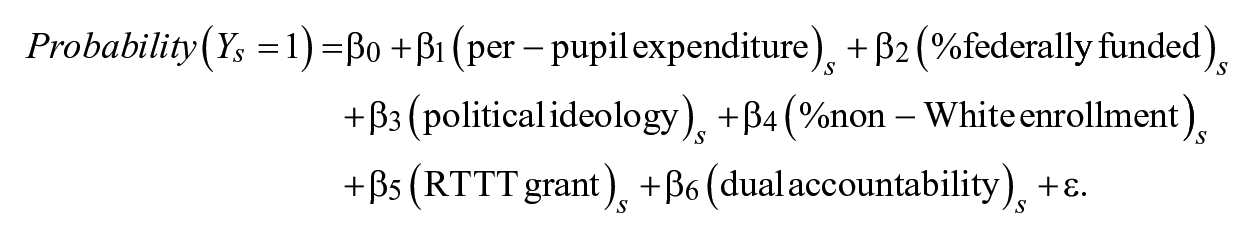
Our final predictor variable is a measure of the state government’s political ideology. The government ideology variable provided by Berry and colleagues (2010; Berry et al., 1998) uses a composite of the governor’s political party and the power of each political party (i.e., Democrats and Republicans) in a state’s government. The more liberal a state’s government, the higher the ideology rating a state receives. Descriptive statistics on the government’s political ideology variable and all other variables can be found in Table 2. 3 We use the natural log of adjusted PPEs and standardize the remaining continuous variables, while all dichotomous variables are coded 0 to 1. An example of our model is
Descriptive Statistics, Unstandardized Independent Variables.
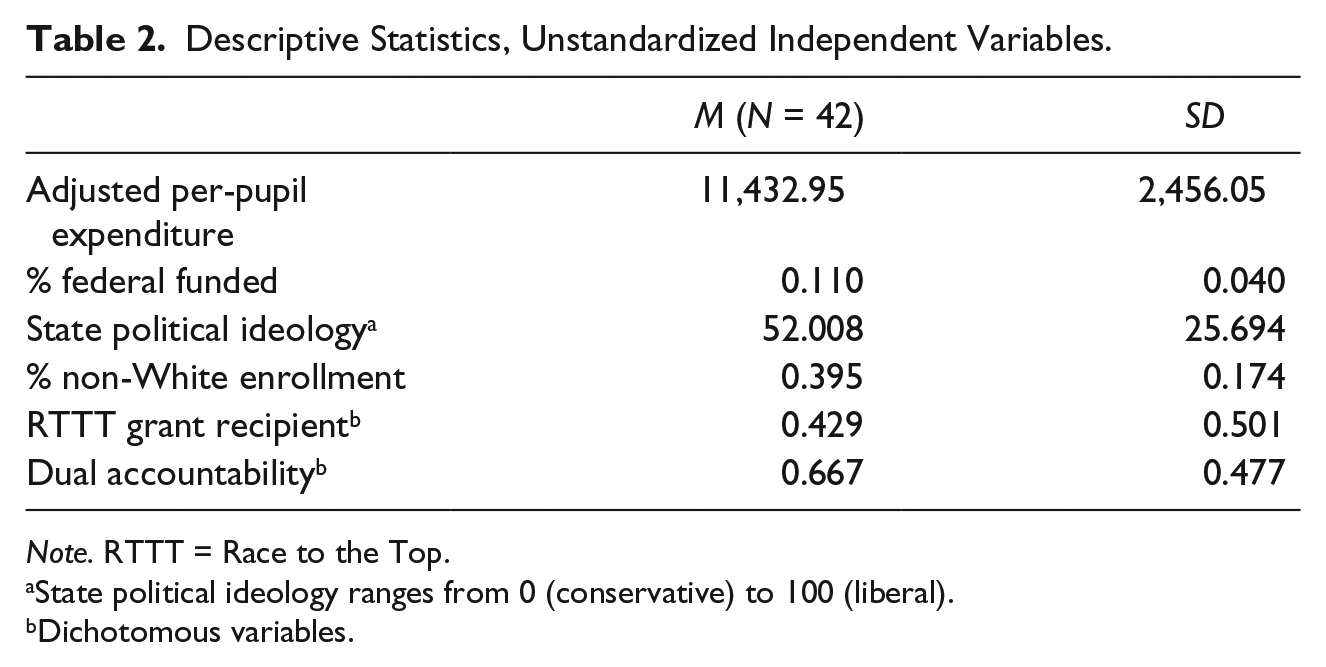
Note. RTTT = Race to the Top.
State political ideology ranges from 0 (conservative) to 100 (liberal).
Dichotomous variables.
Results
Our LPM results are shown in Table 3. To provide a closer analysis for each of our outcomes, we discuss the six models one at a time.
Results for Linear Probability Models.

Note. AMO = annual measurable objective; RTTT = Race to the Top.
p < .10. *p < .05. **p < .01. ***p < .001.
Different AMOs
For our first dependent variable, whether the state sets different performance targets for different groups of students, we find two significant associations. First, for every 10% increase in PPEs, the probability a state chooses to use different performance targets increases by 7.49 percentage points (p < .05). The average PPE in states with different AMOs is US$12,096, whereas in states maintaining the same performance targets for all students, it is US$10,107. As the use of different performance targets improves the fairness of accountability systems by reducing the influence of out-of-school factors on school accountability classifications (Polikoff et al., 2014), it appears that higher spending states choose to design fairer accountability systems. If we take state spending as a measure of capacity for improvement (Weiss & May, 2012), this finding could indicate that states with more capacity in their systems recognize the fairness benefits to schools for setting more reasonable targets for different groups.
We also find that for a one standard deviation, or 17 percentage point, increase in the percent of non-White students within a state, the probability of using different performance targets decreases by 22.9 percentage points (p < .01). States that chose different AMOs had an average non-White enrollment of 35.41% compared with an average 47.67% non-White enrollment in states not utilizing different AMOs. This result is interesting given the relationship between school demographics and the probability of failing to meet performance targets under the NCLB system (Balfanz et al., 2007). By exercising the option to set differential performance targets, states can potentially reduce the burden of accountability systems on their more diverse schools. However, our finding isolates an interesting interaction among research, policy, and politics.
The research community has time and again documented that if schools are to be held accountable for student outcomes, then the performance measures need to account for the different learning needs of students from various backgrounds (Barlevy & Neal, 2012; Ehlert, Koedel, Parsons, & Podgursky, 2013). Politicians and policymakers have to answer to constituents, who may see the use of differential performance targets as lowering the standards for minority, low-income, and low-achieving students. The negative correlation between the percent of non-White students in a state and the probability of setting different performance standards suggests that states with less diverse enrollments may have less political pressure to set consistent targets across groups.
Super Subgroups
A state’s PPE is significantly associated with the use of super subgroups in ESEA waiver applications, including both demographic and achievement-based subgroups. For a 10% increase in per-student spending, a state’s probability of using super subgroups, rather than (or in addition to) NCLB subgroups, decreases by 9.01 percentage points (p < .01). To provide additional context, the average PPE, adjusted for regional cost of living, for states using super subgroup is US$10,961. In states using only traditional NCLB subgroups, the average PPE is US$12,376. A potential explanation for the relationship between spending and the use of subgroups may be that using PPEs as a measure of a capacity, states spending less money per students may have neither the resources or personnel to provide more sophisticated analyses for all disaggregated subgroups nor the resources or capacity to address low-subgroup performance that is identified.
We also find that more liberal states are more likely to utilize super subgroups (B = 0.151, p < .05). There are several possible explanations for this finding. For example, liberal states may want to shift the focus from one particular subgroup (e.g., Hispanic/Latino) to a more inclusive focus on historically underserved groups (i.e., students from all ethnic/racial minority groups); this way, the “blame” for being identified as a low-performing group cannot be put on a single subgroup of students within a school. Alternatively, perhaps liberal states are more likely to recognize the value of more subgroup students being recognized under accountability and less concerned about the particular subgroup label.
The final finding for this outcome is that, at the p < .10 level, our results suggest that states which rely on federal funding for a larger proportion of their education spending have a higher probability of utilizing super subgroups rather than (or in addition to) traditional NCLB subgroups. State dependence on federal dollars for education may signal a state’s willingness to implement federally developed programs (Shelly, 2012). The federal government provided states the opportunity to use super subgroups, and those states with larger funding reliance on federal dollars may have seen this subgroup change as one way the federal government would be more likely to approve the waiver.
Tested Subjects
A major criticism of NCLB was that it incentivized schools to narrow the curriculum around the subjects of math and ELA (Zhao, 2009). States were given flexibility to incorporate any tested subject into their school accountability system through the waiver process. We find that a state that received RTTT funds has a 32.4 percentage point (p < .05) higher probability of using additional subject areas in the identification of low-performing schools. This may be due to the RTTT grants’ focus on science, technology, engineering, and mathematics. Of note, we do not find a relationship between PPE and the use of subjects other than math and ELA. A common argument against the use of subjects other than these two is that it costs money to develop new tests to be used in an accountability system. However, we do not find that states that spend more money on education in general are more likely to use other subjects than math and ELA in their accountability system.
Performance Index
In the model examining the use of a performance index for identifying the lowest performing schools within a state, we find associations that are significant only at p < .10. States that rely on federal funding for a larger proportion of their education spending have a higher probability of using a composite index. For a one standard deviation increase (4%) in proportion of education funded from federal dollars, the probability of a state using an index increased by 11.1 percentage points (p = .083). We also find that states maintaining a dual accountability policy have a 28.4 percentage point higher probability of using an index. The finding that the existence of a dual accountability system is associated with an increased probability in using an index is not surprising as states with prior accountability systems often used composite indices (e.g., Florida). Perhaps, given the relatively short window for waiver submission, states that did not have preexisting accountability systems did not have time to create composite indices. In addition, prior research suggests that states develop policy in cumulative ways, adding on to what already exists rather than creating something new (Furgol & Helms, 2012) that supports the idea that states with indexes prior to NCLB used indexes after.
Non-Test Measures
Similar to the results for the use of a composite index, our model exploring the use of non-test measures for accountability yields one relationship, and it is significant only at p < .10. For every percentage point increase in reliance on federal education monies, a state’s probability of using non-test-based measures for identifying low-performing schools increases by 13.1 percentage points (p = .070). Again, reliance on federal dollars may signal willingness to comply with federal policy initiatives (Shelly, 2012). States using larger proportions of federal monies to finance education within the state may have seen the use of non-test-based measures as another way the USDOE would be more likely to approve the waiver application. Finally, similar to our results for including test subjects other than math and ELA, the amount of money a state spends per student is not related to extending its accountability system beyond achievement tests.
Growth Models
We find no significant associations between state policy characteristics and those states that use a measure of growth in the identification of low-performing schools. Some interest groups have been critical of the reliability and validity of growth models in accountability systems (Harris, 2011). We are surprised that no significant differences emerged between liberal and conservative states regarding the use of growth models, as these interest groups tend to have more influence in states that are more liberal.
Discussion
Both state and federal education policy is cumulative, building off previous policy rules (Furgol & Helms, 2012; McDonnell, 2005). The USDOE offered states substantial incentives to apply for an ESEA flexibility waiver, including release from NCLB’s impending proficiency deadline and the ability to create a state-specific school performance system. However, federally driven policy initiatives must also provide states the necessary incentives and structures to move away from, rather than replicating, prior policy design issues and problems. Prior analysis of the waivers suggests that the accountability design decisions made by states offer a mixed portfolio of improvements and replications of issues known from NCLB (Polikoff et al., 2014). In other words, the innovation cited as a driving force behind the flexibility offering (see Duncan, 2011) did not bear out in the design and implementation of the states’ accountability systems. Instead, the exploratory analysis presented in this article suggests that some state policies, in existence prior to the ESEA flexibility offering, are associated with waiver design decisions made by states. For example, even though a major criticism of NCLB, only one third of states chose to incorporate assessments in subjects other than math and ELA into the new accountability system, and two thirds of these states were RTTT grant recipients. Without aligning incentives with the desired changes in policy, states may be more likely to stick with which they have already spent time and resources developing, rather than work toward major changes and innovative reforms. Furthermore, given the quick turnaround for states’ waiver applications, it is unclear whether states had the internal capacity to develop quickly new forms of assessments and accountability systems.
The literature on federalism in education tends to either present large theoretical arguments about the relationships between levels of government (Manna, 2007; Grissom & Herrington, 2012) or an analysis of a specific federal policy (McGuinn, 2012; Sunderman & Kim, 2007). These studies are helpful, but too often respond to a specific intervention that may or may not be used in the future. Few studies thoroughly examine the tension between federal policy goals and state political interests. This study suggests the need for researchers to identify the best way of measuring the relationship between state decision making and state political environments within the federal system. We hope our article is a step in this direction, as educational researchers continue to capture state political factors using non-static measures. The aim in this line of inquiry is to better predict future state responses to federal policy, which is especially important given the recent reauthorization of ESEA.
In discussions of education policy, some researchers suggest that flexibility in accountability design should be provided to states but that parameters on the flexibility should be included (see Davidson et al., 2013). Without limits to the options and decisions available, there are likely to be as many different responses to the call for new accountability systems as there are states. Our analysis provides some insight that states possess different levels of capacity to develop and implement policy, leading to varying degrees of improvement over NCLB mandates. The association between PPEs and both the use of different performance targets for different student subgroups as well as the use of super subgroups suggest that states with larger resource pools may make more strategic decisions in developing new policies. As the USDOE provides opportunities for states to create tailored accountability policy, support must be provided to ensure all states have the resources necessary for innovative reform to be advanced. Developing accountability policy for the purpose of getting resources and supports to the most underserved students within a state requires policy which aligns the performance measures with the desired outcomes.
Similar to the policy being influenced by available resources and state capacity, education policies are not developed in apolitical environments. As such, some states are more or less inclined to choose particular design options for reasons other than research-supported evidence. The use of separate performance targets for different racial/ethnic, economic, and ability groups within a state has been controversial, even facing legal action in some states (e.g., Florida). In addition, we see that more liberal-leaning states have higher probabilities of using super subgroups for performance calculations. Although the use of these differentiated performance targets and new subgroup classifications to fairly and validly identify low-performing schools has not been studied, our findings that they are associated with political dynamics within a state provide cautionary warnings for federally driven policy.
Extant research suggests that within-state educational governance structures incentivize differential decision making in the design of accountability systems (Brewer, Killeen, & Welsh, 2013). The USDOE must acknowledge and consider political realities within states when offering mass-scale flexibility. Without boundaries or specific requirements, states may develop systems that are more responsive to the political tension within a state rather than develop a policy which addresses and minimizes issues identified in earlier accountability systems. We recognize the benefits of allowing variation among state accountability systems, but worry that the waivers may have overcompensated to address limitations of NCLB. Federal policy in the future should look to strike a balance between the one-size-fits-all problems of NCLB and the wide variance in accountability systems under the waivers. Should the federal government offer states flexibility from future ESEA mandates, we recommend the flexibility be more prescriptive to ensure states choose systems that reliably, validly, and fairly identify low-performing schools. Structuring flexibility options would allow for the development of state-level policies that reflect research-informed design rather than a state’s capacity to work through complex analysis or political pressures to satisfy constituents at the cost of utilizing appropriate school performance measures.
Limitations
This study examines the political factors that were associated with various ESEA waiver outcomes. However, much of the political negotiation occurred outside of the purview of the public. As a result, we identify important variables at the state level. Future research should attempt to provide qualitative analyses of the state negotiations to explore additional factors that influenced waiver decisions, bringing to the forefront an understanding of the policy-making process within a state.
A second limitation, common to all state-level analyses, is our limited sample size. This limitation restricted the statistical modeling possibilities. Finally, 35 states have already gone through a waiver renewal process with the USDOE (USDOE, 2014a). States with waivers expiring in 2015 are eligible to apply for extensions from NCLB mandates through 2018 (Klein, 2015; USDOE, 2014b). During these flexibility renewal processes, states have been able to modify aspects of their initial waiver to ensure compliance with the USDOE’s requirements for extension. Our work focuses solely on the initially approved waiver in each state and does not address any subsequent changes made to the waivers.
Conclusion
Executive leadership of the USDOE initiated a flexibility offering from NCLB accountability policy following numerous years of congressional inaction to reauthorize the ESEA. For states to receive a waiver from NCLB rules and regulations, five specific aspects of accountability policy needed to be explicitly addressed. These five aspects include the academic subjects included in the calculation of school performance, the setting of annual targets for schools, the types of subgroups a state will use in disaggregating performance, how those subgroups will then be used in calculating school performance, and the ways in which low-performing schools will be identified. The accountability systems created and decisions made by states through the waiver process demonstrate great state-to-state variation (Polikoff et al., 2014).
The ESEA waivers provide an important new development within educational policy. The federal government, which has been expanding its influence through mandates, has shifted to allowing states to negotiate accountability plans through this waiver process. It is unclear how this will affect the future relationship between federal and state government officials. With Congress still overdue to reauthorize the ESEA, it will be interesting to watch how the legislative branch inserts itself into these executive branch negotiations.
As the USDOE continues to emphasize flexibility from NCLB, as well as policies that promote competition between states, these results suggest that prior state policies may be associated with accountability decisions moving forward. For researchers, this suggests that future analyses will need to tease out differences across states when evaluating federal policies. Policymakers should also take note, as these results suggest that prior state political factors may influence how state policymakers react in future negotiations with the USDOE.
Footnotes
Declaration of Conflicting Interests
The author(s) declared no potential conflicts of interest with respect to the research, authorship, and/or publication of this article.
Funding
The author(s) received no financial support for the research, authorship, and/or publication of this article.