
Abstract
Repeated exposure to blast overpressure in occupational settings has been associated with changes in cognitive and psychological health, as well as deficits in neurosensory subsystems. In this work, we describe a wearable system to simultaneously monitor physiology and blast exposure levels and demonstrate how this system can identify individualized exposure levels corresponding to acute physiological response to blast exposure. Machine learning was used to develop a dose–response model that fused multiple physiological measures (electrooculuography, gait, and balance) into a single risk score by predicting the level of blast exposure on held-out subjects (Fused model, R = 0.60). For our system, cohort, and environment, we found that blast events with peak pressure levels as low as 0.3 pound per square inch (PSI) could be related to physiological changes with blast exposure. We also identified an individual subject with longitudinally increasing reaction time scores who consistently showed a rapid and anomalous change in physiology-based risk scores after exposure to low-level blast events. Our results suggest that wearable technology may be viable for measuring physiological changes that are related to occupational blast exposure. Ultimately, this approach might be used to prevent neurotrauma from repeated exposure and to help set limits for a population or on an individual basis.
Introduction
Military and law enforcement personnel are routinely exposed to repeated blast overpressure in training and operational settings. Often, these exposures are referred to as low-level blast (LLB) because their effects are considered subclinical. The range of what constitutes LLB in pounds per square inch (PSI) is not well defined, but a range of 3–6 PSI or less is often used in the literature.1,2 The relationship between LLB and negative brain health outcomes is also unclear, but several studies have reported significant changes in military populations.3,4 Neurosensory systems in the brain, in particular, such as oculomotor,5,6 vestibular,7,8 and auditory function,9,10 are believed to be particularly sensitive to LLB. Overexposed individuals are also believed to have an increased risk of developing anxiety disorders, depression, and mental health disorders.11–13
Despite evidence of brain health risks of blast exposure, it remains challenging to establish safe exposure limit guidelines. Currently, the U.S. military guideline for maximum exposure sets a limit of 4 PSI. 14 This limit was derived from auditory injury, specifically the risk of rupture of the tympanic membrane.15,16 In providing recent exposure limit guidance, the U.S. Deputy Secretary of Defense also acknowledges that the underlying medical science is evolving and that future updates will be needed. 14 One major limitation of a maximum peak pressure threshold is that it does not specify the number of rounds or exposures that are acceptable; according to this standard, an individual can acceptably be exposed to an unlimited number of rounds at 3.99 PSI, but a single exposure at 4.00 PSI is considered unacceptable. 17 Although an important first step, a single exposure threshold is incomplete as a safety measure to protect brain health in environments where repeated lower-level exposures occur. An accumulating acoustic dose measure may be required instead.
Personal blast exposure has to date been quantified in multiple ways. An individual’s history of blast exposure can be estimated based on questionnaires or service history e.g., Generalized Blast Exposure Value (GBEV). 18 Additionally, there are three main approaches for more directly quantifying short-term blast exposure: estimating or counting the number and type of rounds fired for a specific weapon, measuring blast pressures directly at fixed locations, or measuring blast pressures on the body. In other occupational sound exposure use cases, such as industrial noise exposure, a dosimetry-based approach is often preferred, where each individual has a device to measure the exposure.19,20 Personal exposure dosimetry can also account for the complexity of the environments where blast exposure occurs, including factors such as weapon type, physical proximity to the blast event, or effects of rigid structures such as walls or enclosures, which can significantly impact blast overpressure levels.20,21 Personal, wearable dosimetry also enables the development of accumulating dose measures.
Unlike a maximum single-exposure measure (e.g., peak pressure), accumulating blast exposure measures consider the time-history of exposure and incorporate both overpressure levels and the quantity of blast events. Furthermore, they can be reported as a single, cumulative score for an individual training session. Despite these apparent advantages and the growing availability of dosimetry devices that record and measure individual blast events, a lack of a gold-standard brain health outcome “response” biomarker has challenged this adoption.
Determining safe exposure limits based on cumulative dose measures will require tools that are sensitive and specific to mild brain injury as it occurs. 22 In order to detect if a potentially injurious event has occurred, an effective decision tool must be able to rapidly assess any changes in an individual’s physiological state following exposure. This is critical for preventing impairment and enabling recovery.23,24 Allowing individuals to continue to be exposed after injury can affect their performance in critical operational scenarios through decrements in reaction speed and executive functioning2,25,26 and may increase the risk of further injury.
In this article, we monitor physiological state using a wearable, patch-based sensor (see Reddy 27 for a previous assessment of the technology) to measure eye movements and body movements involved in balance and gait. In a laboratory setting, eye-tracking technology has demonstrated the ability to detect subtle changes due to brain injury 28 or cognitive function. 29 Wearable tracking of blinks and eye movements via electrooculography (EOG) has been used in field environments to detect changes due to blast exposure. 6 The emergence of mobile devices with integrated accelerometers has enabled simple quantitative measures of balance, and this has become an effective method to monitor individuals with mild traumatic brain injury,30,31 and to detect changes in gait and balance due to blast exposure. 8 Wearable technologies are becoming ubiquitous and can be used to detect conditions such as fatigue 32 and cognitive changes or brain health disorders such as Parkinson’s disease, 33 dementia, 34 and mental health. 35 These approaches for physiological monitoring typically rely on machine learning techniques, which are needed to derive physiological biomarkers from continuous wearable sensor data. 23 Current applications of wearable technology for blast exposure monitoring are generally restricted to measuring exposure levels using pressure sensors, 36 rather than measuring the effect of exposures on physiological status.
Despite the challenges and considerations involved in quantifying LLB exposure and brain health outcomes, using wearables to monitor exposure alongside physiology has significant potential benefits. 23 The main practical benefit of a combined physiology/exposure wearable system is that it can be used to minimize potential injury by notifying an individual in real-time that their risk, indicated by physiological change in response to an exposure, exceeds a threshold, as illustrated in Figure 1.
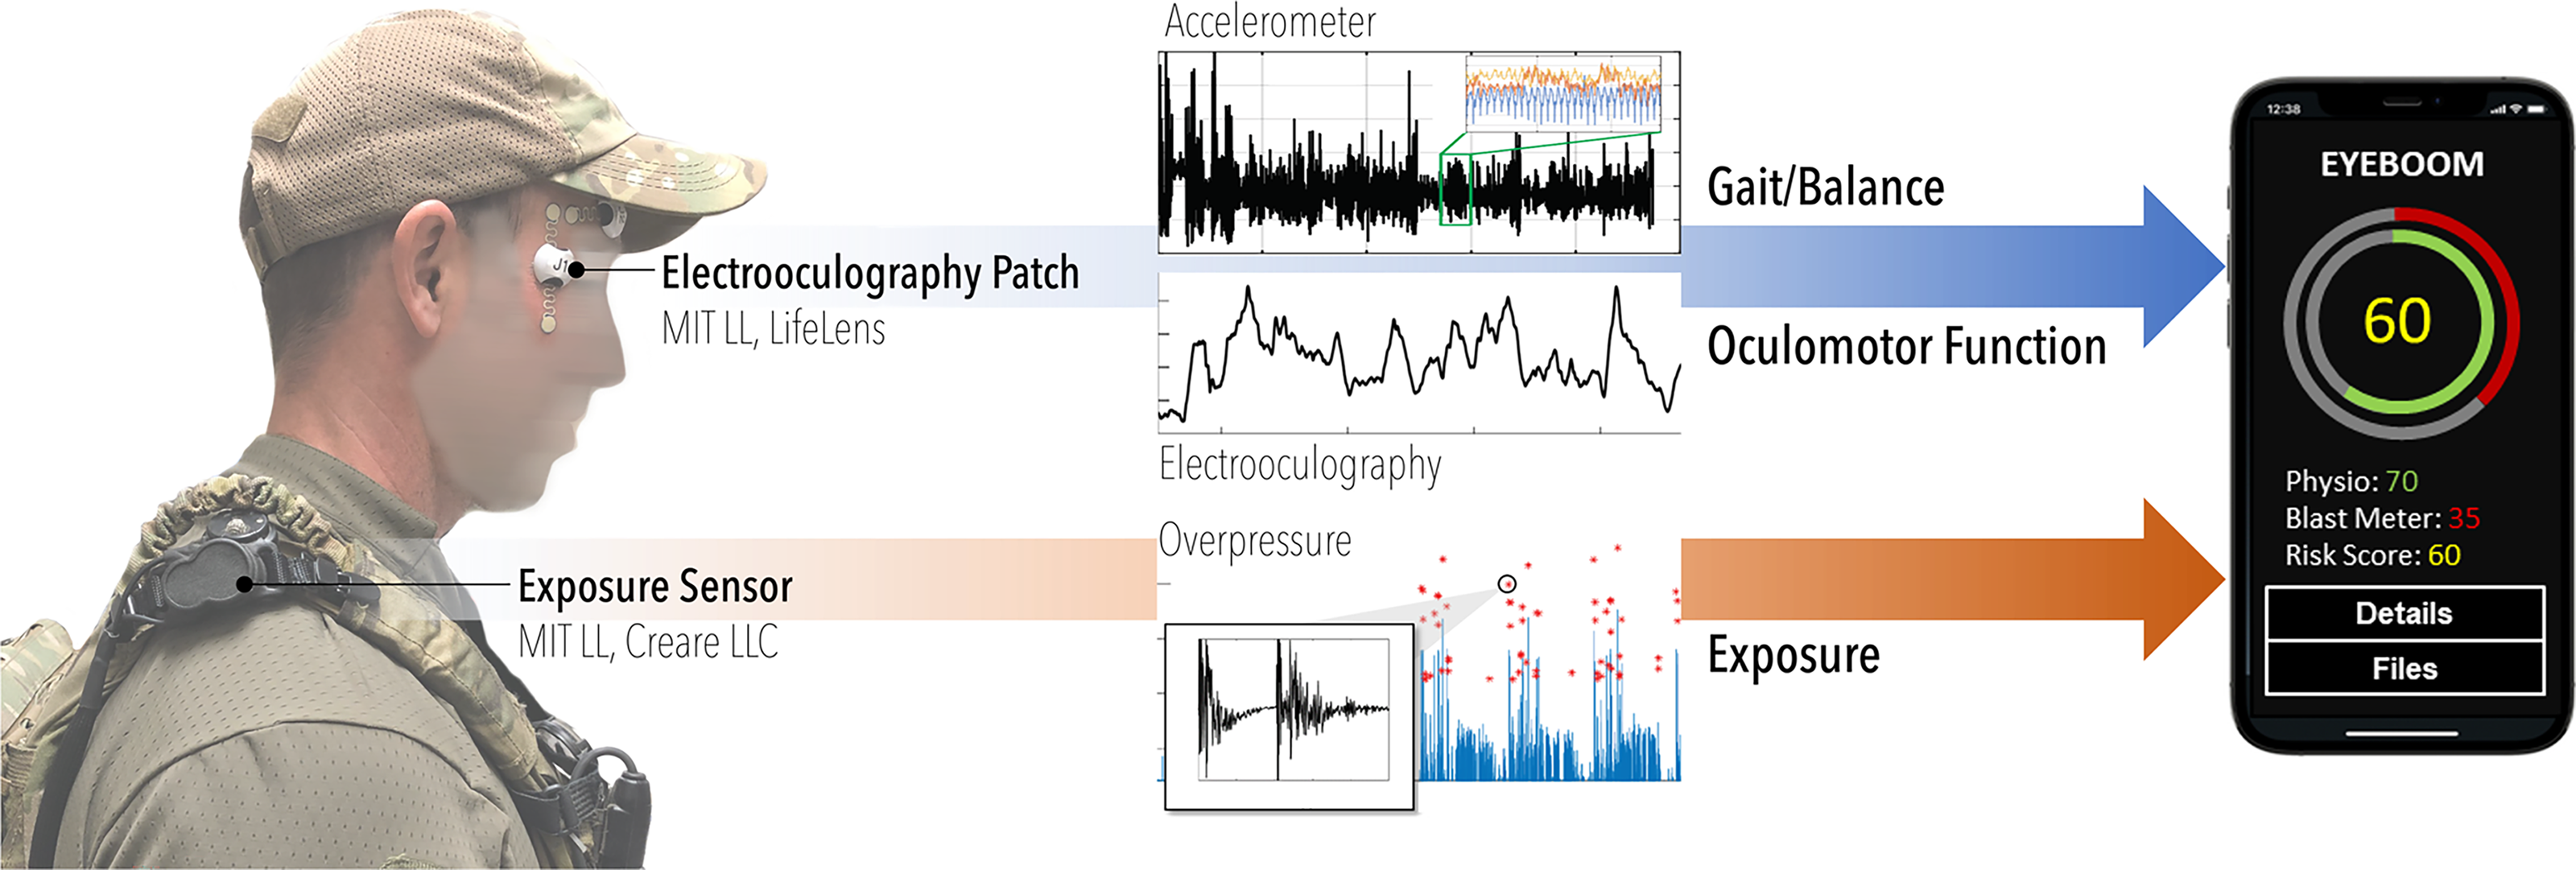
A wearable physiology and exposure system for measuring blast exposure risk, and notional smartphone application to provide real-time, continuous risk assessment. A low-level-blast exposure sensor is placed on the shoulder to capture incident pressure, and an EOG patch is worn near the eye to capture eye movements and blinks, as well as gait and balance.
In a previous effort with the U.S. Special Forces during urban breaching training, we showed that continuous eye and body movements are individually predictive of cumulative blast exposure pressure energy.6,8 Here, we extend that approach to a larger dataset collected with improved sensor systems more suitable for austere environments. We also develop new combined dose/response models that fuse multiple physiological measures into a single “risk score” and correlate these scores with cumulative LLB metrics to identify thresholds for significant blast events. Finally, we compare our results against independent neurocognitive assessments to identify individuals who may be at elevated risk of injury.
Methods
Study population
Special forces training environments offer a unique opportunity to monitor the effects of repetitive exposure to overpressure to prevent brain injury. Instructors or “cadre,” who have prior experience in close-quarters battle techniques, including interior and exterior breaching, are exposed to a significant number of LLB overpressure events while observing trainees. They can serve on an assignment spanning multiple years and are responsible for instructing multiple courses per year. In addition to overpressure exposure from explosives, instructors are in close proximity to small-arms fire and other munitions. A total of 28 instructors participated in a voluntary data collection effort as part of a program evaluation effort, which included overpressure dosimetry, oculomotor function, gait and balance function, hearing function, symptom reports, and cognitive performance monitoring.
Blast overpressure monitoring
Special forces instructors donned a blast monitoring device “Monitoring Noise in-ear and On-body for Service person Exposures” (MNOISE) to continuously monitor exposure to LLB overpressure. 37 This device continuously measures unweighted time-average sound pressure levels (e.g., LZeq) using a custom two-microphone setup to increase the dynamic range, with a maximum peak pressure limit of 5.2 PSI (185 dB SPL). Overpressure events above 0.03 PSI/140 dB SPL trigger the recording of two raw waveforms, one from each microphone that are recorded in units of Pascals. Both continuous sound levels and blast overpressure event recordings are extracted as files from the MNOISE and processed using custom MATLAB code to compute cumulative blast exposure measures. 37
Artifacts due to physical knocking or electrical artifacts can potentially be a significant source of contamination in blast dosimetry data. In this study, we detected and removed artifacts from our dataset as a preprocessing step by quantifying consistency between the two microphones. Sessions with too many detected artifacts (e.g., greater than 20) were discarded due to the potential for remaining undetected artifacts to be confused as significant blast events (15% of sessions were removed this way).
Cumulative measures of exposure were computed by accumulating previously studied per-event acoustic measures1,6 (i.e., LZeq,8hr, Peak Impulse, Peak Pressure) and a supra-threshold event index to generate accumulating measures and cumulative session totals (i.e., LZeq,8hr, Cumulative Peak Impulse, Cumulative Peak Pressure, Cumulative Blast Count). For example, an accumulating “Peak Pressure” measure was computed by adding (cumulative sum) per-event peak pressures over time by including blast events above a set of peak pressure thresholds. Both accumulating measures and session totals for each measure were compared with physiology.
Continuous body and eye movement tracking
Alongside the MNOISE, instructors donned a wireless electrode patch and sensor hub (Lifelens Technologies Inc), together referred to as a “kit,” (Fig. 1). The LifeLens patch adheres directly to the skin and can be used for several hours continuously. A sensor hub attaches to the patch that contains an accelerometer and records electrical signals from the body, stored as raw signal waveforms for offline analysis. These waveforms can be processed to assess different physiologies, depending on hub placement. Here, we placed the patch and hub next to the eye in vertical and/or horizontal orientation for eye tracking and blink detection via EOG measurements. Subjects were given the option to wear one or both patches on each eye, resulting in a few distinct datasets: two vertical EOG measurements for each eye, one vertical and one horizontal measurement for each eye, and in a few cases, two horizontal patches, one above each eye. Depending on the choice of orientation, blink features (vertical orientation) and saccade features (both vertical and horizontal) were extracted from the continuous EOG signals. LifeLens kits were generally applied 30 min to 1 h before the start of each day’s training session and were removed at the end of the session. In some cases, individuals wore the kits overnight and throughout the course of training the next day. Accelerometry and EOG data were later extracted after the sensor was removed and stored for postprocessing using a custom LifeLens data interface.
ANAM assessments
The Automated Neuropsychological Assessment Metrics (ANAM) is a computerized cognitive test battery that is used to measure the cognitive effects of injury, exposure, or illness. 38 The ANAM consists of a flexible library of cognitive tests and behavioral questionnaires that provide performance-based measures of neuropsychological functions. A version of ANAM is approved for widespread use in DoD, is administered on a laptop, and takes approximately 25–30 min to complete. A condensed, 7-min battery was offered to the subjects in this study on a tablet computer that was generally administered both before and after training. The tests included Simple Reaction Time, Go/No-Go, Spatial Processing, and Memory Search. This ANAM battery was voluntary and self-administered.
Gait and balance features
Gait and balance features were computed from 100 Hz 3-axis accelerometry data from the vertically oriented LifeLens sensor, using methods similar to those described in Williamson. 8 Accelerometry data were segmented into gait and low-movement (LM) periods to distinguish changes over time in head movements that occur during ambulation from those that occur during periods of standing or sitting.
Gait and LM bouts were segmented primarily based on the variance of acceleration magnitudes, computed in sliding 10-s windows. Gait bouts were detected when windowed variances were suprathreshold (σm2 [t] > 0.03). Suprathreshold time intervals were then joined together if separated by subthreshold intervals of 15 s or less. The resulting gait bouts were then divided into contiguous 5-s frames. Gait features were extracted from a gait frame only if it passed a periodicity test: The first principal component of the three accelerometry axes in the 5 s window was computed, and its autocorrelation peak within a plausible step duration range of 0.35–0.85 s was required to have a height and peak prominence of at least 0.2.
The gait features extracted from each 5 s frame were based on the eigenspectra of high-dimensional correlation matrices that were constructed with time delay embedding (TDE) at five delay scales. There are seven time delays at each scale, which when combined with three accelerometry axes results in correlation matrices with dimensionality 21 × 21. The 5 delay scales contain delay spacings of 30, 70, 150, 310, and 610 ms. In a given delay scale, the TDE eigenspectra represent acceleration time-frequency dynamics via the shape of the time-delay scatter at that scale. By using multiple scales, the method represents dynamics at multiple time-frequency bands. The TDE technique is described in Williamson. 8 The TDE features, concatenated across 5 delay scales, have total dimensionality of 105. This dimensionality was reduced using PCA into 20 principal components, which explain 99% of the total variance in TDE features.
LM bouts were detected when windowed variances fell between two thresholds, 0.001 < σm(t)
2
< 0.01, across an interval of at least 30 s. These thresholds constrain activity to a lower level of acceleration variance, which is consistent with LM activities such as standing or sitting. Balance dynamics were quantified using the acceleration path length (PL) feature, which was extracted from contiguous 5-s frame within LM bouts. Given a set of n = 500 accelerometry vectors in a single frame, {xi,yi,zi}, the PL for that frame is

Because LM bouts were segmented based on a fixed range of acceleration magnitude variance, higher PL values should occur when a greater proportion of dynamics occurs at high time frequencies.
Blink and eye tracking features
Blinks and saccades were detected from 500 Hz EOG signals. Blinks were detected using a single vertically oriented EOG, and saccades from paired vertical and horizontal EOG. The signals were bandpass filtered from 0.1 to 10 Hz using a third-order Butterworth filter. This frequency range was selected to enable detection of blinks, which have a typical duration of 100–400 ms, while attenuating EOG activity at higher frequencies. 39 Periods of the filtered signal where the power was greater than 2.5 times the 5-min moving median were marked as artifacts and excluded from analysis, a method derived from Brunner. 40
The bandpassed vertical EOG was processed using a continuous wavelet transform with a Haar wavelet at scale 80, a resolution suited for the frequency range of blink signals. 41 Negative and positive peaks of the wavelet transform were detected based on a minimum peak width of 200 ms and a height (in negative and positive directions) above the 95th percentile. Matched negative and positive peaks were identified as blinks if they were separated by less than 200 ms. These parameters were selected to maximize the ratio of true blink detections to false positives in an internal analysis of a subset of hand-labeled data. For identified blinks, the feature used by the prediction algorithm was the blink duration, defined as the duration of the local EOG peak at half the peak amplitude, based on bandpass filtering of the original EOG signal between 0.1 and 25 Hz.
Saccade features were obtained from a subset of subjects who wore paired vertical and horizontal EOG sensors. The same bandpass filtering and artifact removal was performed as blink processing. The horizontal filtered EOG signal was linearly interpolated to be synchronized with the vertical EOG signal. First, the general time points of potential saccades were detected where change points in the horizontal filtered EOG were found, based on a threshold equal to the global standard deviation of the signal. Next, the horizontal signal was smoothed using a 50 ms moving average, and the absolute velocity was computed based on the absolute value of the discrete first-order derivative. The precise saccade time points were determined based on the maximum absolute horizontal velocity within a 50 ms window. The saccade amplitude was computed as the absolute difference between the filtered horizontal EOG at the start and stop of the saccade window. If the saccade amplitude was less than 0.25 times the global standard deviation of that signal, and if the correlation between the filtered horizontal and vertical EOG signals within the saccade interval was greater than 0.6, then the saccade was positively identified. The saccade amplitude feature was used by the prediction algorithm.
Feature change score
A method is next implemented to register changes in physiology features over time, relative to the recent history of variability for each feature. First, the features were smoothed to capture a running estimate of their local-time mean value. Gait and balance features were extracted opportunistically from temporally dispersed gait and LM frames. The running mean of these features was computed as the average across the most recent 30 gait or LM frames. Eye blink and saccade features were computed more frequently, based on the detection of eye blinks and saccades. The running mean of these features was computed across the most recent 20 blinks or saccades.
Next, individualized changes in the features were computed over time, relative to the mean and standard deviation of the features from each subject’s recent history. This online change-detection technique was originally developed for detecting physiological changes that predict heat stroke.
42
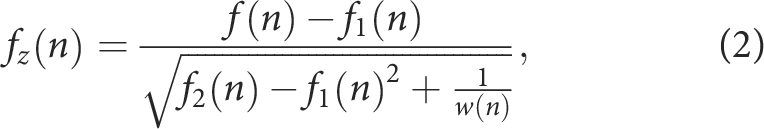
In this method, online z-scoring is computed to detect change in a time series variable, f(n), where n indexes the time step number. Change in the variable relative to its mean and standard deviation is quantified by using recursive filtering to track the first and second moments of the time series, f1(n) and f2(n). Then, f(n) is mapped into an instantaneous change score via

Mapping feature changes into risk scores
The ability to model blast exposure level from feature change scores was evaluated using leave-one-subject-out cross-validation training and testing of a regression model. All sessions from the same subject were assigned exclusively either to a training or a testing fold. A session was included for each modality only if the feature data spanned at least a 1-h duration. In addition, gait and balance sessions were included only if there were at least 25 gait and balance frames detected. Saccade features were extracted only in the subset (roughly half) of sessions in which there were two orthogonally positioned EOG sensors (horizontal above the eye and vertical near the temple).
The regression model uses an ensemble of Gaussian mixture models (GMMs), in which each element of the ensemble is trained to discriminate higher exposure from lower exposure, based on multiple exposure level thresholds that partition the training data into two classes. The ensemble across the set of training data partitions is a GMM staircase. The same GMM parameters were used as in Williamson, 8 except each GMM was defined with 5 Gaussian components instead of 10.
Seven GMM staircase partitions were used based on the following percentile thresholds of the blast exposure outcome measures, yt, in the training set: {12.5,25,37.5,50,62.5,75,87.5}. The risk score produced by the GMM staircase for each feature modality is a log-likelihood ratio, which is based on the sum of likelihoods across the ensemble of higher and lower exposure models, trained on the set of yt thresholds.
Multimodal fusion
Continuous risk scores were computed for each individual feature (e.g., blink rate) and subsequently fused at the session level (Fig. 2). We collected blast dosimetry from 20/28 subjects and physiology measurements (accelerometry and EOG) from 21/28 subjects. We restricted our analysis to dosimetry sessions in which at least one hour of both accelerometry-based balance features and EOG-based blink features were extracted, resulting in the inclusion of 91 sessions from 18 subjects. Gait features were extracted from a subset of 79 of these sessions (18 subjects), due to the requirement for a sufficient amount of detected gait behavior. Saccade features were extracted from a subset of 37 of these sessions (13 subjects), due to the additional requirement that the subject had to wear vertically and horizontally oriented sensors at the same eye. Fusion results for all feature combinations were done with the same overall set of 91 sessions. Fusion scores were computed by averaging the risk scores (log-likelihood ratios) from all features available for each session. In sessions in which gait and/or saccades were not available, they therefore did not contribute to the risk score.
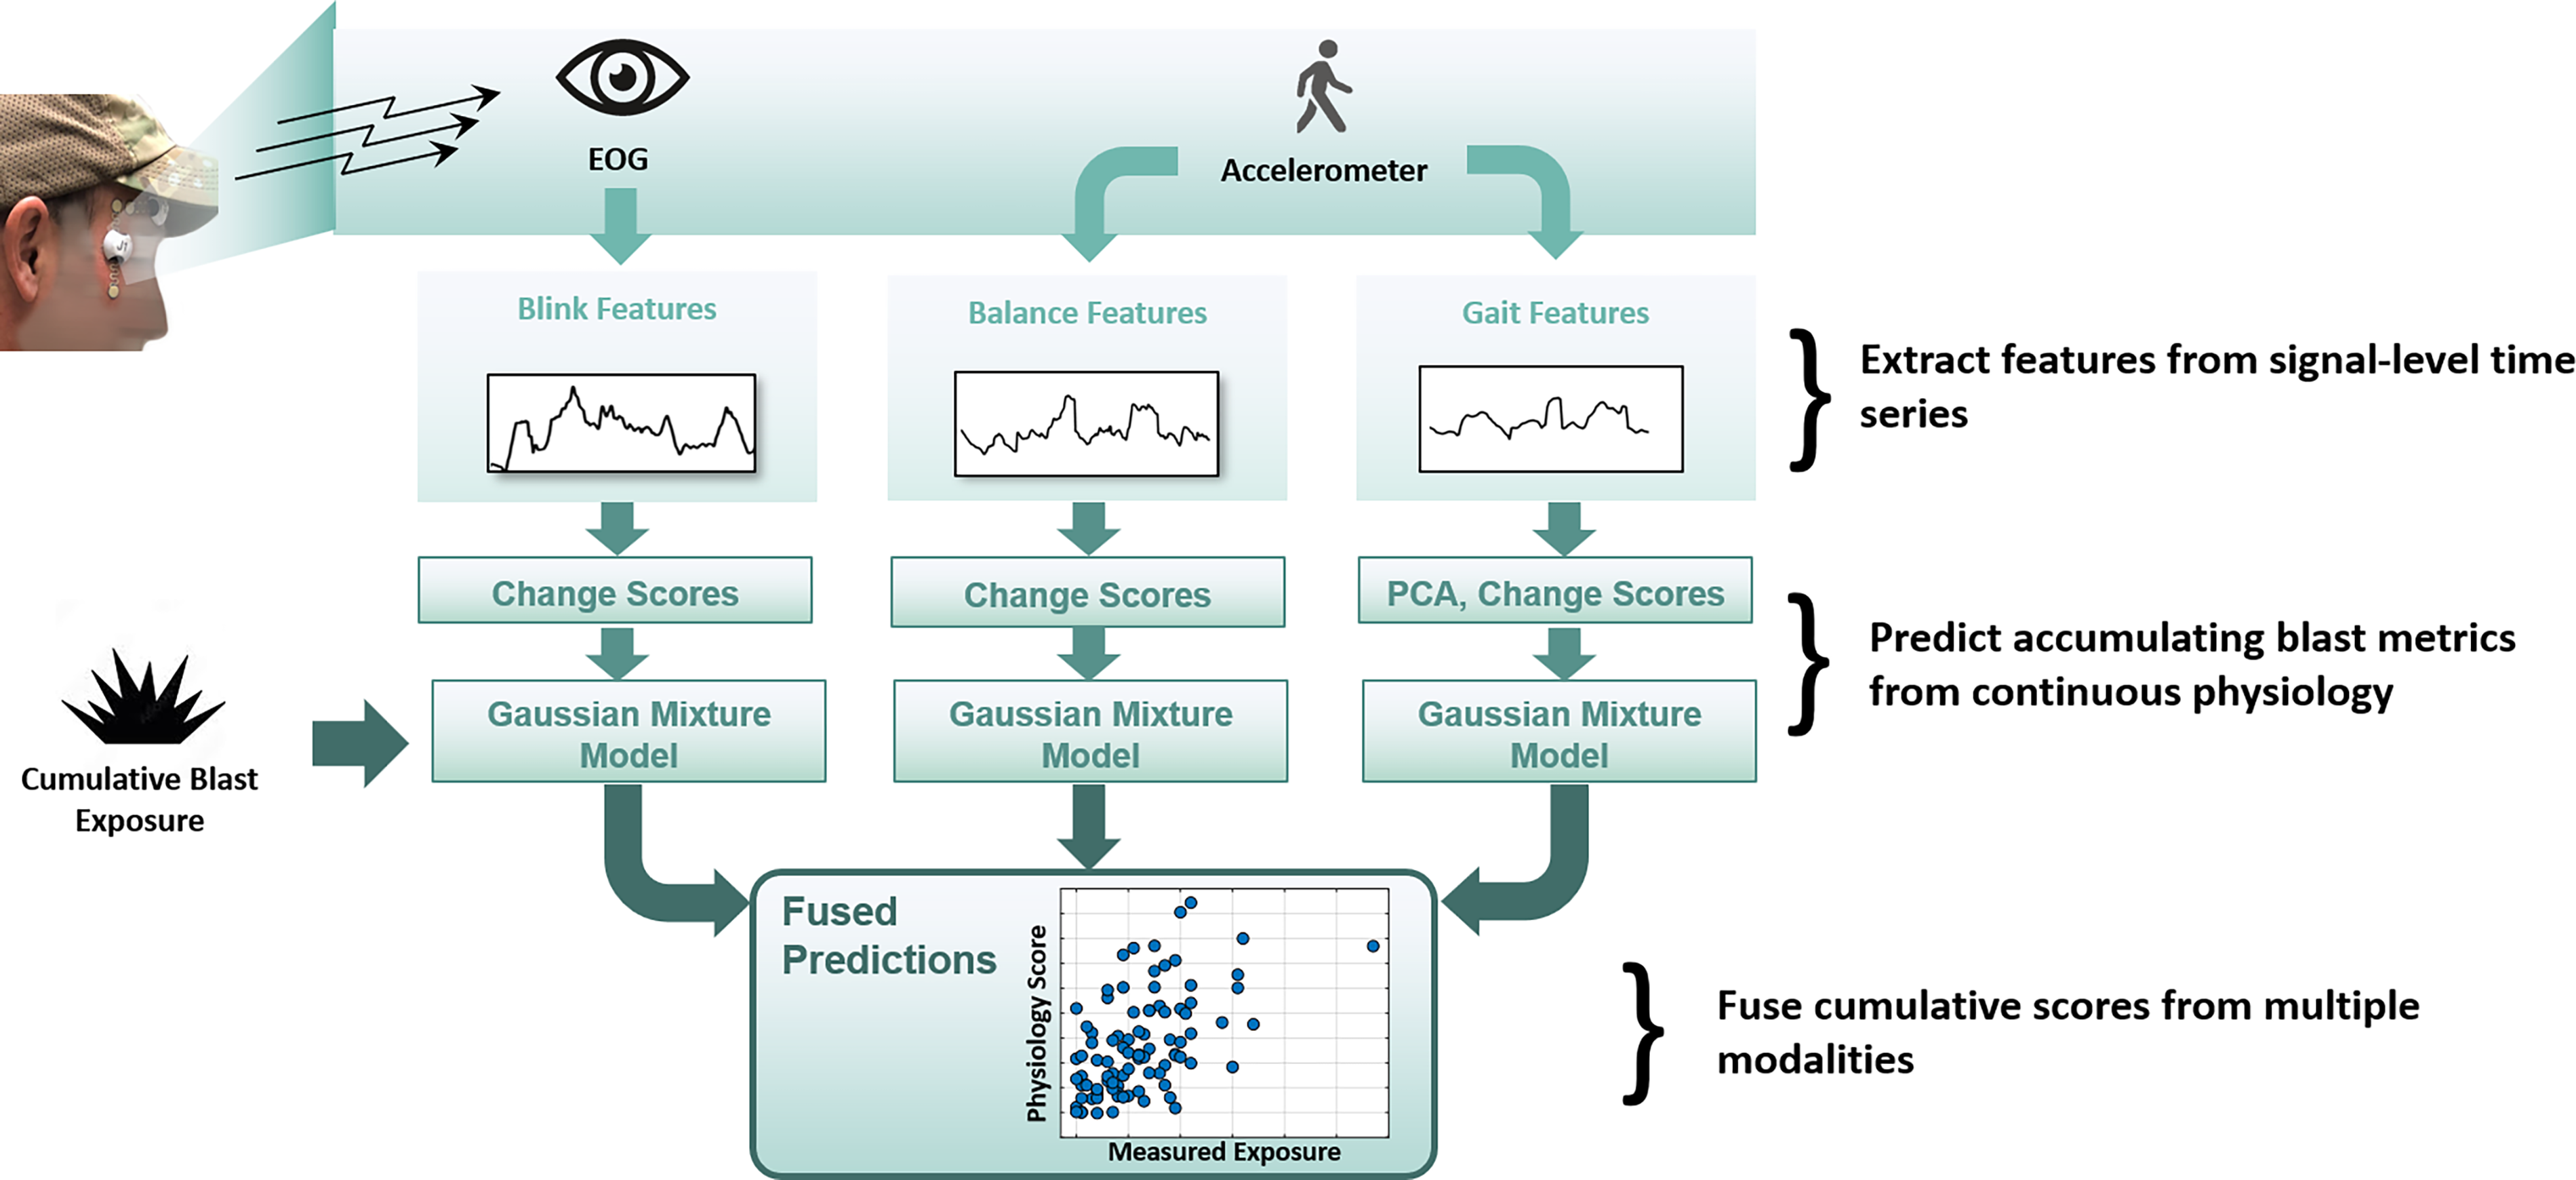
Multi-modal feature extraction, model training, and fused scores. Physiology time series are extracted for each modality and used to model exposure (score) time-series for each individual. Per-session scores are fused to compute dose/response correlation.
Results
Daily exposure and wearable physiological response time-series
Figure 3 highlights the time-series of both accumulating blast overpressure and physiological-based risk score, computed as described in the Methods. The top panel of Figure 3(a–c) highlights a single subject’s daily exposure and blink scores across a 3-year time span as a function of time (b) and of exposure level (c). Exposure level is plotted as an accumulating time series in (a). One of these daily exposures and blink scores is shown (orange) along with other subjects’ exposure and physiology for a single training day in Figure 3(d–f). For this subject, rapid increases in scores occur at a cumulative peak pressure of about 4.5 PSI or a cumulative exposure count of 12 LLB exposures (threshold peak pressure of greater than 155 dB SPL). While less apparent, a similar trend was noted in the balance scores.
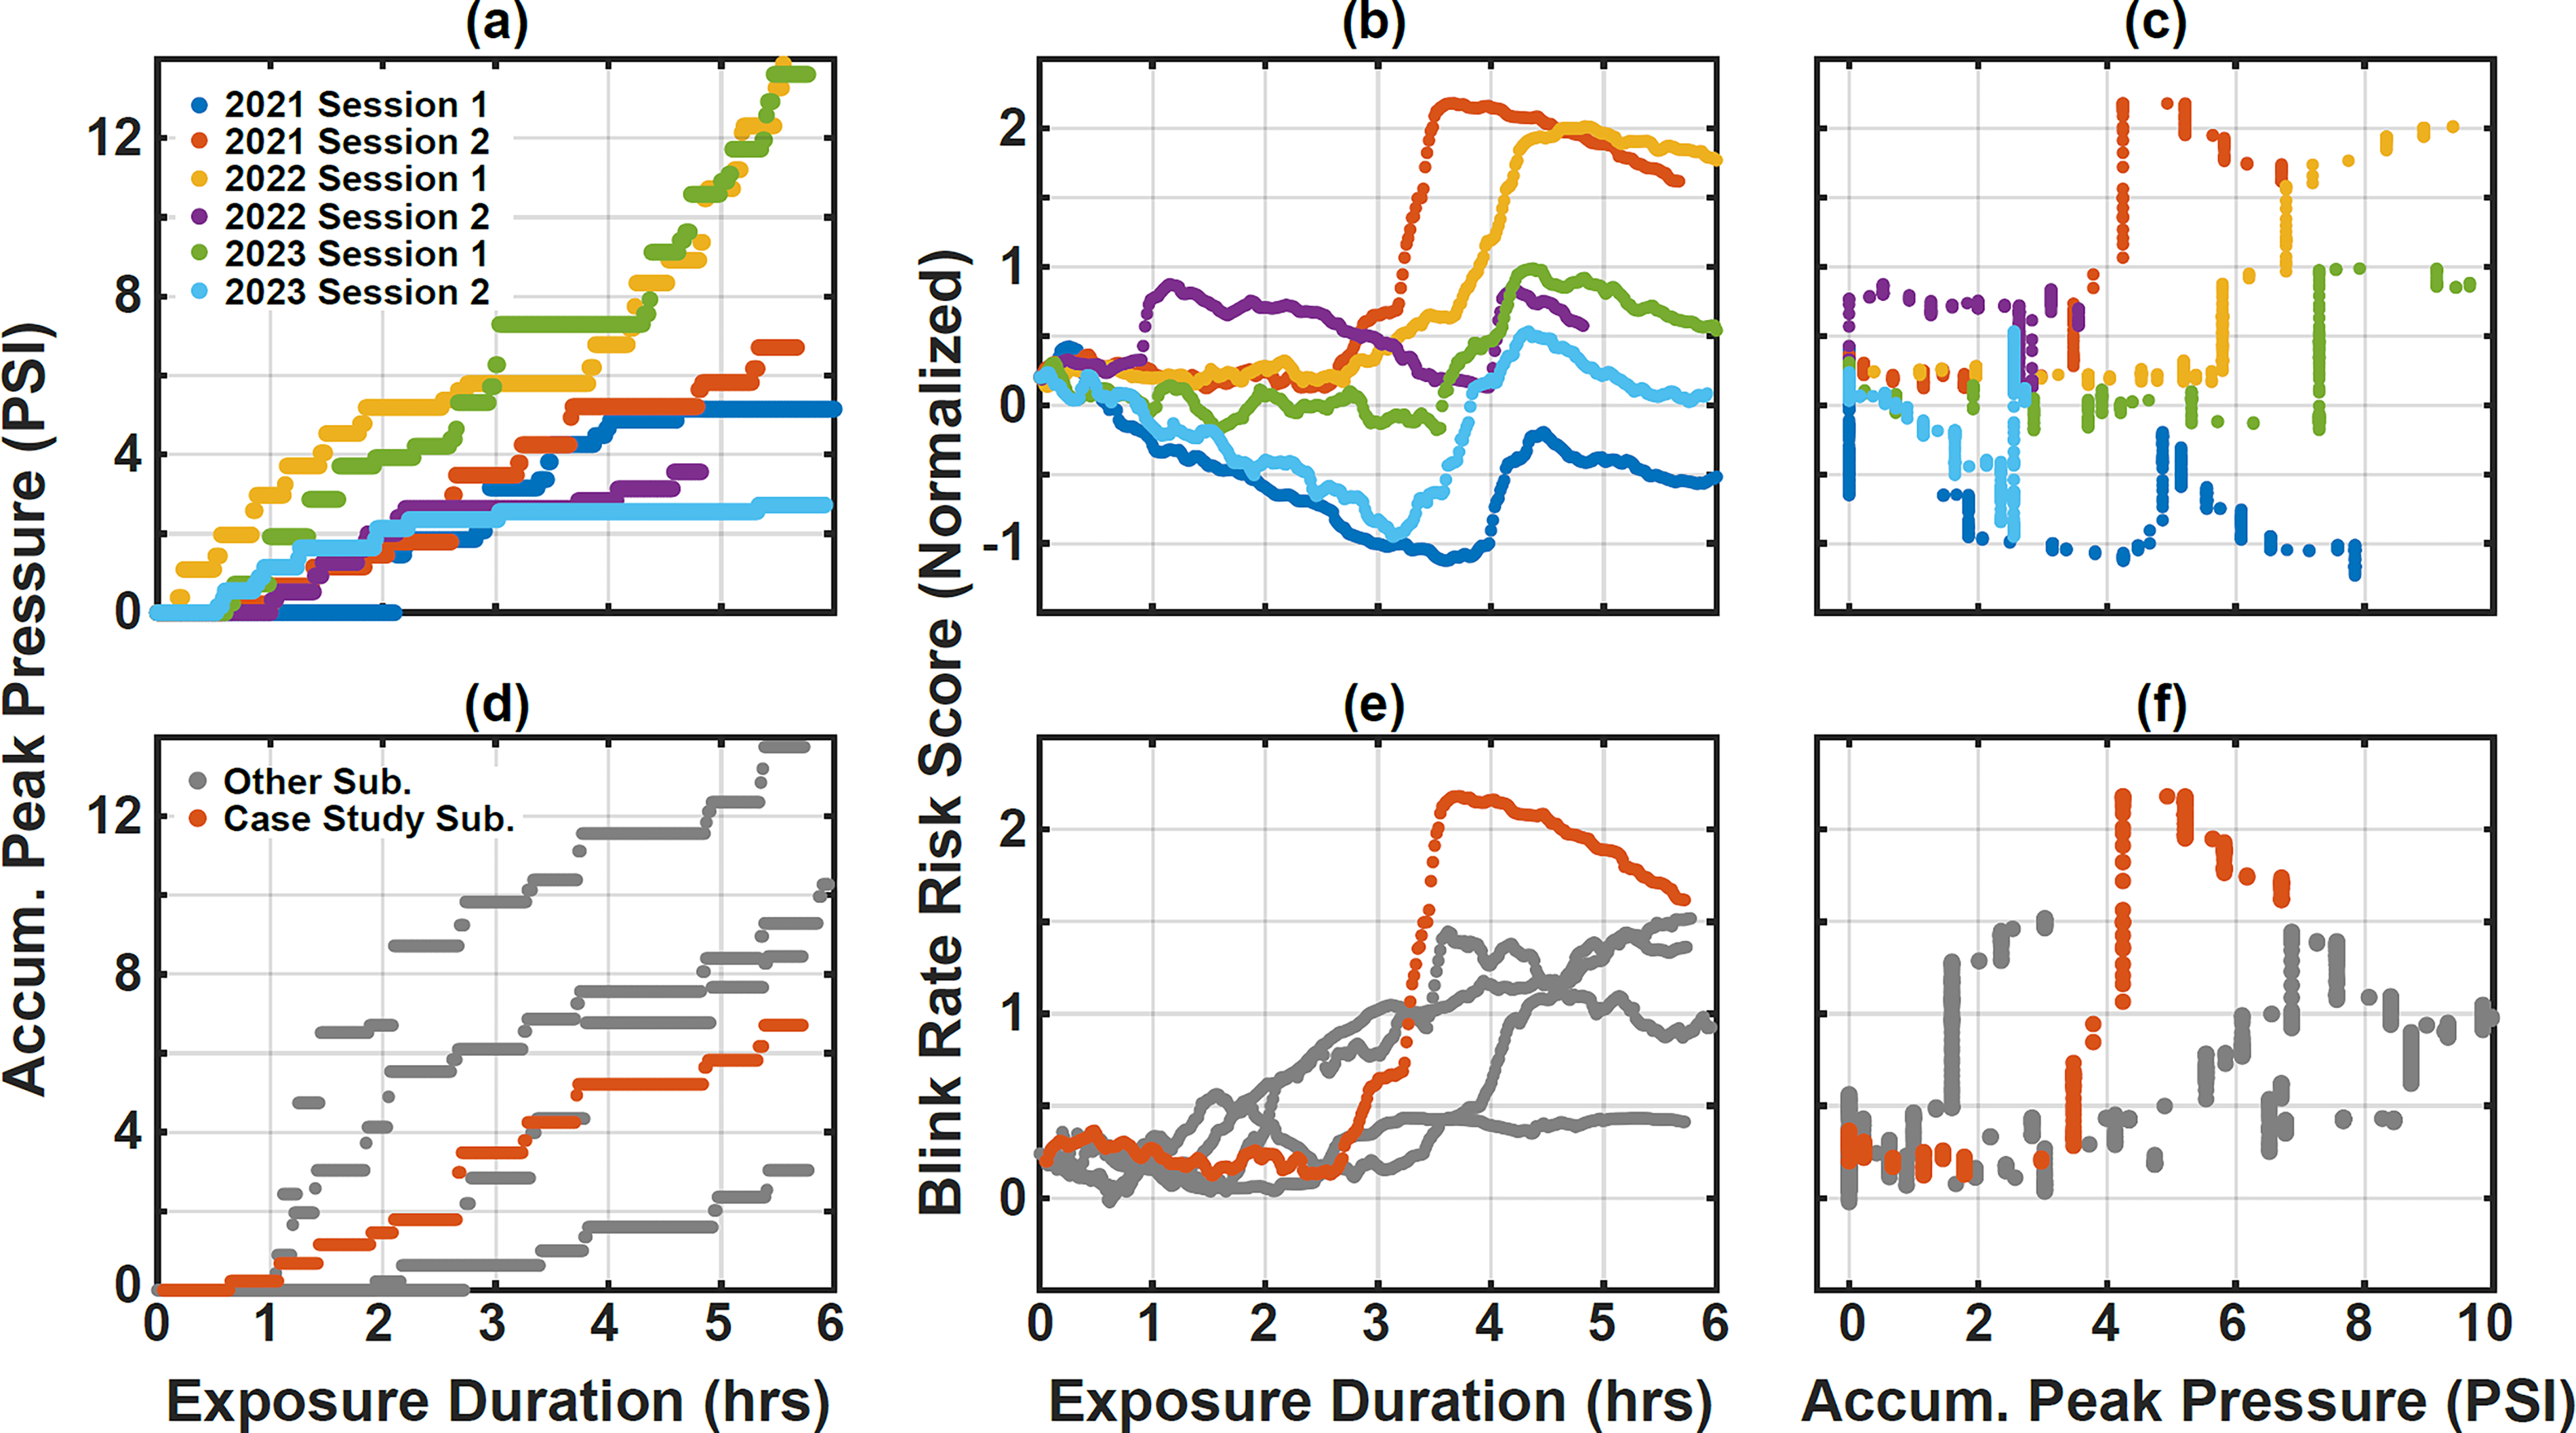
Case study participant blink scores versus time and exposure across several training days (bottom row,
The case-study subject shown in Figure 3(a–c), and in orange on Figure 3(d–f) was selected through a post-hoc exploratory analysis to identify cadres who may have experienced neurocognitive changes. This process began with a linear regression on the time-series of ANAM reaction-time scores for each subject over a roughly 3-year period spanning the sensor data collection. We identified 4 of 28 cadre with ANAM test scores having a statistically significant (nonzero, p < 1e-3) and positive trend of reaction times, indicating long-term decrease in performance. Three of these four subjects wore dosimeters and LifeLens sensor kits, making it possible to compare ANAM and continuous monitoring data.
The case-study subject shows a rapid increase in blink and balance scores during most of their training sessions. However, we note that the other two subjects with ANAM changes did not show a rapid change in their physiological data and risk score; their recording sessions were truncated in duration (e.g., ended after an exposure duration of less than 3 h, compared with a 6-h typical duration). None of the remaining cadre in the cohort consistently showed a similar trend in their risk scores. As can be seen in Figure 3 (d), this subject’s measured exposure was unremarkable: at or slightly below average compared with four other subjects on the same day. Operationally, these findings were of concern to the range commander, who already previously identified this case study subject as having significant history of previous exposure.
Dose–response models for significant blast events
The recorded overpressure waveforms captured by the MNOISE dosimeters were processed as previously described to generate four candidate accumulating dose measures—LZeq,8hr, Peak Impulse, Peak Pressure, and Blast Count—and each at seven peak pressure threshold levels—140, 145, 150, 155, 160, 165, 170 dB SPL. Recorded events with a peak pressure below each corresponding threshold level were excluded from the metric. As a result, measures with higher thresholds included fewer (but more significant) blast events.
First, cumulative totals of the four dose measures were compared in pairs to assess their similarity. Table 1 compares cumulative blast measures with a maximum pressure threshold of 160 dB SPL (0.3 PSI). Two pairs of measures were found to be highly correlated (Spearman’s correlation > 0.9): level-based measures (accumulating the count of suprathreshold blast events and accumulating the total peak pressure of the events), and energy-based measures (accumulating positive impulse and time-varying LZeq,8hr). Combinations of level-based and energy-based measures showed lower correlations. Taking into account the impact of the threshold level, the correlation coefficients for the same measures at different thresholds were as low as 0.4. These results suggest that the choice of accumulating exposure measure and threshold level could significantly impact model predictions, and therefore, a complete set of measures and thresholds was analyzed.
Blast Metric Comparison
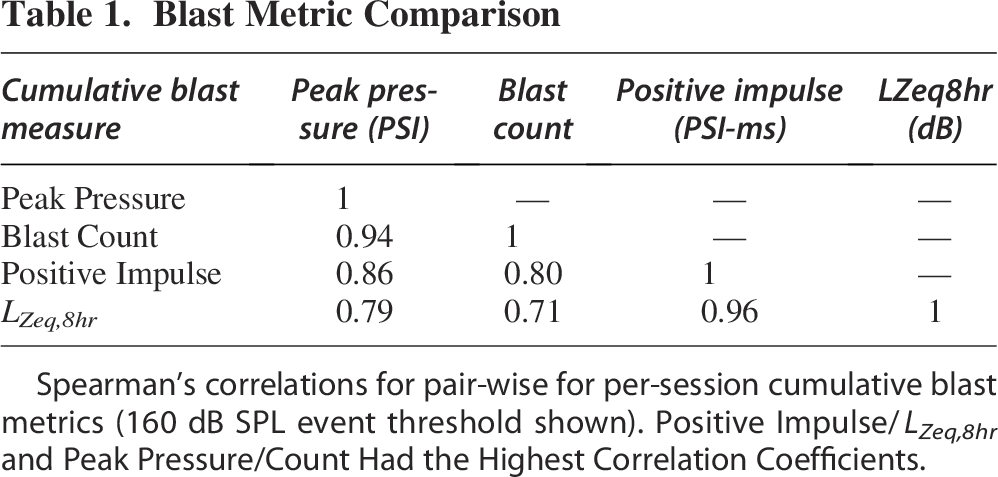
Spearman’s correlations for pair-wise for per-session cumulative blast metrics (160 dB SPL event threshold shown). Positive Impulse/LZeq,8hr and Peak Pressure/Count Had the Highest Correlation Coefficients.
Next, dose–response modeling and correlation analysis were performed for all four blast metrics and seven threshold levels to identify peak overpressure thresholds for physiologically significant blast events. Figure 4 shows Spearman’s correlations between cumulative dose measures for each session with the maximum physiology-based risk score (response), obtained by fusing the gait, balance, and blink feature modalities as described previously. Given that physiology may change over time, for example, due to fatigue, we additionally trained a model using exposure duration as a feature rather than measured physiology, as indicated by the black reference line on the figure. Energy-based measures were relatively unaffected by removing the lowest peak-pressure events as expected, as these events contributed little to the accumulating total blast level. Dose–response correlations for these measures were also roughly the same as correlation with total exposure duration. In contrast, level-based metrics produced substantially higher maximum (over thresholds) dose–response correlation than total exposure duration. Blast count improved, as expected, as the lowest-level events were removed, showing the highest maximum correlation overall at a threshold of 160 dB SPL (0.3 PSI). Importantly, all acoustic measures showed a rapid reduction in dose–response correlation at a threshold level of 170 dB SPL (0.9 PSI), suggesting that capturing only the highest peak-pressure events (e.g., >1 PSI) may be inadequate to understand physiological response.
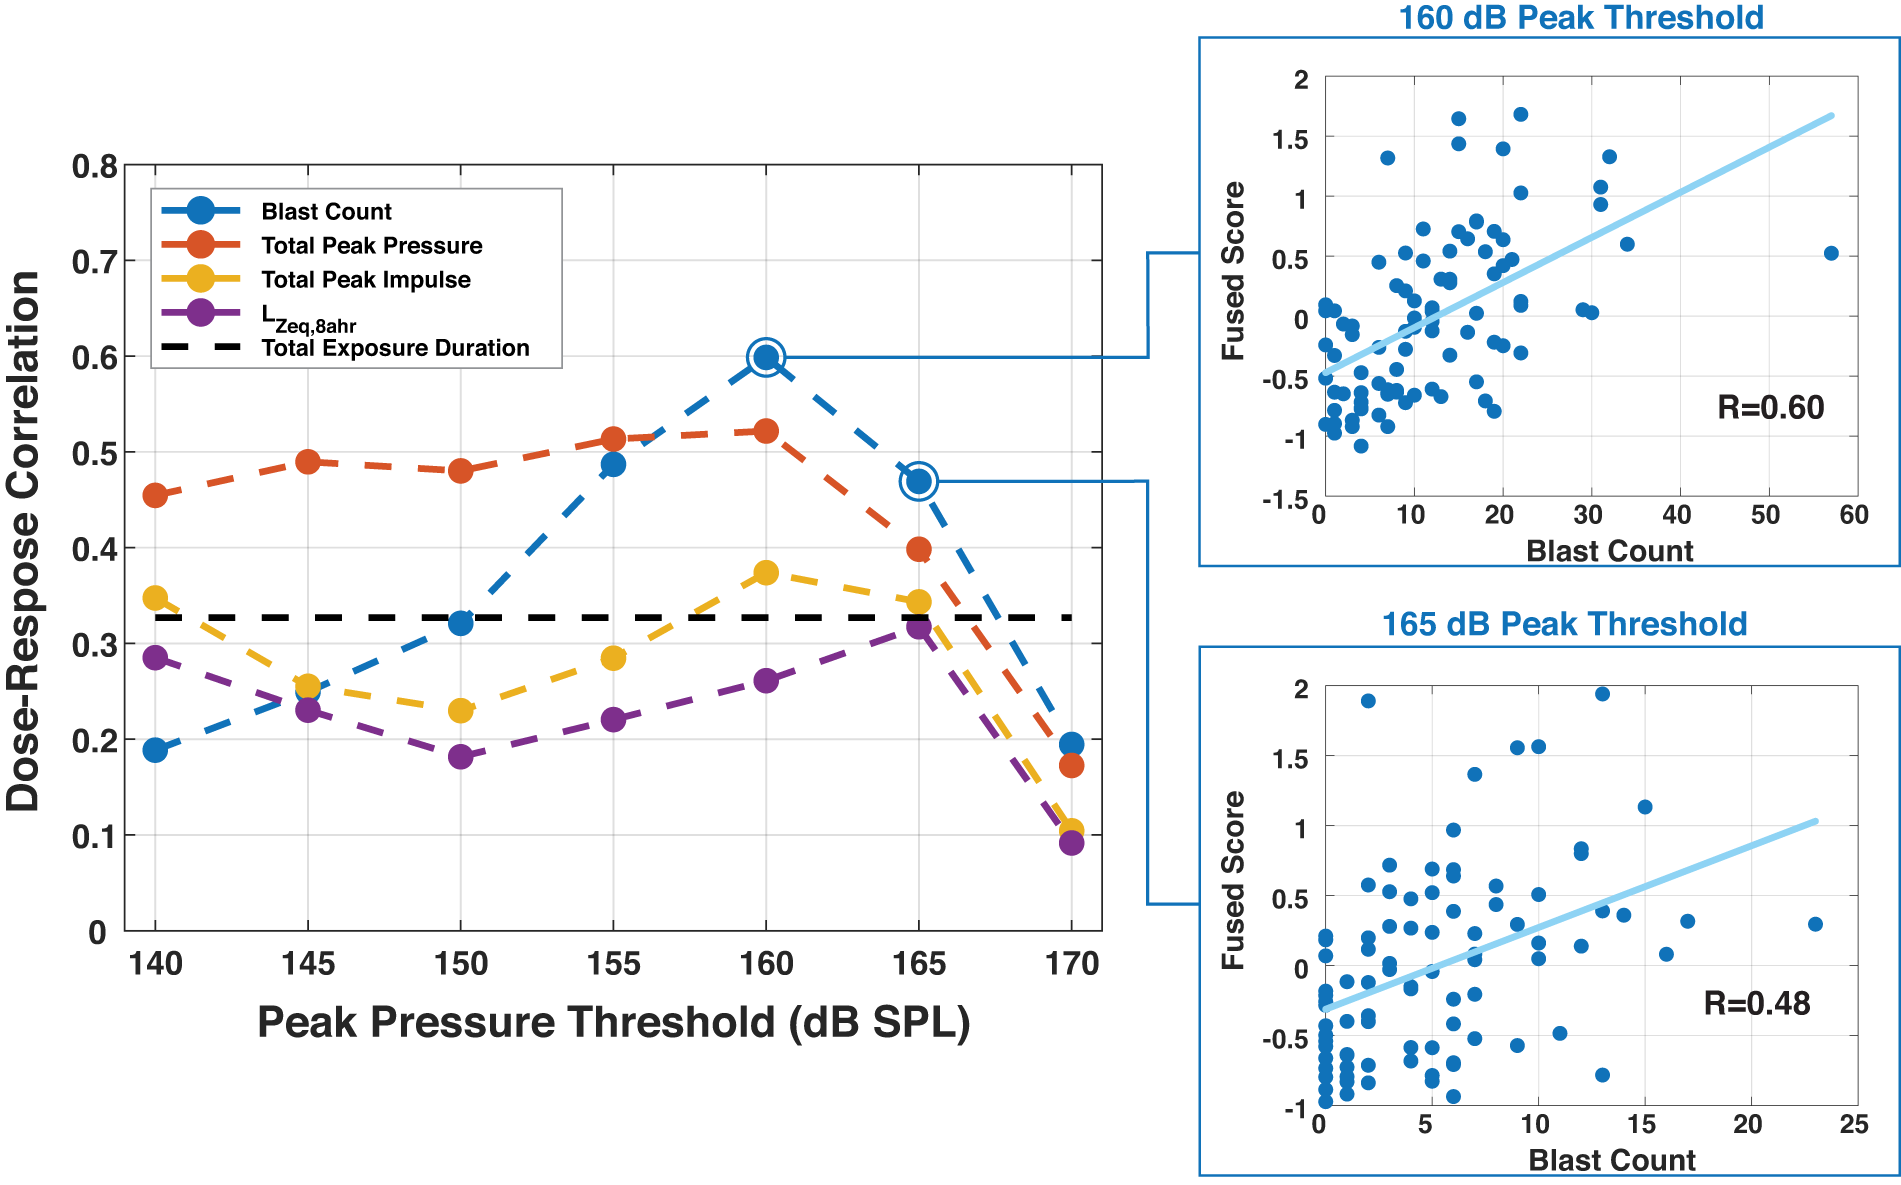
Dose–response correlation versus minimum peak pressure threshold for four cumulative overpressure measures. A threshold of 160 dB SPL (0.3 PSI) showed the highest correlations with physiology-based risk scores, suggesting events at this level (and above) are important to predict the physiological effects of blast exposure.
Wearable sensor ablation study
Fieldability is a primary consideration for a wearable blast monitoring system; while adding additional sensors may result in improved performance, incremental performance gains may come at the cost of battery life or end-user acceptance. The relative importance of each sensor in the LifeLens system was studied by comparing three sensor configurations: accelerometry-only (gait and balance features), accelerometry + single-channel EOG (+ blink features), and accelerometry + dual-channel EOG (+ saccade features). Table 2 shows the results of these three sensor configurations for the two most effective blast exposure measures (Blast Count and Cumulative Peak Pressure) at two exposure threshold levels (155 dB and 160 dB). Shown are Spearman correlations of maximum per-session model risk scores with exposure levels. Adding 1 EOG sensor improves the risk scores at the 160 dB threshold but not the 155 dB threshold. In this study, adding an additional EOG sensor (which is only available in a minority of 36 sessions) to obtain saccade duration features did not improve prediction accuracy above that obtained with an accelerometer and a single EOG sensor.
Sensor Ablation Study
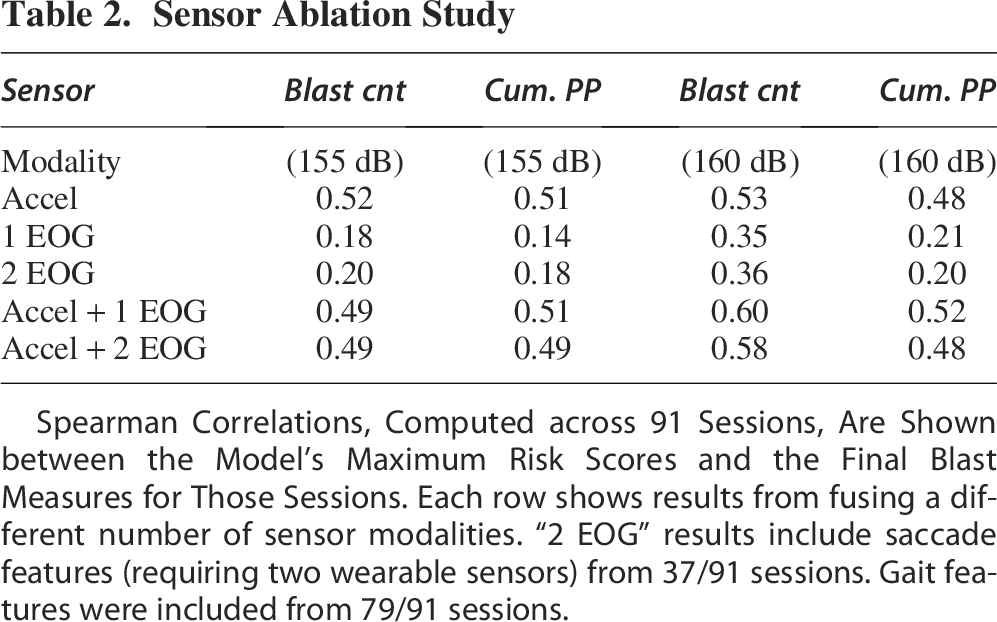
Spearman Correlations, Computed across 91 Sessions, Are Shown between the Model’s Maximum Risk Scores and the Final Blast Measures for Those Sessions. Each row shows results from fusing a different number of sensor modalities. “2 EOG” results include saccade features (requiring two wearable sensors) from 37/91 sessions. Gait features were included from 79/91 sessions.
Direction of correlations of physiological features changes with blast exposure
The above results show the magnitude of positive correlations between regression model outputs and blast exposure level, computed across 91 sessions. The direction of correlations of changes in individual physiological features with increasing exposure, computed over time within each session as well as across all sessions, is also of interest. Correlations across data from all 91 sessions are shown in Table 3. The signs of these correlations show that blast exposure is associated with a lowering of gait complexity and a reduction in blink durations. Exposure is also associated with an increase in PL in balance (LM) frames. The acceleration balance feature (acceleration PL) and blink duration are single channel, so it is straightforward to compute and interpret the correlations of their changes with blast exposure over time. To represent the change in gait complexity with a single value, we selected change in the eigenvalue at the middle of this range (rank 10), at the first delay scale. Because LM (balance) frames are selected based on a fixed acceleration magnitude variance threshold applied over a 5 s window, these findings suggest that blast exposure is associated with an increase in high time-frequency movements. These results also show the same correlation sign for all four blast exposure measures, with the strongest correlation magnitudes for Blast Count and Cumulative Peak Pressure.
Correlations of Phyisological Features with Blast Exposure Metrics
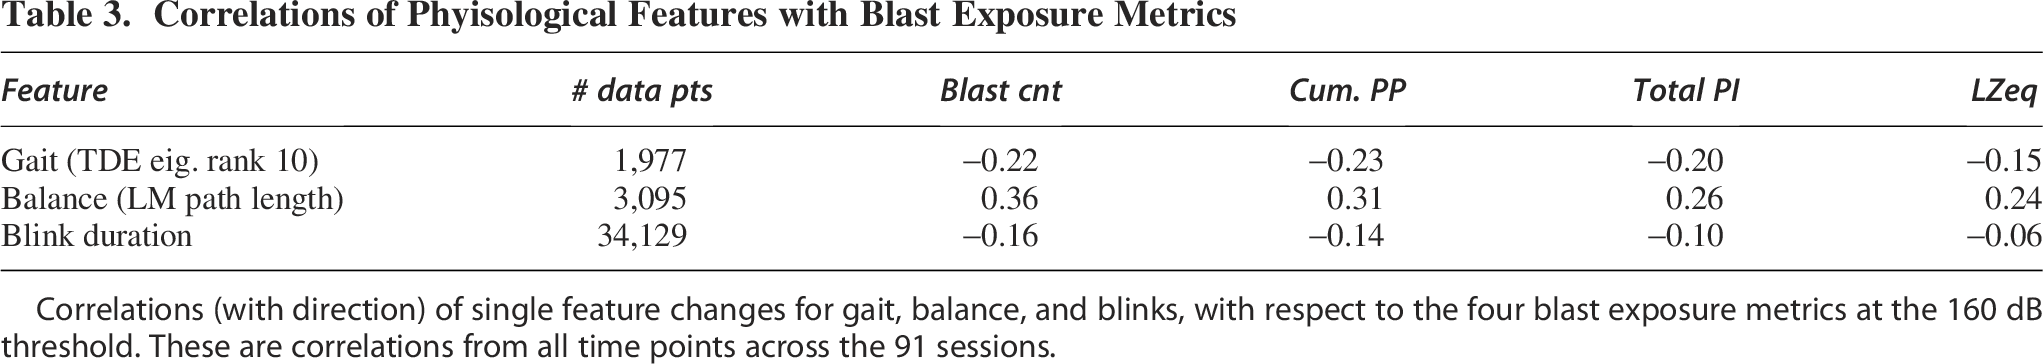
Correlations (with direction) of single feature changes for gait, balance, and blinks, with respect to the four blast exposure metrics at the 160 dB threshold. These are correlations from all time points across the 91 sessions.
Discussion
Our approach demonstrates that it is possible to develop acute dose/response models for blast exposure by combining cumulative exposure measures and changes in physiology. This technology could be developed into a system to identify individual users who have a high cumulative exposure energy and a physiological change as the most at risk or identify individuals who show an elevated response for a given level of exposure, as noted in this study. In the latter case, individual susceptibility may be assessed through the use of individualized models, for example, as described in “Mapping Feature Changes into Risk Scores.”d
This work extends previous results that showed an ability to estimate blast exposure from EOG-derived features of eye blinks and saccades 6 and accelerometry-derived gait features. 8 Those results differed in being based on smaller data sets (31 sessions from 17 participants in Rao 6 and 44 sessions from 17 participants in Williamson 8 ). Additionally, in both previous studies, monotonic physiological changes across entire sessions were computed post hoc as a basis for regression models to estimate exposure level. The current work differs in five additional ways. First, a larger data set consisting of 91 sessions from 18 subjects was included. Second, continuous-time tracking of physiological changes was performed (Fig. 2), which is sensitive to rapid physiological changes and can provide real-time alerts. Third, the same physiological-change and regression modeling methods were applied to both EOG-based and accelerometer-based features, and the resulting model predictions were fused. Fourth, four different blast exposure metrics were correlated to fused physiology (Fig. 4) and compared (Table 1). Finally, continuous physiology was interpreted alongside cognitive assessments (ANAM).
Brain health assessments like the ANAM, when conducted before and after weapons training, have the potential to measure the cognitive effects from changes in brain function, but lack the continuous real-time capability of a wearable sensor. Thus, the time delay between exposure and discrete tests could be an important factor when measuring small, acute changes to physiology or cognitive function. In our dataset, analyzing 23 sessions with physiological recordings with same-day changes in ANAM scores did not reveal statistically significant correlation between changes in ANAM and blast exposure measures. Even in the case where a pre-/postexposure test is sensitive to brain injury via clinical diagnosis, a real-time monitoring approach could localize significant events (in time or dose) more precisely or enable earlier warning. We believe that continuous monitoring of physiology and exposure, as presented in this study, can provide a more granular indication of changes in brain function that could ultimately lead to negative health outcomes. In a future fielded system, the ability to detect these changes in real time could prevent additional exposures after an acute injury on an individualized basis, thus reducing the risk of further injury while maintaining high levels of training effectiveness.
Despite a lack of any correlations of blast exposure with acute ANAM changes in our study, we did observe a case study subject with increasing reaction time scores over a longer time span (i.e., years) that consistently showed anomalous rapid increases in physiology-based risk scores with increasing blast exposure within a single daily session, particularly in EOG-based features. Importantly, this analysis provides a potential hazard threshold for that individual, who appeared to be unusually susceptible to low-level exposure. The case-study subject’s consistent and anomalous changes in blink and balance physiology typically occurred several hours before the end of each day’s training, supporting the need for tracking physiology during the training day. A delay in administering a differential assessment with comparable sensitivity would provide an opportunity for additional exposure to accumulate, increasing the risk for further brain injury.
When analyzing dose/response data from the entire cohort, we compared accumulating blast measures and thresholds for significant blast events for this group and environment by correlating blast measures with model predictions based on physiology. We found, using individualized machine learning models trained using a “leave-one-out” approach, that accelerometry scores provided good correlation with cumulative blast exposure measures, with a small but noticeable benefit from fusing EOG features. Despite this relatively small impact, we believe EOG may still be impactful for early warning of injury based on the case-study findings, though additional insights may be gained from accelerometry alone. Likewise, tracking gaze or vestibulo-ocular reflex using a higher-fidelity sensor could prove impactful.
Our dose–response correlation analysis fusing per-session blink and balance scores further identified candidate blast features and thresholds to identify significant LLB events. In particular, a count of blast events with a measured peak pressure above 160 dB SPL showed the highest group dose–response correlation overall. This “blast count” measure, however, was the most sensitive feature to threshold level, and therefore an accumulating peak pressure could provide a more robust dose metric in general while maintaining good correlations in this group, as it is less sensitive to low-pressure events that may have little impact on physiology. Still, in limited cases, a lower fidelity sensor, if properly designed and calibrated, may prove useful in tracking blast exposure by counting events. In all cases, removing blast events above 170 dB SPL resulted in rapid reduction in dose–response correlation, indicating the importance of choosing a device that can measure and record these low-level events.
In summary, our study demonstrates a dose–response relationship based on real-time continuous monitoring of blast exposure and acute physiological response from wearable devices and demonstrates the practical value of continuous monitoring relative to pre/post-exposure assessments. We additionally found that including blast events above a peak pressure threshold of 0.3 PSI produced the highest correlations with our modeling approach; importantly, this exposure level is considerably lower than the minimum peak pressure threshold on some commercial blast gauges.
Translation to operational environments
Wearable physiology monitoring brings unique benefits relative to assessments in training environments; for example, the potential to capture multiple measures of physiology simultaneously and to localize significant physiological responses in time (or exposure level). These benefits become even more apparent in austere combat settings where pre-/post-exposure physiological assessments can be difficult or impossible to administer, for example, because blast exposure periods may be unpredictable. We suggest that the most practical approach is to develop these wearable, real-time technologies in training settings alongside clinical and laboratory-grade assessments thought to be most sensitive to blast overpressure exposure. These findings could then directly support wearable monitoring to identify and prevent blast injury in operational environments.
Limitations and future work
Our work indicates that pairing continuous monitoring with periodic assessments like ANAM has the potential to provide range commanders with evidence to detect changes in oculomotor and neurocognitive function during occupational training in the near-term. However, there are several limitations in both our wearable technology and experimental design that could limit the generalizability of this work. First, multiple uncontrolled experimental factors could influence our results, including type of weapon/exposure, environmental conditions, and cohort (i.e., instructors are highly trained and specialized). As a result, particular dose/response findings may not generalize to other training environments. Specifically, although we found the highest dose/response correlation using blast count (Table 3), we would anticipate in a larger, more diverse dataset an energy-based metric or other cumulative metric could result in higher correlations. 43 In addition, nonacoustic exposure conditions (e.g., heat, air quality) during training are feasible as alternative potential causes of physiological response. Finally, we expect that a more mature technology package could improve data quality and availability, addressing limitations like the availability of data to estimate saccades from EOG. In particular, adding a second EOG sensor to detect saccades did not improve correlations in our dataset (Table 2), but this may be due in part to limited data from hardware constraints.
Despite these limitations, we believe these results can motivate further work including wearable monitoring technology to uncover safe exposure thresholds in training environments and to identify susceptible individuals who may experience health effects at levels that are safe for other people. Continuous physiology scores can localize potential injuries to the day or even minute and are more closely related to the accumulated exposure level at that time, making them an important tool for identifying safe exposure limits. While acute physiological changes are non-specific to both blast exposure and brain injury (i.e., we cannot know if the observed changes are causally linked to an observed blast exposure or will result in long-term brain health effects as a clear link between acute physiology and blast injury has not yet been established), longitudinal reaction time scores, for example, could be more readily related directly to long-term brain health effects. Based on these observations and our results, we conclude that an early warning system combining real-time monitoring (of exposure and physiology) with neurocognitive assessments could leverage the strengths of each approach, providing better evidence for occupational health decisions than either individually. Important next steps toward developing this capability are to mature and standardize data collection platforms, deploy predictive models of continuous monitoring data closer to the point of potential injury (e.g., same-day analysis from embedded models) and to incorporate additional measures of short-term and longer-term brain health effects.
Conclusions
Wearable technology can be used to simultaneously and passively monitor both blast exposure and resulting physiological changes. We found that a model relating exposure (dose) to physiological response revealed that blast events with peak pressure levels as low as 0.3 PSI are related to physiological changes and could contribute to blast injury. We also identified an individual subject with increasing reaction-time scores that consistently showed a rapid and anomalous change in physiology-based risk scores after as few as 12 LLB events in a given session, supporting the hypotheses that susceptibility to LLB injury depends on as-yet unknown individual factors. Overall, our results suggest that the wearable approach to blast monitoring can lead to more timely interventions as well as a better understanding of the most appropriate metrics for exposure dose and corresponding threshold levels to protect the brain health of warfighters in these environments.
Authors’ Contributions
J.P.K. was responsible for cleaning and analyzing dosimetry data and dose–response analyses. J.K. was responsible for physiology data cleaning and feature extraction. E.H. was responsible for managing data collection in training environments. J.R.W. developed the machine learning methods and performed correlation analyses. H.M.R. developed fieldable EOG sensing and supervised physiology analyses. C.J.S. developed LLB dosimetry and supervised dosimetry analyses. J.P.K., J.R.W., H.M.R., and C.J.S. contributed to writing and editing the article.
Footnotes
Acknowledgments
The authors would like to acknowledge MAJ Kurtis Gruters, Dr. Katherine Spradley, Mr. Sedrick Thomas, Dr. Luanne Kent, MSG David Curtis, and SFC Aaron Anderson from USASOC as well as Dr. Andrea Vincent, Vista LifeSciences, Creare LLC, and LifeLens for hardware and data support.
Disclaimer
The views expressed in this article are those of the authors and do not necessarily reflect the views of U.S. Army Special Operations Command, the Department of the Army, or the Department of Defense.
Transparency,Rigor,and Reproducibility Statement
In this article, we report the results of a secondary analysis of deidentified data collected as part of a voluntary program evaluation effort for breaching training at USASOC. As such, no power analysis was performed at the outset of the investigation. The lead author certifies that a plan to analyze and compare acoustic dosimetry and wearable physiology response as described was prespecified. Data were successfully analyzed in 28 individuals having sufficient quality dosimetry (i.e., free from significant contaminating electrical artifacts) and wearable EOG (sensors securely placed and correctly positioned to capture the features presented in this paper). Results of this analysis were shared with the range commander in real-time, and modifications to the training environment and schedule were informed by initial and published findings. Authors analyzing data were blind to the identity, role, and service history of these individuals.
Data analysis was performed by the authors in MATLAB using custom feature extraction and machine learning code as described above. The code was initially developed in other funded efforts for wearable physiology monitoring and acoustic dosimetry and adapted to this use case. Dosimetry data extraction and pre-processing code was developed at Lincoln Laboratory, while EOG and accelerometry data collection was supported by LifeLens. ANAM results were provided by Vista LifeSciences. No replication or external validation studies have been performed or are planned/ongoing at this time to our knowledge.
Distribution
DISTRIBUTION STATEMENT A. Approved for public release. Distribution is unlimited. Any opinions, findings, conclusions or recommendations expressed in this material are those of the author(s) and do not necessarily reflect the views of the Department of the Army.
Human Subjects
The USASOC Exemption Determination Officer reviewed and determined the collection of data through this program evaluation to be Not Research IAW (32 CFR 219). Data analysis was found not to meet the federal definition of human subjects research by MIT COUHES (45 CFR 46).
Author Disclosure Statement
The authors declare that there are no competing interests.
Funding Information
This material is based upon work supported by the United States Air Force under Air Force Contract No. FA8702-15-D-0001 and by the United States Army Medical Materiel Development Activity (USAMMDA).