
Abstract
Attentional deficits are prevalent and persistent after traumatic brain injury (TBI), yet our understanding of their etiology is incomplete. In uninjured rats, in vivo microdialysis studies show that task-evoked increases in acetylcholine (ACh) in the medial prefrontal cortex (mPFC) correlate with enhanced attentional performance. The goal of this study was to test the hypothesis that TBI decreases task-evoked ACh in the mPFC, compromises nucleus basalis of Meynert (nbM) cholinergic neuron morphology, and impairs attention. Adult male Sprague-Dawley rats trained on the three-choice serial reaction time (3-CSRT) task and then received either a controlled cortical impact or sham injury (n = 10/group). Dialysate samples were collected by in vivo microdialysis before and during the 3-CSRT task, and ACh levels were quantified using high-performance liquid chromatography. Cholinergic neurons in the contralateral/ipsilateral nbM were reconstructed and analyzed using the IMARIS software. The findings revealed a task-evoked decrease in ACh in the TBI group, a significant reduction in soma area/volume in the ipsilateral nbM, and impaired sustained attention as measured by performance on the 3-CSRT task. The findings support the hypothesis that TBI-induced attentional impairments are linked to disrupted real-time cholinergic signaling in the mPFC and associated structural changes in cholinergic neurons. These insights could inform the development of targeted interventions to improve quality of life for TBI survivors.
Keywords
Introduction
The cholinergic system is particularly vulnerable to traumatic brain injury (TBI), due in part to the anatomical positioning of cholinergic neurons and their ascending projections to regions susceptible to the biomechanical consequences of cortical impact, such as shearing and straining forces that compromise cortical and frontoparietal cholinergic projections.1–8 Both clinical and pre-clinical studies have extensively investigated TBI-induced disruptions to cholinergic neurons using choline acetyltransferase (ChAT), the rate-limiting enzyme of acetylcholine (ACh) synthesis.1,2,9–13 Post-mortem analyses reveal a significant degeneration within basal forebrain cholinergic neurons (BFCNs), including abnormal neuronal morphology in the nucleus basalis of Meynert (nbM) following TBI.10,11 Experimental models further show degeneration and somatic atrophy of BFCNs, including in the medial septum, diagonal band of Broca, and the nbM, where neuronal shrinkage and vacuolation have also been reported after TBI.1,2,12–14 These findings suggest a region-specific vulnerability to both the mechanical and secondary pathogenic processes, with decreases in BFCNs observed from 15 days up to 4 weeks post-injury.1,2,12–14 The prefrontal cortex (PFC) receives dense cholinergic innervation from the nbM and supports higher-order cognitive functions such as attention. Notably, cholinergic contributions to attentional control exhibit hemispheric lateralization, with right prefrontal cholinergic signaling being particularly important in sustained attention. 15 Consequently, TBI-induced disruption of these ascending cholinergic projections is hypothesized to impair cognitive performance.
Significant and persistent attentional deficits have been observed after TBI in adult male and female rats16,17 during the three-choice serial reaction time task (3-CSRT), a well-validated visuospatial task that is analogous to the clinical Continuous Performance Test.18–20 Specifically, Moschonas and colleagues 17 observed a significant reduction in ChAT-positive neurons in the ipsilateral nbM at 4 weeks after a moderate TBI, which correlated with attentional impairments assessed by the 3-CSRT task. Our current understanding of the cholinergic system after TBI is primarily based from post-mortem analyses, including semi-quantitative techniques like immunohistochemistry and Western blot. While these methods provide valuable insights into biochemical and cellular alterations after TBI, they are limited in their ability to capture the dynamic aspects of cholinergic neurotransmission. In contrast, sampling techniques such as in vivo microdialysis offer a more quantitative and temporally precise approach, enabling real-time monitoring of neurochemical fluctuations, both at baseline and in response to pharmacological or behavioral challenges.
The aim of this study was to leverage the enhanced temporal resolution afforded by in vivo microdialysis by evaluating behaviorally driven cholinergic dynamics in the injured brain. Specifically, we measured task-evoked ACh in the mPFC of adult maleTBI rats during 3-CSRT performance. We also examined cholinergic neuronal morphology in the nbM, which provides insight into the structural integrity of neurons post-injury, including soma volume and area, neurite length and volume, and filament branching. We hypothesized that TBI would reduce in vivo task-evoked ACh release in the mPFC, compromise nbM cholinergic neuron morphology, and impair real-time attentional performance. This study is the first to simultaneously examine in vivo cholinergic neurotransmitter release during real-time performance of a behavioral task assessing attention after TBI.
Materials and Methods
Animals and pre-surgical procedures
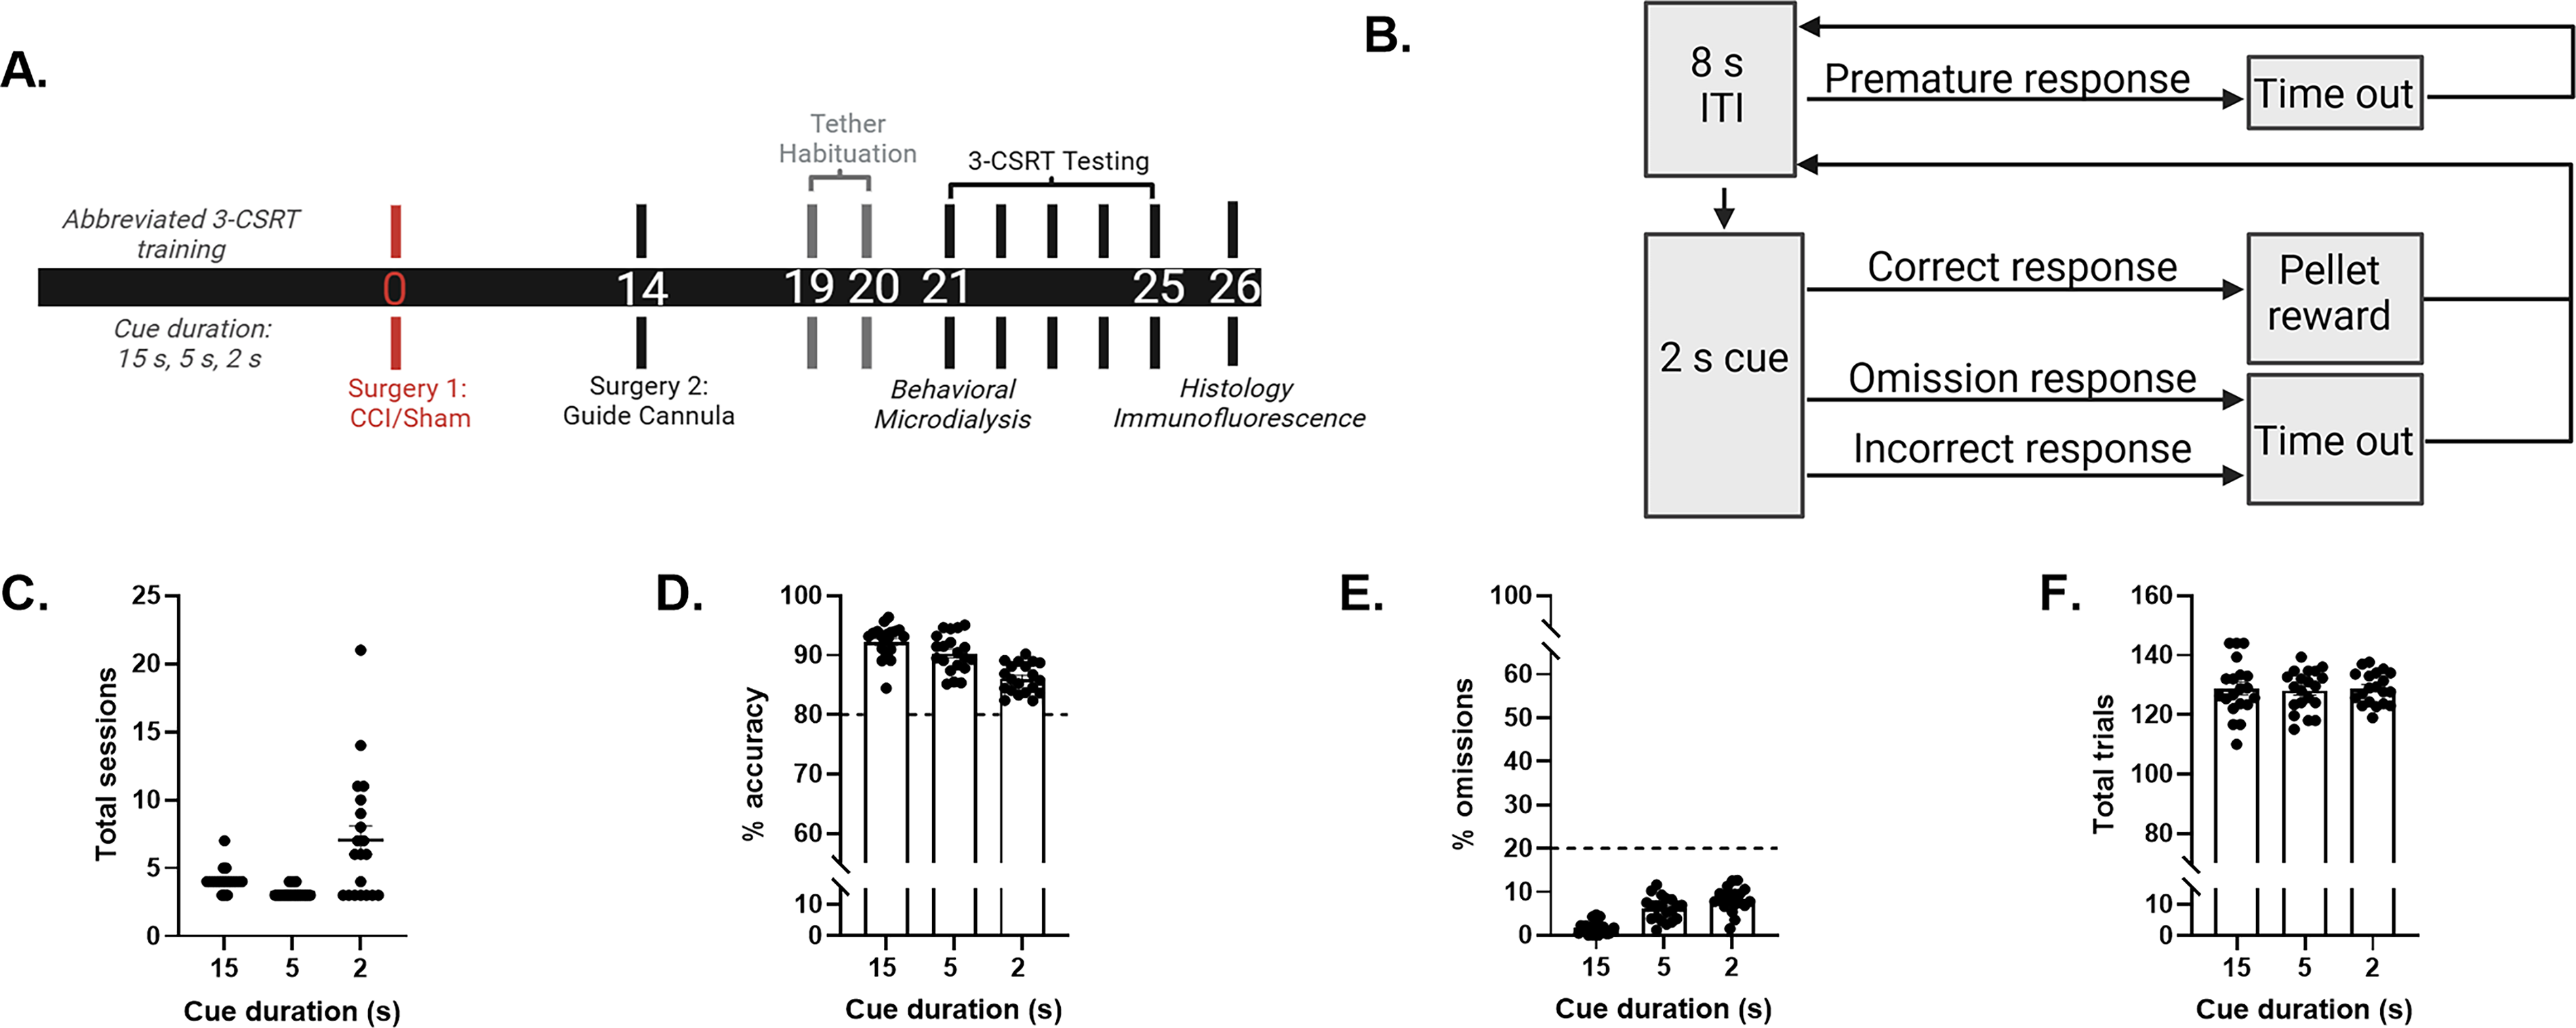
Twenty adult male Sprague-Dawley rats (3-month-old; Envigo RMS, Inc., Indianapolis, IN) were pair-housed in ventilated polycarbonate cages (37 × 25 × 18 cm) under controlled temperature (21 ± 1°C) and light conditions (lights on 7:00 a.m. to 7:00 p.m.) with ad libitum food and water. During operant training/testing, rats were maintained at 80% of baseline body weight by mild food restriction. All experimental procedures were approved by the Institutional Animal Care and Use Committee (IACUC) at the University of Pittsburgh. Attempts were made to limit the number of rats used and to minimize discomfort. Figure 1A depicts the study timeline.
Prior to TBI, all rats met criterion performance, suggestive of intact sustained attention.
Three-choice serial reaction time test training
Training was conducted in operant chambers (Harvard Apparatus, Holliston, MA) with three LED-illuminated nose-poke apertures (infrared detectors) and a central food trough delivering 45 mg sucrose pellets (Dustless Precision Pellets®; Bio-Serv, Flemington, NJ). 17 A house light, side-mounted camera, and sound-attenuating cubicle facilitated standardized behavioral monitoring. Tasks were controlled with Graphic State Notation 4™ software, and rats were randomized across three identical chambers. Rats underwent 4 days of habituation, which consisted of two 20-min sessions with freely available pellets, followed by two 30-min sessions dispensing one pellet every 30 sec. Training was conducted using cue durations of 15, 5, and 2 sec, presented in a pseudo-random order following an 8-sec intertrial interval. Performance measures included accuracy = (correct/total responses) × 100 and omissions = (omitted/total responses) × 100. Accuracy measured sustained attention, whereas omissions reflected distractibility or transient attentional lapses, assuming task engagement was maintained. Advancement to the next phase required ≥80% accuracy and ≤20% omissions for three consecutive sessions. Rats meeting criterion at the 2-sec cue proceeded to surgery. 17
Surgery
After achieving criterion performance, which required approximately 2–3 months of training, rats (300–325 g) were randomly assigned to a controlled cortical impact (CCI) or sham injury. 17 Under isoflurane anesthesia (4% induction, 2% maintenance; 2:1 N2O:O2), rats were intubated, ventilated, and temperature-controlled (37 ± 0.5°C). A craniectomy (6 mm in diameter) was made in the right hemisphere, encompassing bregma and lambda. The bone flap was removed, and the craniectomy was enlarged further to accommodate the impact tip (6 mm, flat), which was centered and lowered through the craniectomy until it touched the dura mater, then the rod was retracted, and the impact tip was pneumatically advanced 2.8 mm farther to produce a brain injury of moderate severity (2.8 mm deformation at 4 m/s with a dwell time of 100 ms). Sham controls underwent identical procedures without impact. The bone flap was not replaced to avoid producing secondary damage due to brain swelling. Following cessation of anesthesia, the rats were extubated and monitored until engaging in spontaneous ambulation before being returned to the colony.
Guide cannula implantation
Following a 14-day recovery period after CCI or sham injury, the rats were implanted with a microdialysis guide cannula targeting the right medial PFC (mPFC), ipsilateral to injury. This targeting was based on evidence of right prefrontal cholinergic dominance in attentional control. 15 Under anesthesia, the rats were secured in a stereotaxic frame (incisor bar set at −3.3 mm for flat-skull positioning). Four stainless steel anchor screws were placed in the contralateral parietal and frontal bones (two per region). A burr hole was drilled at stereotaxic coordinates anteroposterior +2.6 mm from bregma and mediolateral +1.1 mm from the midline using an 8° lateral approach, to expose the intact dural layer. A microdialysis guide cannula (MAB 6.9.IC; SciPro, Sanborn, NY) occluded with a stainless steel obturator secured to a stereotaxic arm was then lowered to a depth of −3.3 mm and affixed using dental acrylic (Koldmount™). The cannula tip terminated 2 mm above the infralimbic and prelimbic boundary. A tether screw was embedded posterior to lambda for tether connection. Stereotaxic coordinates were derived from the rat atlas of Paxinos and Watson. 21 Core body temperature was monitored with a rectal thermistor and maintained at 37 ± 0.5°C using a heating blanket throughout the surgical procedures. The rats were extubated and monitored post-anesthesia before returning to the colony. One day after guide cannula implantation, mild food restrictions resumed.
Acute neurological assessments
Acute neurological assessments were performed following the cessation of anesthesia after the first (i.e., CCI or sham injury) and the second surgery (i.e., guide cannula implantation) for both TBI and sham rats. Hindlimb reflex ability was determined by gently squeezing the left and right hind paw every 5 sec and recording the time to provoke a withdrawal response. Righting reflex was assessed by measuring the time required to turn from the supine to prone position over three consecutive trials.
Post-injury 3-CSRT testing
Three weeks after CCI or sham injury (i.e., PID 21), testing on the 3-CSRT task at the 2-sec light cue duration began and continued for 5 days. To simulate day 1 testing conditions, rats underwent the same tether and habituation procedures outlined above, except for probe insertion and dialysate collection. On the first day of 3-CSRT testing, dialysate was collected both before (i.e., baseline samples), during (i.e., behavioral samples), and post-task onset.
In vivo microdialysis
On PID 21, microdialysis probes (MAB 6.9.2; SciPro) were perfused at 2 μL/min with artificial cerebrospinal fluid containing (in mM) 126.5 NaCl, 2.4 KCl, 1.1 CaCl2, 0.83 MgCl2, 27.4 NaHCO3, and 0.5 KH2PO4 and supplemented with 50 nM neostigmine (Abcam) to prevent degradation of ACh. The primed probe was inserted through the guide cannula, and the spring tether was secured to the tether screw. The probe’s inlet cannula was connected by a tubing adapter (CMA) and fluorinated ethylene propylene (FEP) tubing (a 0.12-mm internal diameter) to a low-torque, dual-channel quartz-lined swivel (Instech Inc.), which was serially connected to a syringe mounted on a micro perfusion pump. The outlet cannula was connected by FEP tubing to the swivel outlet and positioned onto an Eppendorf collection tube. The swivel was mounted on a multi-axis counterbalanced lever arm (Instech Inc.) attached to either a clear polycarbonate enclosure (Cambro, 37.8 × 38.1 cm) during habituation or to a post on the operant chamber during 3-CSRT testing. Water was available ad libitum. Dialysate samples were collected at 15-min intervals, yielding 30 μL per fraction. To minimize cortical tissue disruption and probe-induced alterations in local neurochemistry, microdialysis sampling was limited to the first day of 3-CSRT testing.
High-performance liquid chromatography
ACh in dialysate samples was quantified using high-performance liquid chromatography (HPLC) with electrochemical detection (HPLC-ECD; Amuza, San Diego, CA). A 20 μL aliquot was injected onto a reverse-phase analytical column (2.0 × 150 mm) connected in series to an enzyme reactor column (1.0 × 4.0 mm; Eicom, Japan), both maintained at 33°C in a thermostatted column oven. The mobile phase was composed of 50 mM potassium bicarbonate, 300 mg/L sodium 1-decanesulfonate, and 50 mg/L Na2EDTA·2H2O, and was delivered at a flow rate of 150 μL/min using an isocratic pump. Detection was achieved by electrochemical oxidation at a platinum working electrode held at +450 mV versus an Ag/AgCl2 reference electrode. Quantification was based on external calibration using ACh perchlorate standards (1, 10, 50, 100 nM; Sigma, St. Louis, MO). Linear regression of peak area versus concentration (r2 > 0.99) was used for calibration. Data acquisition and peak integration were performed using Envision software (Amuza). The detection limit was 10 fmol per 10 μL injection.
Histology
Cortical lesion volume and probe placement verification
The rats were anesthetized with Fatal-Plus® (0.3 mL, i.p.) and transcardially perfused with 200 mL of ice-cold 0.1 M phosphate-buffered saline (PBS), followed by 500 mL of 4% paraformaldehyde (PFA) in 0.1 M PBS. The brains were then extracted, post-fixed in 4% PFA for 24 h, and cryoprotected in a series of decreased concentrations of sucrose–PBS solutions until fully saturated. After cryoprotection, the brains were embedded in optimal cutting temperature compound, rapidly frozen on dry ice, and stored at −20°C until sectioning. Coronal sections (35 μm thickness) were cut on a cryostat and placed serially into a 12-well plate with cryoprotectant storage solution. The tissue was stored at −20°C until ready for staining. To quantify cortical lesion volume and verify probe placement, sections were washed in 0.1 M Tris-buffered saline (TBS) three times for 5 min each on an orbital shaker at room temperature (RT). Sections were then mounted on gelatin-coated microscope slides and stained with Cresyl violet. After staining, sections were dehydrated using a series of increasing concentrations of ethanol, followed by clearing with xylene, and subsequently cover–slipped with Permount. Cortical lesion volumes (mm3) were quantified by calculating the area of the lesion (mm2), which was achieved by outlining the inferred area of missing tissue for each section taken at approximately 1 mm intervals through the extent of the lesion. The areas of the lesion were then used to determine the lesion volume, as previously reported.13,17 Imaging was performed using a Nikon i90 microscope (Nikon Corporation, Tokyo, Japan), and lesion volume outlines and quantification were carried out using NIS-Elements imaging software.
Immunofluorescence
Five consecutive 35 μm coronal sections encompassing the nbM per rat (n = 3/group, randomly selected) were processed for ChAT immunoreactivity. Free-floating sections were washed in 0.1 M TBS, antigen-retrieved in Tris-EDTA buffer (pH 9.0; 80°C), and blocked in 5% normal rabbit serum with 0.3% Triton X-100 for 90 min at RT. Sections were incubated with anti-ChAT (1:50; Millipore AG220, RRID:AB_11212924) for 24 h at 4°C, washed, and then incubated with Fluorescein isothiocyanate (FITC)–conjugated rabbit anti-goat secondary antibody (1:750) for 2 h at RT. After final washes, sections were mounted on glycerin-coated slides and coverslipped with DAPI.
Z-stack microscopy
Fluorescent z-stack images were captured with a 20× objective lens at 0.5 μm intervals, starting from the top surface through the bottom surface of the tissue sections using a Nikon i90 microscope equipped with an EXFO X-Cite Series 120 fluorescence laser excitation module. Anatomical landmarks including the lateral ventricles and anterior commissure were used to identify boundaries of the nbM. Unbiased sampling of ChAT+ neurons in the contralateral and ipsilateral dorsal, ventral, central, medial, and lateral boundaries of the nbM (five regions of interest [ROIs] per hemisphere/per section, area = 142,163 μm2) was imaged in Z-series.
IMARIS
IMARIS 10 software (Oxford Instruments, Abingdon, UK) was used to conduct Z-stack analysis and 3D cell reconstruction. For ChAT+-stained Z-stacks, the filament tracer tool was applied to automatically detect and reconstruct cholinergic somas, configured with the AutoPath (no loops), no spine detection, and the “Multiscale points” option to enable the setting of filament diameters (Supplementary Fig. S1). To establish starting filament seed points, the largest (e.g., dendrite base) and thinnest diameters (e.g., dendrite tip) of neuronal filaments were measured as automated threshold values and was applied across images (Supplementary Fig. S1). Three-dimensional assessment of soma and neurite area (μm2), volume (μm3), and segment branching points were measured. The total number of ChAT+ somas, soma and neurite area, volume, and neurite branching points were measured.
Statistical analyses
All analyses were performed using GraphPad Prism 10.2.3 (GraphPad Software) by a researcher blinded to group assignments. Acute neurological scores were compared using Student’s t-tests. Behavioral data were analyzed using two-way repeated-measures analysis of variance (rmANOVA) comparing baseline and post-injury performance (percent accuracy, omissions, and response latencies), followed by Newman-Keuls post hoc tests when appropriate. For immunohistochemistry, mean values from five ROIs per section were averaged per hemisphere (n = 3/group) and analyzed using nested t-tests; significant effects were further examined within groups (contralateral vs. ipsilateral). The neuromorphological data had a hierarchical nested structure, with five ROIs quantified per histological section and five sections analyzed per rat. This design created nested subgroupings (ROIs within sections within rats). Accordingly, nested t-tests were used to test group effects while accounting for within-rat and within-section variance, thereby avoiding pseudo replication.
Results are expressed as mean ± standard error of the mean (SEM), with statistical significance set at p ≤0.05.
Changes in ACh efflux during the 3-CSRT were expressed as percentage change from pre-task baseline. The Robust Nonlinear Regression and Outlier Removal (ROUT) test was conducted with a false discovery rate (Q) set at 0.1% to identify and exclude potential outliers from the dataset. Mediation analysis was performed using nonparametric bootstrap confidence intervals to assess the indirect effect of injury on accuracy via ACh efflux. Day 1 binned data were analyzed with Welch’s t-tests and Wilcoxon tests to align dialysate samples with behavioral performance over time, capturing the temporal relationship between neurochemical and attentional measures. Average causal mediation effects (ACMEs), average direct effects (ADEs), total effects, and the proportion mediated were estimated using robust regression. Results are reported as coefficient estimates ± standard errors, along with 95% confidence intervals (CIs), and statistical significance was set at p ≤0.05.
Results
All rats (TBI n = 10, Sham n = 10) completed the first day of 3-CSRT testing with concurrent microdialysis collection. An ROUT (Q = 0.1%) identified one Sham rat as a statistical outlier (p < 0.05), which was excluded from dialysate and mediation analyses. Group sizes were adjusted to TBI (n = 10) and Sham (n = 9). However, for subsequent behavioral testing days (3-CSRT, days 2–5), two TBI rats were excluded due to issues with dental acrylic caps. These rats were included in day 1 analyses but omitted from subsequent days, resulting in the final group sizes of TBI (n = 8) and Sham (n = 9) for 3-CSRT testing days 2–5.
3-CSRT training
Twenty rats reached criterion performance at the testing level (i.e., 2-sec cue duration) after 14.35 ± 1.06 training sessions. At the 15-, 5-, and 2-sec cue durations, they required 4.10 ± 0.19, 3.20 ± 0.09, and 7.05 ± 1.04 training sessions (Fig. 1C), respectively, to meet criterion performance of >80% accuracy (Fig. 1D) and <20% omissions (Fig. 1E). Meeting training criterion required 127.63 ± 3.40, 127.83 ± 2.43, and 128.06 ± 1.43 total trials at the 15-, 5-, and 2-sec cue durations, respectively (Fig. 1F). No statistical analyses were necessary prior to group designations.
Acute neurological assessments
A Student’s t-test revealed significant differences in hindlimb reflex paw withdrawal latency between the Sham and TBI rats for both the left (Sham: 21.20 ± 2.18 sec, TBI: 168.80 ± 6.18 sec; p < 0.01) and right (Sham: 16.7 ± 2.26 sec, TBI: 164.10 ± 6.10 sec; p < 0.01) limbs. Significant differences were also observed in the two groups in the return of righting ability (Sham: 123.20 ± 7.37 sec, TBI: 339.40 ± 15.76 sec; p < 0.05). No differences in core body temperature were revealed (Sham: 37.29 ± 0.06°C, TBI: 37.20 ± 0.10°C; p > 0.05).
Following guide cannula implantation, a Student’s t-test revealed no significant difference between the Sham and TBI groups in hindlimb reflex paw withdrawal latency on either the left (Sham: 29.51 ± 8.89 sec, TBI: 33.10 ± 6.77 sec; p > 0.05) or right side (Sham: 26.43 ± 8.88 sec, TBI: 28.40 ± 6.29 sec; p > 0.05), indicating comparable anesthetic exposure during the surgery. There were also no differences in core body temperature throughout the surgery (Sham: 36.43 ± 0.18°C, TBI: 36.50 ± 0.17°C; p > 0.05). Assessment of the righting reflex was not performed to preserve the integrity of the dental acrylic cap.
Post-injury 3-CSRT performance
Percent accuracy
A rmANOVA revealed significant and persistent deficits in sustained attention after TBI, as evidenced by a reduction in percent accuracy in the 3-CSRT throughout testing compared to baseline and sham group performance. Specifically, a significant Group, F(1,100) = 76.65, p < 0.0001; Day, F(5,100) = 13.85, p < 0.0001; and Group × Day interaction, F(5,100) = 3.760, p < 0.01, was observed (Fig. 2A). Newman-Keuls post hoc analyses showed no difference in baseline percent accuracy between the TBI and Sham groups (p > 0.05), indicating all rats performed at criterion level before injury. During the testing sessions, the Sham group did not differ from its baseline (p’s > 0.05), suggesting that neither the craniectomy nor the cannula surgery disrupted attentional performance. The TBI group displayed significant deficits throughout testing compared to its own baseline (p’s < 0.05) and the Sham control group (p’s < 0.05). Post hoc analyses also revealed significant reductions in percent accuracy in the TBI group on test days 1-2 relative to day 5.
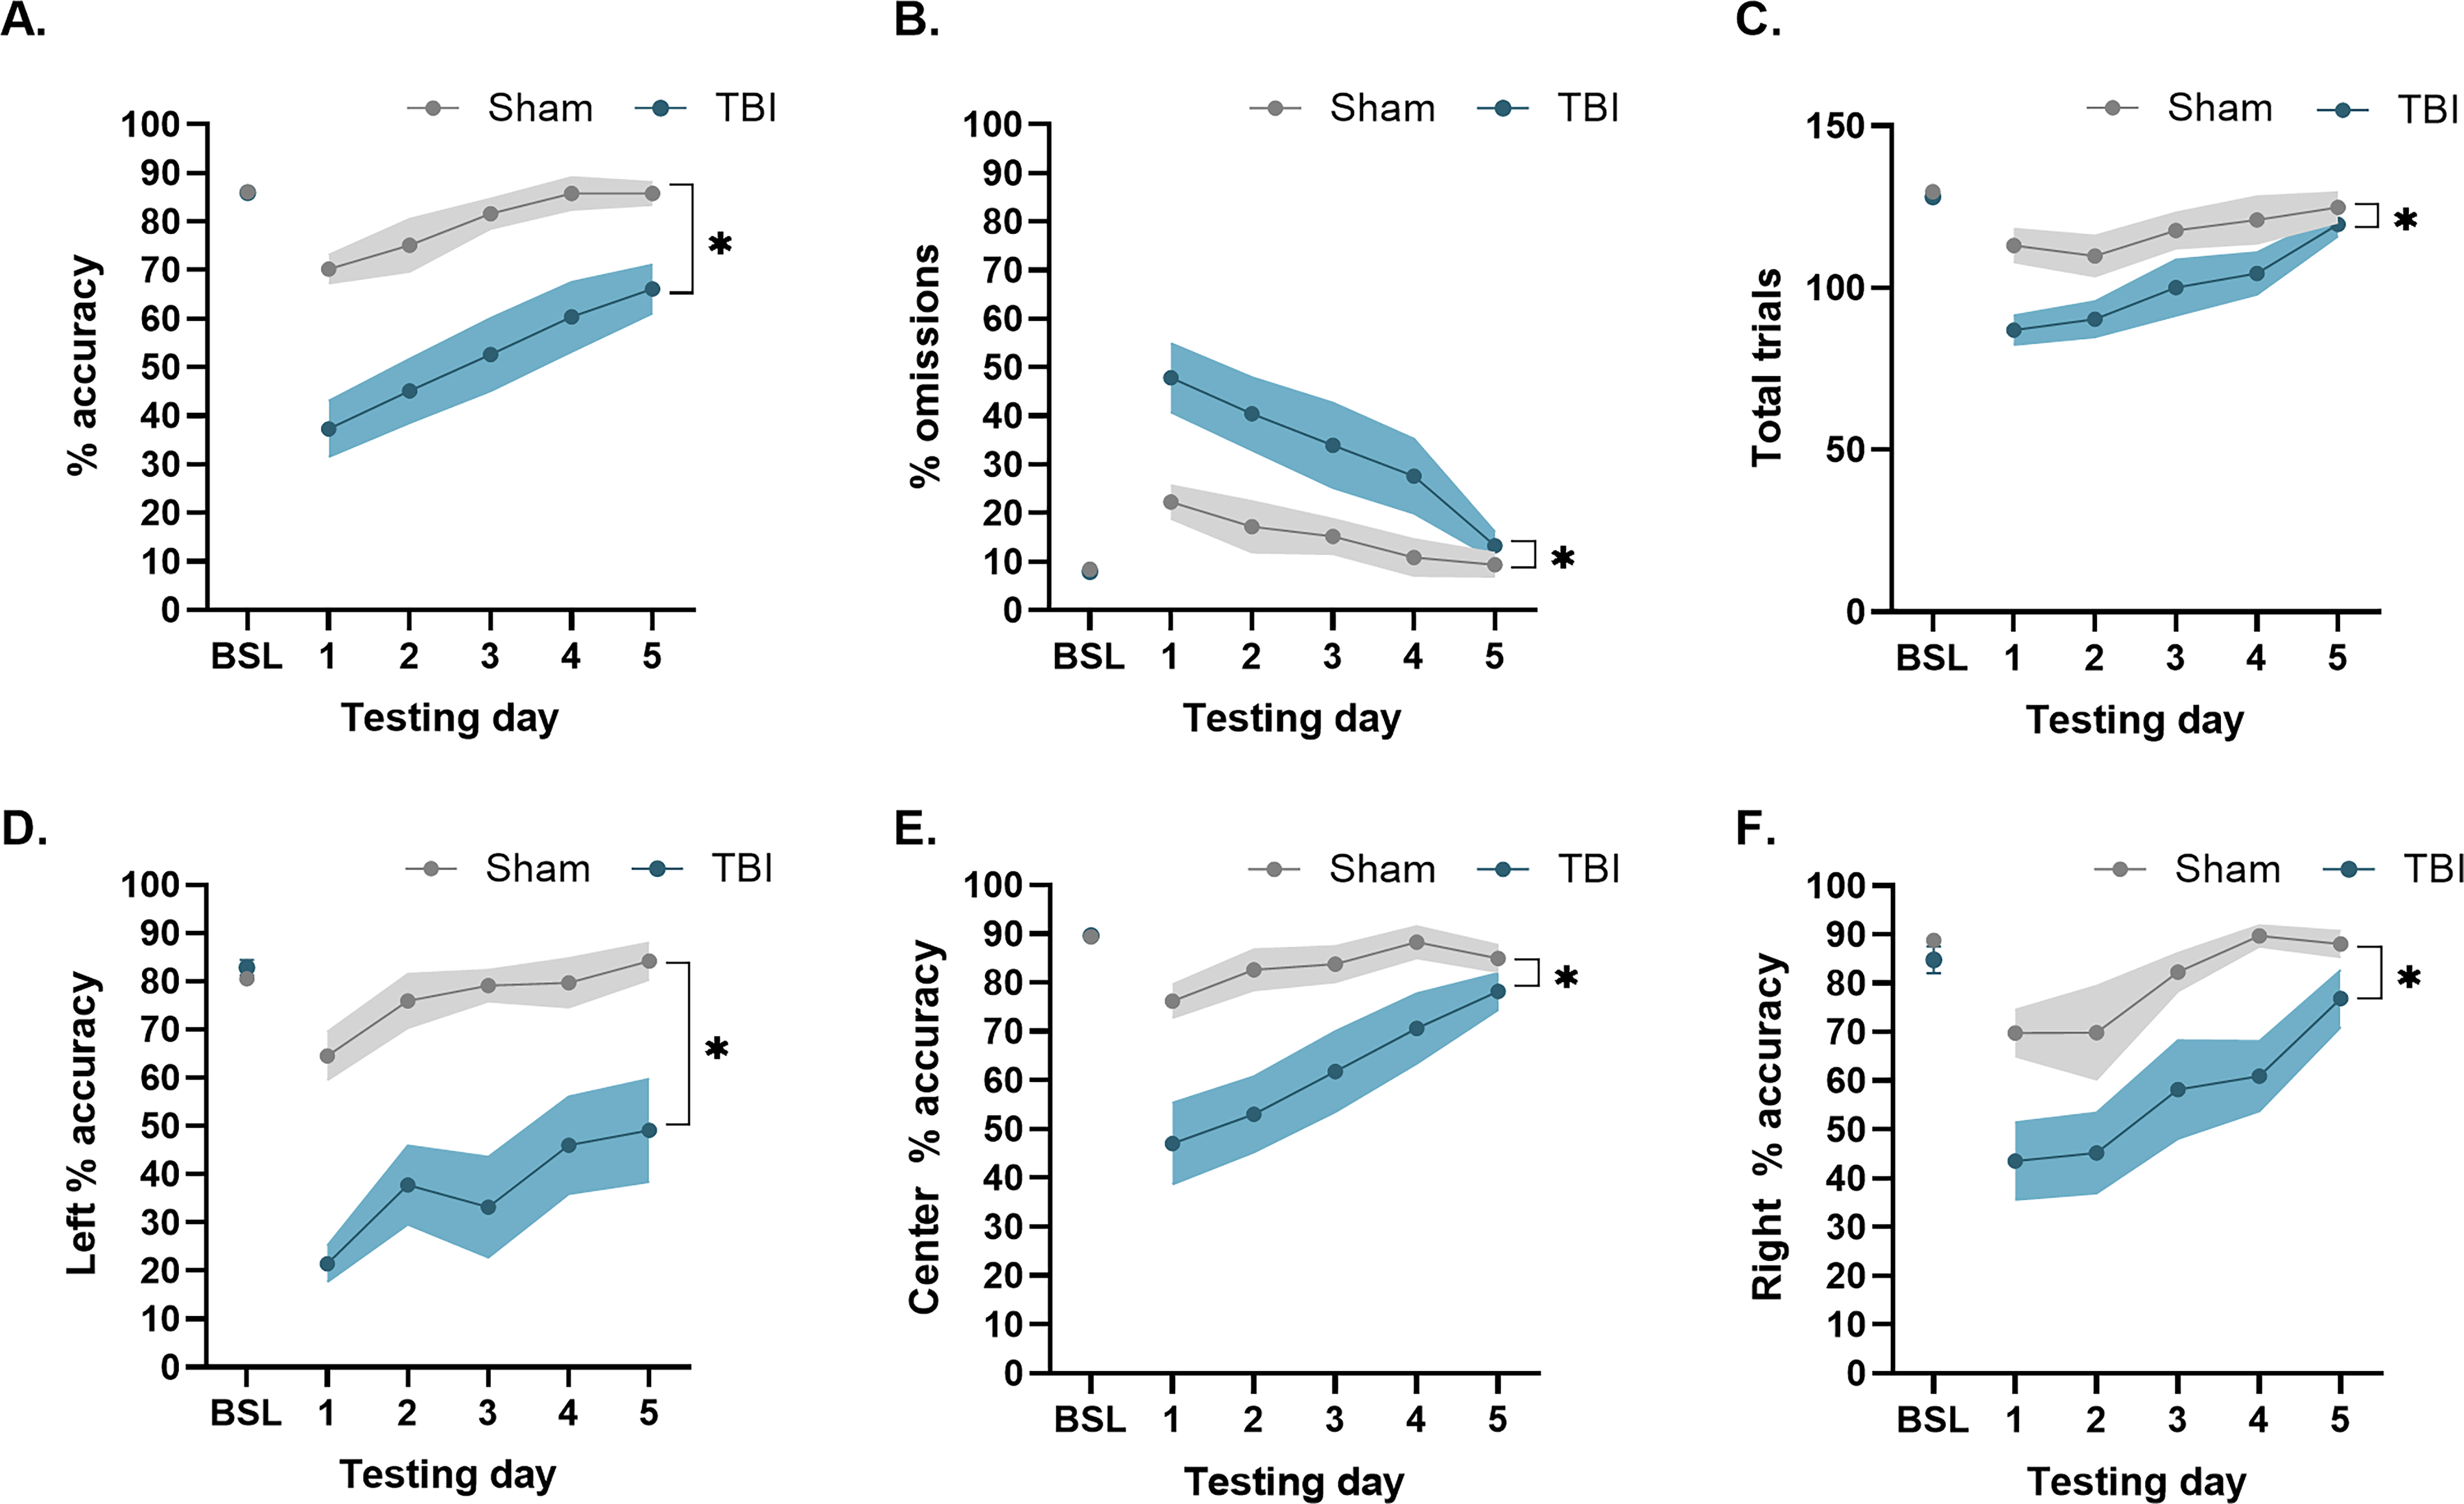
TBI produced significant deficits to sustained attention and exacerbated distractibility 3-weeks post-injury. Mean (±SEM)
Percent omissions
A rmANOVA determined that TBI disrupted measures of distractibility, as demonstrated by increased percent omissions throughout testing compared to baseline and shams. There were significant Group, F(1,100) = 26.42, p < 0.0001; Day, F(5,100) = 9.137, p < 0.0001; and Group × Day, F(5,100) = 2.38, p < 0.05, effects (Fig. 2B). Newman-Keuls post hoc analyses indicated that the TBI and Sham groups did not differ in baseline percent omissions prior to injury (p > 0.05). After injury, the TBI group had significantly more omissions on testing days 1-4 compared to its baseline and the Sham group, which did not differ from its own baseline performance (p’s > 0.05).
Total trials
Figure 2C displays the effects of injury on total trials in the 3-CSRT at PID 21–25. A rmANOVA determined that TBI induced significant Group, F(1,100) = 21.73, p < 0.0001, and Day, F(5,100) = 9.82, p < 0.0001, but no significant Group × Day effects, F(5,100) = 1.54, p > 0.05. Newman–Keuls post hoc analyses revealed no difference in total trials between the TBI and Sham group prior to surgery (p > 0.05). During 3-CSRT testing days 1-4, the TBI group exhibited significant deficits in total trials compared to its own baseline performance (p’s < 0.05). Both the Sham and TBI groups performed well over 10% of their baseline total trial performance, suggesting that despite a slight, yet significant, reduction in total trials, task engagement remained intact, and increased omissions were not attributable to motivational disengagement or motor impairments, as previously reported.22–25
Cue-port percent accuracy
Similar baseline percent accuracy was noted between the groups assigned to TBI and Sham conditions in left cue-port, center cue-port, and right cue-port performance (p’s > 0.05), indicating a lack of spatial bias prior to injury. After injury, a rmANOVA on the left-cue port data revealed significant Group, F(1,100) = 86.61, p < 0.0001; Day, F(5,100) = 9.790, p < 0.0001; and Group × Day, F(5,100) = 4.54, p < 0.001, effects. The post hoc analysis revealed significant reductions in left-cue port percent accuracy in the TBI group compared to the Sham controls (p < 0.05; Fig. 2D). Throughout testing, the Sham group maintained consistent left cue-port accuracy compared to its own baseline (p > 0.05), while the TBI group continued to exhibit significant deficits compared to its own baseline performance (p < 0.05). For the center cue-port analysis, the rmANOVA revealed significant Group, F(1,100) = 37.11, p < 0.0001; Day, F(5,100) = 8.67, p < 0.0001; and Group × Day, F(5,100) = 3.07, p < 0.05, effects. The post hoc analysis revealed significant reductions in center-cue port percent accuracy in the TBI group compared to the Sham controls (p < 0.05). Throughout testing, percent accuracy of the center-cue port remained consistent with baseline performance in the Sham group (ps > 0.05), but within the TBI group, significant deficits in center-cue port accuracy were observed on testing days 1-4 relative to its own baseline performance (p’s < 0.05; Fig. 2E). Finally, for right cue-port analysis, the rmANOVA revealed significant Group, F(1,100) = 32.24, p < 0.0001, and Day, F(5,100) = 8.84, p < 0.0001, effects (Fig. 2F). The Newman-Keuls post hoc test determined that the TBI group was significantly impaired relative to the Sham control group (p < 0.05) and its own baseline.
ACh efflux during 3-CSRT task
Schematic representation of dialysate samples collected prior to (i.e., −30, −15, and 0 min), during (i.e., 15 and 30 min) and post (sample collected at 45 min) performance of the 3-CSRT (Fig. 3A). Absolute basal levels of ACh in the ipsilateral mPFC prior to task onset were comparable between Sham and TBI groups (Sham: 25.99 ± 19.98, 24.05 ± 19.11, 23.71 ± 19.58 fmol/30 min; TBI: 17.27 ± 9.62, 14.37 ± 5.71, 12.11 ± 5.14 fmol/30 min; Group: F(1,51) = 0.75, p = 0.39; Time: F(2,51) = 0.04, p = 0.97). A rmANOVA revealed that prior to task onset, there were no significant Group, F(1,51) = 0.750, p > 0.05; Time, F(2,51) = 0.034, p > 0.05; or Group × Time, F(2,51) = 0.005, p > 0.05, differences in basal ACh levels between the TBI and Sham groups (Fig. 3C). Therefore, basal ACh efflux was adjusted as a percentage of the mean (±SEM) of basal ACh efflux. Following task onset, rmANOVA revealed a significant increase in task-evoked release of ACh in the Sham Group, F(1,102) = 17.16, p < 0.0001; across Time, F(5,102) = 5.31, p < 0.001; and Group × Time interactions, F(5,102) = 4.14, p < 0.01. Newman-Keuls post hoc analyses indicated that the Sham group exhibited a significant increase in task-evoked ACh at 15, 30, and 45 min compared to their basal ACh levels (p < 0.05). The TBI group did not show a significant increase in task-evoked ACh release across testing samples compared to their basal efflux (p > 0.05). Between-group comparisons revealed significantly higher ACh levels in the Sham group at 15 (p < 0.05), 30 (p < 0.001), and 45 min (p < 0.0001) during the 3-CSRT compared to the TBI group.
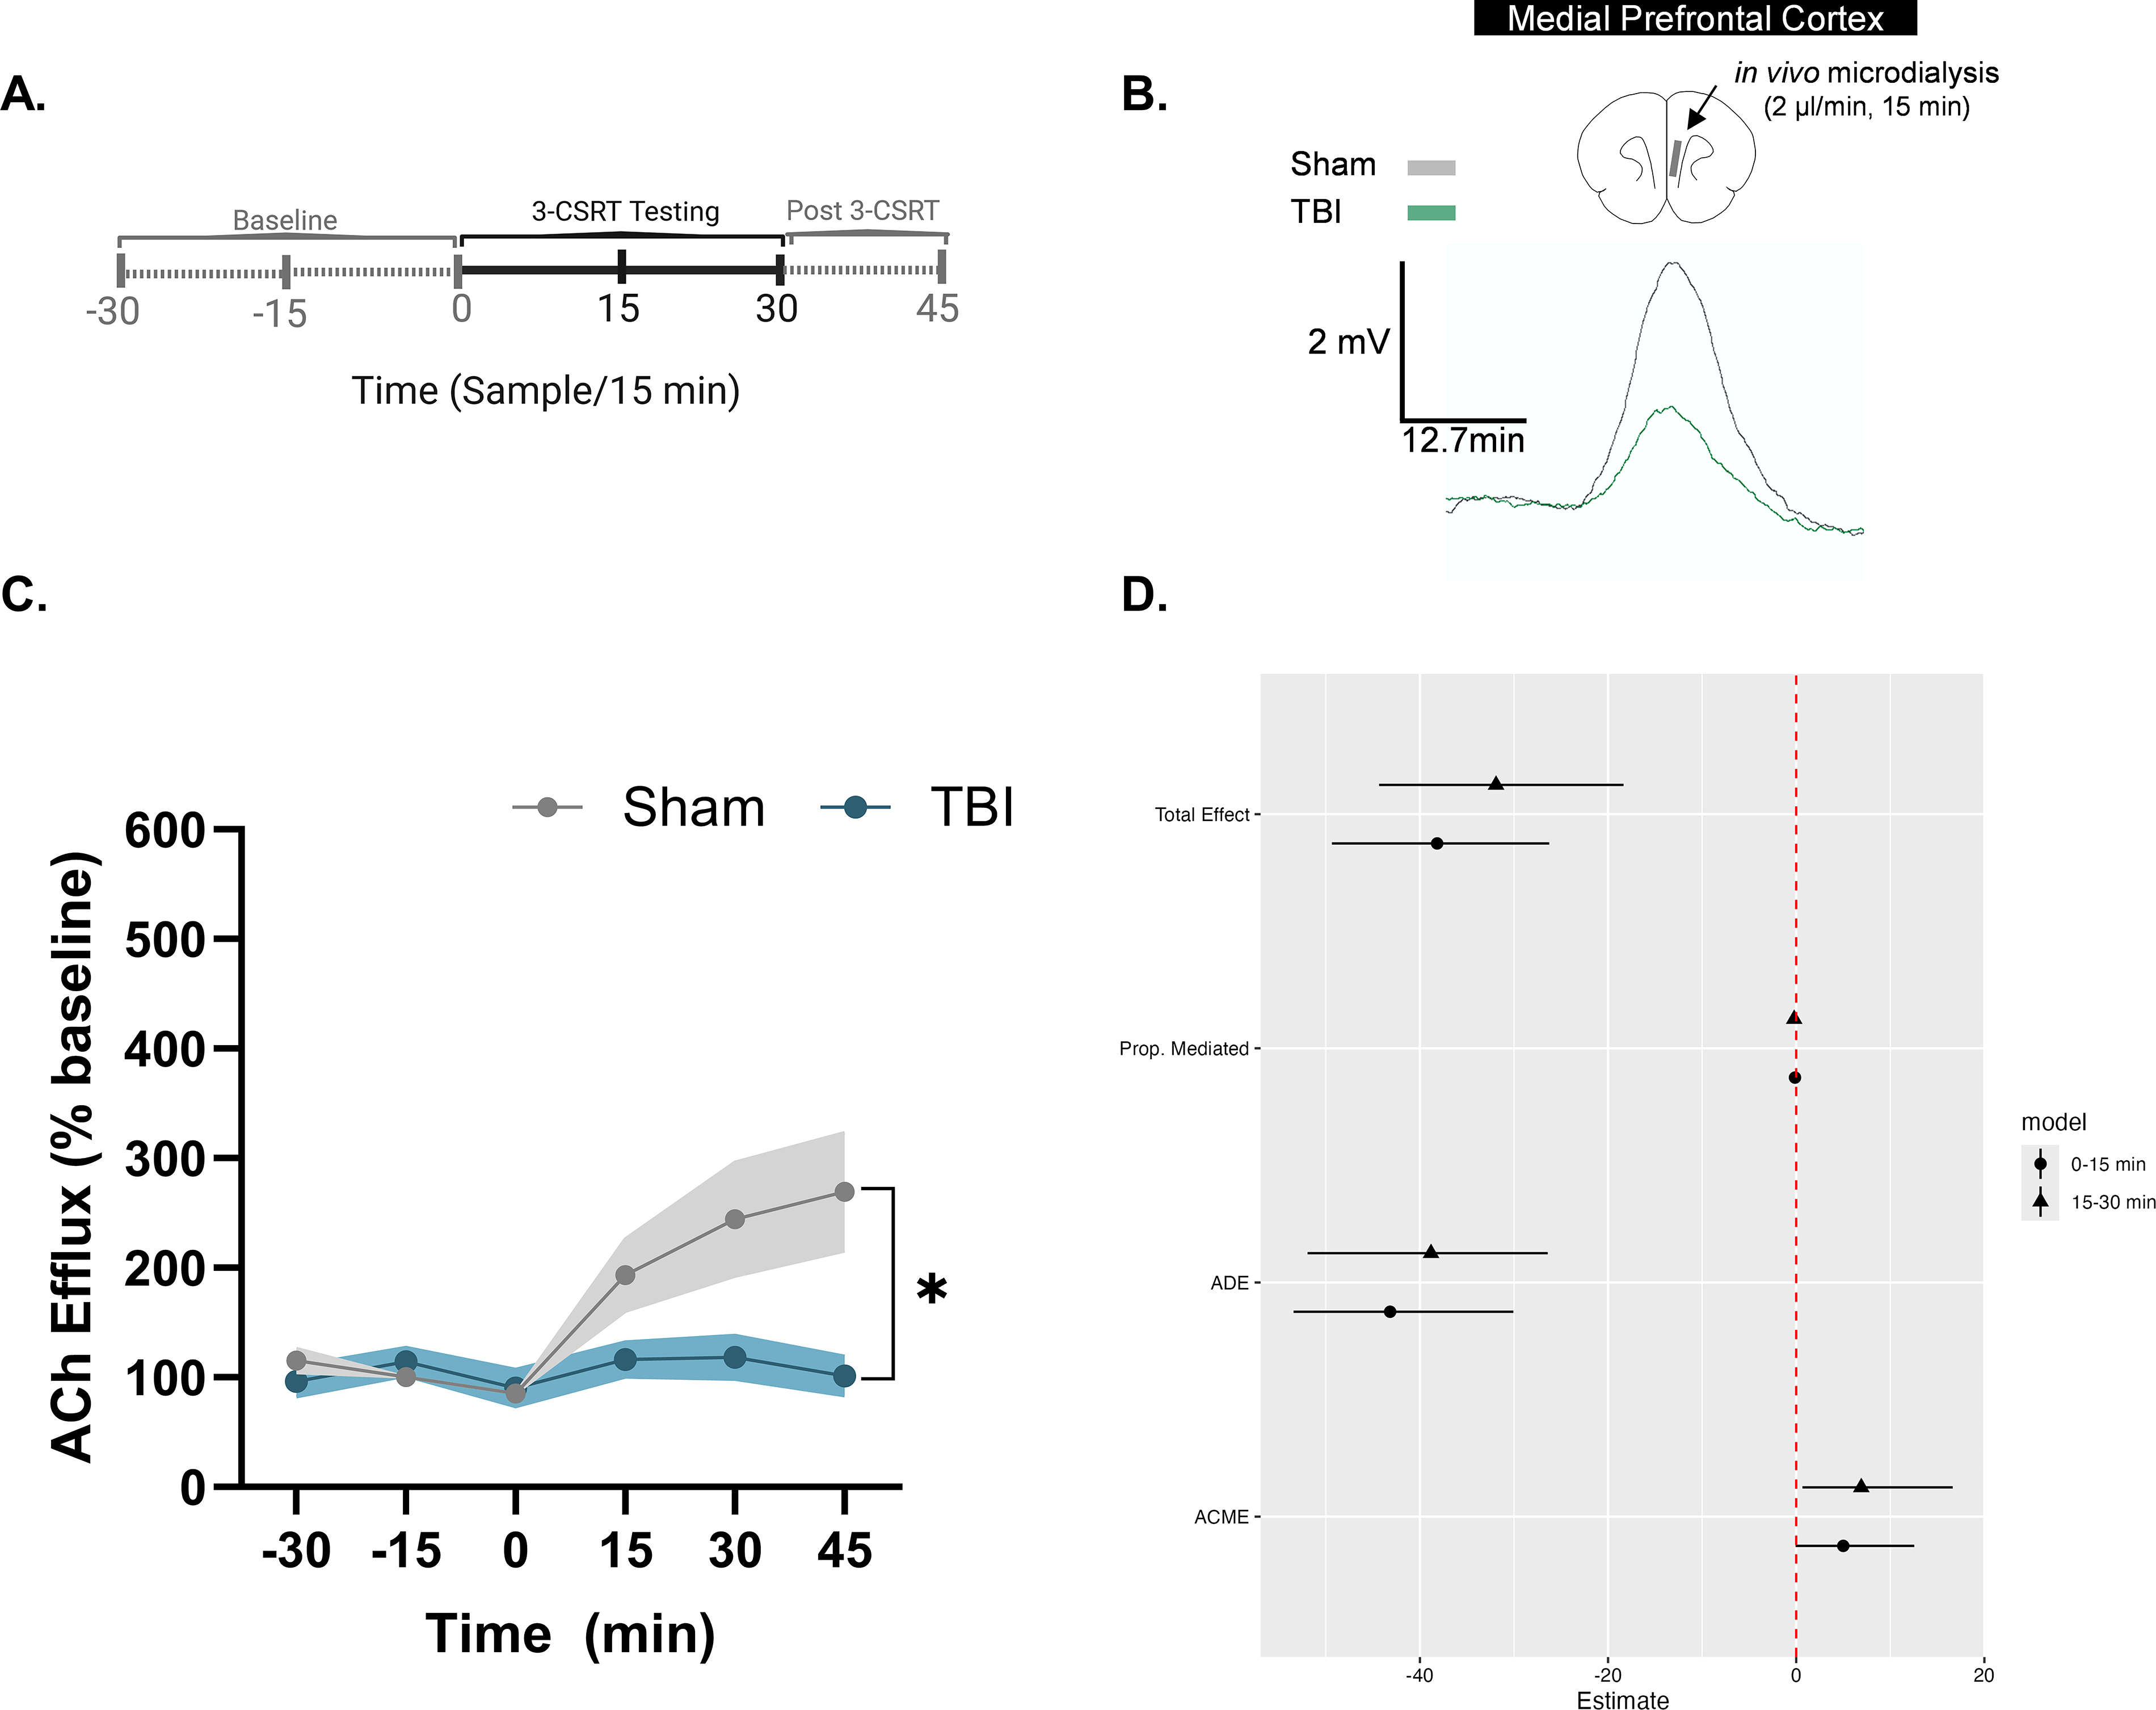
Task-evoked acetylcholine (ACh) efflux in the mPFC mediates TBI-induced deficits of 3-CSRT performance.
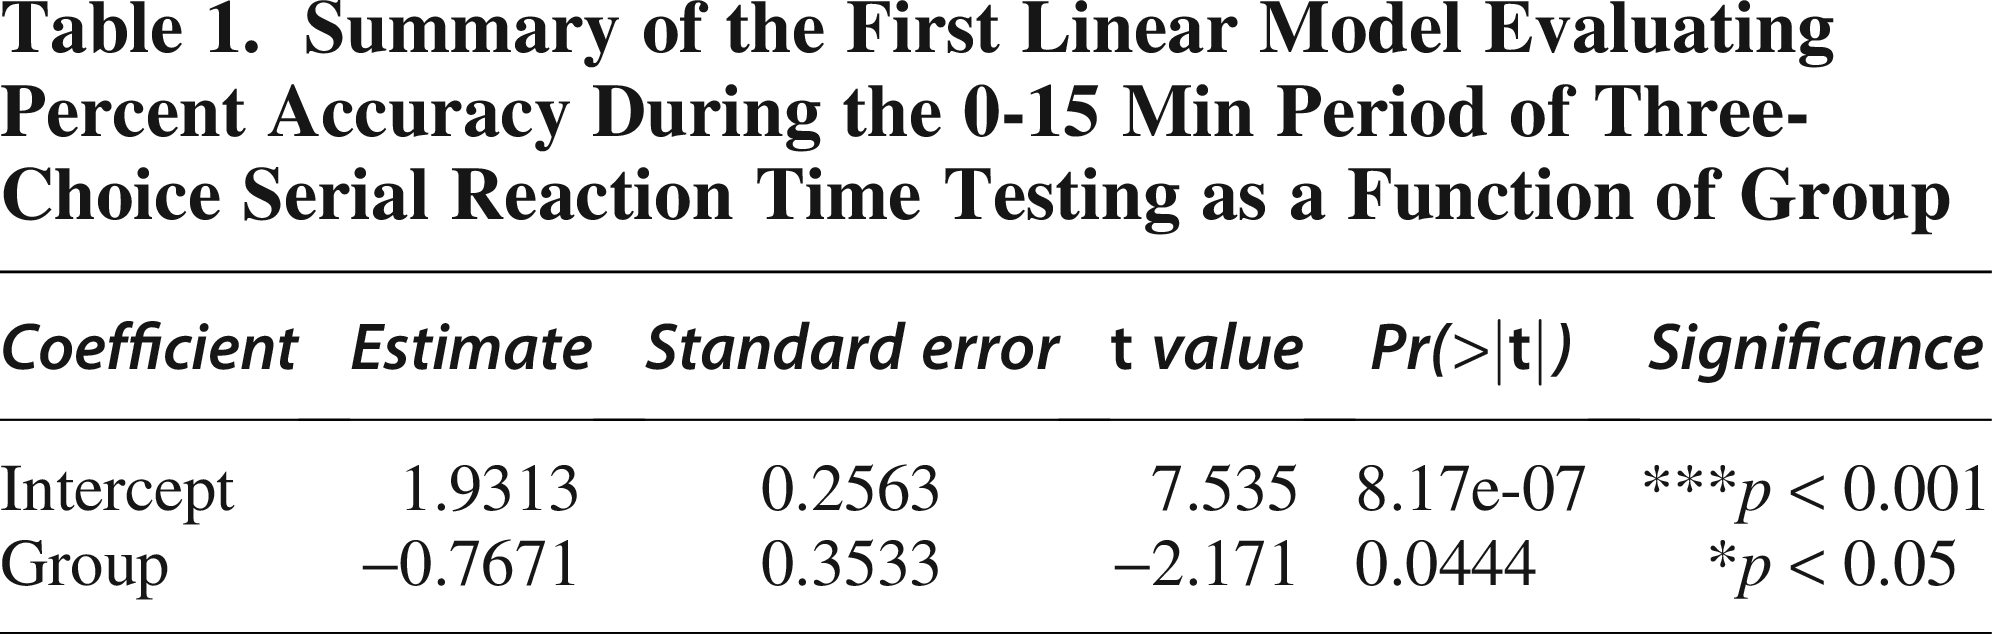
Linear modeling of group effects on accuracy and ACh efflux
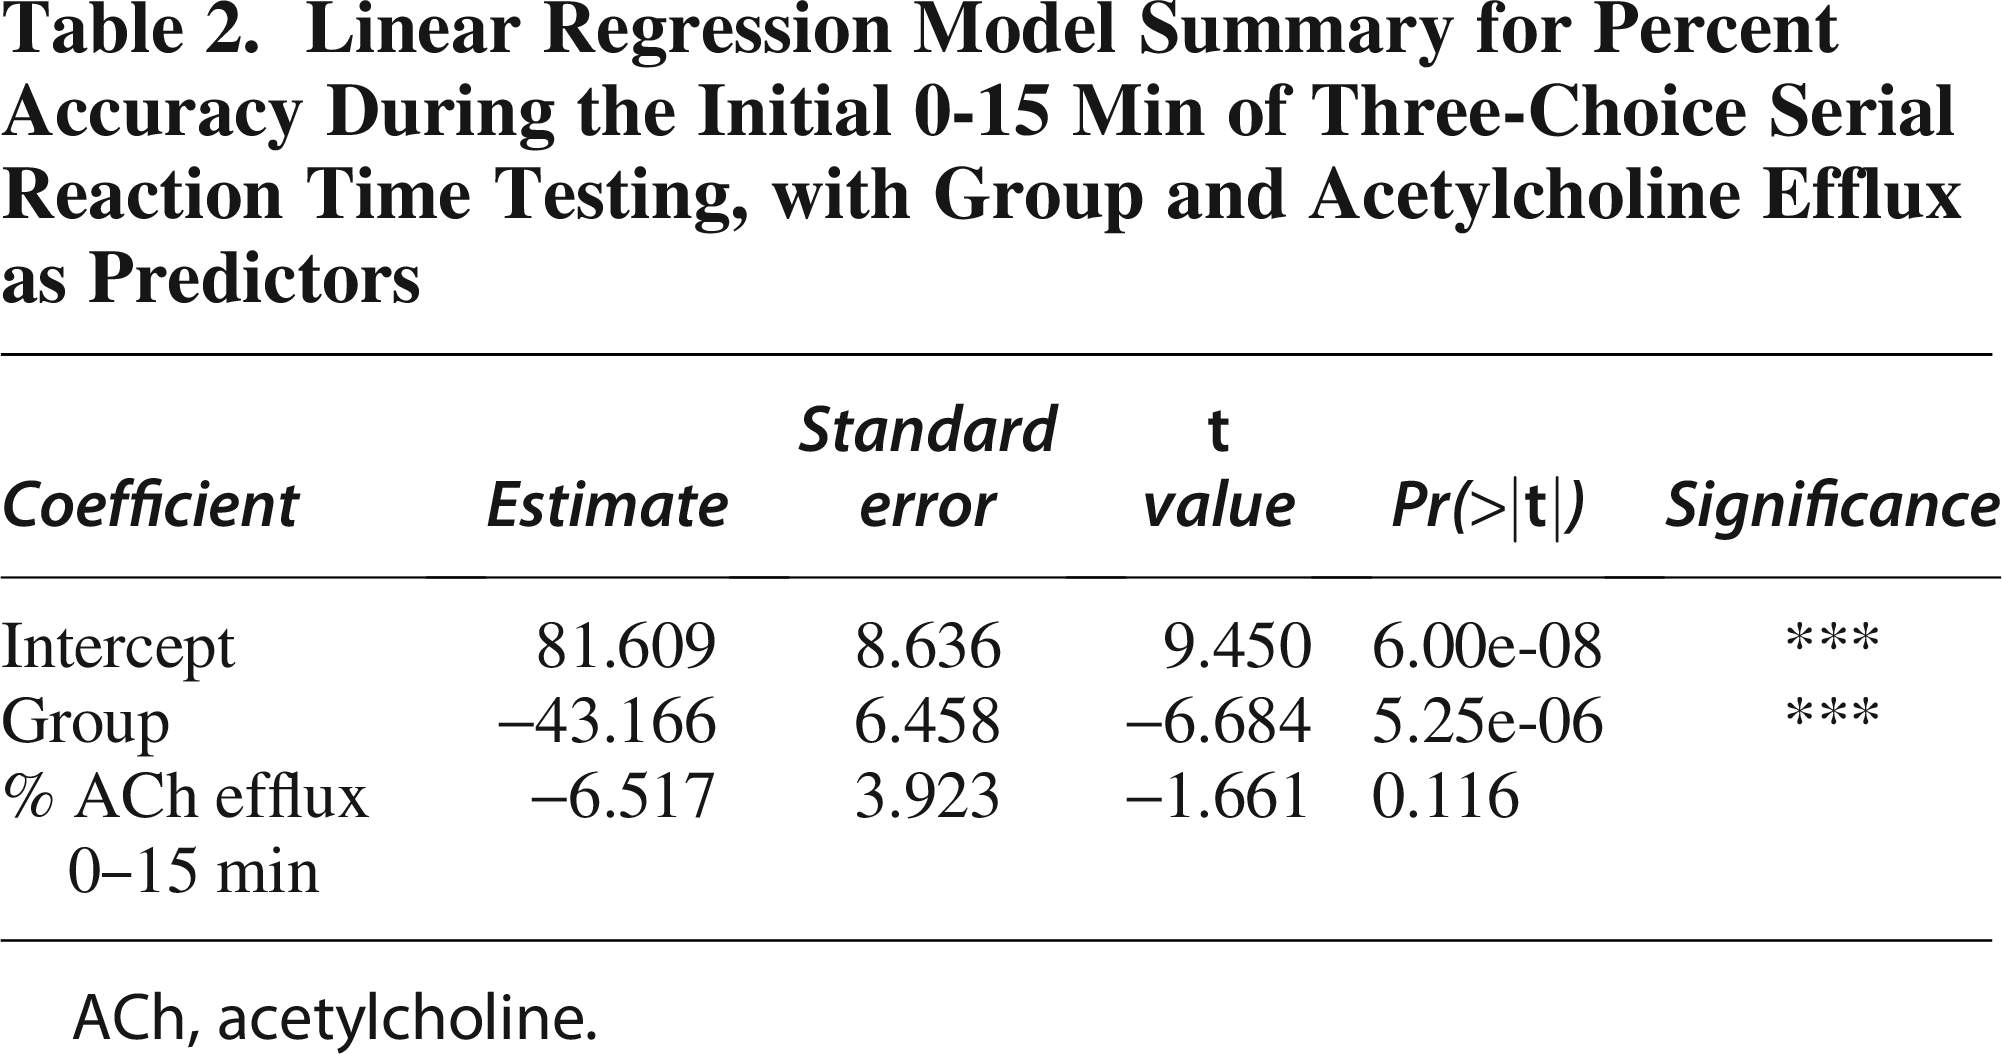
To assess the early effects of TBI on task performance, we first modeled accuracy during the initial 0-15 min of 3-CSRT testing as a function of group (Sham vs. TBI). Linear regression (Table 1) revealed a significant effect of group on accuracy, with TBI rats showing reduced performance compared to Sham controls (estimate = −0.7671 ± 0.3533, t = −2.171, p = 0.0444). We next modeled percent accuracy as a function of both group and ACh efflux during the 0-15 min interval (Table 2). This analysis revealed a significant effect of group on % accuracy (estimate = −43.166 ± 6.458, t = −6.684, p < 0.0001), while ACh efflux showed a negative trend but did not reach significance (estimate = −6.517 ± 3.923, t = −1.661, p = 0.116). The intercept was also significant (estimate = 81.609 ± 8.636, p < 0.0001).
Summary of the First Linear Model Evaluating Percent Accuracy During the 0-15 Min Period of Three-Choice Serial Reaction Time Testing as a Function of Group
Linear Regression Model Summary for Percent Accuracy During the Initial 0-15 Min of Three-Choice Serial Reaction Time Testing, with Group and Acetylcholine Efflux as Predictors
ACh, acetylcholine.
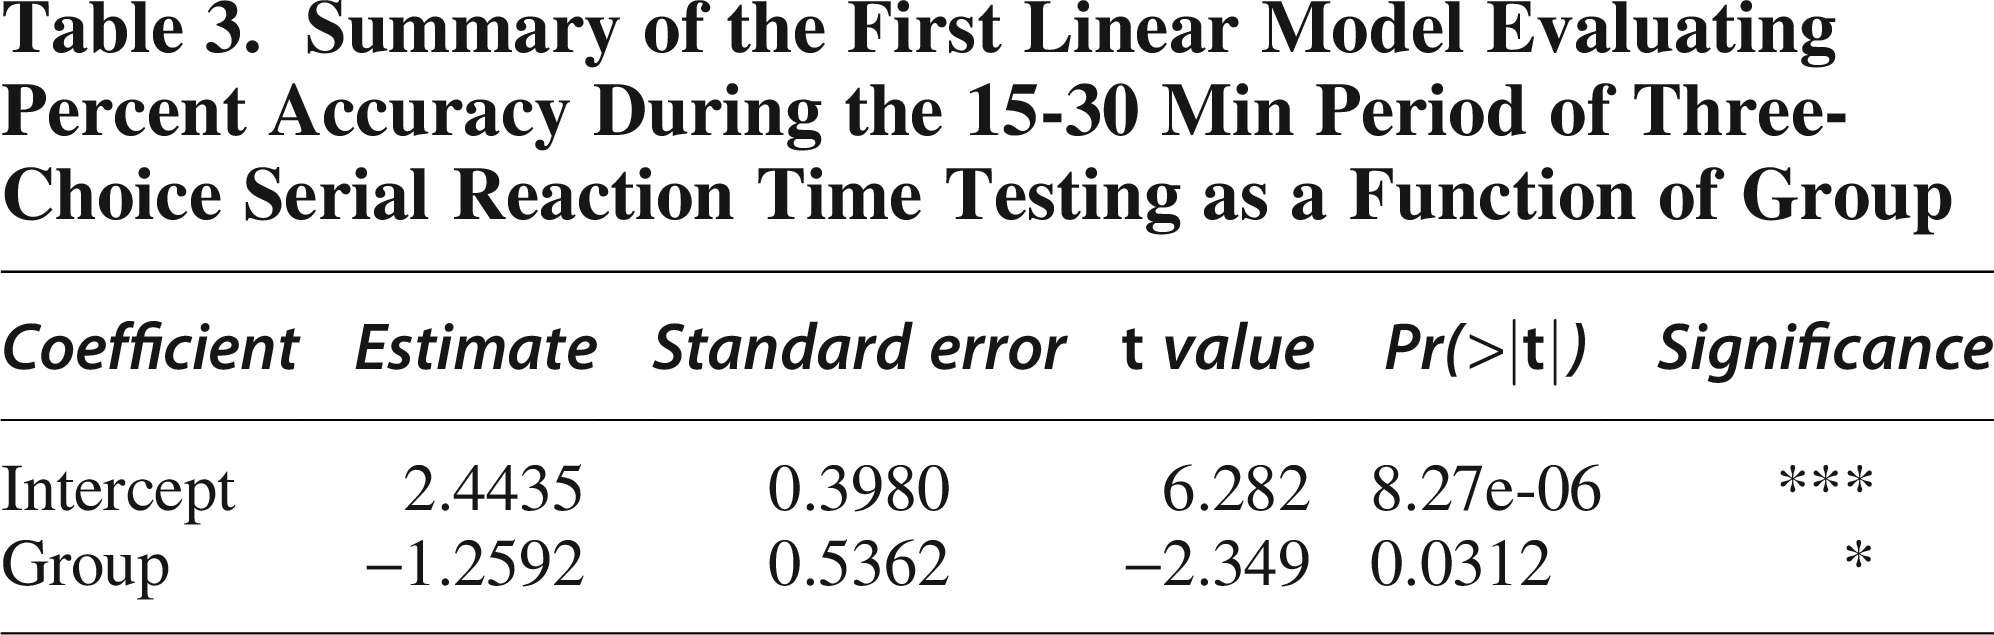
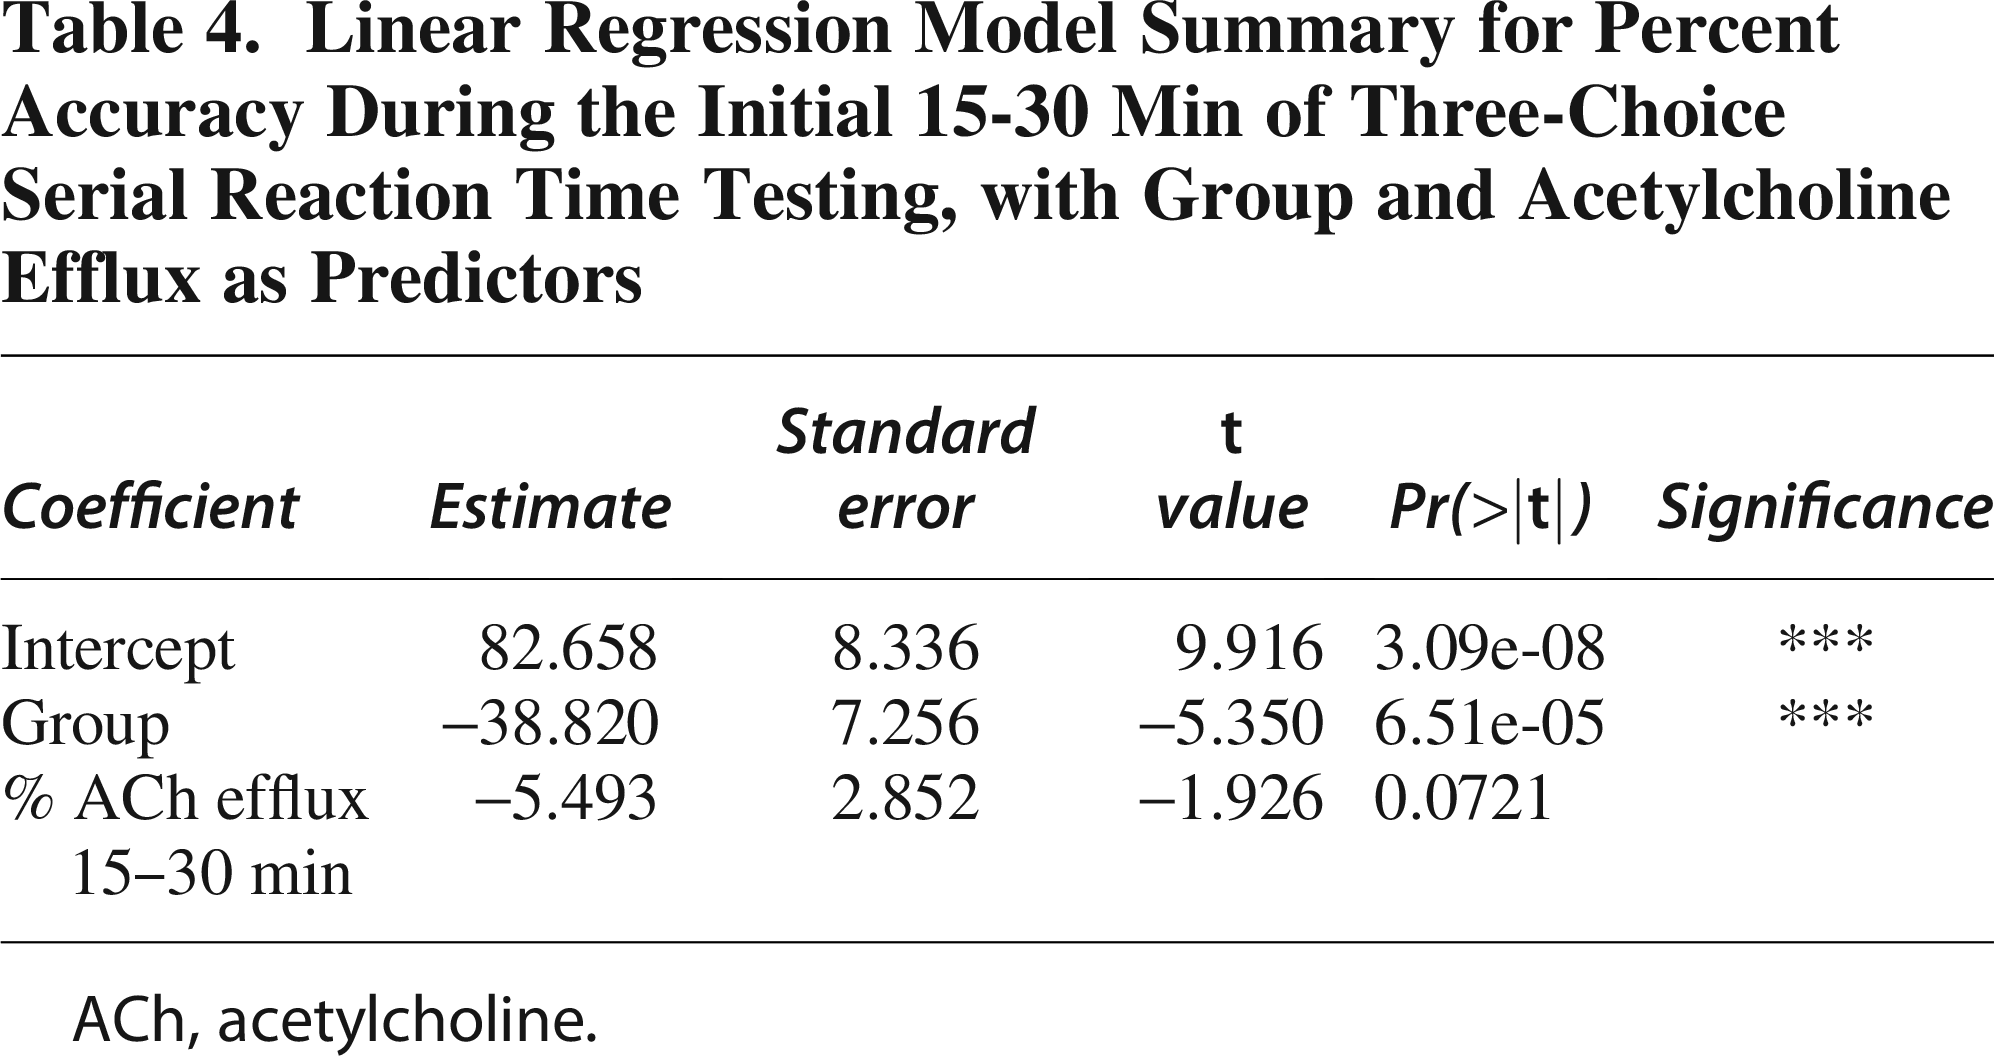
To evaluate whether the group effect persisted into the second phase of 3-CSRT testing, we modeled accuracy during the 15-30 min interval as a function of group (Sham vs. TBI; Table 3). This analysis showed a significant group effect, with TBI rats again demonstrating lower accuracy compared to Sham (estimate = −1.2592 ± 0.5362, t = −2.349, p = 0.0312). We then modeled percent accuracy as a function of both group and ACh efflux during the 15-30 min interval (Table 4). TBI was again associated with significantly reduced accuracy (estimate = −38.820 ± 7.256, t = −5.350, p < 0.0001). ACh efflux showed a trend toward a negative effect on accuracy but did not reach conventional significance (estimate = −5.493 ± 2.852, t = −1.926, p = 0.0721).
Summary of the First Linear Model Evaluating Percent Accuracy During the 15-30 Min Period of Three-Choice Serial Reaction Time Testing as a Function of Group
Linear Regression Model Summary for Percent Accuracy During the Initial 15-30 Min of Three-Choice Serial Reaction Time Testing, with Group and Acetylcholine Efflux as Predictors
ACh, acetylcholine.
Mediation analyses
Sustained attention (% accuracy)
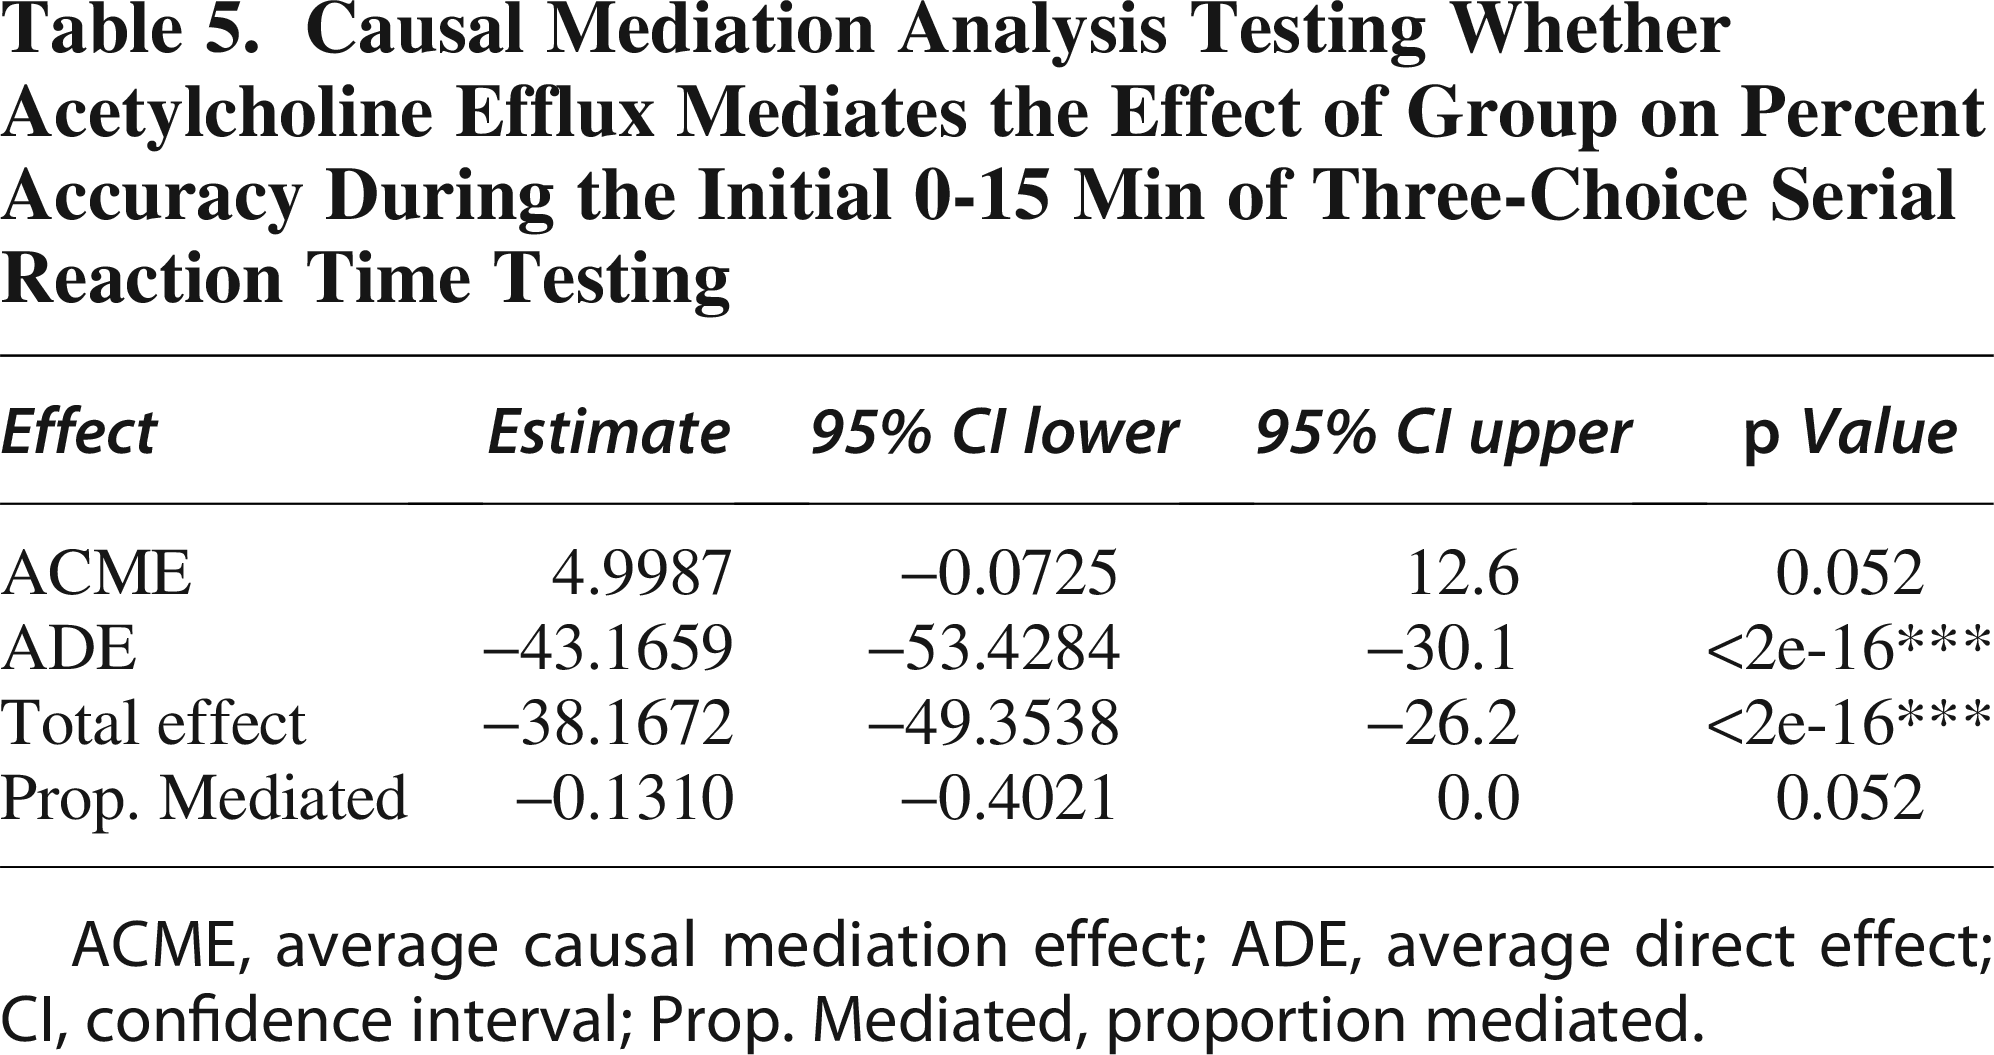
During the first 15-min interval, the analysis revealed a significant ACME of 4.999 (95% CI: −12.020 to −0.29, p = 0.052), indicating that decreased ACh efflux partially mediates the reduction in % accuracy associated with TBI (Table 5). This finding suggests that lower ACh efflux contributes to the decreased % accuracy observed in TBI compared to Sham. Conversely, the ADE was −43.166 (95% CI: 30.775 to 54.12, p < 0.0001), highlighting a substantial direct effect of TBI on % accuracy independent of ACh efflux, suggesting an overall negative impact of TBI on % accuracy. The total effect was −38.167 (95% CI: 27.105 to 49.48, p < 0.0001), reflecting the combined influence of both direct and mediated pathways. The proportion mediated was −0.131 (95% CI: −0.376 to −0.01, p < 0.05), indicating that approximately 13.1% of the total effect of TBI on % accuracy is mediated through ACh efflux. These results highlight that while TBI directly impairs % accuracy, there is a significant mediation effect partially attributable to reductions in ACh efflux, illustrating the complex interplay between TBI, ACh efflux, and % accuracy.
Causal Mediation Analysis Testing Whether Acetylcholine Efflux Mediates the Effect of Group on Percent Accuracy During the Initial 0-15 Min of Three-Choice Serial Reaction Time Testing
ACME, average causal mediation effect; ADE, average direct effect; CI, confidence interval; Prop. Mediated, proportion mediated.
During the second interval (15-30 min), causal mediation analysis revealed that TBI significantly impacts accuracy, both directly and through changes in ACh efflux (Table 6). The ACME was 6.916 (95% CI: −16.813 to −0.62, p < 0.05), indicating that reduced ACh efflux partially mediates the adverse effect of TBI on accuracy, with a significant contribution to decreased performance. The ADE was −38.820 (95% CI: 27.069 to 51.57, p < 0.0001), reflecting a substantial direct impact of TBI on accuracy, independent of ACh efflux. The total effect was −31.904 (95% CI: 20.044 to 43.97, p < 0.0001), showing that TBI significantly reduces accuracy overall, incorporating both direct and mediated pathways. Additionally, the proportion mediated was −0.217 (95% CI: −0.641 to −0.02, p = 0.021), indicating that approximately 21.7% of the total effect of TBI on accuracy is mediated through changes in ACh efflux. These results highlight that TBI impacts accuracy through both a direct effect and a mediated pathway involving ACh efflux (graphical illustration in Fig. 3D).
Causal Mediation Analysis Testing Whether Acetylcholine Efflux Mediates the Effect of Group on Percent Accuracy During the Initial 15-30 Min of Three-Choice Serial Reaction Time Testing
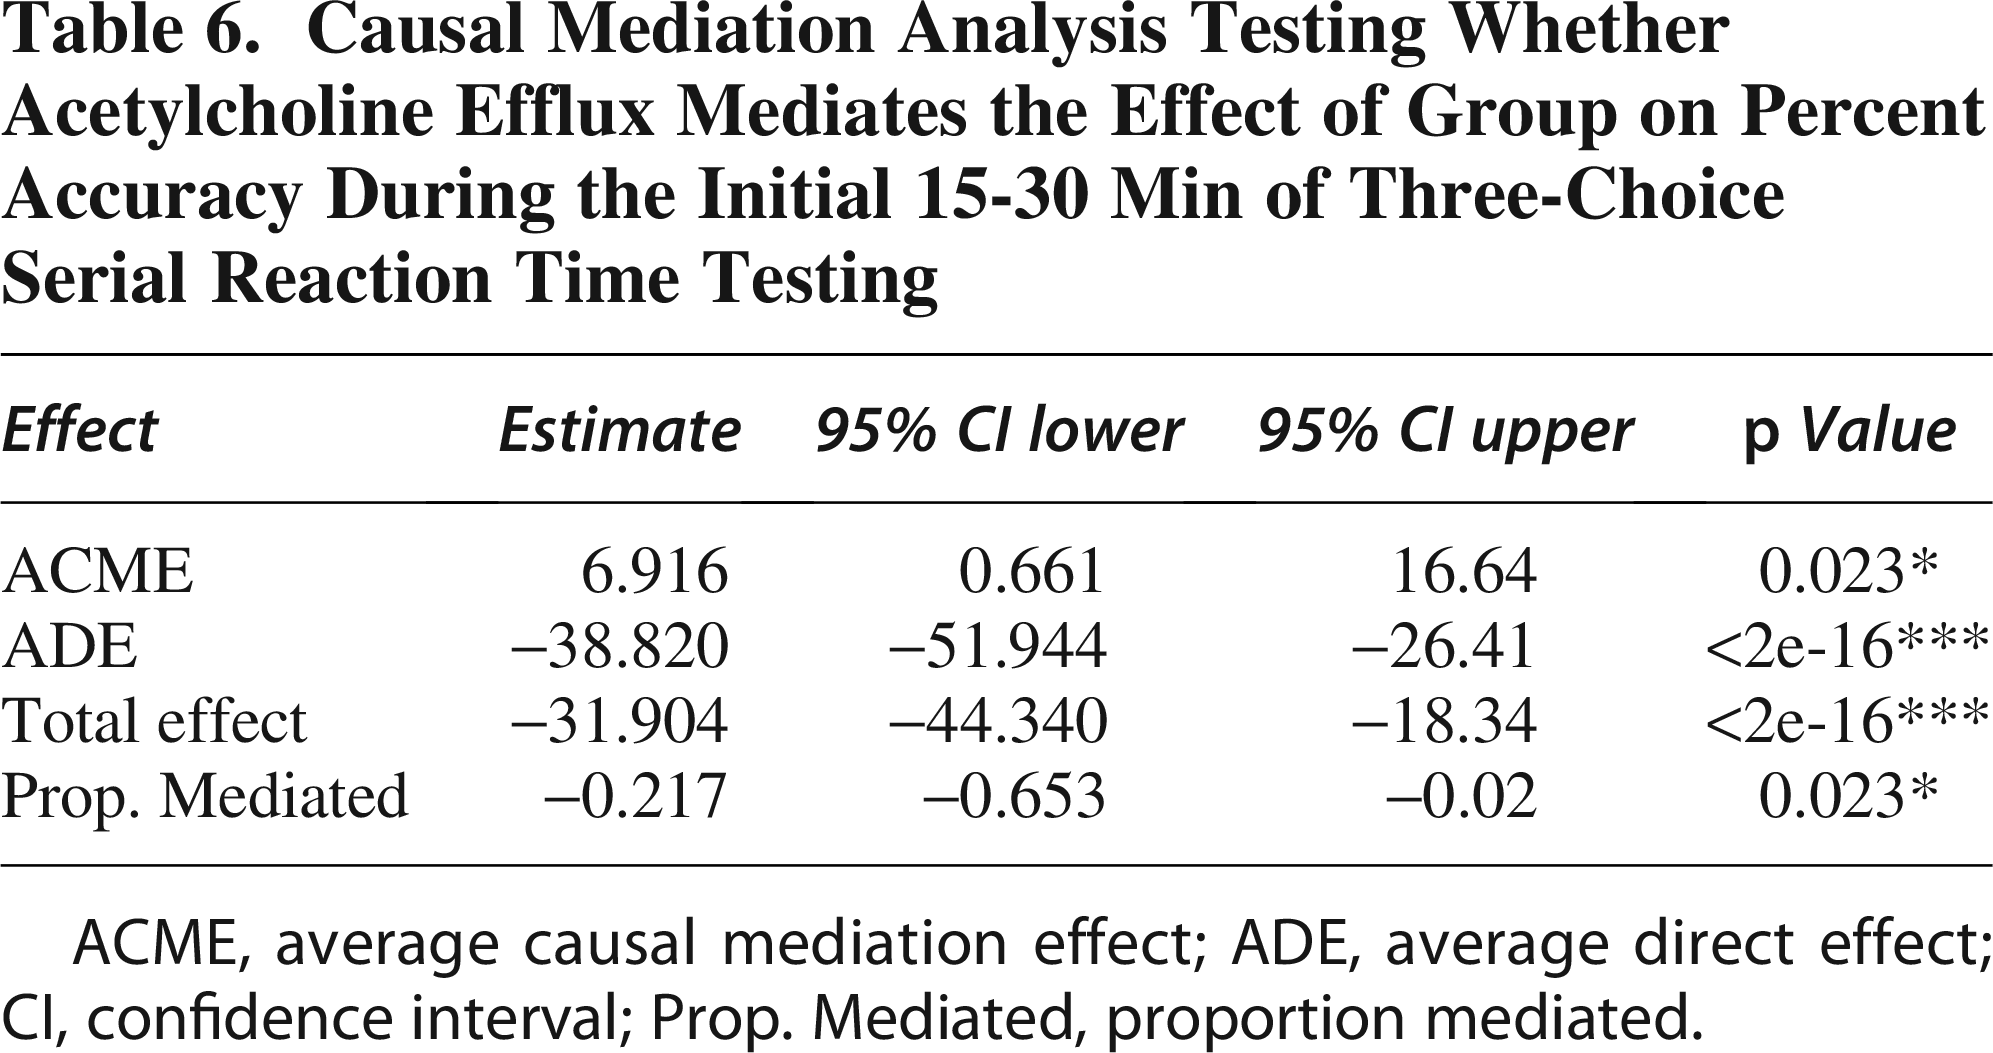
ACME, average causal mediation effect; ADE, average direct effect; CI, confidence interval; Prop. Mediated, proportion mediated.
Histology
Cortical lesion volume and probe placement
Whole-brain three-dimensional representative scans of Sham or TBI with guide cannula insertion site are depicted in Supplementary Fig. S2. At PID 26, CCI induced a cortical lesion volume of 40.13 ± 5.19 mm3 mean (±SEM; Supplementary Fig. S2). Negligible tissue displacement was observed in the ipsilateral mPFC due to cannula implantation. Examination of mPFC tissue displacement revealed no significant differences between the Sham and TBI groups, F(8,9) = 3.67, p > 0.05, with the mean (±SEM) tissue displacement for the Sham group at 1.064 ± 0.34 mm3 and for the TBI group at 0.94 ± 0.73 mm3 (Supplementary Fig. S2). Supplementary Figure S2 schematic depicts the correct placement of the microdialysis probe for each rat that underwent behavioral microdialysis.
Immunofluorescence
The cumulative sum of ChAT+ cells, across the five sections, in the Sham (contralateral: n = 1090 and ipsilateral: n = 1141) and TBI (contralateral: n = 910 and ipsilateral: n = 773) nbM was recorded. A nested t-test revealed no significant differences, F(1,4) = 0.30, p > 0.05, in the total number of ChAT+ cells in the contralateral nbM between the Sham (mean ± SEM: 72.67 ± 21.87) and TBI (mean ± SEM: 60.67 ± 21.87) groups (Fig. 4A). In the ipsilateral nbM, a nested t-test revealed no significant differences, F(1,4) = 2.60, p > 0.05, in the total number of ChAT+ cells between the Sham (mean ± SEM: 76.07 ± 15.21) and TBI (mean ± SEM: 51.53 ± 15.21) groups (Fig. 4B).
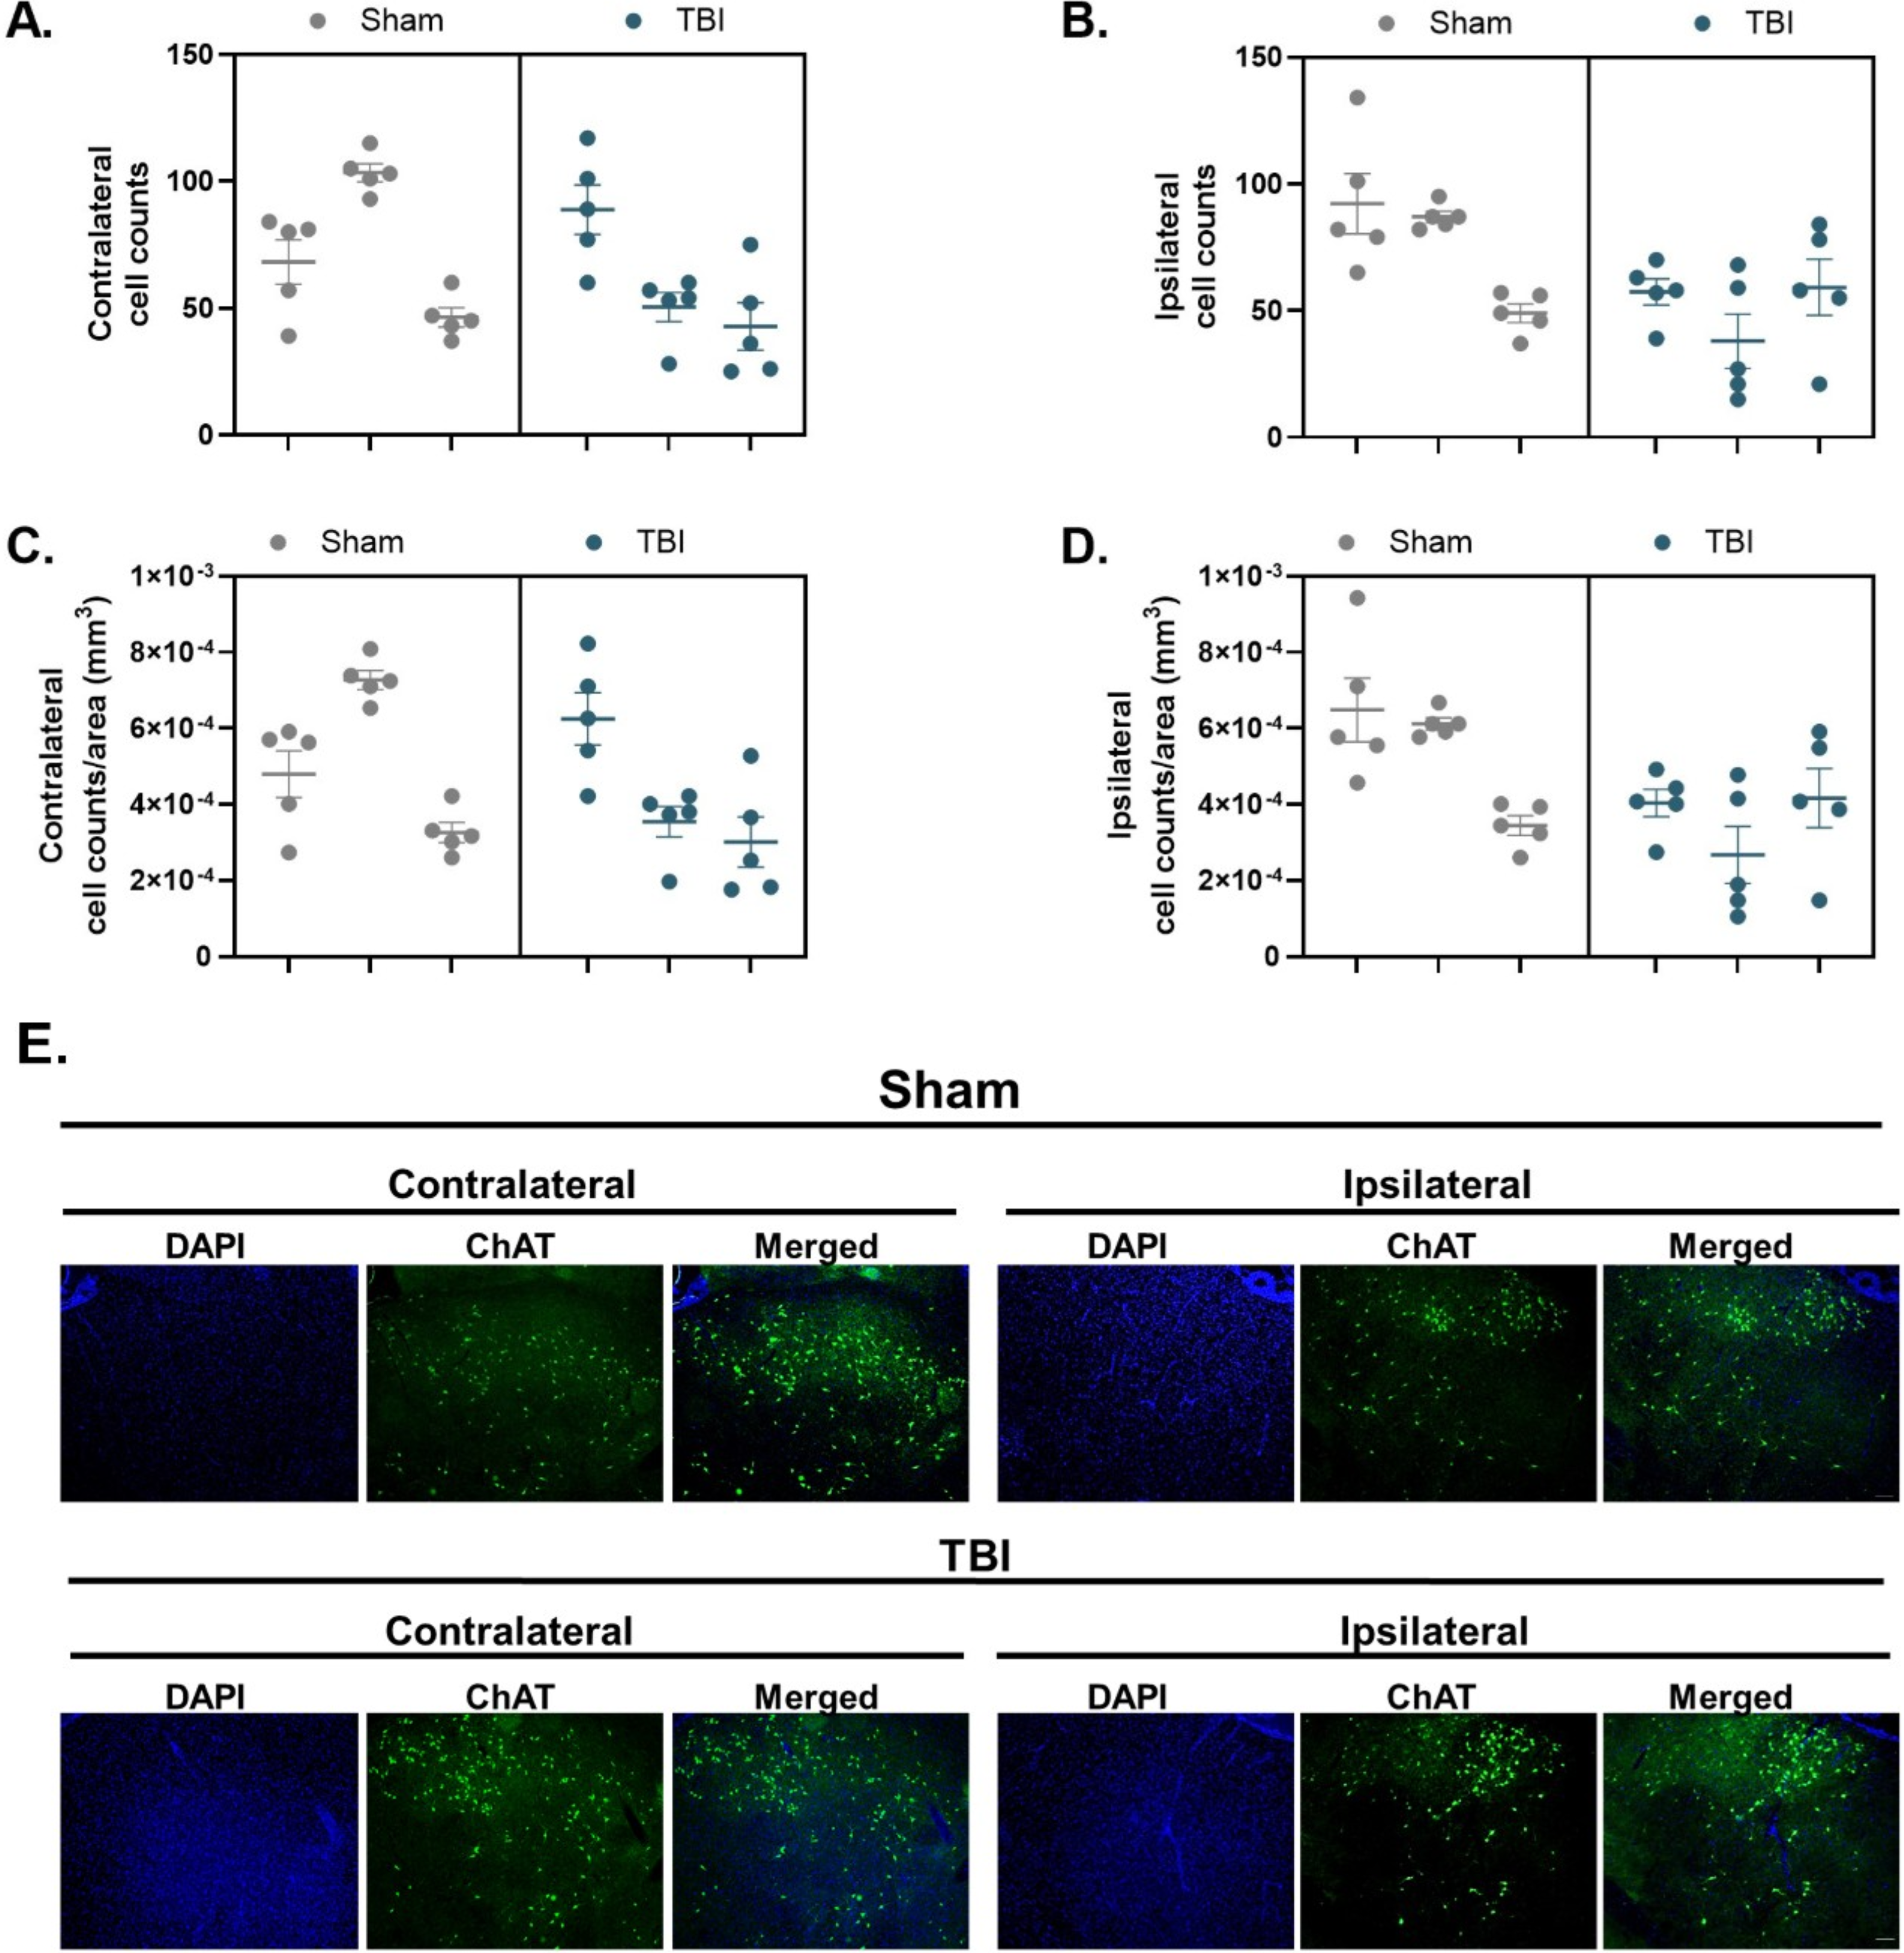
Cholinergic neuronal counts and density in the nucleus basalis of Meynert (nbM) are preserved following TBI.
A nested t-test revealed no significant differences in ChAT+ density (cells/μm2) in the contralateral, F(1,4) = 0.30, p > 0.05, or the ipsilateral, F(1,4) = 2.60, p > 0.05, nbM between the Sham (contralateral mean ± SEM: 5.11 × 10⁻⁴ ± 1.53 × 10⁻⁴, Fig. 4C; ipsilateral mean ± SEM: 5.35 × 10⁻⁴ ± 1.07 × 10⁻⁴, Fig. 4D) and TBI (contralateral mean ± SEM: 4.26 × 10⁻⁴ ± 1.53 × 10⁻⁴, Fig. 4C; ipsilateral mean ± SEM: 3.63 × 10⁻⁴ ± 1.07 × 10⁻⁴, Fig. 4D) groups. These data suggest that an equivalent number of cholinergic neurons were assessed for cholinergic morphology between the Sham and TBI groups and across the contralateral and ipsilateral nbM.
A nested t-test revealed no group differences in ChAT+ soma area in the contralateral nbM, F(1,4) = 1.65 × 10⁻⁵, p > 0.05 (Fig. 5A). However, a significant decrease was observed in the ipsilateral nbM, F(1,4) = 7.52, p = 0.05, with the TBI group exhibiting a lower mean ChAT+ soma area (2850 ± 348.1 μm2) compared to the Sham group (3027 ± 348.1 μm2) (Fig. 5B).
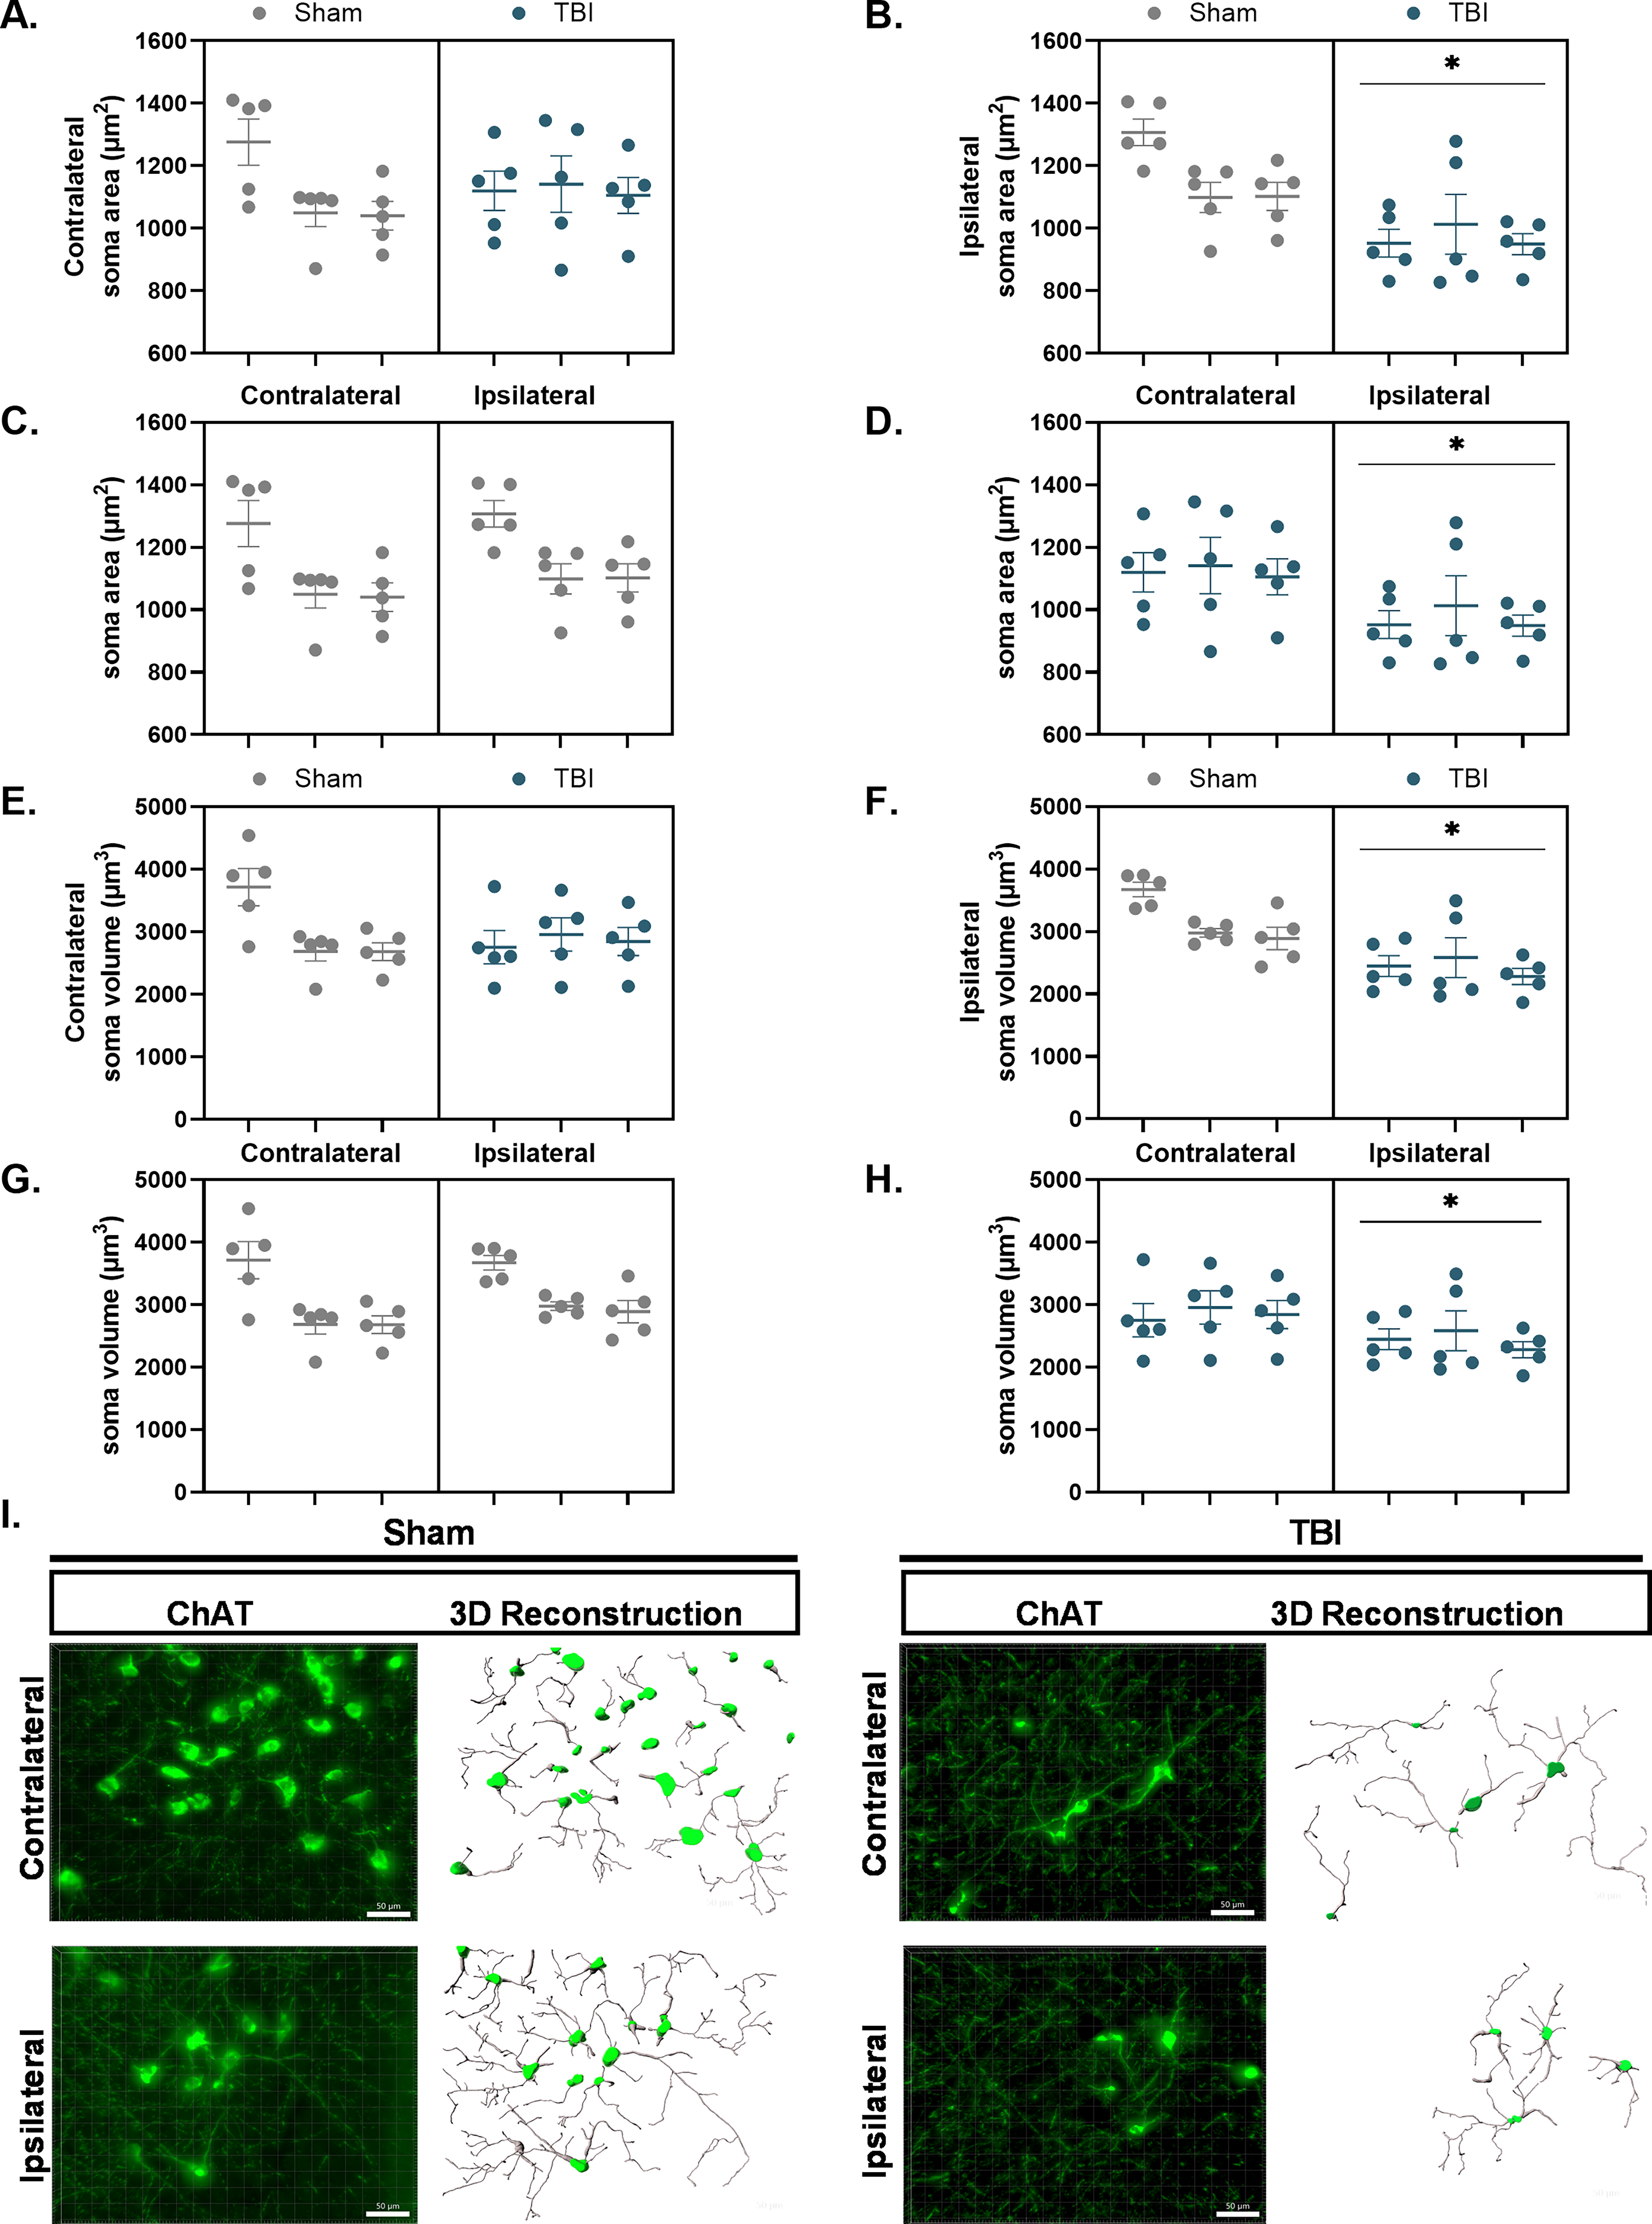
Cholinergic neuron soma area and volume are significantly reduced in the ipsilateral nbM following TBI. ChAT+ somas were reconstructed in 3D using IMARIS from z-stack fluorescence images acquired in the nbM. Each data point represents the mean of five ROIs within a single section, yielding five data points per hemisphere per rat. Nested statistical analysis was performed, with sections treated as technical replicates nested within biological replicates.
Individual nested t-tests conducted to examine hemispheric differences within the surgery groups revealed no significant differences in soma area between the contralateral and ipsilateral hemispheres of the Sham group, F(1,4) = 0.20, p > 0.05 (Fig. 5C). However, the TBI group exhibited a significant hemispheric effect, F(1,28) = 8.35, p < 0.01, with the ipsilateral nbM showing a significant reduction in soma area (971.6 ± 52.16 μm2) compared to the contralateral nbM (1122.0 ± 52.16 μm2) as demonstrated in Figure 5D.
A nested t-test revealed no group differences in ChAT+ soma volume (μm3) in the contralateral nbM, F(1,4) = 0.25, p > 0.05 (Fig. 5E). A significant difference was observed in the ipsilateral nbM, F(1,4) = 7.97, p < 0.05, with the TBI group exhibiting a significant reduction in ChAT+ soma volume (μm2) (2438 ± 262.8 μm3) compared to the Sham group (3180 ± 262.8 μm3) (Fig. 5F). Individual nested t-tests were conducted to examine hemispheric differences within surgery groups. No significant differences were observed in soma volume between the contralateral and ipsilateral hemispheres of the Sham group, F(1,4) = 0.13, p > 0.05 (Fig. 5G). However, a significant hemispheric effect was noted in the TBI group, F(1,28) = 5.01, p < 0.05, with the ipsilateral nbM (i.e., the side of injury) exhibiting a significant reduction in soma volume (2438 ± 184.1 μm3) compared to the contralateral nbM (2850 ± 184.1 μm3; Fig. 5H).
A nested t-test revealed no group differences in ChAT+ filament volume in the contralateral, F(1,4) = 0.10, p > 0.05 (Fig. 6A), or the ipsilateral nbM, F(1,28) = 1.09, p > 0.05 (Fig. 6B), between the Sham (contralateral: 997.3 ± 321.4 μm3; ipsilateral: 841.8 ± 196.3 μm3; Fig. 6A) and TBI (contralateral: 892.4 ± 321.4 μm3; ipsilateral: 1048.0 ± 196.3 μm3; Fig. 6B) groups. Individual nested t-tests were conducted to examine hemisphere differences within surgery groups and revealed no significant differences in filament volume between the contralateral and ipsilateral nbM of the Sham, F(1,4) = 0.12, p > 0.05, and TBI, F(1,28) = 0.25, p > 0.05, groups.
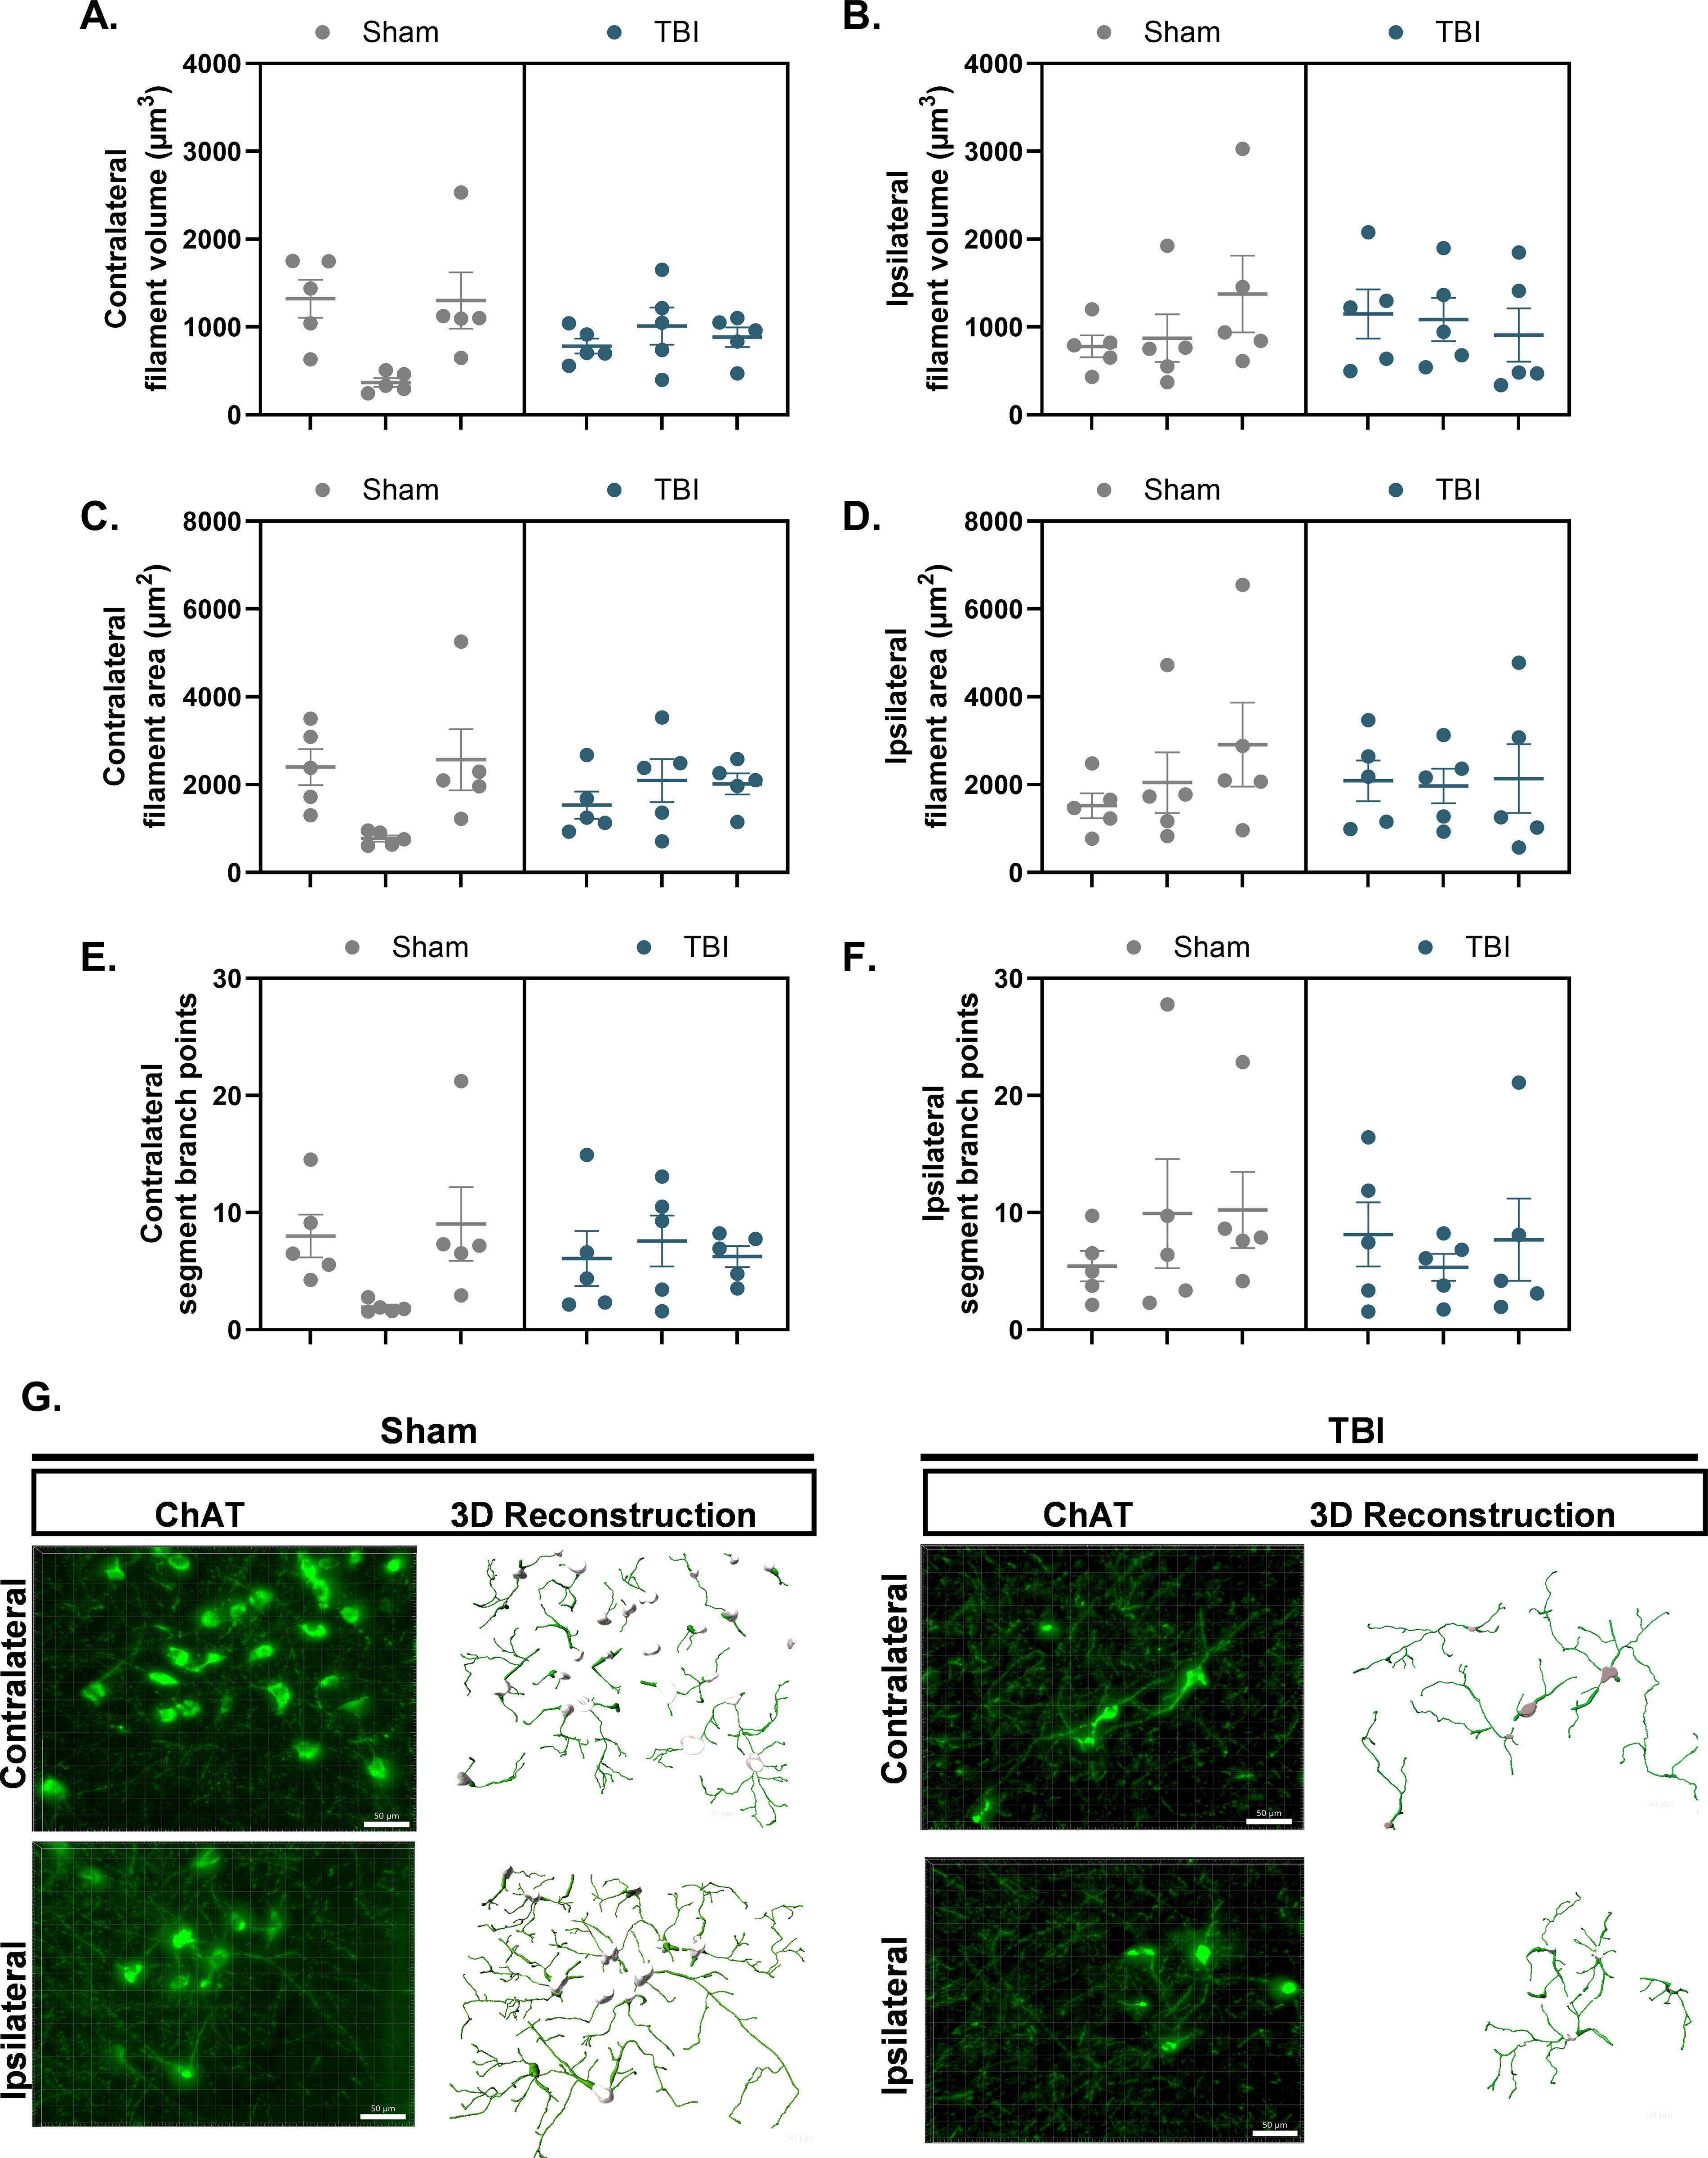
TBI does not alter cholinergic neurite morphology in the nbM. ChAT+ neurites were reconstructed in 3D using IMARIS from z-stack fluorescence images acquired in the nbM. Each data point represents the mean of five ROIs within a single section, yielding five data points per hemisphere per rat. Nested statistical analysis was performed, with sections treated as technical replicates nested within biological replicates.
A nested t-test revealed no group differences in ChAT+ filament area in the contralateral, F(1,4) = 0.0029, p > 0.05 (Fig. 6C), or the ipsilateral nbM, F(1,28) = 0.03, p > 0.05 (Fig. 6D), between the Sham (contralateral: 1914 ± 598.5 μm2; ipsilateral: 2161 ± 508.5 μm2) and TBI (contralateral: 1881 ± 598.5 μm2; ipsilateral: 2067 ± 508.5 μm2) groups. Individual nested t-tests were conducted to examine hemisphere differences within surgery groups and revealed no significant differences in filament area between the contralateral and ipsilateral nbM of the Sham, F(1,4) = 0.12, p > 0.05, and TBI, F(1,28) = 0.25, p > 0.05, groups.
A nested t-test revealed no significant differences in ChAT+ filament branching points between the Sham and TBI groups, both in the contralateral, F(1,4) = 0.01, p > 0.05 (Fig. 6E), and ipsilateral nbM, F(1,28) = 0.38, p > 0.05 (Fig. 6F). The mean ± SEM branching point for the Sham group (contralateral: 6.32 ± 2.26, ipsilateral: 8.53 ± 2.38) and the TBI group (contralateral: 6.32 ± 2.26, ipsilateral: 7.06 ± 2.38). Additional individual nested t-tests examining hemispheric differences within surgery groups also revealed no significant differences in filament area between the contralateral and ipsilateral nbM for both the Sham, F(1,4) = 0.66, p > 0.05, and TBI, F(1,28) = 0.05, p > 0.05, groups.
Discussion
This study is the first in the field of neurotrauma to conduct in vivo microdialysis in awake, freely moving rats during real-time performance of an attentional task, enabling quantitative, high-temporal-resolution assessment of ACh release. In contrast to previous studies that predominantly relied on post-mortem, semi-quantitative approaches such as immunohistochemistry, the approach of the present study allowed us to directly link behaviorally driven cholinergic dynamics to attentional performance, providing correlative evidence of neurochemical alterations associated with cognitive impairment after TBI. While in vivo microdialysis provides improved temporal resolution relative to post-mortem approaches, it is important to note that ACh efflux reflects neurotransmitter activity integrated over the 15-min sampling interval and cannot be attributed to discrete task events, which is a limitation well recognized in the cholinergic literature.22–24,26 Importantly, prior work in non-injured rats has shown that prefrontal ACh efflux scales with sustained attentional demands and top-down control during task engagement, rather than with moment-to-moment sensory, motor, or reward-related events.22,25 Accordingly, by aligning dialysate collection with baseline and task-engaged periods, the present study was designed to assess whether attentional task performance as a behavioral state recruits cortical cholinergic signaling. Within this framework, the absence of task-evoked ACh release in TBI rats in the current study, despite preserved baseline efflux, indicates an injury-induced failure to appropriately recruit attention-related cholinergic modulation during task performance. Future studies utilizing high-temporal-resolution approaches, such as enzyme-based electrodes, will be necessary to dissociate individual task components.
To capture real-time fluctuations in ACh relative to attentional demands, we utilized a binned sampling approach and applied causal mediation analyses to investigate whether TBI-induced changes in ACh efflux mediated sustained attention deficits, measured as percent accuracy. Including ACh as a mediator strengthens the interpretation that cholinergic disruption is not merely a consequence of TBI but may be a mechanistic contributor to attentional decline. Our findings underscore the central role of ACh efflux in mediating TBI-related impairments in sustained attention. Early in the task, reductions in ACh release were associated with decreased attentional accuracy. This relationship became more pronounced as the task progressed and attentional demands increased. Moreover, these deficits in sustained attention and distractibility persisted through the 5-day testing period. Additionally, TBI exerted a direct effect on attentional accuracy, independent of ACh, suggesting a complex interaction between injury effects and neurotransmitter modulation.
In previous studies, Dixon and colleagues reported a chronic reduction in scopolamine evoked ACh release in the neocortex and hippocampus after TBI that correlated with spatial learning and memory deficits. However, these neurochemical and behavioral outcomes were not assessed concurrently.27–29 Our study addressed this gap by measuring task-evoked ACh efflux in the mPFC during performance of the 3-CSRT, allowing for a real time link between cholinergic signaling and behavior. These results extend earlier findings showing that, in non-injured rats, ACh release in the mPFC increases during performance of an attentional task, such as the five-choice serial reaction time test (5-CSRTT).30–34
Albeit distinct from TBI models, studies using selective cholinergic deafferentation of the mPFC with infusion of the immunotoxin 192 IgG-saporin into the nbM similarly report deficits in attentional performance associated with cholinergic cell loss in the nbM and reductions in task-evoked ACh in the mPFC.32,35–37 Collectively, these studies highlight the critical role of an intact cholinergic network, extending from the nbM to the mPFC in supporting attention.
Given the functional evidence of reduced cholinergic signaling, we next examined whether these neurochemical deficits were associated with structural changes in the nbM. Cholinergic neurons exhibit diverse ultrastructural features, including soma morphology, dendritic length and arborization, and synaptic connections.38–40 TBI also induces axonal degeneration of afferent basal forebrain neurons, characterized by varicosities, tortuosity, and retraction bulbs extending toward the injured cortex. 41 In our study, morphometric analysis of cholinergic neurons in the ipsilateral nbM revealed that TBI lead to a neurodegenerative-like phenotype evidenced by reduced soma area and volume, albeit cholinergic neurite volume, area, and branching points remained unchanged therefore partially supporting the stated hypothesis. These findings suggest that the injury-induced damage is more pronounced in the hemisphere directly impacted. Together, examination of soma area and volume suggests CCI-induced extensive atrophy of cholinergic neurons in the ipsilateral nbM. Contrary to our hypothesis, we did not observe alterations in the neurite area, volume, or branching points of ChAT+ neurons. The lack of injury-induced changes in ChAT+ neurites within the basal forebrain may be due to spatiotemporal factors and compensatory mechanisms that preserve cholinergic projections.
Although our findings did not indicate alterations in cholinergic neurite morphology within the nbM, this does not rule out the possibility that ascending cholinergic projections to distal target regions may be compromised after injury. Clinical imaging studies have shown significant volume reductions in frontal cortical structures, which are extensively innervated by cholinergic neurons, following injury.6,42 Therefore, injury-induced damage, as evidenced by atrophy-like changes in cholinergic soma, may also arise from several secondary pathogenic mechanisms, including biomechanical-induced excitotoxicity and upregulation of pro-neurotrophic factor receptor activation, which triggers apoptotic pathways implicated in increased cholinergic neuronal degeneration. 39
While operant attention tasks inherently engage attentional, motivational, and motor components, in vivo microdialysis provides a temporally integrated measure of ACh efflux and therefore cannot resolve moment-to-moment cholinergic dynamics. Extensive prior work demonstrates that prefrontal ACh efflux selectively tracks sustained attentional demands rather than motor activity or reward processing.22–25,30–35 Future studies combining higher temporal resolution techniques such as ACh sensitive amperometry or enzyme-based biosensors with attentional task performance will be required to capture these rapid cholinergic fluctuations.23,24 In addition, experimental manipulation of attentional load, such as varying cue duration or introducing task-irrelevant distractors, approaches shown to systematically scale cholinergic recruitment in the 5-CSRTT, would further strengthen mechanistic inference regarding attention-specific ACh signaling.
Although additional microdialysis sessions at later testing time points could have provided adjunct insight into recovery-related changes, repeated probe insertion is highly invasive, promotes inflammation, and may disrupt cortical tissue and local neurochemistry, particularly in the injured brain. Sampling was therefore restricted to a single session aligned with peak attentional impairment. Finally, the study employed a unilateral right-hemisphere injury and male subjects only. Given known hemispheric asymmetries in cholinergic control of attention 15 and established sex differences in cholinergic signaling, attention, and post injury deficits in spatial learning, memory, and sustained attention13,16,43 future studies should examine contralateral or bilateral injuries and include female subjects.
Conclusion
In summary, TBI disrupts cholinergic signaling dynamics and neuronal integrity within the basal forebrain-prefrontal network, leading to deficits in attentional performance. By integrating real-time neurochemical monitoring with structural analyses, this study provides direct mechanistic evidence linking cholinergic pathway disruption, including the nbM and the mPFC, to cognitive impairment after cortical impact injury. These findings highlight the cholinergic system as a promising target for interventions aimed at restoring attention and broader cognitive function in TBI survivors.
Transparency, Rigor, and Reproducibility Summary
The study was not pre-registered in a public domain, but was pre-specified based on prior work from our group employing similar experimental designs and statistical plans. Power analyses indicated that the sample sizes (n = 8-10/group) will provide >80% power to detect significant group differences after correction for multiple comparisons. Adult male Sprague-Dawley rats were randomly assigned to receive either a CCI or sham injury following attainment of criterion performance on the 3-CSRT task. All investigators conducting behavioral testing, histological analyses, and statistical evaluations were blinded to surgical group assignments throughout data collection and analysis.
All experimental procedures were conducted between 07:00 and 19:00 under standardized lighting, temperature, and food-restriction conditions to maintain consistency with prior studies. Behavioral testing was automated using Graphic State Notation 4 software, and all microdialysis, HPLC-ECD, and histological equipment were commercially available and used according to the manufacturer’s guidelines. The data were analyzed using GraphPad Prism 10.2.3 and R (for mediation analyses). Statistical approaches included two-way rmANOVAs, nested t-tests, Welch’s t-tests, Wilcoxon tests, and robust regression with nonparametric bootstrap confidence intervals for mediation analysis. The ROUT test (Q = 0.1%) was used to identify statistical outliers. All results are reported as mean ± SEM, and statistical significance was set at p ≤0.05.
The data are expressed in accordance with FAIR principles and will be deposited in a publicly accessible repository (odc-sci.org) following publication. All behavioral and neurochemical data, as well as histological image files, will be made available upon reasonable request. All procedures were performed in accordance with the University of Pittsburgh IACUC and comply with National Institutes of Health guidelines for the care and use of laboratory animals.
Compliance with Ethical Standards
All procedures were performed in accordance with the corresponding author’s university IACUC.
Author’s Contributions
E.H.M., A.E.K., and C.O.B. developed the study. E.H.M., A.E.K., and C.O.B. wrote and edited the abstract. E.H.M., H.E.C., E.M.A., and V.D.D. performed the behavioral assessments. E.H.M., A.E.K., C.O.B., and J.P.C. performed surgical procedures. E.H.M. performed guide cannulation and microdialysis collection. E.H.M., H.E.C., and E.M.A. performed brain tissue histological assessments. E.H.M. under the guidance of S.A.H.M. and D.S. performed the IMARIS processing. E.H.M. performed dialysate chromatography assessments. E.H.M., H.J.Y., A.E.K., and C.O.B. performed statistical analyses. E.H.M., A.E.K., and C.O.B. wrote the article. All authors reviewed and approved the article.
Footnotes
Acknowledgments
Figures 1A and B and ![]() schematics were created using BioRender.com (accessed on May 13, 2025). The authors appreciate the consultations regarding HPLC provided by Drs. Ed Dixon, Shaun Carlson, Jonathan Birabaharan, and Ian Acworth. They also appreciate the assistance with 3D scanning provided by Daniel Kaple at the University of Pittsburgh Hillman Library Open Lab.
schematics were created using BioRender.com (accessed on May 13, 2025). The authors appreciate the consultations regarding HPLC provided by Drs. Ed Dixon, Shaun Carlson, Jonathan Birabaharan, and Ian Acworth. They also appreciate the assistance with 3D scanning provided by Daniel Kaple at the University of Pittsburgh Hillman Library Open Lab.
Author Disclosure Statement
No competing financial interests exist.
Funding Information
This work was supported, in part, by the National Institute of Health grants
Supplemental Material
Supplemental Material
References
Supplementary Material
Please find the following supplemental material available below.
For Open Access articles published under a Creative Commons License, all supplemental material carries the same license as the article it is associated with.
For non-Open Access articles published, all supplemental material carries a non-exclusive license, and permission requests for re-use of supplemental material or any part of supplemental material shall be sent directly to the copyright owner as specified in the copyright notice associated with the article.