
Abstract
It is becoming increasingly recognized that high-level spinal cord injury (SCI) is associated with altered heart structure and function, as well as a significantly elevated risk for heart disease. Despite this knowledge, we know remarkably little about the temporal molecular changes that occur in the heart following SCI and how these relate to functional decline. In the present study, we addressed this shortcoming by combining bulk RNA sequencing (RNA-seq) of left ventricle (LV) tissue with matching in vivo cardiac function assessments (i.e., pressure-volume loops obtained via LV catheterization) from the same animals. We studied rats at either the acute (1 and 3d post-SCI) or chronic (12wk post-SCI) stage of SCI to establish temporal patterns and compared findings to sham-injured rats. We found that SCI induces marked, time-dependent changes in cardiac gene expression and function. Acute (1–3d) and chronic (12w) SCI display distinct, often opposing transcriptomic signatures, with thousands of genes differentially expressed versus SHAM. Acute SCI is characterized by suppressed immune, inflammatory, cell cycle, and stress-response pathways with altered metabolism. Chronic SCI shows upregulated immune signaling, impaired oxidative phosphorylation, extracellular matrix remodeling, and stress responses. Functionally, cardiac systolic dysfunction occurs early post-SCI and persists to the chronic phase. Reduced systolic function is strongly correlated with changes in immune, hypoxia, and cholesterol-related genes at the acute timepoints and with immune and hormone-signaling pathways at the chronic timepoint. Collectively, our data provide novel insight into the cardiac transcriptome post-SCI and identify the molecular pathways that most strongly correlate with functional decline.
Introduction
Spinal cord injury (SCI) interrupts supraspinal sympathetic connections to most, if not all, biological systems, which causes extensive autonomic dysfunction. To date, a reduction in function of the bladder/urinary tract,1,2 gastrointestinal system, 3 liver,4,5 kidneys,6,7 pulmonary system,8,9 spleen 10 and adrenal gland,11,12 have been documented, along with the occurrence of adverse molecular events within these organ tissues—such as immune/inflammatory responses,1,4,5,7,10,13–16 extracellular matrix (ECM) alterations (e.g., increased collagen deposition5,7,17), fat accumulation,5,18 and/or organ and cellular atrophy. 10 With regard to the heart, the effects of SCI on cardiac physiology, function, and gross structure are increasingly well defined. Clinically, high-level SCI (above T6) leads to reduced cardiac volumes, output, and mass, 19 and large-scale population studies have revealed a significantly elevated risk for heart disease in individuals with SCI.20,21 Pre-clinical modeling has begun to provide mechanistic insight as to the underlying cause. Studies from our group and others have shown that high-level SCI is associated with a quasi-immediate and sustained reduction in cardiac contractility post-SCI22,23 that is accompanied by cardiomyocyte atrophy23,24 and an upregulation of protein degradation pathways,23,24 all of which appear to be the result of disrupted bulbospinal sympathetic pathways. 23 Despite advancements in characterizing the pathophysiology of SCI and its consequences on the heart at a physiological level, fundamental knowledge of the molecular events occurring in the heart post-SCI remains quasi-uninvestigated, and no study to our knowledge has performed RNA sequencing (RNA-seq) on the heart tissue of animals exposed to high-level SCI.
In the present study, we performed bulk RNA-seq of left ventricle (LV) tissue to probe the cardiac molecular changes associated with SCI and correlated these changes against matching in vivo cardiac functional data (i.e., pressure-volume [PV] loops obtained via LV catheterization) from the same animals. We also estimated a cell atlas of the LV post-SCI and performed a correlation analysis of the RNA and PV functional datasets to help guide future efforts aimed at targeting the molecular pathways in the heart that are altered by SCI. Our novel findings demonstrate that SCI alters the regulation of numerous molecular gene sets in the heart (e.g., immune/inflammation-related, cell cycle, metabolism, cell differentiation/transition, and changing ECM gene sets). Our estimated cell atlas suggests that with time post-SCI, there is an alteration in cell type composition in the LV. Our correlation analysis of the matching transcriptomic and functional data indicates that reduced cardiac pressure indices (e.g., developed pressure [Pdev] and maximum pressure [Pmax]) are strongly correlated with genes associated with immune/inflammatory responses.
Materials and Methods
Ethics
Ethical approval for this pre-clinical study was obtained from the Animal Care Committee of the University of British Columbia (A18-0344). All protocols were conducted in strict accordance with the Canadian Council on Animal Care.
Animals and termination timepoints
Male Wistar rats underwent either a SHAM surgery or a T3 complete transection SCI (N = 24, age = 10–11 weeks, mass = 300–400 g, source = Envigo, USA). SHAM rats were terminated 7 days post-SHAM surgery (n = 6). We terminated SCI rats at different timepoints post-SCI: 1 day (1d) as an acute timepoint, 12 weeks (12w) as a chronic timepoint, and 3 days (3d) as a timepoint at which post-SCI cardiac volumetric indices start to reduce significantly (n = 6 per SCI timepoint). 23 For all rats, a termination day consisted of in vivo LV catheterization recordings, euthanasia, and collection of cardiac tissue post-mortem. Our justification for utilizing tissue from male rats is that although SCI is devastating to all, ∼70–80% of individuals who have a traumatic SCI are male. 25
High-thoracic complete transection surgery, SHAM surgery, and animal care
Rats were anesthetized using inhaled isoflurane (4–5% with 2 L/min of oxygen in an induction chamber, followed by 1–2% via a nose cone for maintenance), prepared for surgery, and given a subcutaneous injection of buprenorphine (Vetergesic, 0.02 mg/kg; Ceva Animal Health Inc., Canada) for analgesia. A comprehensive description of the T3 complete transection SCI procedure has been detailed in a previous publication by our group. 23 In brief, a dorsal durotomy was carried out through a midline incision between the C8 and T2 vertebrae. The dura mater was then incised at the T2–T3 spinal level. Complete transection of the cord at the T3 spinal segment was performed using fine microscissors, and ∼0.5 cm of spinal tissue was removed with vacuum suction. The success of the transection was verified under a dissecting microscope, ensuring no remaining tissue connected the rostral and caudal spinal cord stumps. Hemostatic Gelfoam (Pharmacia & Upjohn Company, Pfizer Inc., USA) was inserted into the resulting gap. Control (SHAM) animals underwent the same durotomy procedure but did not receive an SCI. Detailed steps for T3 complete transection SCI surgeries and SHAM surgeries can be found elsewhere. Pre- and post-surgery animal care for animals with high-thoracic complete SCI was performed following standard, previously published studies, 26 from our group.
LV catheterization
At study termination, all rats underwent in vivo LV catheterization using a closed-chest approach with a pressure-volume (PV) admittance catheter (1.9F rat PV catheter with an ADV500 PV system; Transonic®, USA) under urethane anesthesia (1200–1500 mg/kg, intraperitoneal injection; Sigma-Aldrich Corporation, USA). All steps are described in Fossey and Balthazaar et al., 23 which followed the steps from Pacher et al. 27 PV data were obtained and analyzed using LabChart and its PVAN extension (version 8.1, PowerLab 16/35; ADInstruments, USA). The PV data of these rats have already been published in Fossey and Balthazaar et al. 23 : the SHAM and acute SCI rats (1d and 3d) are from Part I of the article, which aimed to investigate temporal effects of SCI on the heart, whereas the chronic SCI rats (12w) are from Part II, more specifically the level of injury study, which aimed to determine whether the loss of bulbospinal sympathetic control caused the decline in cardiac function post-SCI.
Euthanasia and tissue collection
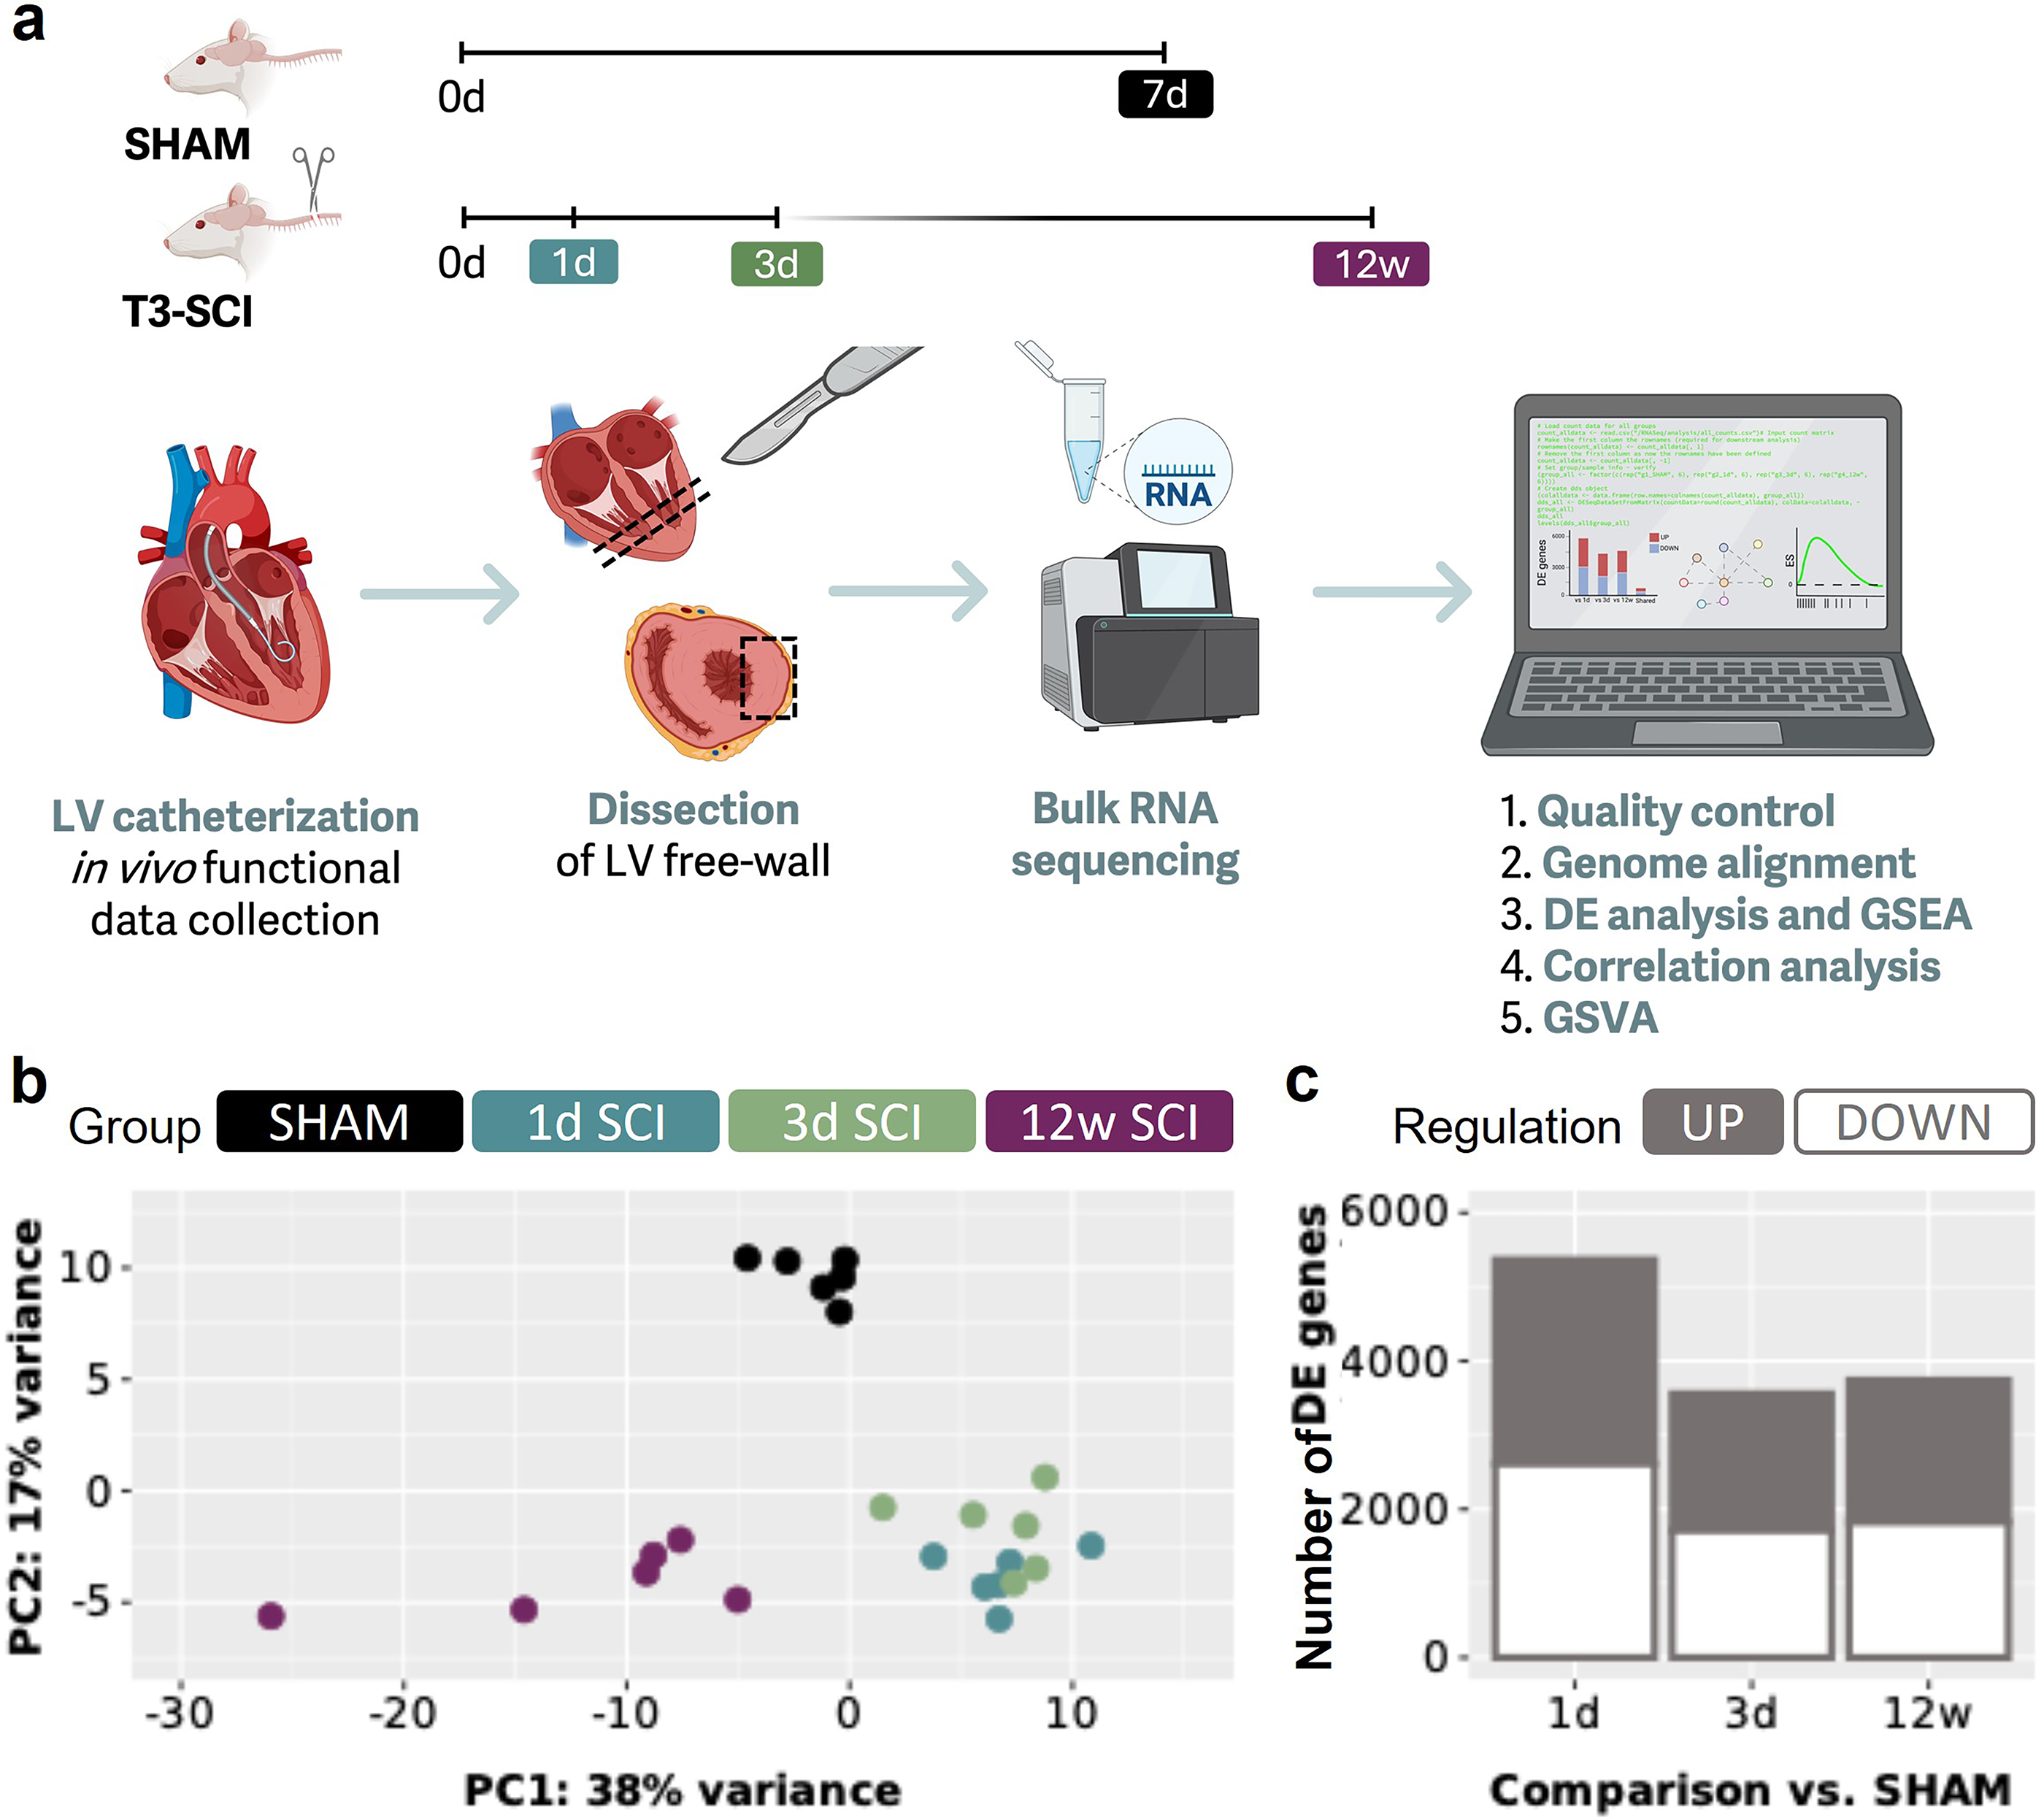
Euthanasia followed the in vivo functional data collection during which the animal was already under urethane anesthesia. Euthanasia was performed with an overdose of urethane followed by a bilateral pneumothorax and exsanguination via transcardial puncture (through the apex), for euthanasia confirmation and for access to cardiac tissue for collection. A small piece of apex was removed to better view the LV and right ventricle. Next, a cross-sectional disc of the heart was obtained, just below the mid-ventricular level (Fig. 1a). From this mid-LV disc, a piece of the free wall was sectioned, flash frozen, and stored in a −80°C freezer.
SCI alters cardiac gene expression in a temporally distinct pattern.
Bulk RNA-seq
Frozen heart tissues were homogenized for 20 sec at 5000 revolutions per minute on the Precellys Evolution homogenizer (Bertin Technologies SAS, France) using the 2 mL soft tissue homogenizing ceramic beads CK14 (Bertin Technologies SAS, Cat No. P000912-LYSK0-A). Total RNA was isolated from the extracts using the Maxwell RSC simplyRNA Tissue Kit (Promega Cat. No. AS1340) on the Maxwell RSC instrument (Promega) according to the manufacturer’s instructions. Extracted RNA was treated with DNase I, and its quality was analyzed using the High Sensitivity RNA Assay (Agilent Technologies, Cat. Nos. 5067-5579 and 5067-5580) on the TapeStation 4200 (Agilent Technologies, Cat. No. G2991BA). RNA concentrations are measured using the Qubit RNA HS assay (ThermoFisher; Cat. No. Q32852) on the Qubit 4 Fluorometer (ThermoFisher). RNA quality metrics for RNA include the RNA integrity number (RIN) and DV200. Samples meeting pre-specified quality thresholds were advanced to library preparation. Hundred nanograms of total RNA was used as input for ribosomal RNA depletion using the DNBSEQ rRNA Depletion kit (Complete Genomics, Cat. No. 940-001811-00). Strand-specific libraries were prepared using the DNBSEQ Fast RNA Library Prep kit (Complete Genomics, Cat. No. 940-000963-00). Library quality and size were assessed with the TapeStation 4200 (Agilent Technologies; D1000 Assay Cat. No. 5067-5582), and libraries were quantified using the Qubit double-stranded DNA High Sensitivity Assay (ThermoFisher; Cat. No. Q32854). Libraries were sequenced on a DNBSEQ-G400RS sequencer using paired-end 100 bp reads (PE100).
Quality control and genome alignment
FASTQ files obtained from the sequencing center underwent quality control via FastQC (version 0.12.1 28 ). No FASTQ files were removed from downstream alignment and analysis. Using high-performance computing (Compute Canada, Cedar), the paired-end reads were aligned with the Rattus norvegicus genome (index using mRatBN7.2 files; Ensembl 29 ) using STAR (version 2.7.11a 30 ), and a count matrix was generated using featureCounts (version 2.0.6 31 ). All abovementioned computing was enabled in part by support provided by the University of British Columbia, Simon Fraser University, and the Digital Research Alliance of Canada (alliancecan.ca).
Differential expression analysis and gene set enrichment analysis
The count matrix generated by featureCounts is used in R (version 4.4.2, 2024-10-31) 32 and RStudio (version 2024.09.1 + 394 33 ). As this count matrix included multiple RNA types due to whole transcriptome sequencing, we filtered for protein-coding RNA only for the purposes and data analyses of this article. For downstream differential expression (DE) analysis (DESeq2 package 34 ), the DESeq2 output is then appended with human symbols (using BioMart from Ensembl 29 ) for downstream gene set enrichment analysis (GSEA) analysis, as many libraries are human focused. GSEA is then performed with the DESeq2 stat statistic (fgsea package 35 ) with different publicly available gene set libraries (e.g., the Molecular Signatures Database [MSigDB] hallmark gene set collection 2020,36–38 gene ontology biological process 2023 [GO BP], GO cellular component 2023 [GO CC], and GO molecular function 2023 [GO MF]39,40). For both DE analysis and GSEA, we used a padj cutoff of ≤0.05 (also known as false discovery rate). Figure 2 includes categorization of MSigDB aligned with Liberzon et al. 36
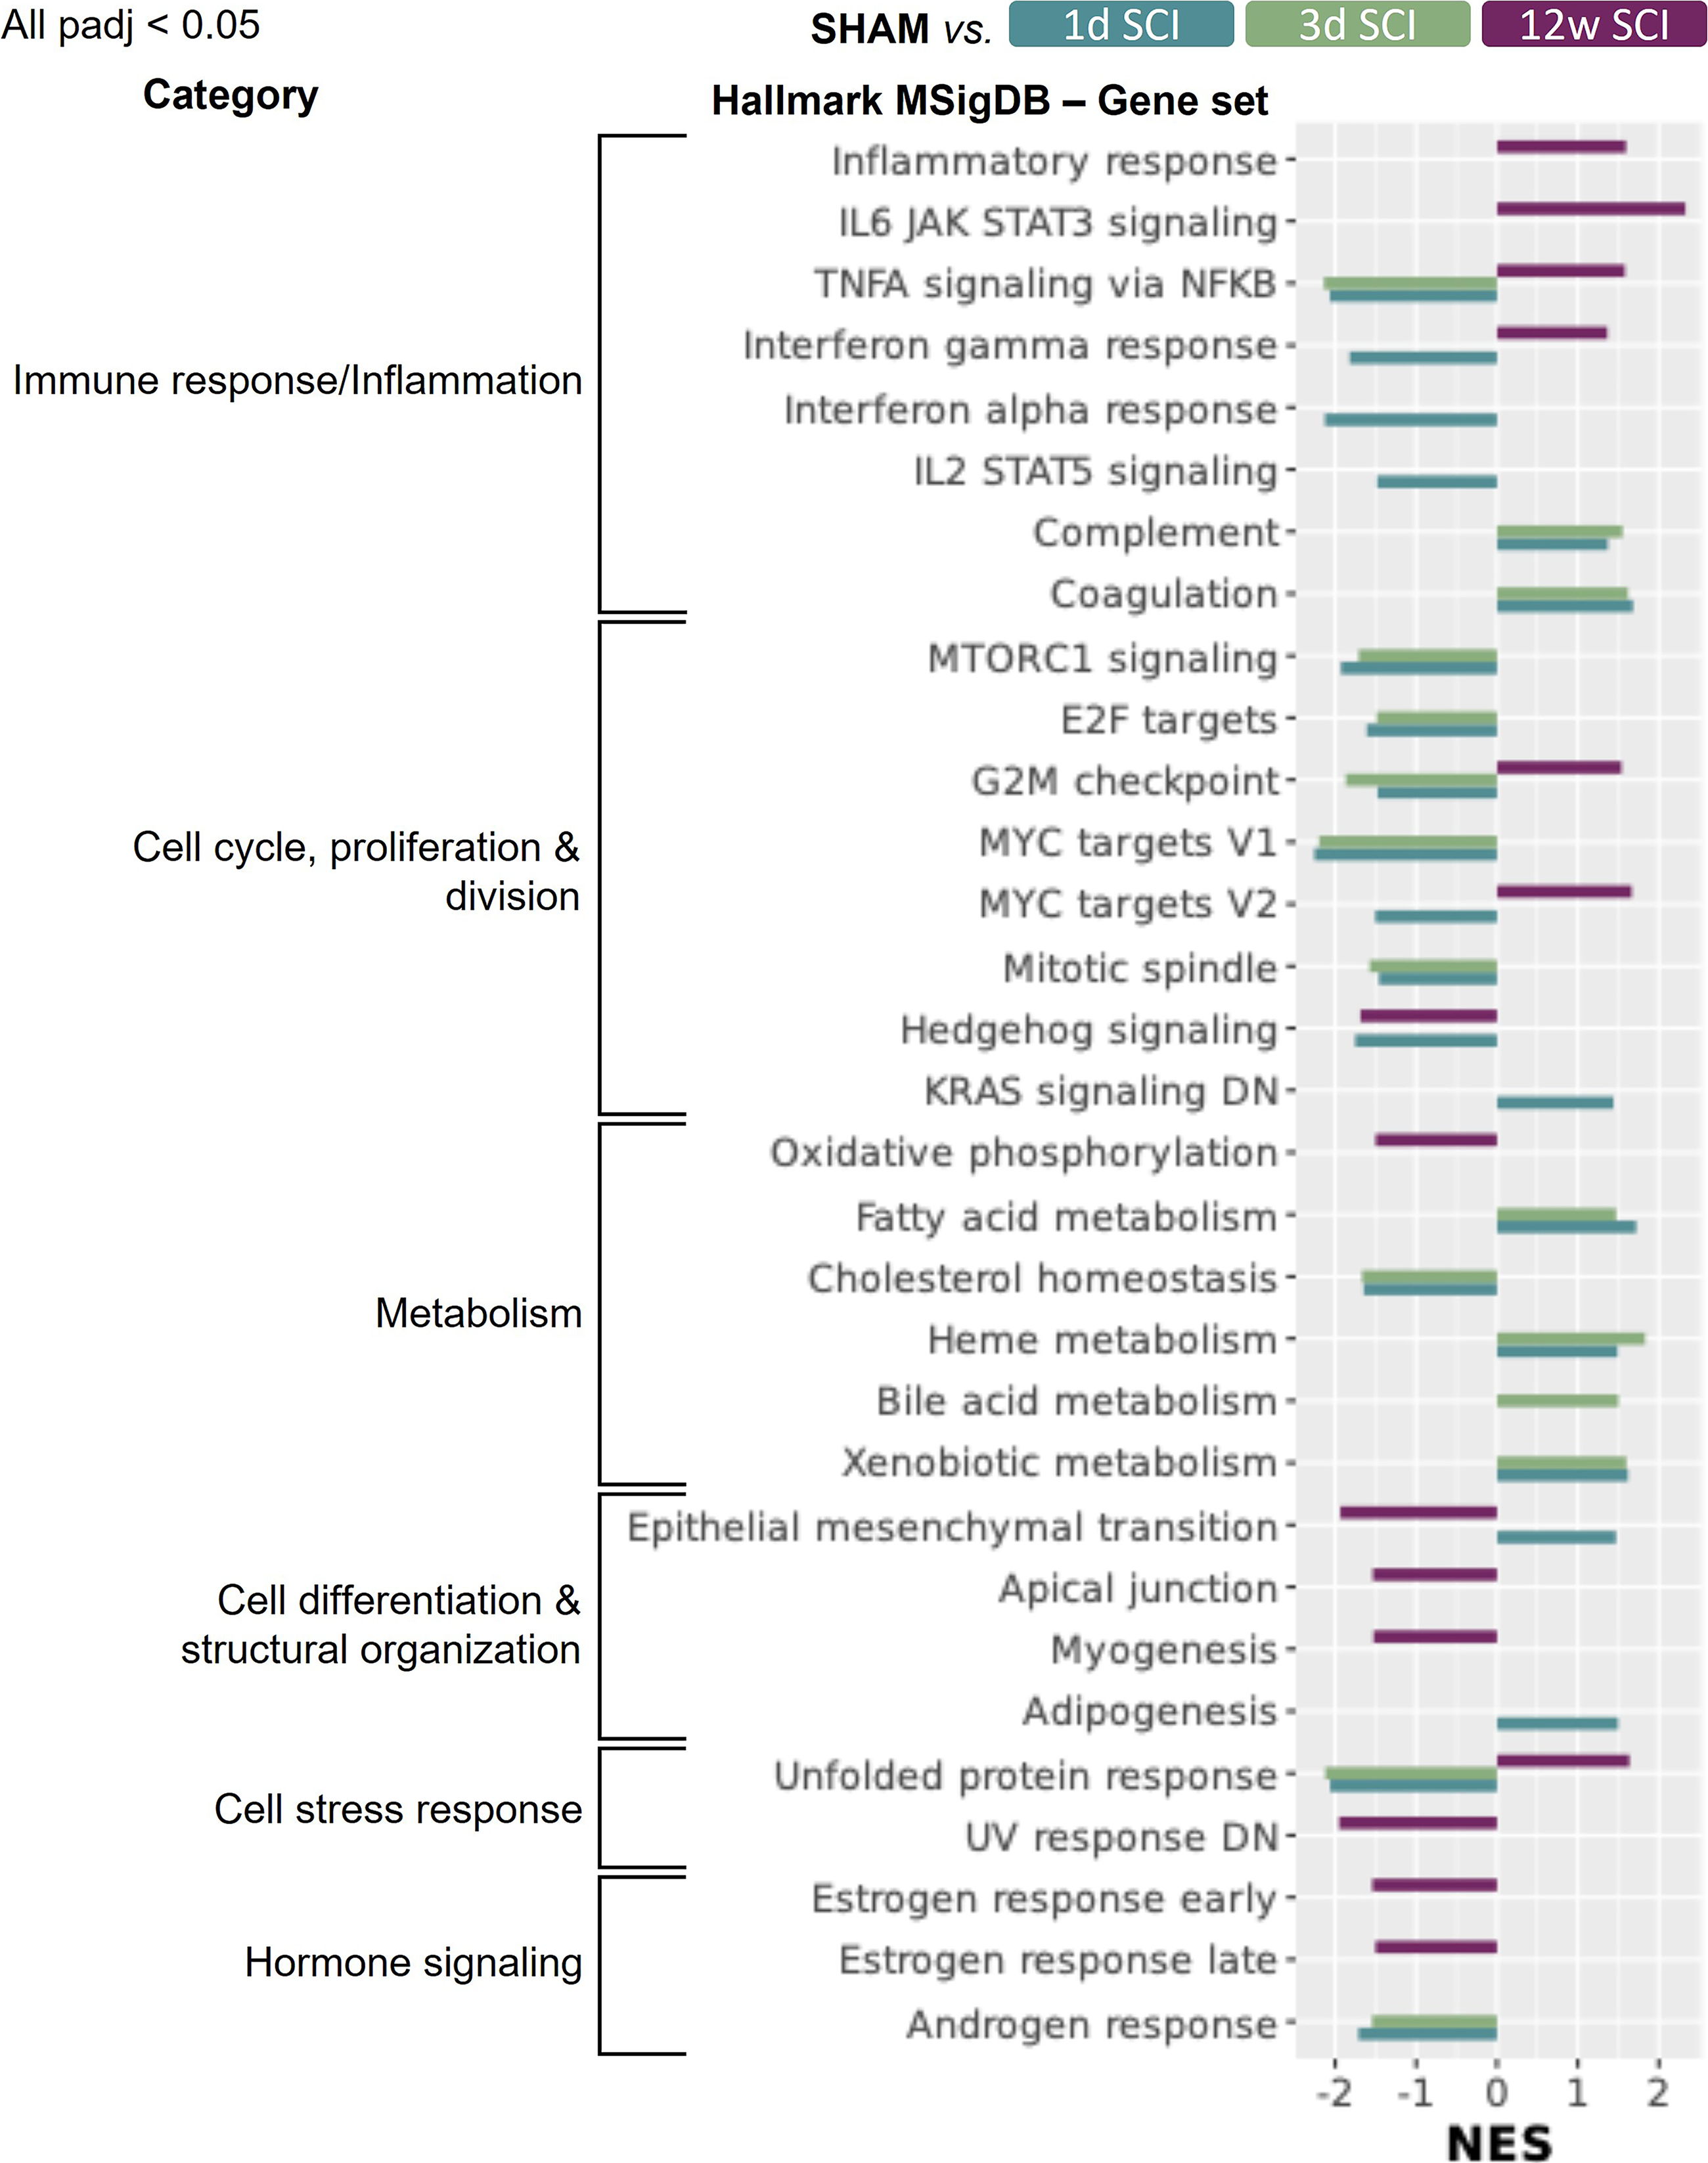
Gene set enrichment analysis (GSEA) using the Hallmark Molecular Signature Database (MSigDB) reveals that several molecular pathways have altered regulation in the heart post-SCI. All shown normalized enrichment scores (NES) have an adjusted p value <0.05 (padj; using the fgsea package in R and stat as the statistic). A negative NES represents downregulation of a gene set, and a positive NES represents upregulation of a gene set. There seems to be a consensus that acute versus chronic SCI has paradoxical effects on cardiac gene expression. If the NES is not shown, for a group or gene set, it has a padj >0.05. The enrichment plots and the heatmaps for the leading edge genes pertaining to the top five gene sets per SCI timepoint are visualized in Supplementary Figures S2, S3, and S4. Please note that many of these gene sets have genes in common; gene overlap is seen in the upset plots in Supplementary Figure S5. More GSEA results using other libraries (i.e., gene ontology databases) can be found in Supplementary Figures S6, S7, and S8. Gene set categories were inspired by Liberzon et al. 36 Two of these gene sets (e.g., KRAS signaling and UV response) include “DN” in their title; therefore, it is crucial to note the sign of the NES when interpreting the results. E2F, early region 2 binding factor; IL, interleukin; JAK, Janus kinase; KRAS, Kirsten rat sarcoma virus; MTORC1, mammalian target of rapamycin complex 1; MYC, myelocytomatosis; NF-κB, nuclear factor kappa B; SCI, spinal cord injury; STAT, signal transducer and activator of transcription; UV, ultraviolet; V1, version 1; TNF-α, tumor necrosis factor alpha.
Cell atlas and cell type differences
Using our bulk RNA-seq data, we sought to estimate a cell atlas of our LV tissue, that is, to identify and quantify the cell types present in SHAM versus SCI tissue. To achieve this, we utilized male Wistar rat publicly available single-nucleus RNA sequencing (snRNA-seq) cardiac data obtained via the Broad Institute’s Single Cell Portal (downloaded November 2024). 41 First, we used anndata, 42 Seurat, 43 and Matrix 44 packages in R to create an snRNA-seq matrix selecting cells solely from the LV free wall. We combined the metadata “cell_type_ontology_label” and “leiden1p2_labels” cell labels into a new variable named “CellType.” We first removed all cell types that did not have at least 40 replicates to favor a robust analysis. Yet, this caused four cell types (“White_Adipocyte,” “Brown_Adipocyte,” “Atrial_Cardiomyocyte,” and “CD8_positive_alpha_beta_T_Cell”) to be excluded due to having only two to six replicate cells compared to other cell types, which had sample sizes between ∼44 and 13,789. We then removed all cell types that had mismatched cell labels (e.g., “B_cell_Macrophages,” “dendritic_cell_T_Cells”). Next, we filtered the matrix genes to only contain genes that were present in our bulk mixture and that were top significant marker genes (using FindAllMarkers() with only.pos = TRUE, min.pct = 0.25, logfc.threshold = 0.25; all padj = 0.05). When generating top marker genes per cell type, the minimum value was 41. Therefore, to achieve a balanced signature matrix, we only selected the top 41 markers per cell type, ranked by fold change. The two vascular smooth muscle cell types were combined into one “Vascular_Smooth_Muscle_Cell” as insufficient marker genes were found for type 2. Our final snRNA-seq reference matrix contained 48,930 cells (columns) from 19 cell types and 613 genes (rows). Using this reference matrix, we created a custom signature matrix with CIBERSORTx,45,46 that is, we estimated the gene expression signatures per cell type (settings: fraction = 0.5, minimum number of replicates = 44, sampling = 0.5). We then proceeded to deconvolute our bulk RNA-seq data (only protein-coding genes) with the custom signature matrix with CIBERSORTx in absolute mode. The resulting scores are estimates for the absolute proportions of each cell type per sample, later averaged (Fig. 3), and summed per group (absolute score Fig. 3b). All files inputted into CIBERSORTx contained raw counts (for protein-coding genes) as the program requires data to be in non-log space and automatically normalizes data on input. With the deconvoluted data, we subsequently performed statistics in R to determine group differences (described in more detail below).
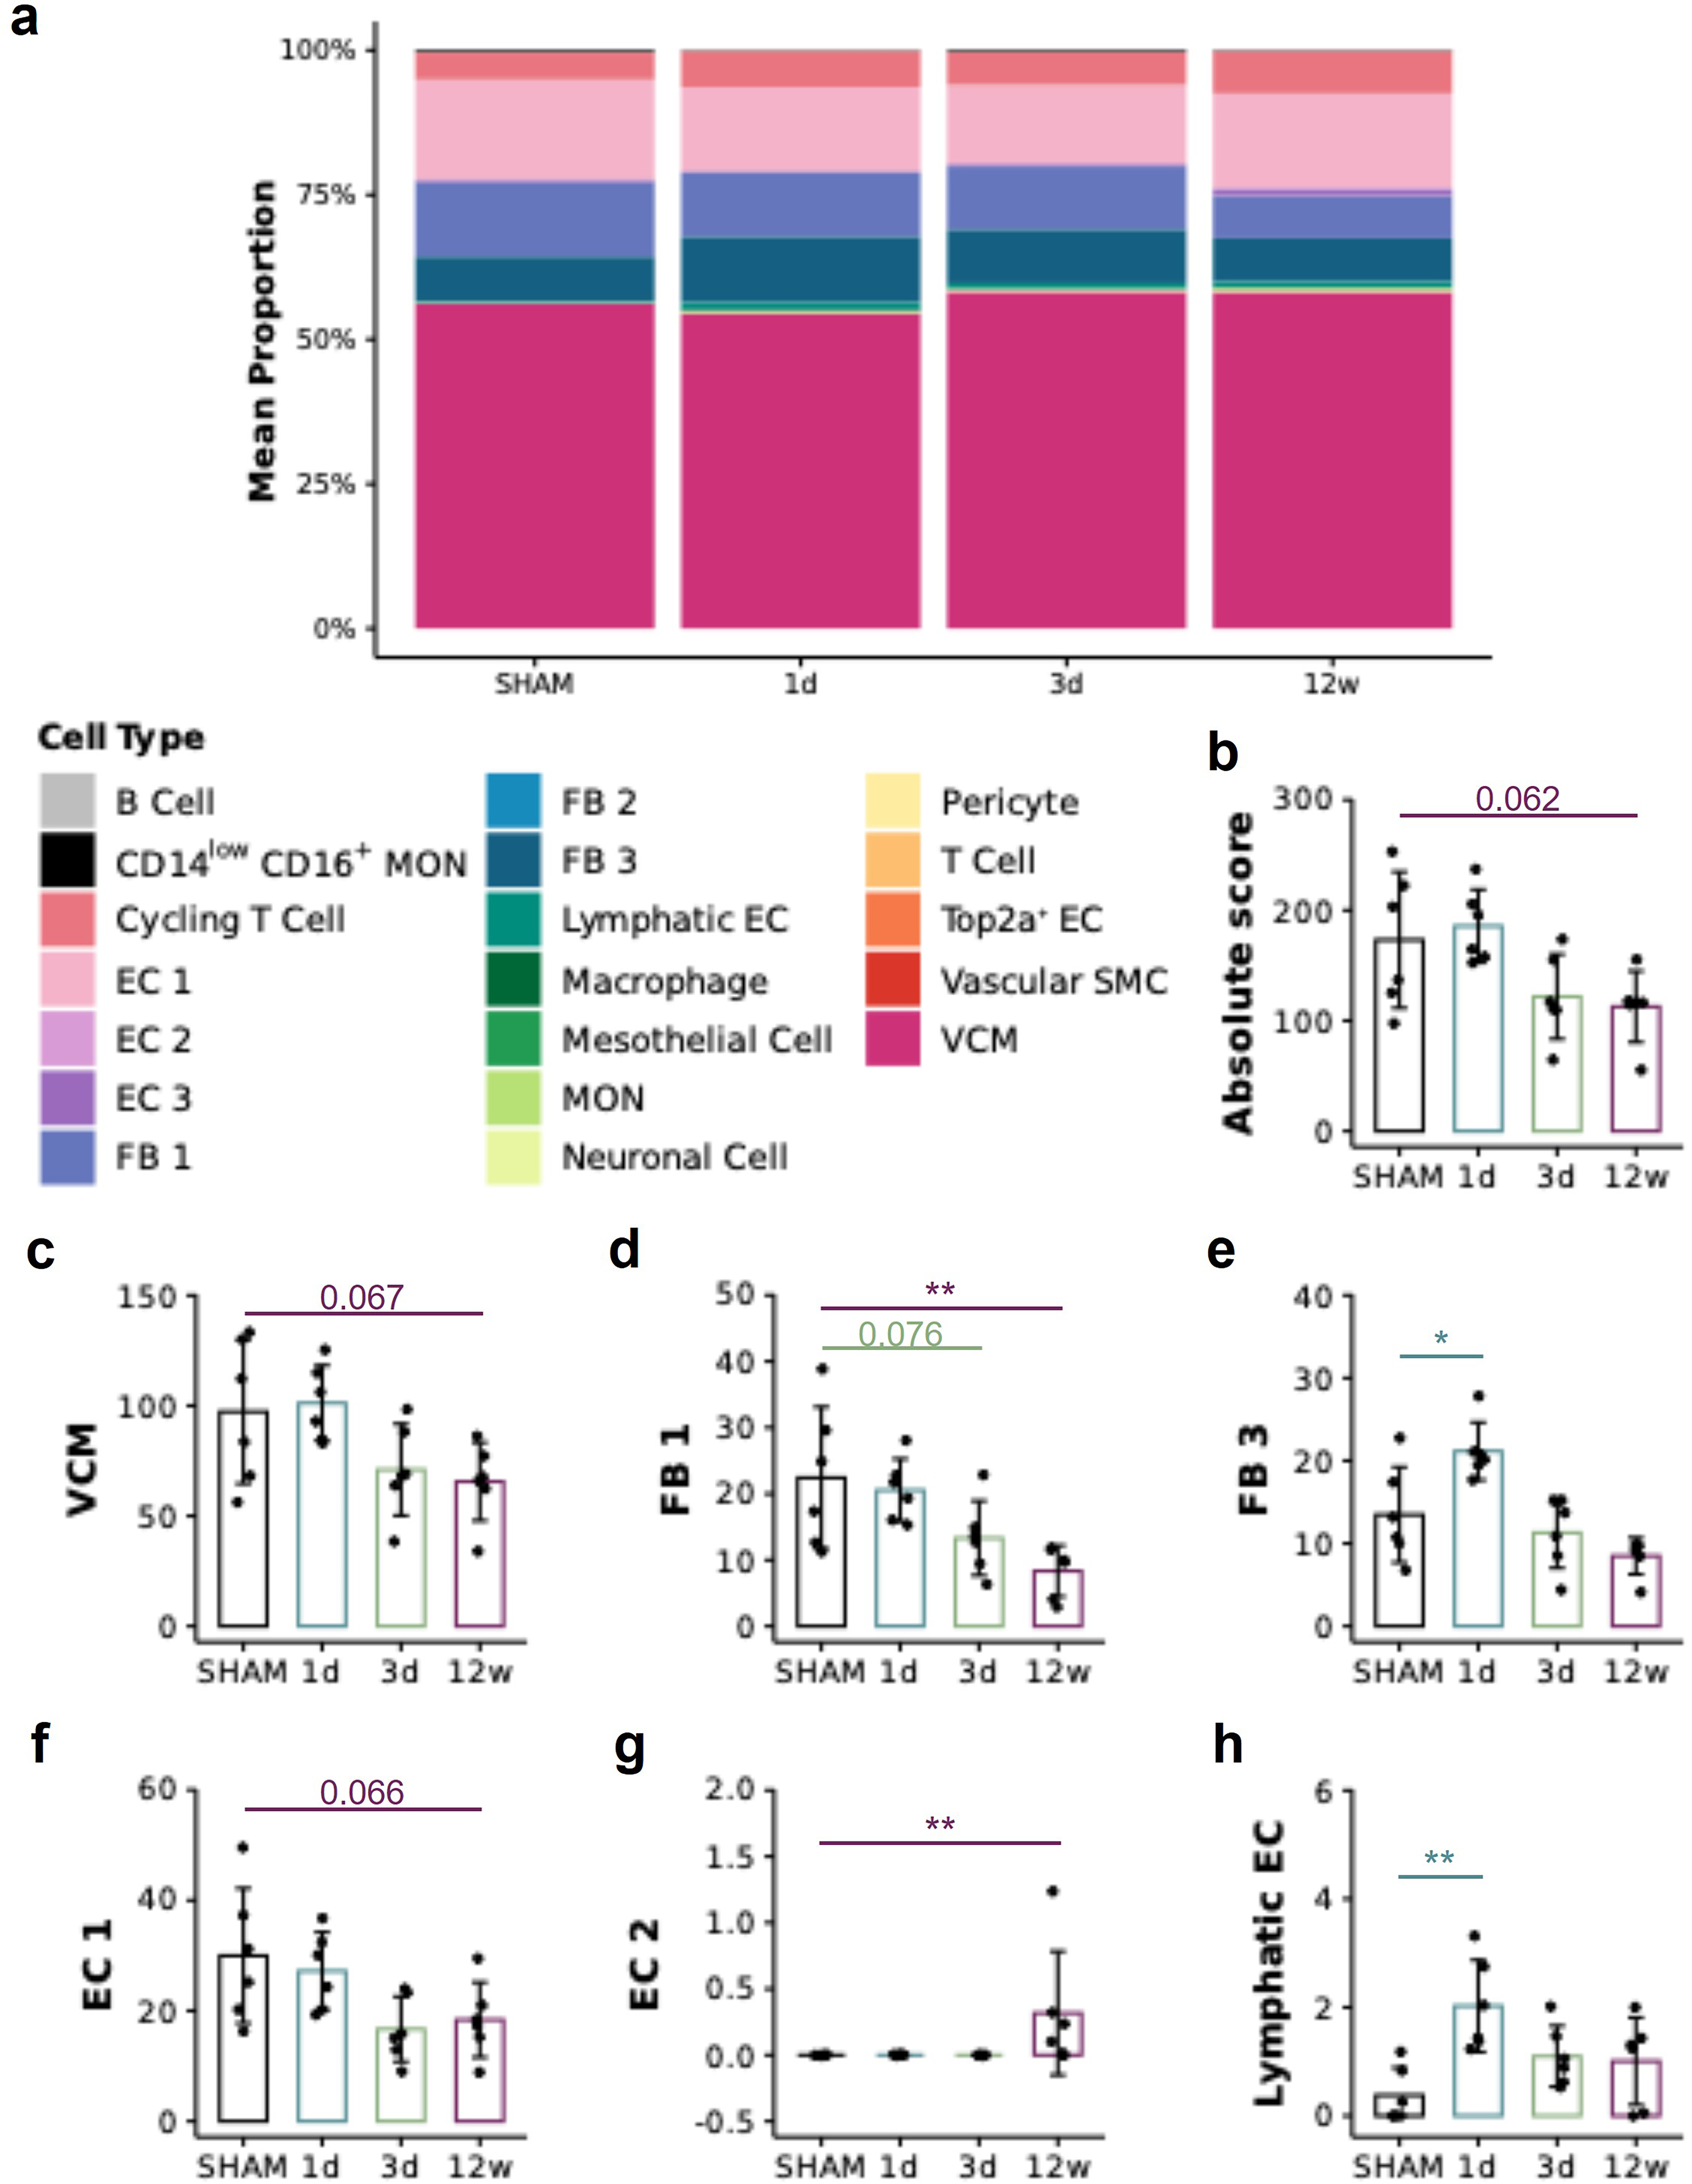
Deconvolution analysis indicates that SCI alters cell type composition in the heart in a temporally distinct manner. To estimate a cell atlas and cell type differences in the left ventricle (LV) following SCI, we used publicly available single-nucleus RNA sequencing data,
41
Seurat in R and CIBERSORTx to deconvolute our bulk transcriptomic data. Panel
Correlation analysis and gene set variation analysis
Due to opposite transcriptomic signatures, correlation analysis between the transcriptomics (bulk RNA-seq; protein-coding data) data, and the function (PV) data were performed separately for acute SCI (i.e., 1d vs. SHAM) and chronic SCI (i.e., 12w vs. SHAM) in R using “Data Integration Analysis for Biomarker discovery using Latent variable approaches for Omics studies” (DIABLO, also known as multiblock sparse partial least squares discriminant analysis; mixOmics package47–49). Following a log2 transformation of the data and filtering out zero variance predictors (using nearZeroVar from mixOmics package47–49), the DIABLO model was tuned (100 permutations, 6 Mfolds) for the number of components (acute SCI: n = 2; chronic SCI: n = 1) and the number of genes and PV variables (acute SCI: component 1 = 38 genes with 2 PV variables, component 2 = 37 gene with 2 PV variables; chronic SCI: component 1 = 54 genes with 2 PV variables). With the identified component genes, gene set variation analysis (GSVA) was performed with EnrichR50–52 using padj ≤0.05 and the abovementioned gene set libraries (i.e., Hallmark MSigDB, GO BP, GO CC, and GO MF).
Graphical visualization and additional statistical analysis
All method-related figures (Figs. 1a and 5a) were created using BioRender.com. All quantitative graphs were generated using R using ggplot2, 53 cowplot, 54 gridExtra, 55 EnhancedVolcano, 56 and mixOmics packages.47–49,57 Final figure layouts were organized with Microsoft® PowerPoint (version 16.87). Statistical analysis for the PV data was performed in R. Prior to running one-way analyses of variance (ANOVAs) with Dunnett’s multiple comparison tests (only vs. SHAM) with a p value cutoff ≤0.05 (stats package, 32 PMCMRplus 58 ), PV and deconvolution data were tested for normality and homogeneity of variances using Shapiro–Wilk’s test and Bartlett test, respectively (stats package, 32 DescTools 59 ). If the assumptions were violated, a nonparametric Kruskal–Wallis test with Dunn’s multiple comparisons test only versus SHAM (Benjamini–Hochberg correction) was performed instead of a parametric ANOVA.
In acute SCI, cardiac function is positively correlated with genes that map with gene sets associated to inflammation/immune response and hypoxia.
Results
SCI alters cardiac gene expression in a temporally distinct pattern
To establish whether SCI has effects on cardiac gene expression, we utilized previously collected 23 LV tissue from male Wistar rats with T3 complete transections and SHAM controls (Fig. 1a). Using principal component analysis of the bulk RNA data (Fig. 1b), we observe that samples from the same groups cluster together (with variations in density), indicating similar transcriptomic profiles within groups validating the consistency and strength of our intragroup data. Three key groups emerge, the 1d SCI and 3d SCI samples overlap while the SHAM and 12w SCI samples form distinct clusters, indicating moderate concordance within acute SCI as well as suggesting differences between SCI versus SHAM and between acute versus chronic SCI (Fig. 1b). Interestingly, the samples from the acute timepoints are located at the opposite side of the X-axis compared the chronic samples suggesting that acute and chronic SCI have paradoxical transcriptomic signatures (Fig. 1b). We next performed DE analysis to identify which genes in the heart had altered transcription due to SCI (Fig. 1a; see the “Materials and Methods” section for details). We found that 5365, 3558, and 3741 genes were differentially expressed at 1d SCI, 3d SCI, and 12w SCI, respectively, versus SHAM (Fig. 1c and Supplementary Fig. S1).
SCI alters the regulation of numerous molecular pathways in the heart
We next aimed to distill our DE results by performing GSEA (Fig. 1a). Using the Hallmark Molecular Signature Database (MSigDB), we found numerous gene sets, which associate with various key molecular pathways, exhibit significantly altered regulation in the heart post-SCI versus SHAM (Fig. 2). Regarding immune response and inflammation-related gene sets, TNF-α signaling via NF-κB, interferon γ/α responses, and IL-2/STAT5 signaling are downregulated in the 1d post-SCI group versus SHAM, whereas the complement and coagulation gene sets are upregulated (Fig. 2). In the 3d post-SCI group, TNF-α signaling via NF-κB remains downregulated with the complement and coagulation gene sets remaining upregulated (vs. SHAM; Fig. 2). Contrary to acute SCI, in the 12w post-SCI group, there is consensus that immune response and inflammation-related gene sets are upregulated (Fig. 2). Cell cycle, proliferation, and division gene sets are largely downregulated in the heart in the 1d and 3d post-SCI groups versus SHAM, while at 12w post-SCI, G2M checkpoint and MYC targets (version 2) are upregulated with Hedgehog signaling downregulated (Fig. 2). With respect to metabolism-related gene sets, fatty acids, heme, bile acid, and xenobiotic metabolism are upregulated acutely post-SCI, and cholesterol homeostasis is downregulated (vs. SHAM; Fig. 2). The only metabolism-related gene set showing differential regulation in the heart at 12w post-SCI versus SHAM is oxidative phosphorylation, which is significantly downregulated (Fig. 2). Gene sets epithelial–mesenchymal transition (EMT) and adipogenesis are upregulated at 1d SCI versus SHAM while EMT, apical junction and myogenesis are all downregulated in the LV at 12w post-SCI versus SHAM (Fig. 2). Cell stress response gene sets such as the unfolded protein response are downregulated at 1d and 3d but upregulated at 12w post-SCI versus SHAM (Fig. 2). Hormone responses are downregulated in both acute (androgen-related) and chronic SCI (estrogen-related) versus SHAM (Fig. 2). When examining GSEA results, one should consider that multiple gene sets share genes in common, perhaps explaining the simultaneous expression of related gene sets (Supplementary Fig.S2).
Further analyses of the LV RNA data with alternate gene set libraries (e.g., gene ontology databases) largely coincide and support the abovementioned findings (Supplementary Figs.S3 and S4). Of note, using the gene ontology–cellular component library, we detected elevated transcription of a gene set named “collagen-containing ECM” at 1d and 3d and reduced levels at 12w post-SCI (Supplementary Fig. S3). The latter concurs with the downregulation of multiple “ECM/collagen”-like gene sets at 12w post-SCI using another gene ontology library–biological process (Supplementary Fig. S4).
SCI changes cell type composition in the LV free wall
Further leveraging our bulk RNA-seq dataset, we sought to estimate a cell atlas and cell type differences in the LV following SCI. Regardless of the experimental grouping, our LV samples were largely composed of ventricular cardiomyocytes (VCMs), fibroblasts, endothelial cells, and cycling T cells (Fig. 3a). Although there were no statistical differences in the total absolute proportion of all cell types (sum of all proportions) and the absolute proportions of VCM post-SCI versus SHAM, the 12w SCI samples trended to have lower values for the absolute score and for VCM than SHAM (post hoc p = 0.062 and 0.067, respectively) (Fig. 3b, c). The deconvolution data also suggest lower absolute proportions of fibroblast type 1 in 12w SCI tissue (trend for 3d SCI, p = 0.076) versus SHAM (Fig. 3d), whereas fibroblast type 3 have higher values in 1d SCI versus SHAM (Fig. 3e). Regarding endothelial cells, type 1 (capillary) trended to have lower proportions in 12w SCI versus SHAM (p = 0.066) (Fig. 3f), while type 2 (endocardial) and lymphatic endothelial cells had elevated proportions at 12 w and 1d post-SCI, respectively, versus SHAM (Fig. 3g, h).
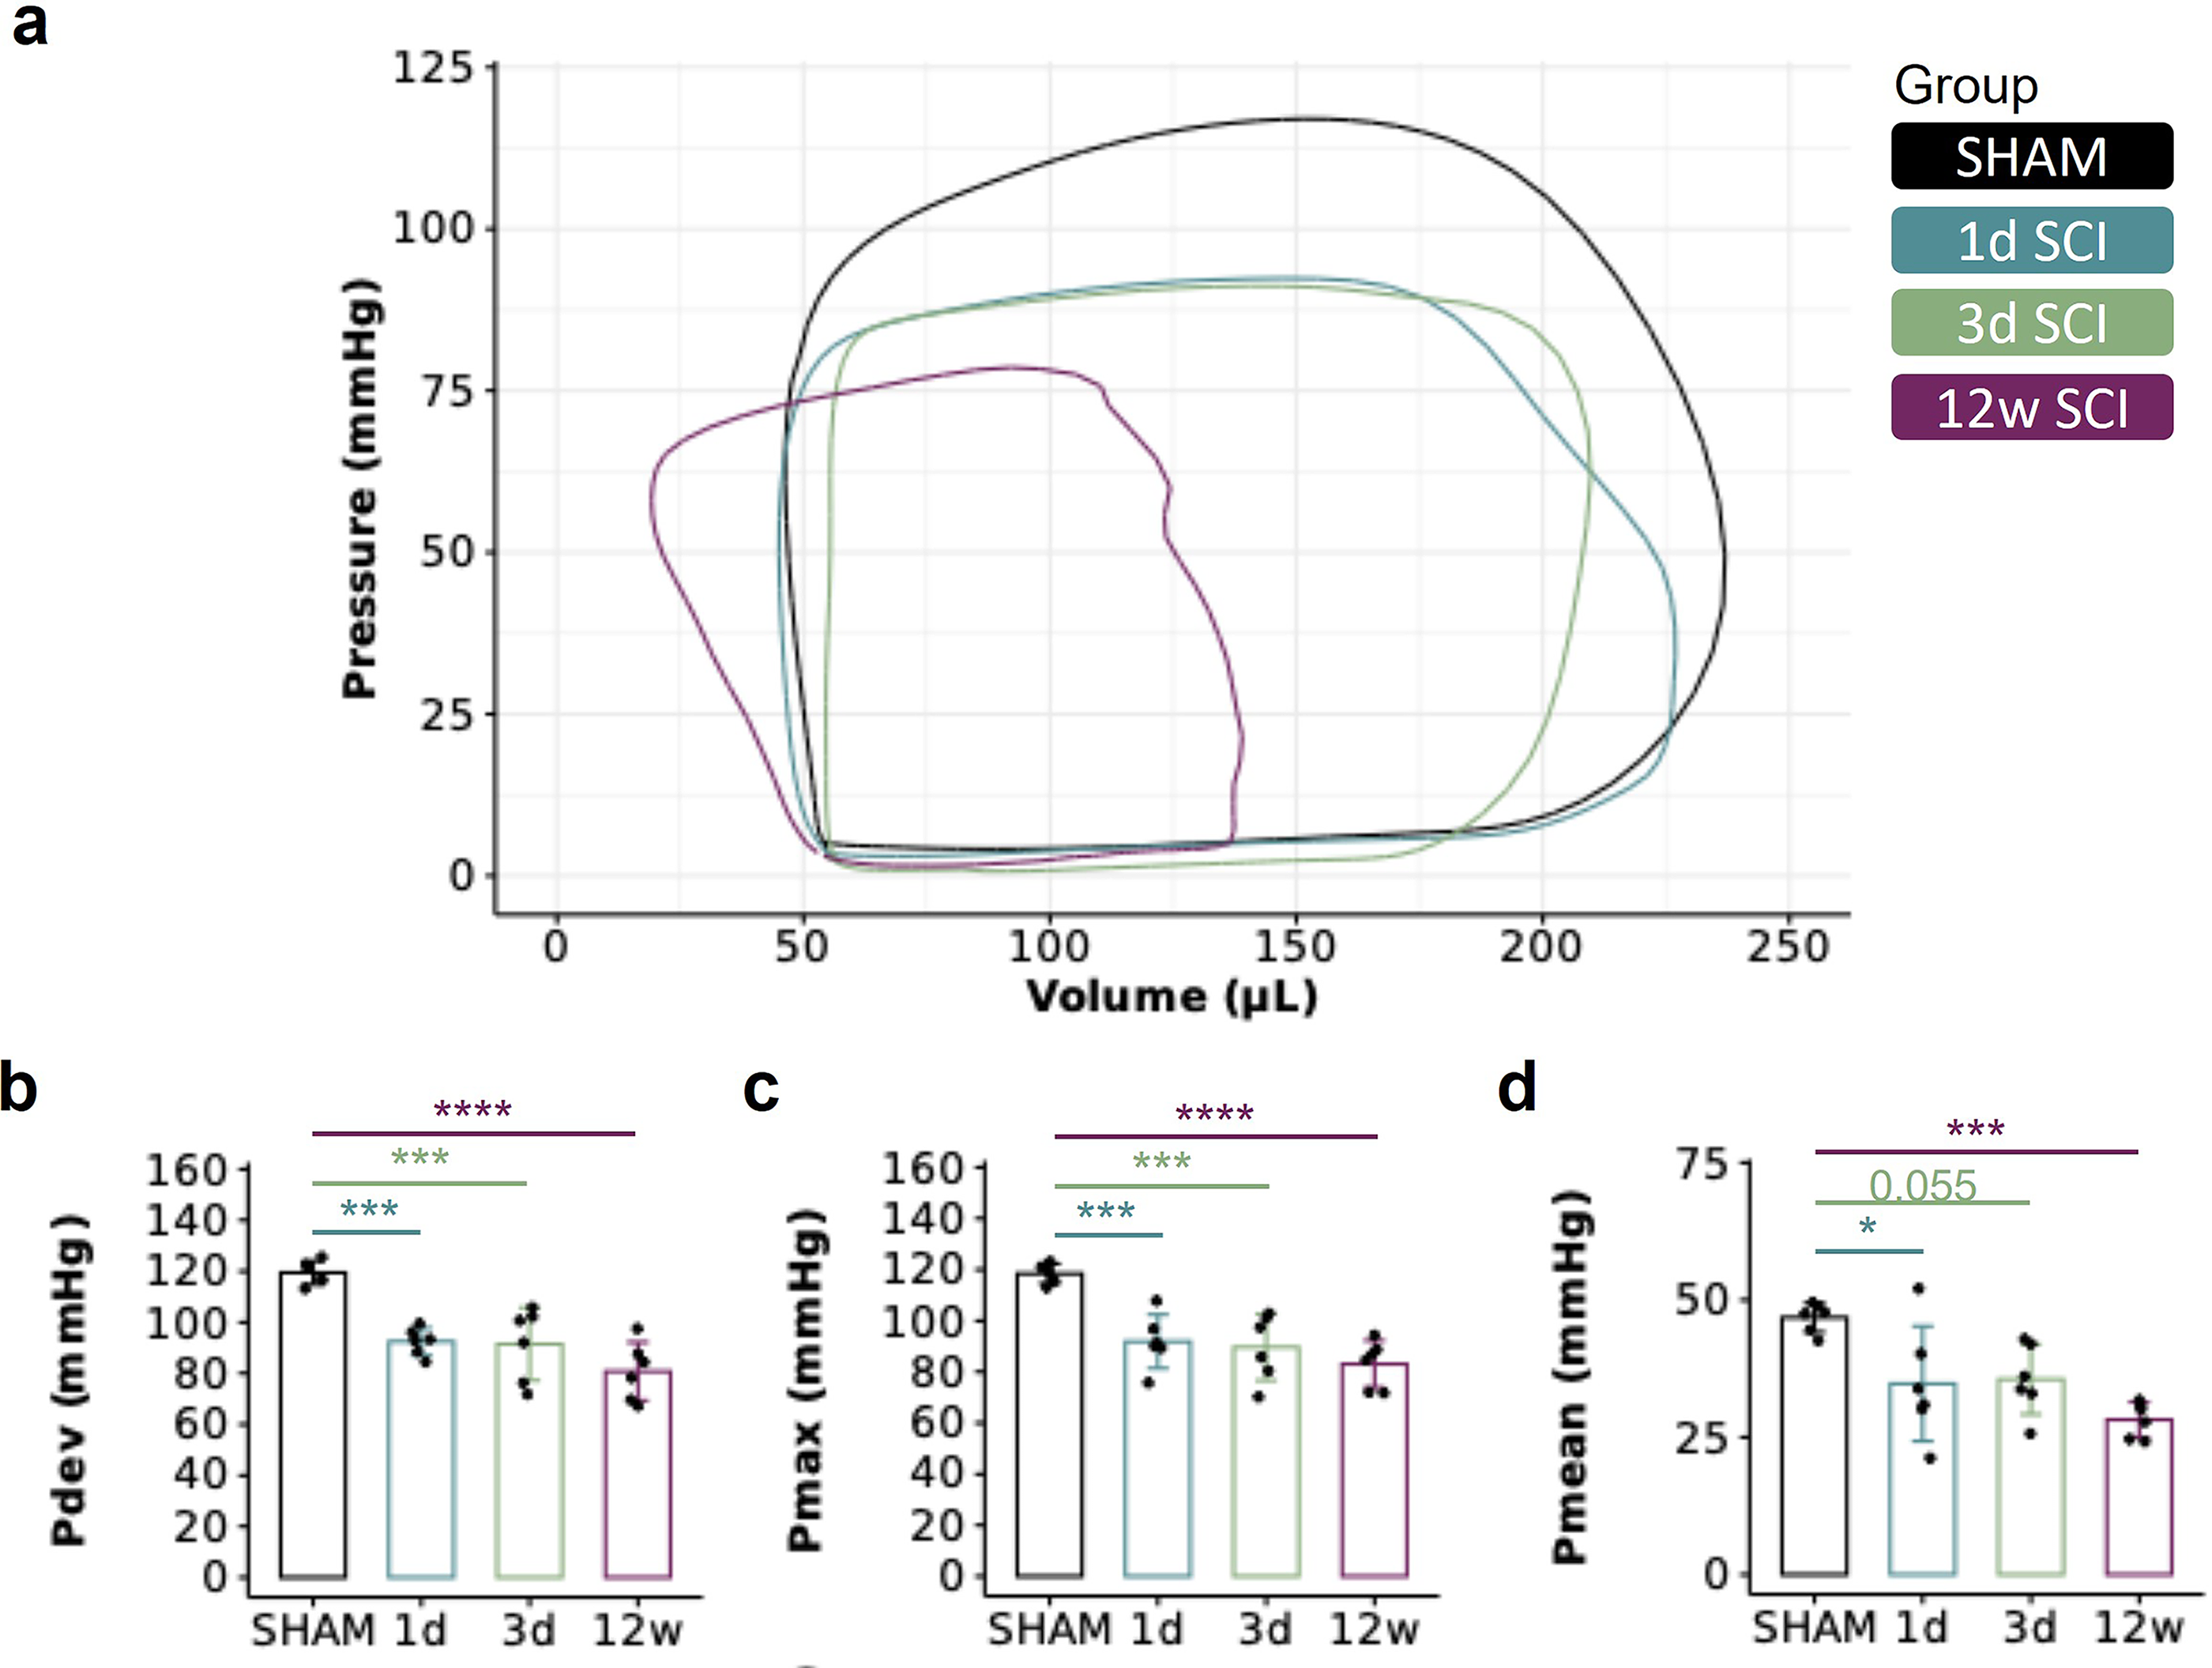
SCI is associated with impaired cardiac function
Ensemble group-averaged PV loops are presented in Figure 4. We found a reduction in LV developed pressure, LV maximum pressure, and LV mean pressure at all timepoints post-SCI, implying a rapid and sustained impairment in LV systolic function. It is important to note that these functional data have been previously published and are included here for illustrative purposes and to enable the correlations provided in the next section. All remaining functional indices from our PV data are provided in Supplementary Table S1.
The temporal effects of SCI on cardiac function assessed by pressure-volume (PV) catheterization.
In acute SCI, impaired cardiac function is correlated with genes associated with immune responses, hypoxia, cell cycle regulation, and cholesterol homeostasis
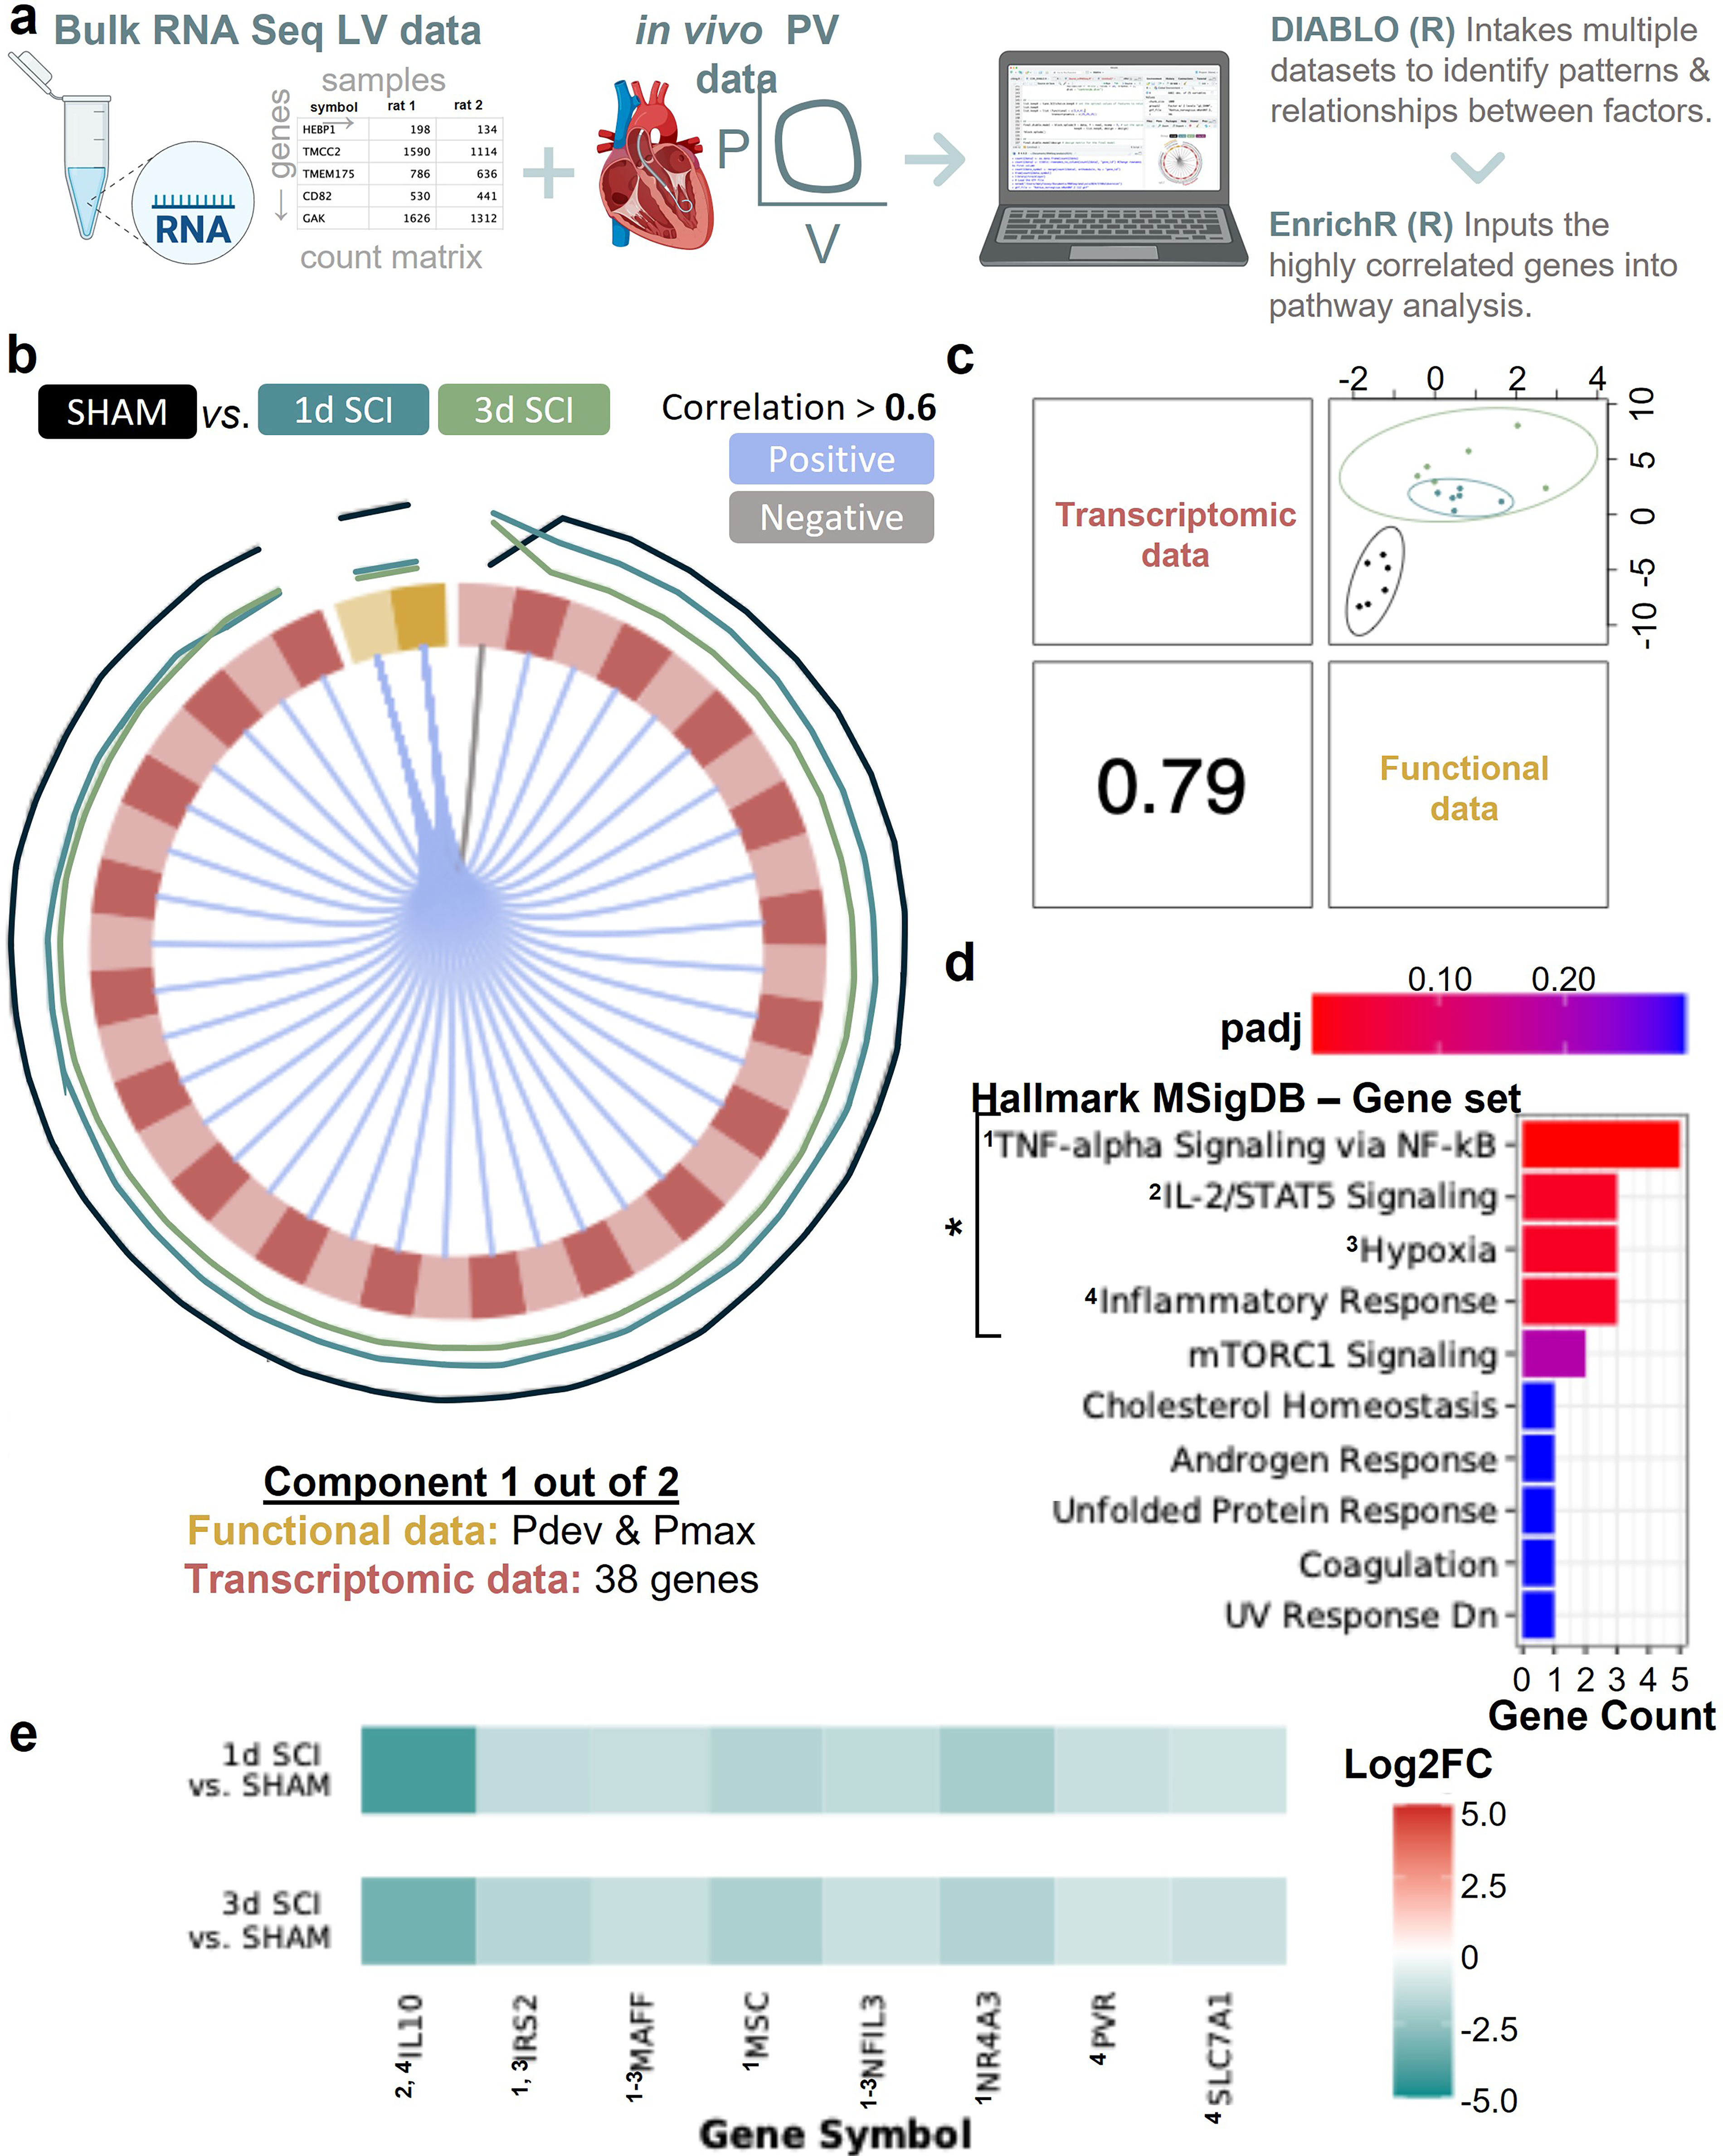
To further refine our GSEA results, we performed correlation analyses between the LV bulk RNA-seq data and the in vivo LV catheterization data (Fig. 4) using the “N-Integration Discriminant Analysis method with Data Integration Analysis for Biomarker discovery using Latent variable approaches for Omics studies” (DIABLO), 48 also referred as multiblock sPLS-DA) (Fig. 5a). Due to quasi-antagonistic transcriptomic signatures for acute versus chronic SCI, we elected to perform separate correlation analyses for the acute and chronic phase post-SCI. In acute SCI (1 and 3d post-SCI groups), we found that 38 genes had moderate-to-high positive correlations with both LV developed pressure (Pdev) and maximum pressure (Pmax) (Fig. 5b and Supplementary Fig. S6). The overall correlation coefficient for the two datasets for this component is 0.79 (Fig. 5c). When mapping the 38 genes via GSVA, we identified the following gene sets: TNF-α signaling via NF-κB, hypoxia, IL-2/STAT5 signaling, hypoxia, and inflammatory response (padj < 0.05; Fig. 5d). The gene expression of the leading-edge genes from these sets is lower acutely post-SCI versus SHAM (i.e., negative log2 fold change), and, of note, their protein’s functions are predominantly of pro-inflammatory nature (Fig. 5e). Additional gene mappings can be found in Supplementary Figure S7.
In chronic SCI, impaired cardiac function is correlated with genes associated with immune responses, EMT, angiogenesis, and hormone signaling
Using the chronic and SHAM transcriptomic and functional data, one component containing 54 genes and two PV variables (i.e., mean pressure [Pmean] and Pmax) was generated via DIABLO analysis (Fig. 6a and Supplementary Fig. S8). When mapping the 54 genes via GSVA (using Hallmark MSigDB), we identified the genes to be statistically significantly associated with EMT, angiogenesis, ultraviolet response, immune/inflammatory responses, Kirsten rat sarcoma virus (KRAS) signaling, and the estrogen response (padj <0.05; Fig. 6c). The LE genes from these significant sets have lower log2 fold changes (results from DESeq2) at 12w post-SCI versus SHAM (i.e., negative; Fig. 6d and Supplementary Fig. S9).
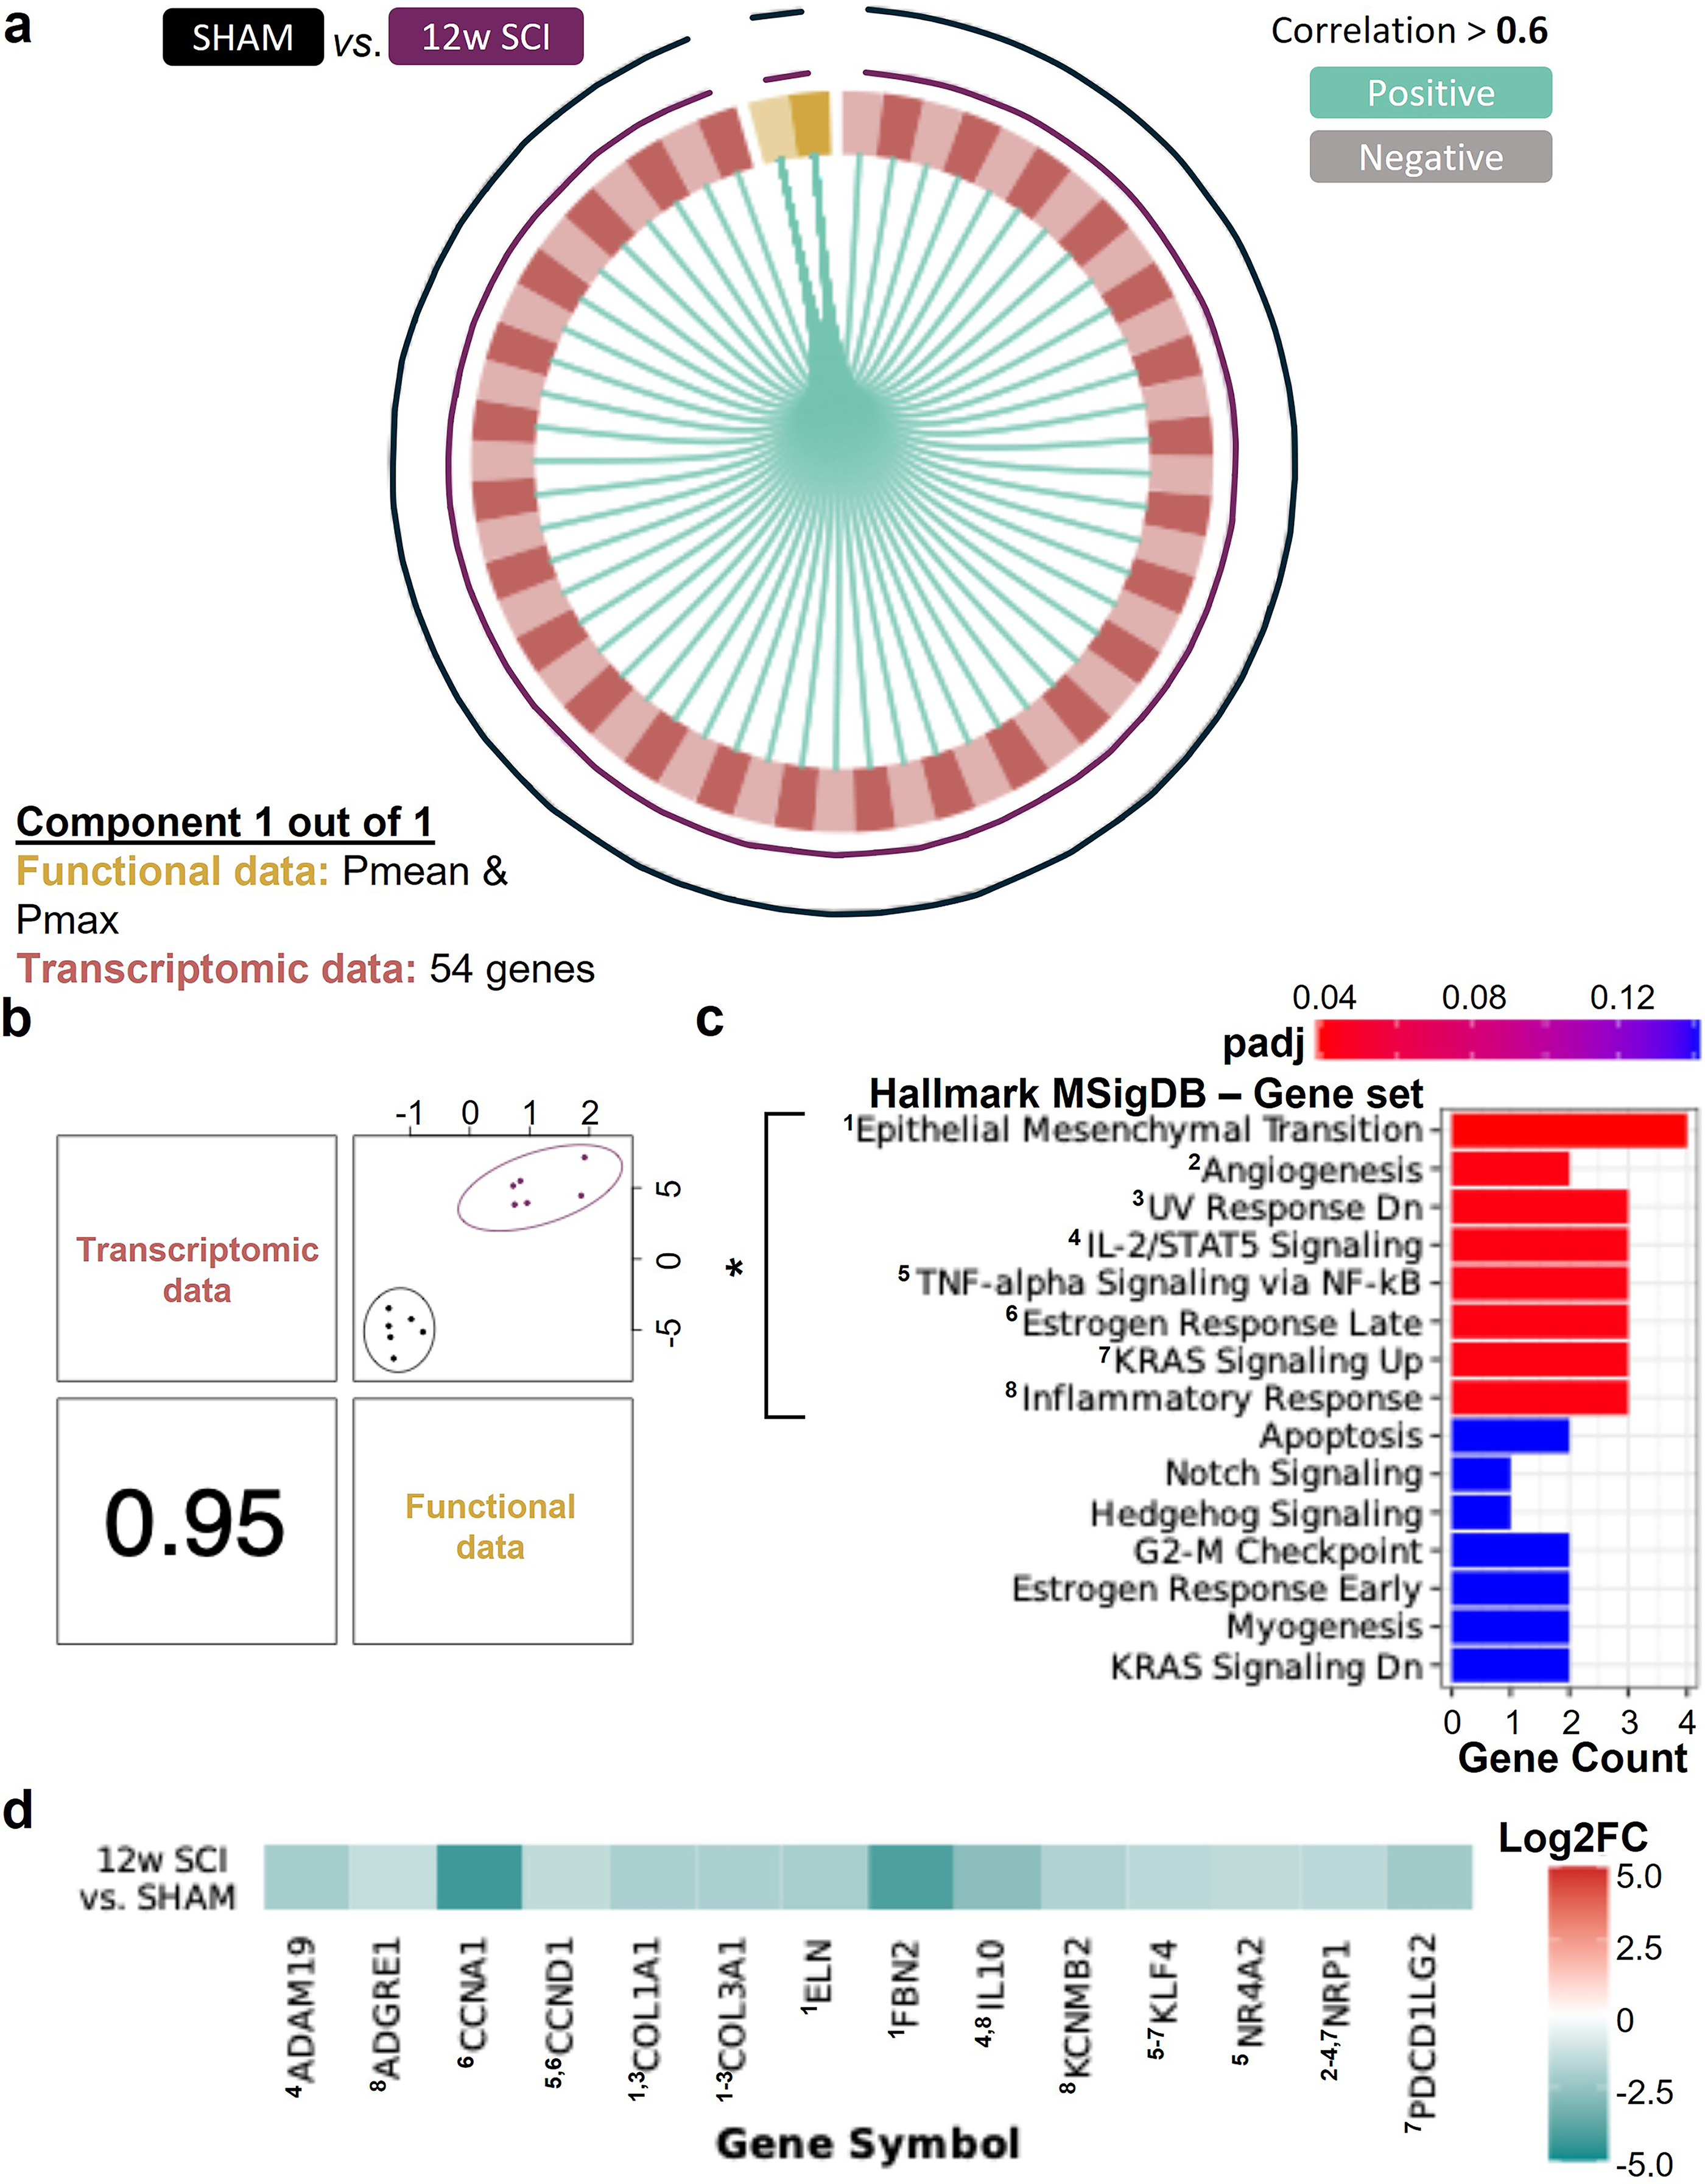
In chronic SCI, cardiac function is positively correlated with genes that map with gene sets associated with inflammation/immune response, epithelial–mesenchymal transition (EMT), angiogenesis, and cell growth/survival. The tuned DIABLO model with the chronic SCI vs. SHAM data generated one component (mixOmics). (
Discussion
The present study is the first to utilize a transcriptomic approach to address the gap in our understanding of the cardiac molecular pathways that are altered post-SCI. Our findings demonstrate that high-level experimental SCI alters cardiac gene expression, albeit differently in the acute and chronic phases. Changes in the transcription of key genes that correlate with the reduction in cardiac pressures post-SCI are predominantly linked to cellular differentiation/transition (e.g., EMT and angiogenesis) and immune, inflammatory, stress, and hormone responses.
Our transcriptomic analyses provide compelling evidence that high-level SCI alters gene expression in the heart since thousands of genes are differentially expressed in the LV following SCI at all timepoints investigated. The pathway-level enrichment data further demonstrate that SCI affects pathway regulation in the LV, predominantly impacting the cell cycle, metabolism, cellular differentiation, ECM composition, and hormone, immune/inflammatory, and stress responses. Although both acute and chronic SCI have significant effects on cardiac gene expression, they present discrete transcriptomic signatures—a recurring pattern observed across our multivariate, DE, GSEA, and correlation analyses. Due to the sheer number of pathways that appear to be impacted by SCI, we have chosen to focus our discussion first on the pathways that correlate most strongly with the reduction in cardiac pressure-generating capacity (i.e., the results from our DIABLO analysis).
When considering the correlation DIABLO analysis using both transcriptomic and functional PV data, the acute reduction in cardiac pressures post-SCI (i.e., Pdev and Pmax) noted in the 1d and 3d post-SCI groups, most strongly correlates to the downregulation of genes associated with immune, inflammatory, and stress responses in the LV. More specifically, we observed reduced transcription of genes associated with TNF-α signaling via NF-κB, interferon responses (i.e., γ and α), IL-2 STAT5 signaling pathways, and hypoxia. In the 12-week SCI group, reduced transcription of genes associated with TNF-α signaling via NF-κB, interferon responses (i.e., γ and α), and IL-2 STAT5 signaling pathways remained, but there was also downregulation of genes mapping to EMT, angiogenesis, and stress responses. We interpret these findings to imply that the reduction in cardiac function post-SCI is broadly correlated to changes in immune function and the inflammatory response. Outside of the heart, there is emerging evidence that disrupted sympathetic signaling to the immune organs causes SCI-induced immune suppression syndrome that extends to many organ systems.11,15,60–66 There is also evidence of elevated glucocorticoid levels produced by a stress-induced dysregulated hypothalamic–pituitary–adrenal axis. 67 Our findings extend these prior observations by implying that SCI also induces immune deficiency in the heart. Coupled to impaired immune function, when we examined the genes at the leading edge of our DIABLO analysis, we found IL-10 was downregulated at all timepoints. IL-10 is a potent anti-inflammatory cytokine, and downregulation of IL-10 may precipitate a pro-inflammatory environment in the heart post-SCI (see also below). Indeed, outside of the field of SCI, systemic IL-10 administration has been shown to improve LV function, reduce infarct size, and attenuate infarct wall thinning in a mouse model of myocardial infarction. 68
While our DIABLO analysis may help narrow down which pathways correlate with reduced cardiac systolic function post-SCI, it is also important to note that our DE and GSEA demonstrate altered regulation of a number of other important pathways for regulating a “healthy” LV. Our results uniformly imply a downregulation of oxidative phosphorylation, changes in cellular differentiation/organization and ECM (e.g., reduced EMT, apical junctions, and myogenesis), reduced estrogen response, and chronic inflammation with associated activation of cell stress pathways in the heart following SCI. Together, the chronic alteration of such biological pathways’ regulation points to sustained molecular dysregulation and subsequent tissue/intracellular stress in the LV following SCI. With respect to oxidative phosphorylation, the downregulation of related genes chronically post-SCI may mirror the reduction in energetic demand as a consequence of cardiomyocyte atrophy (i.e., smaller cardiomyocytes require less adenosine triphosphate generation). However, reductions in oxidative phosphorylation activity and expression are observed in cardiac samples obtained from humans and preclinical models with various forms of heart disease (e.g., low ejection fraction, heart failure, cardiomyopathies, and arrhythmias).69–72 The SCI-induced acute upregulation of EMT and collagen-containing ECM-related genes followed by a chronic reversal of these gene sets (i.e., downregulation), along with reduced apical junction and myogenesis gene expression, could imply a series of events occurring intra- and extracellularly, leading to changes in myocardial tissue composition and integrity. Such findings broadly align with our prior work where we have observed significant collagen deposition and fibrosis in the hearts of chronic SCI rats via histology 73 and chronic reductions in left-ventricular twist mechanics in individuals with high-level SCI. 23
Deconvolution of our transcriptomic data suggests that high-level SCI alters cell composition of the LV free wall, which is primarily due to changes in the absolute proportions of fibroblast and endothelial cells. Regarding fibroblasts, we detect higher absolute proportions of subtype 3 acutely and lower proportions of subtype 1 chronically. As these fibroblast subtypes have overlapping pro-fibrotic and pro-reparative marker genes, their definitive phenotypes remain quasi-indiscernible. Nevertheless, the estimated acute increase and chronic reduction of fibroblast populations interestingly mirror the rise and fall of EMT and collagen-containing ECM transcription following SCI (i.e., such genes are upregulated at 1d but downregulated at 12w post-SCI). With respect to endothelial cells following SCI, we observe an increase in the absolute proportions of the lymphatic subtype acutely, whereas the proportions of the endocardial subtype increase and the capillary subtype decreases chronically. These estimated fluctuations in different endothelial cell type populations across the acute-to-chronic continuum of SCI may indicate dynamic vascular changes within the heart after injury, which broadly align with findings from our DIABLO analysis discussed above.
Limitations
Most of the study limitations pertain to the bulk nature of the data. While myocardial tissue is largely composed of cardiomyocytes, by solely using bulk RNA-seq for our analyses, we cannot distinguish whether the cardiac transcriptomic events post-SCI are occurring within different cardiac cell types. While we did try to investigate proportions of cell types in the heart tissue post-SCI, deconvolution of RNA-seq data only produces estimations. The only solution for these limitations is to perform single-cell or snRNA-seq, which is beyond the scope of the present study. It is, of course, also important to recognize that RNA levels do not always mirror protein levels (e.g., most, if not all, pro-inflammatory responses require activation via cleavage, phosphorylation, or other protein modifications). We have focused our DIABLO analysis on cardiac systolic function, as systolic dysfunction post-SCI appears to be more prevalent (at least at these earlier timepoints) post-SCI. Nevertheless, there is evidence of diastolic dysfunction in the chronic stages of SCI, 19 and conducting similar approaches on diastolic functional indices would also be a useful endeavor for the field.
Conclusion
We present compelling evidence that SCI affects the heart at the molecular level. Although both acute and chronic SCI alter cardiac gene expression, they present discrete transcriptomic signatures. Irrespective of time since injury, our findings show recurring themes: Changes in immune, inflammatory, stress, and hormone responses in the heart post-SCI are most strongly correlated with functional decline. Whether our findings represent a direct impact of SCI on the myocardium and remodeling, or occur downstream of systemic inflammation/endothelial dysfunction warrants, further investigation. Nevertheless, we suspect that extensive SCI-induced autonomic dysfunction is a principal cause of both altered immune signaling and changes in heart structure/function post-SCI.
Transparency, Rigor, and Reproducibility
Experiments were conducted on 24 male Wistar rats, of which 18 underwent a complete T3-transection SCI and 6 remained as age- and sex-matched uninjured controls. Because no studies have previously reported RNA-seq data on the heart following SCI, we were unable to perform a formal sample size estimation. All animals survived the SCI and made it to their pre-determined experimental end-point. At study termination, we performed in vivo left-ventricular pressure-volume catheterization to characterize heart function and additionally harvested a section of the left-ventricular free wall for RNA-seq analysis. The PV data of these rats have already been published in Fossey and Balthazaar et al. 23 The SHAM and acute SCI rats (1 day and 3 days) are from Part I of the article, which aimed to investigate temporal effects of SCI on the heart, whereas the chronic SCI rats (12 weeks) are from Part II, more specifically the level of injury study, which aimed to determine whether the loss of bulbospinal sympathetic control caused the decline in cardiac function post-SCI. We are simply reusing that functional data here to guide the interpretation of our RNA-seq data. All RNA-seq data are reported here for the first time. RNA quality control was performed by assessing the RIN and DV200. Samples meeting pre-specified quality thresholds were advanced to library preparation. FASTQ files obtained from the sequencing center underwent quality control via FastQC (version 0.12.1). No FASTQ files were removed from downstream alignment and analysis. The paired-end reads were aligned with the Rattus Norvegicus genome (index using mRatBN7.2 files; Ensembl) using STAR (version 2.7.11a), and a count matrix was generated using featureCounts (version 2.0.6). Data from this study are appended and are additionally in the process of being deposited in a FAIR data repository (odc-sci.org).
Authors’ Contributions
M.P.M.F.: Conceptualization, data curation, formal analysis, methodology, and writing—original draft. B.H., M.S.P.M., and F.S.: Methodology and writing—review and editing. E.E.: Methodology, project administration, and writing—review and editing. A.H.: Methodology, writing—review and editing. D.J.G.: Conceptualization and writing—review and editing. A.S.: Conceptualization, formal analysis, and writing—review and editing. C.R.W.: Conceptualization, formal analysis, methodology, writing—original draft, supervision, and funding acquisition.
Footnotes
Data Availability
All data supporting the results in this article can be found within the main figures and in the Supplementary Figures and Table. The source data associated with this publication have been deposited in NCBI’s Gene Expression Omnibus (Edgar et al., 2002) and are accessible through GEO Series accession number GSE328588 (![]() ). Code availability can be provided by request to the senior author.
). Code availability can be provided by request to the senior author.
Author Disclosure Statement
The authors have no conflicts of interest to declare.
Funding Information
M.P.M.F., Canadian Institutes of Health Research Doctoral Award and Four-Year Fellowships from the University of British Columbia. This research was enabled in part by support provided by the Digital Research Alliance of Canada (alliancecan.ca).
Supplemental Material
Supplemental Material
Supplemental Material
Supplemental Material
Supplemental Material
Supplemental Material
Supplemental Material
Supplemental Material
Supplemental Material
Supplemental Material
References
Supplementary Material
Please find the following supplemental material available below.
For Open Access articles published under a Creative Commons License, all supplemental material carries the same license as the article it is associated with.
For non-Open Access articles published, all supplemental material carries a non-exclusive license, and permission requests for re-use of supplemental material or any part of supplemental material shall be sent directly to the copyright owner as specified in the copyright notice associated with the article.