
Abstract
Keywords
Hearing loss is among the most prevalent chronic age-related health conditions. It occurs in up to 90% of American adults aged above 80 (Cruickshanks et al., 2003), and is estimated to currently affect 75% of Australians aged above 70 years (Access Economics, 2006). Overall, Australian prevalence rates are projected to increase with population aging. In 2005, the financial cost and burden of disease arising from hearing loss was estimated to be more than AU$22 billion in Australia (Access Economics, 2006) and in excess of €213 billion Europe (Shield, 2006). The lifetime cost of severe to profound hearing loss in the United States has been estimated to be US$297,000 per person (Mohr et al., 2000). These estimates are also expected to increase with rising prevalence. Age-related hearing loss has been linked with reduced quality of life (Chia et al., 2007; Hogan, O’Loughlin, Miller, & Kendig, 2009), poor mental health (Gopinath, 2009b; Kramer, Kapteyn, Kuik, & Deeg, 2002), diabetes (Mitchell et al., 2009), smoking (Gopinath et al., 2010), cognitive impairment (Tay et al., 2006), reduced social participation, increased use of community support services (Schneider et al., 2010), and increased risk of mortality (Karpa et al., 2010). Despite its impact on health and well-being, age-related hearing loss is known to be both underrecognized and undertreated (Reuben, Walsh, Moore, Damesyn, & Greendale, 1998). Recent reviews have found that globally only a small number of surveys were suitable for estimating hearing impairment in the general population (Pascolini & Smith, 2009). There are currently sparse national data on hearing impairment in older people, in Australia and elsewhere, with recent investigations of risk factors for incidence of age-related hearing loss being underpowered (Gopinath et al., 2010; Gopinath, Schneider, Rochtchina, Leeder, & Mitchell, 2009a; Mitchell et al., 2009).
The gold standard method for measuring hearing loss is pure-tone audiometry. The World Health Organisation (WHO) defines mild hearing impairment as unaided pure-tone audiometric hearing thresholds (PTA) greater than 25-decibel hearing level (dB HL) in the better ear, averaged across the tone frequencies of 0.5, 1, 2, 4 kHz. Hearing thresholds greater than 40dB HL are described by WHO as disabling (World Health Organization, 1999). Definitions of moderate and severe hearing loss are slightly different in the United States. Because the costs and logistics involved in conducting audiometry assessments are prohibitive for many epidemiological surveys, self-report measures are often used instead. These self-reported measures of hearing loss have previously been thought to be reliable and predictive of measured hearing loss while also providing an ecologically valid measure of perceived hearing difficulties (Johnson, 2010; Nondahl et al., 1998).
Contrary to the belief that self-reported hearing items are strongly associated with measured hearing loss, evidence is equivocal. Self-reported difficulty of hearing a conversation in a quiet room has been shown to have serious misclassification problems of audiometric hearing loss and has been argued to be inappropriate for providing prevalence estimates of hearing impairment over a broad age sample (range 15 to 71+; Wilson et al., 1999). Response propensity may also be influenced by individual differences, as one study has shown that self-reported hearing loss is more strongly associated with personality than measured hearing loss (Cox, Alexander, & Gray, 2007). In contrast, other studies (Nondahl et al., 1998; Sindhusake et al., 2001) have reported that a more general question asking “Do you feel you have hearing loss?” with binary response is a more reliable self-report measure for assessing age-related hearing loss in adults aged between 45 and 100, with better predictive properties compared to other self-report scales such as the Hearing Handicap for the Elderly (HHIE; Ventry & Weinstein, 1982), hearing aid use, and hearing ratings on a 5 point Likert-type scale, although these comparisons failed to consider how age moderates the association between self-report and audiometric hearing measures. Although responses are generally coded on a 3- to 5-point Likert-type scale, it is not uncommon to recode responses into a dichotomous variable format, whereby any degree of reported hearing difficulty (e.g., “a little trouble,” “a lot of trouble,” “deaf”) is taken to be indicative of hearing loss (Caban, Lee, Gomez-Marin, Lam, & Zheng, 2005).
Given the lack of large-scale data sets including information on hearing loss, much benefit can be gained from combining information from the available data sets that include items on hearing loss. This data-pooling approach requires harmonizing and validating measures of self-reported hearing loss so they are comparable across surveys. In this study, we report on a method of dichotomizing self-reported hearing loss items in a pooled data set and evaluate the reliability and utility of such harmonized self-reported hearing loss in comparison to the gold standard measure of pure-tone audiometric thresholds. The aims of the present study were, first, to compare prevalence estimates of hearing loss between those based on dichotomized self-report and standardized audiometric measurements. Second, this study aimed to evaluate the utility of a harmonized binary measure of self-reported hearing loss. The findings will enable future research into prevalence and incidence of hearing impairment, its risk factors and outcomes, in a nationally representative pooled data set.
Method
Sample
Data were drawn from the Dynamic Analyses to Optimise Ageing Project (DYNOPTA) which has harmonized and pooled nine Australian longitudinal studies of aging (baseline n = 50,652). A comprehensive description of the study design has been reported previously (Anstey et al., 2010). Baseline details of the contributing studies included in this article are shown in Table 1 and comprise the Australian Longitudinal Study of Ageing (ALSA; Luszcz et al., 2007), the Australian Longitudinal Study of Women’s Health (ALSWH; Lee et al., 2005), the Blue Mountains Eye Study (BMES; Mitchell et al., 2009), the Canberra Longitudinal Study (CLS; Christensen et al., 2004), the Melbourne Longitudinal Studies on Healthy Ageing Program (MELSHA; Browning & Kendig, 2010), the Path Through Life Study (PATH; Anstey et al., 2011) and the Sydney Older Persons Study (SOPS; Piguet et al., 2003). Baseline waves were collected between 1992 and 2001. Table 2 shows the pooled sample profile reported in this study (n = 23,001; 22% men). At baseline, the mean age was 71.6 years (SD = 6.2, range = 55 to 103), 9,190 (40%) participants left secondary school before the age of 15 years and 1,759 (8%) participants were tertiary qualified. The preponderance of women aged between 70 and 75 years reflects the inclusion of the ALSWH old cohort (n = 12,432).
Contributing Study Baseline Information

DYNOPTA Sample Profile at Baseline, Demographics (Row %) by 5-Year Age Groups (N = 23,001)
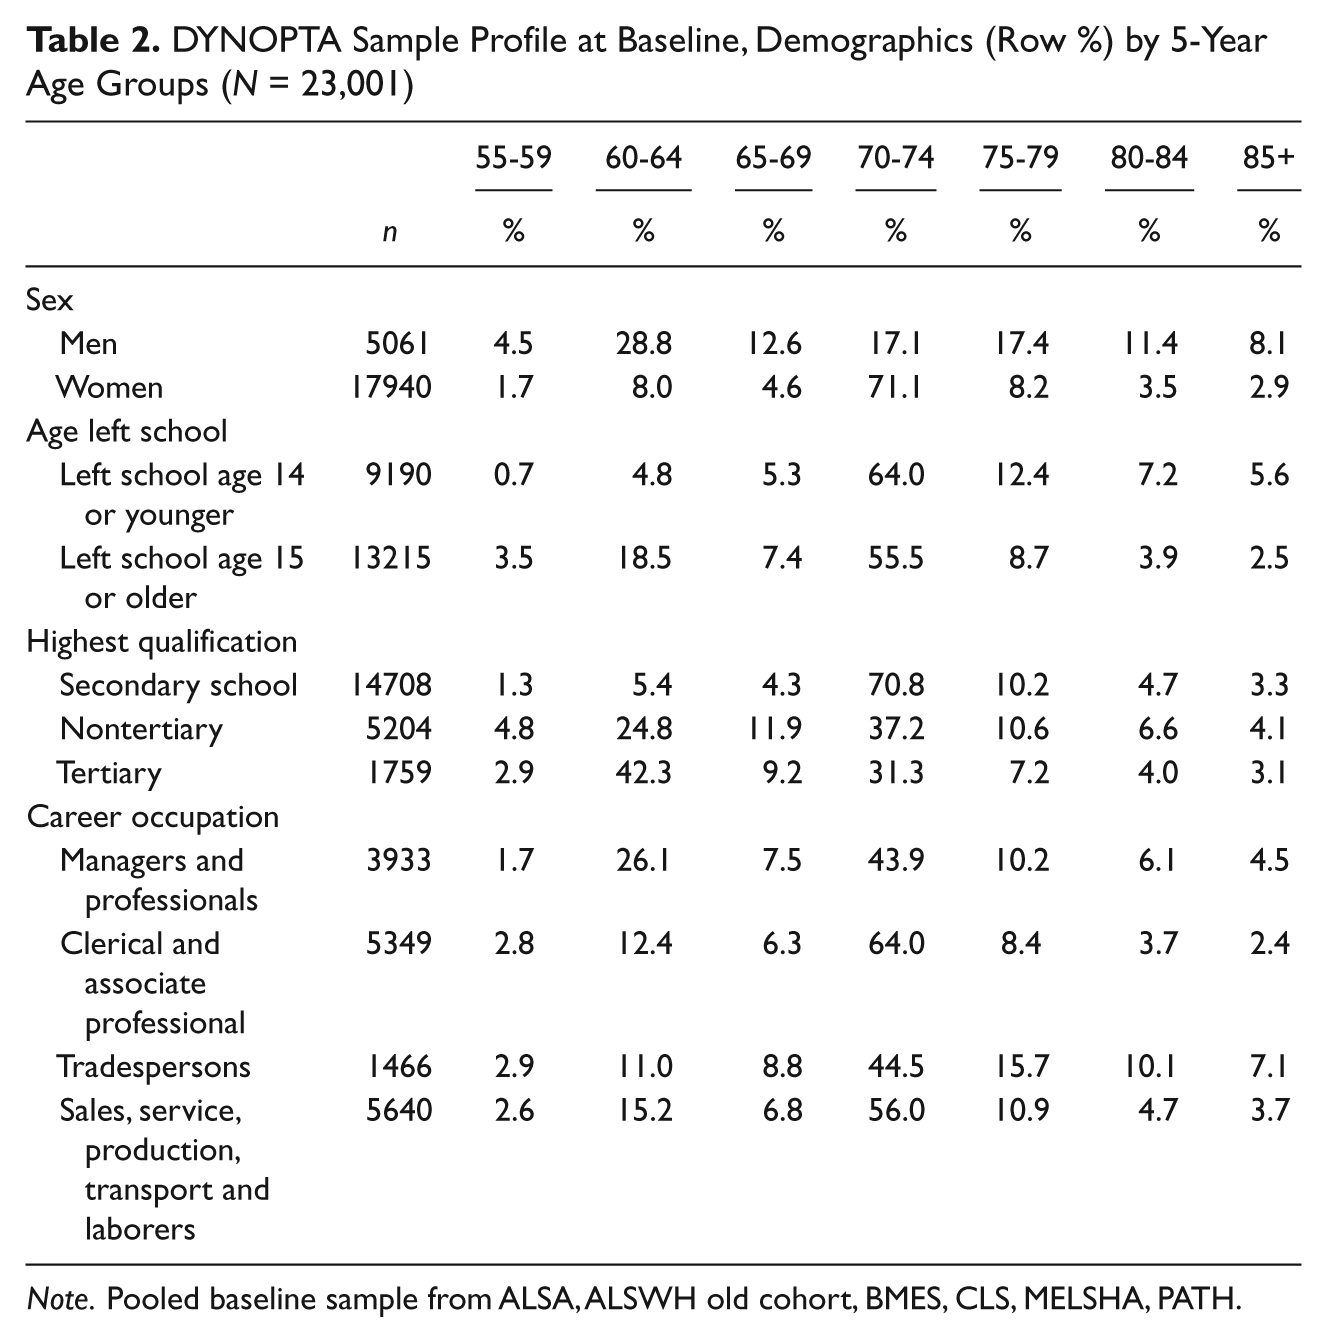
Note. Pooled baseline sample from ALSA, ALSWH old cohort, BMES, CLS, MELSHA, PATH.
Measures
Measured hearing loss was assessed by uncorrected pure-tone air-conduction audiometric thresholds (PTA) in waves 1, 3, 6, and 7 of ALSA and waves 2 and 3 of BMES. We defined hearing impairment as PTA greater than 25 dB HL in the better ear averaged across air-conduction tone frequencies of 0.5, 1, 2, and 4 kHz (PTA0.5,1,2,4 kHz). Levels of hearing impairment were defined as no hearing loss (PTA0.5,1,2,4 kHz < 25 dB), mild hearing loss (PTA0.5,1,2,4 kHz: 25-40 dB), moderate hearing loss (PTA0.5,1,2,4 kHz: 41-60 dB), and severe hearing loss (PTA0.5,1,2,4 kHz > 60 dB).
Self-reported hearing loss was obtained by ALSA (Waves 1, 3, 6, 7), ALSWH (Wave 1), BMES (Waves 1, 2, 3), CLS (Waves 1, 2, 3, 4), MELSHA (Waves 1, 10), PATH (Wave 2) and SOPS (Waves 1, 2, 4, 5). Original item wording and response formats varied between studies and are presented in Table 3. A harmonized measure of self-reported hearing loss comprising of two levels was created (“no self-reported hearing loss,” and “any self-reported hearing loss”), whereby any degree of reported hearing losses, hearing difficulty, or hearing problems were recoded to reflect self-reported hearing loss. Age left school was coded as a binary variable indicating school leaving age being 15 years or older.
Self-Reported Hearing Items Harmonized in DYNOPTA
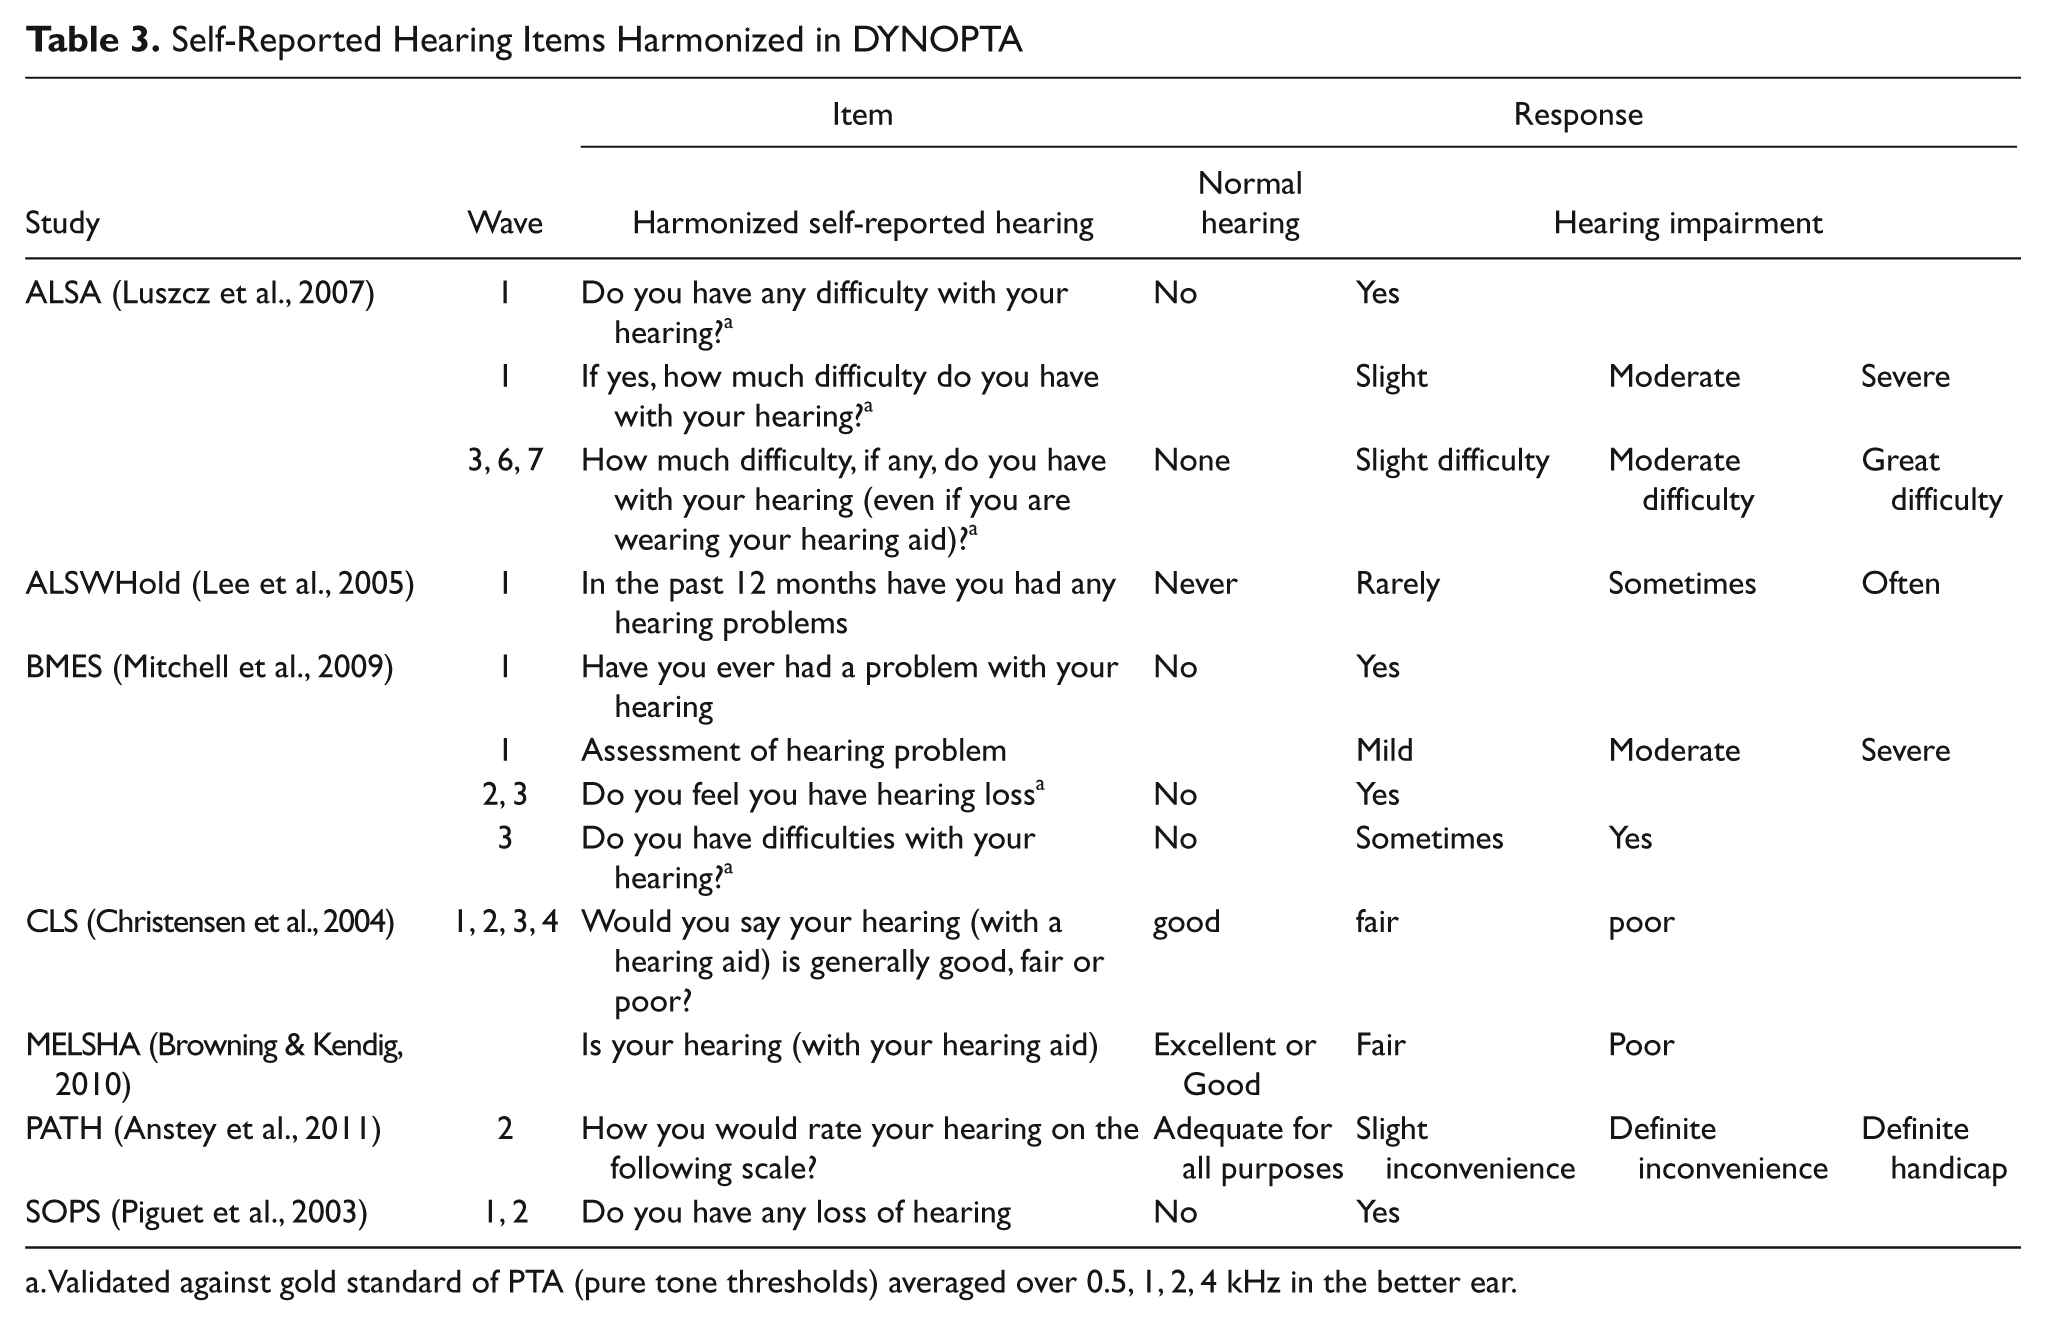
Validated against gold standard of PTA (pure tone thresholds) averaged over 0.5, 1, 2, 4 kHz in the better ear.
Analyses
Self-reported hearing measures were obtained concurrently with audiometric assessments in ALSA Waves 1, 3, 6, and 7 and BMES waves 2 and 3. Evaluation of self-reported hearing measures was made by investigating their association with audiometry within these samples and waves. First, the sample was classified according to the categories of the self-report measure, then the means and standard deviations for PTA0.5,1,2,4 kHz were calculated to enable calibration between subjective and objective measures. Second, polychoric correlations between the defined levels of impaired hearing thresholds (none, mild, moderate, severe) in the better ear and self-reported hearing were estimated using Mplus v5 (Muthen & Muthen, 2007). Finally, the discriminative properties of dichotomized measures were evaluated using receiver operator characteristic (ROC) curves, sensitivity, and specificity.
Baseline prevalence estimates for hearing loss were stratified by 5-year age groups and sex. Prevalence were estimated for pooled audiometric data from ALSA Wave 1 and BMES Wave 2, pooled dichotomized self-report data from ALSA Wave 1 and BMES Wave 2, and pooled dichotomized self-report data from all contributing studies. To examine how well self-reported hearing data could replicate findings based on analysis of PTA0.5,1,2,4 kHz in multivariate analyses, odds ratios (OR) were estimated from a logistic regression model testing the effects of age, sex, and age left school on audiometric measures of hearing loss and on dichotomized self-reported hearing loss. Results were compared between all studies, using Wave 1 from the ALSA, ALSWH, CLS, MELSHA, and SOPS samples, and Wave 2 from the BMES and PATH samples.
Results
Comparison of Self-Report and Audiometric Hearing Loss
The broader age range and inclusion of participants younger than 65 years meant that the overall average hearing thresholds were lower in the BMES sample (Mean [M] = 24.9 dB, Standard Deviation [SD] = 14.7) compared to the ALSA sample (M = 35.4 dB, SD = 16.1). Table 4 compares how well four dichotomized self-report items predicted hearing loss as measured by PTA0.5,1,2,4kHz within ALSA and BMES. Three of the self-report items were moderately associated with audiometric hearing loss. Their polychoric correlations ranged between 0.56 and 0.69, and area under the curve (AUC) ranged between 0.75 and 0.82. Furthermore, the average PTA0.5,1,2,4kHz was higher for respondents who reported some level of hearing loss or hearing difficulty compared to respondents who reported no hearing loss or no hearing difficulties (ALSA Wave 1: mean difference = 16.5 dB, t(1593) = 21.8, p < .01; ALSA Wave 3: mean difference = 13.0 dB, t(1387) = 17.3, p < .01; ALSA Wave 6: mean difference = 12.8 dB, t(490) = 11.5, p < .01; ALSA Wave 7: mean difference = 11.5dB, t(349) = 8.4, p < .01; BMES Wave 2: mean difference = 14.2 dB, t(1919) = 23.2, p < .01; BMES Wave 3: mean difference = 12.5 dB, t(1562) = 18.5, p < .01). However, one item from Wave 3 in BMES, “do you feel you have difficulties with your hearing?” with responses originally coded on a 3-point scale: yes, sometimes, no, showed poor discrimination between impaired and nonimpaired hearing as defined by PTA0.5,1,2,4 kHz > 25 dB HL. When recoded into dichotomous variable format where a response of either yes or sometimes indicated self-reported hearing loss, there was little difference in hearing thresholds between categories (mean difference = 0.3dB, t(1301) = 0.4, p = .72; polychoric correlation = .03; AUC = .51, standard error [SE] = .02). Subsequent regression analysis revealed that original responses for this question were not associated with PTA0.5,1,2,4 kHz (F (2, 1300) = 0.1, p = .90). This self-report item was not used in coding the harmonized self-reported hearing variable.
Hearing Thresholds (dB HL) for Levels of Self-Reported Hearing and Their Association

Do you have any difficulty with your hearing?
PTA: average pure tone thresholds (decibels hearing levels dB HL) from tone frequencies of 0.5, 1, 2, 4 kHz in the better ear.
How much difficulty, if any, do you have with your hearing (even if you are wearing your hearing aid)?
Do you feel you have hearing loss?
Do you have difficulties with your hearing?
ρ : Polychoric Correlations between self-reported hearing and defined levels of hearing impairment (none, mild, moderate, severe) based on PTA0.5,1,2,4 kHz in the better ear; AUC: Area Under the Curve, Receiver Operator Characteristic of self-reported hearing loss with PTA0.5,1,2,4 kHz (dB) in the better ear; Sens.: Sensitivity; Spec: Specificity; PPV: Positive predictive value; NPV: Negative predictive value.
There were between-study differences in the ratio of positive predictive value (PPV) relative to negative predictive value (NPV). In all ALSA waves, self-reported hearing loss had high PPV (Wave 1 = .90, Wave 3 = .88, Wave 6 = .90, Wave 7 = .92) and comparably lower NPV (Wave 1 = .51, Wave 3 = .45, Wave 6 = .37, Wave 7 = .38). In contrast, both BMES waves had lower PPV (Wave 2 = .61, Wave 3 = .59) and higher NPV (Wave 2 = .82, Wave 3 = .81). The ALSA item had higher specificity than sensitivity at all waves whereas the item used in BMES showed lower specificity than sensitivity at all waves. The difference between studies can largely be explained by their respective age distributions. To demonstrate this we compared PPV and NPV for an older age cohort (aged 70 years and older, n = 947) relative to a younger aged cohort (aged 69 years and younger, n = 974) in the Wave 2 sample of BMES. In the older age cohort, the PPV of 0.76 was higher than the NPV of 0.67. This was reversed in the younger age cohort where the PPV of 0.41 was smaller than the NPV of 0.93. This could be expected as audiometric hearing loss is less prevalent at younger ages, consequently a negative test result is more likely in the younger cohort whereas the probability of a positive test result increases with age.
Comparison of Prevalence Rates Based on Self-Report and Audiometric Hearing Loss
Figure 1 shows the prevalence hearing loss based on audiometric assessment and self-report. Within the pooled ALSA and BMES sample, overall prevalence rates derived from self-reported hearing loss was 56% (95% CI = [53, 58]) for men and 43% (95% CI = [41, 45]) for women, which only slightly underestimated true overall prevalence estimated from PTA0.5,1,2,4 kHz, of 59% (95% CI = [57, 61]) for men and 46% (95% CI = [44, 48]) for women. However, the age gradient for self-report items was not as steep as the age gradient for measured hearing impairment. The prevalence of self-reported hearing loss increased by only 4.1% for every 5-year increase in age. In contrast, prevalence of measured hearing impairment increased by 13.5% for every 5-year increase in age. Although prevalence rates based on self-reported items were reasonably accurate for adults aged between 65 and 74 years, prevalence based on self-report data greatly overestimated measured hearing loss prevalence for younger age groups but greatly underestimated prevalence rates for older age groups. For example, within the pooled ALSA and BMES sample 44% (95% CI = [35, 53]) of men aged between 55 and 59 reported some degree of hearing loss, whereas only 9% (95% CI = [4, 15]) of men in this age group had average PTA0.5,1,2,4 kHz greater than 25 dB HL in the better ear. In contrast, 69% (95% CI = [64, 75]) of men aged over 85 years reported some level of hearing difficulty, whereas 89% (95% CI = [85, 94]) of men in this age group had average PTA0.5,1,2,4 kHz greater than 25 dB HL in the better ear. A similar pattern was observed for women. Prevalence of hearing impairment based on self-report by women aged above 85 years was 63% (95% CI = [56, 69]) which was significantly less than prevalence of 87% (95% CI = [82, 9]) of women aged over 85 who had average PTA0.5,1,2,4 kHz greater than 25 dB HL in the better ear. A comparable age bias was observed for prevalence rates based on harmonized self-report items from baseline samples of all studies. This age bias is such that the self-reported items are insensitive to age effects and overestimate prevalence for younger ages whilst underestimating prevalence for older ages.
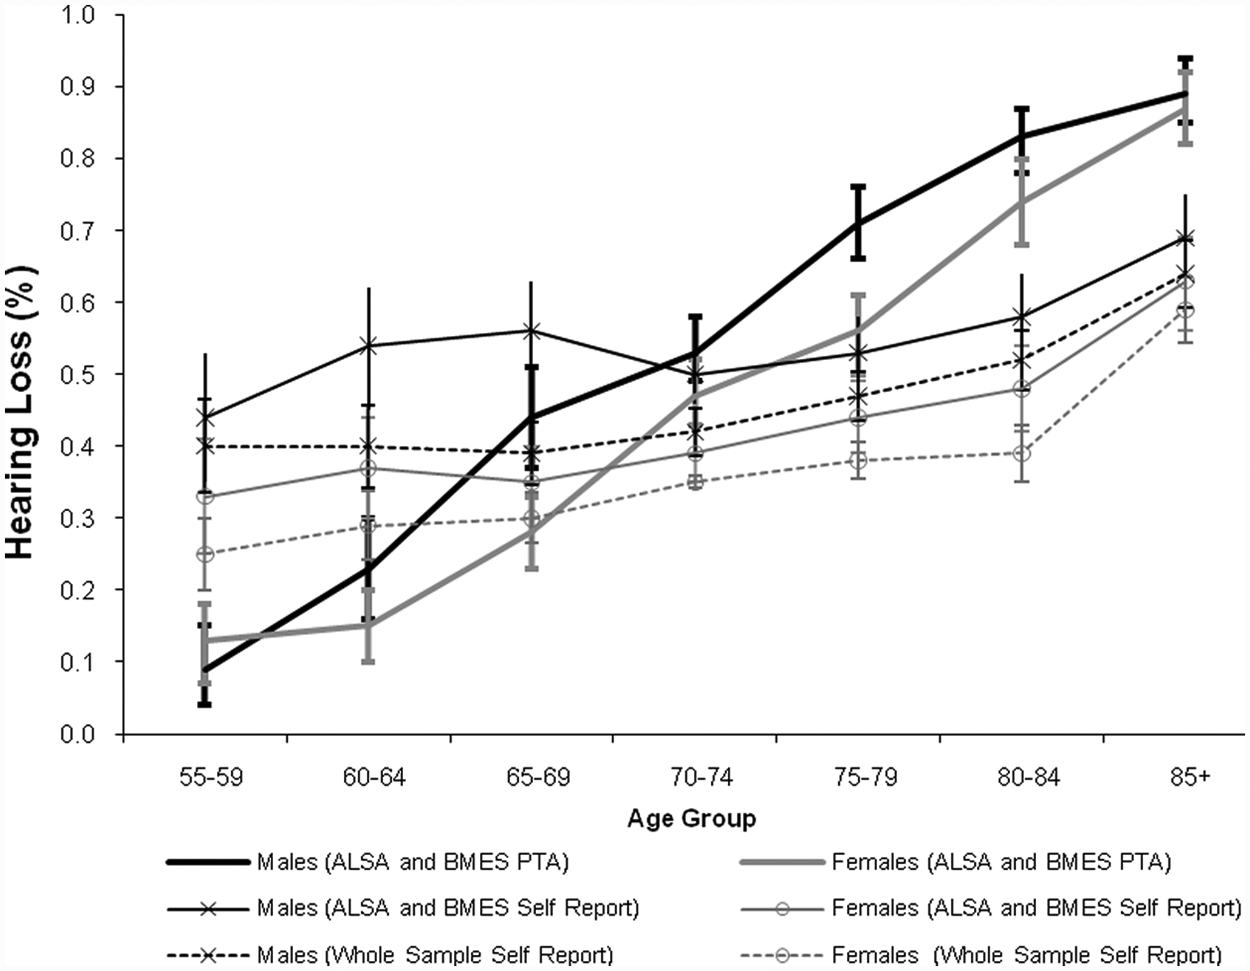
Comparison of prevalence (with 95% CI) of objective (PTA0.5,1,2,4 kHz) and subjective hearing loss by age group and sex at baseline
Comparison of Differentials of Hearing Loss Based on Self-Report and Audiometric Measures
To test how well use of a binary outcome measure of self-reported hearing loss replicated effects from a multivariate model where audiometric hearing impairment was the outcome, we compared age, sex, and education effects estimated from a logistic regression model of data from each individual study sample. When audiometric hearing loss was modeled as the outcome, there was little variability between studies with both ALSA and BMES showing that for every year lived respondents were 1.13 (95% CI = [1.11, 1.15]) times more likely to have hearing impairment. Men were 1.47 (95% CI = [1.17, 1.84]) times more likely to have hearing impairment in the ALSA sample, and 1.56 (95% CI = [1.26, 1.91]) times more likely to have hearing impairment in the BMES sample. Although participants who left school before the age of 15 were more likely to have audiometric hearing impairment in both studies, there were differences between these two samples in the magnitude of the OR with early school leavers in the ALSA sample 1.43 (95% CI = [1.14, 1.79]) times more likely to have hearing impairment. Although early school leavers in the BMES sample were 1.17 (95% CI = [0.93, 1.48]) times more likely to have hearing impairment, the OR was not reliably different from 1 (p = .18).
When a binary measure of self-reported hearing was modeled as outcome the OR for age was reduced relative to audiometric hearing loss and ranged between 0.98 (95% CI = [0.93, 1.04]) in the PATH study and 1.08 (95% CI = [1.03, 1.12]) in the SOPS study. The OR of 0.98 for the PATH study was in the opposite direction compared to other studies but was not reliably different from 1 (p = .51) and could be a result of the narrow-aged cohort for this sample (aged between 64 and 70).
The greater relative risk of self-reported hearing loss associated with men was also reasonably consistent between studies. ORs ranged from 1.51 (95% CI = [1.14, 1.99]) for the MELSHA study, to 1.97 (95% CI = [1.66, 2.34]) for the PATH study, and showed that men are more likely to experience hearing loss. In general the association between sex and hearing loss was stronger for self-report items in comparison with audiometric hearing impairment, and there was consistent overlap of confidence intervals for all studies.
The relative risk of self-reported hearing impairment associated with school-leaving age, was also incongruent between studies and with audiometric hearing loss. Within the baseline ALSA sample, participants who left school before the age of 15 were 1.43 times (95% CI = [1.14, 1.79]) more likely to have audiometric hearing loss, whereas there was no significant difference in the likelihood of reporting hearing difficulties for individuals who left school before the age of 15 compared to those who left school at the age of 15 or older (OR = 0.96, 95% CI = [0.80, 1.15], p = .69). A similar, although less divergent pattern was observed in BMES. Although not statistically significant, early school leavers in BMES were 1.17 times more likely to have audiometric hearing loss (95% CI = [0.92, 1.48]), whereas there was no difference in self-reported hearing loss between early or late school leavers (OR = 0.99, 95% CI = [0.79, 1.24]). Of the studies that only collected self-report hearing data, all ORs trended to be greater than 1 indicating that participants who left school before age 15 were more likely to report hearing difficulties, however these effects were statistically significant only for ALSWH (OR = 1.14, 95% CI = [1.05, 1.23]) and MELSHA (OR = 1.41, 95% CI = [1.07, 1.87]).
Discussion
This study aimed to report on the harmonization of dichotomized self-reported hearing loss items and evaluate them against audiometric hearing loss. We compared prevalence estimates derived from self-reported hearing measures with estimates derived from standardized audiometric data in the Australian population. Analyses showed that within the ALSA and BMES studies, a dichotomized measure of self-reported hearing loss appeared to be reasonably sensitive and displayed moderate associations with audiometric assessment. Self-report data, however, did not provide a reliable basis for estimating prevalence in the general population, and depending on the sample characteristics or question wording, had conflicting sensitivity and specificity. In particular, self-reported hearing appeared to overestimate hearing impairment (PTA0.5,1,2,4 kHz > 25 dB HL) in younger age cohorts whereas underestimating hearing impairment in older age cohorts. Although previous comparisons of self-report with audiometric measures have supported conclusions that self-report data may be sufficient for estimating overall prevalence of hearing loss, these studies only compared prevalence in broad age cohorts and failed to consider an age bias in self-reported health measures (Gates, Cooper, Kannel, & Miller, 1990; Nondahl et al., 1998). Indeed, in this study, the difference between self-report and audiometric-based prevalence for all adults aged 55 years and older was minimal.
Social comparison theory (Willis, 1981) provides one explanation for the failure of self-reported hearing to detect age differences. Social comparison theory maintains that older adults tend to overrate their perceived health because they make implicit downward comparisons with negative old-age stereotypes (Heckhausen & Brim, 1997; Sargent-Cox, Anstey, & Luszcz, 2008). The age bias inherent in self-reported hearing items could therefore reflect the downward social comparisons older adults are surmised to make when rating their health despite loss of functioning (Heckhausen & Brim, 1997). A similar explanation was given for the poorer performance of the HHIE in estimating prevalence in adults aged 65 years and older compared to adults aged between 48 and 64. Nondahl et al. (1998) suggested that older adults are more likely to be accepting of hearing impairment as they do not consider it an unusual aspect of ageing. The high prevalence and common experience leads to hearing loss becoming normalized in older adults. Furthermore, as hearing decline is generally a gradual process, many adults have time to adjust to hearing loss.
Younger age groups could overestimate their hearing difficulties for a number of reasons. First, they are more likely to be actively participating in the workforce and have greater work-related demands on their hearing. Certainly after the retirement age of 65, self-report data no longer overestimates audiometric hearing impairment. Also, hearing ability for pure-tone thresholds below 4kHz begin to decline in the 50s, and initial losses may be more noticeable at these ages (Wiley, Chappell, Carmichael, Nondahl, & Cruickshanks, 2008). Low levels of hearing aid utilization in younger age groups could also contribute to the differences between self-report and audiometric measures. It has been reported that adults may experience hearing difficulties for up to 10 years before they recognize their hearing to be a problem and access hearing services during their mid 70s (Davis, Smith, Ferguson, Stephens, & Gianopoulos, 2007). Finally, this could reflect a cohort effect whereby younger cohorts are more likely to report health problems and functional difficulties. It should not be discounted that the apparent overreporting to hearing loss is a real effect reflecting the poorer health status of younger cohorts. Seeman, Merkin, Crimmins and Karlamangla (2010) found significant increases in disability over a 16-year period in a cohort aged 60-69 years whereas those aged 70-79 years showed no significant changes in disability and those aged 80 years and above showed lower prevalence of functional limitations.
Hearing impairment was more likely to occur in men, older adults, and early school leavers regardless of whether hearing impairment was defined by pure-tone thresholds or self-report. However, when estimates were based on self-report items rather than audiometric measures, there were considerable differences in the strength of these associations and there was more variability between studies. In particular, self-reported hearing items were not sensitive to the relation between age left school and hearing impairment. Self-reported hearing items consistently underestimated the strength of the age-related risk of hearing impairment and tended to overestimate the association between sex and hearing impairment. It is possible that some of the discrepancy in findings related to the self-reported hearing impairment items was due to design difference in the contributing studies, including sample composition and age structure.
Of particular interest is the influence of the response scale on the reliability of self-reported hearing loss. Two almost identical questions: “do you have any difficulty with your hearing?” (Binary response: yes, no) and “do you have difficulties with your hearing” (three level: yes, sometimes, no) were shown to have conflicting associations with measured hearing loss. The latter item is of a similar form to the HHIE (Ventry & Weinstein, 1982), and was used as a screening question prior to implementing the HHIE. Binary responses and responses framed in reference to the grade of hearing difficulty (none, slight, moderate severe) were good predictors of measured hearing loss. In contrast, nonbinary responses framed in reference to the frequency or duration of hearing difficulty (yes, sometimes, no) was extremely poor predictors of measured hearing loss and not at all associated with audiometric assessment. This suggests such measures are not an adequate alternative to audiometric screening and that the context in which a question is asked may also influence response propensities.
Detailed, self-reported hearing loss could be useful in screening for hearing impairment, and in accounting for the multiple, independent, impacts now described for this sensory impairment (Gopinath et al., 2010; Gopinath, 2009b; Karpa et al., 2010; Mitchell et al., 2009; Schneider et al., 2010; Tay et al., 2006). Hickson et al. (1999) argue that objective and subjective measures may be tapping different disability profiles and that both are needed to select clients for rehabilitation. In their study, 15% of participants classified with normal hearing by audiometry reported hearing difficulty, whereas 17.5% of those with moderate or greater audiometric hearing loss reported no hearing difficulty. Our findings do not discount the efficacy of self-reported hearing in identifying disability due to hearing loss (Newman, Weinstein, Jacobson, & Hug, 1990). Perceived health is often reported to be a stronger predictor of quality of life and well-being than actual illness. Therefore, self-report items do have clinical utility and play a role in determining social burden of hearing loss.
There were study differences in self-reported hearing loss. Some items made specific reference to hearing ability with a hearing aid, whereas others did not explicitly distinguish between perceived hearing ability either with or without a hearing aid. There were qualitative differences in the nature of hearing loss (“problems,” “difficulty,” “loss,” “adequacy”), temporal reference frame (“ever,” “12 months,” “currently”) and response options (“binary” vs. rating scale of either the “frequency” of hearing problems or “severity” of hearing problems). This variation in self-report measures across studies is indicative of two different measures of hearing loss. Questions referring to “hearing loss” with a binary response are more likely to be perceived as directly asking about physical hearing loss; whereas questions referring to the frequency of hearing difficulties, or require a graded judgment concerning hearing-related problems, may lead the respondent to consider in what contexts and how regularly they experience difficulties due to hearing loss. A comparison of the base-line self-report item with subsequent waves within ALSA also revealed that, despite the sample becoming more homogonous with respect to age, reference to hearing aids reduced the association between self-report and audiometric data. Thus, consideration of hearing difficulties when using a hearing aid (if owned) is also more likely to elicit a response that reflects hearing disability.
The need to dichotomize responses to self-reported hearing loss items when creating harmonized measures resulted in information loss and reduced variability in the data. However, harmonization improves the comparability of data across studies, enabling future investigations into hearing disability using the pooled data set. Pooled analyses of the harmonized self-report variable will require careful interpretation and consideration of how study differences may influence findings.
In summary, our findings suggest that self-reported hearing measures are not sufficiently sensitive to be used to estimate prevalence or incidence of hearing impairment, particularly for adults of working age (below 65 years) and adults aged above 75 years. Instead, these measures may be useful as broad indicators of perceived hearing disability and when investigating impacts of hearing loss on health and well-being. Given the increase in prevalence of hearing impairment due to population aging, there is a need for epidemiological studies to combine both objective measures of hearing loss with measures that evaluate the impact of hearing loss on functioning and healthy aging.
Footnotes
Acknowledgements
The authors would like to thank Julie Byles, Mary A. Luszcz, and Olivier Piguet. They would like to thank the participants for volunteering their time to be involved in the respective studies. Details of all studies contributing data to DYNOPTA, including individual study leaders and funding sources, are available on the DYNOPTA website (![]() ).
).
The data on which this research is based were drawn from several Australian longitudinal studies including the following: the Australian Longitudinal Study of Ageing (ALSA), the Australian Longitudinal Study of Women’s Health (ALSWH), the Blue Mountain Eye Study (BMES), the Canberra Longitudinal Study of Ageing (CLS), the Melbourne Longitudinal Studies on Healthy Ageing (MELSHA), the Personality And Total Health Through Life Study (PATH), and the Sydney Older Persons Study (SOPS). These studies were pooled and harmonized for the Dynamic Analyses to Optimise Ageing (DYNOPTA) project. The findings and views reported in this article are those of the author(s) and not those of the original studies or their respective funding agencies.
The authors declared no potential conflicts of interest with respect to the research, authorship, and/or publication of this article.
This work was supported by the National Health and Medical Research Council (NHMRC) Grant # 410215. Professor Anstey is funded by NHMRC Fellowship #366756.