
Abstract
Although social engagement has been linked to a variety of health outcomes, such as better self-rated health (Nummela, Sulander, Rahkonen, Karisto, & Uutela, 2008) and longer survival (Kiely & Flacker, 2003), much of this research does not take into account stability and change over time (Bennett, 2002; Obisesan & Gillum, 2009). The life course perspective focuses on linked lives, with an emphasis on stability and change (Elder, Johnson, & Crosnoe, 2003), which lends itself to the idea that social engagement is not necessarily fixed across time. These patterns of change in social engagement may have important consequences for health, whereas static conceptions of social engagement may mask important variability in how social engagement relates to health outcomes. The present study examines trajectories of social engagement over time and how they affect mortality, which can provide important leverage in more fully understanding these relationships within a longitudinal context.
Social Integration Theory and Social Engagement
Social engagement in this study is regarded as a source of social integration that may influence health. Social integration at the individual level is defined by attachment to society through ties to social relationships (Fothergill et al., 2011). Although the operationalization of social integration is not always consistent in the literature, the main thread throughout this work is that social integration is beneficial to health (Pillemer, Moen, Wethington, & Glasgow, 2000). Social integration theory builds upon Durkheim’s (1897/1979) classic study of suicide showing that those lacking social ties were less attached to society and more likely to engage in individual pathology and deviant behavior from the norms and obligations of society. More recently, Cohen and Lemay (2007) furthered these ideas, suggesting that greater levels of social integration encouraged individuals to adhere to normative constraints encouraging healthy lifestyles. Berkman and colleagues also extended work on social integration and conceptualized a model of different pathways through which social integration could influence health, such as by shaping resources available, providing a sense of purpose, and increasing motivation and social pressure to engage in behaviors that benefit, rather than harm, health (Berkman, Glass, Brissette, & Seeman, 2000). Social relationships provide resources that may enhance the flow of health-related information and help individuals to more effectively utilize health care services (Cohen, 2004). Social attachments may serve as a buffer for adverse social conditions and stressful events (Schwerdtfeger & Friedrich-Mai, 2009; Wortman, 1984) as well as influence health through physiological pathways, such as through neuroendocrine reactivity and reduction of allostatic load (Seeman & McEwen, 1996).
Much research to date has defined the concept of social integration in terms of formal social roles, such as “mother” and “worker” (Hsu, 2007; Moen, Dempster-McClain, & Williams, 1989; Sieber, 1974; Verbrugge, Gruber-Baldini, & Fozard, 1996). Much of this research does not take into account social interactions that may occur outside of formal social roles or the frequency of interactions, which are both relevant for understanding the degree to which individuals are socially integrated. Social engagement is conceptualized in this study as frequency of participation in activities that involve interactions between or among people, capturing a broader array of social interactions and intensity of interaction that may contribute to greater social integration. Although some social roles may be embedded within these social activities (e.g., frequency of visiting with family members implies familial roles), the frequency of interaction in social activities is what is important for the present study.
It is important to situate social integration theory and social engagement in the context of the life course, which emphasizes the lifelong process of aging, stability and change in individuals’ lives, the interdependence of lives in shared relationships, individual embeddedness in time and place, and individual agency within the constraints of social circumstance (Elder et al., 2003). In the lifelong process of aging, individuals move into and out of social roles linking their lives to others in shared relationships, but older adults are more likely to lose than to replace or add formal social roles, such as losing the worker role at retirement (Evandrou & Glaser, 2004; Lee & Powers, 2002). Even though older adults may potentially lose more formal social roles, they often have the ability and agency to still participate in social activities that can link their lives to others, encouraging the formation of more social attachments. As their social attachments fluctuate as they age, these patterns of social relationships embedded in time may expose them to different levels of social integration across time, which may have differential or cumulative consequences for health. With the potential loss in formal social roles, the impact of participation in social activities may be particularly important for older adults.
The life course perspective’s emphasis on stability and change in individuals’ lives is encapsulated in research using trajectories. Trajectories are uniquely able to take into account patterns of stability and change of social phenomena over the life course. Within-person analysis of an individual’s trajectory of social engagement, for example, focuses on the social engagement embedded in a person’s past and whether that social engagement has changed over time. An individual’s pattern of social engagement over time may have important consequences for his or her mortality, yet there is a dearth of empirical research examining these relationships.
Social Engagement and Mortality
Social engagement may have important protective effects on mortality. Social isolation, which can be considered a lack of any social engagement, has been linked to higher rates of mortality, with socially isolated African American elderly women three times more likely to die than their nonsocially isolated counterparts (LaVeist, Sellers, Brown, & Nickerson, 1997). On the other end of the spectrum, stronger social networks have been linked to longer survival (Giles, Glonek, Luszcz, & Andrews, 2005). Aspects of social engagement, such as organizational attendance (Sugisawa, Liange, & Liu, 1994) and religious participation (Lutgendorf, Russell, Ullrich, Harris, & Wallace, 2004), have been associated with lower mortality. Similarly, older adults in Israel had lower mortality rates if they engaged in group leisure activities (Walter-Ginzburg, Blumstein, Chetrit, & Modan, 2002) or if they had more contact with friends (Litwin, 2003). Volunteering, another aspect of social engagement, has been linked to lower risk of hypertension (Burr, Tavares, & Mutchler, 2011) and mortality (Musick, Herzog, & House, 1999). Those who had more contact with friends and relatives, belonged to a church, and belonged to other formal and informal groups were less likely to die over a study period of 9 years (Berkman & Syme, 1979). Using a similar index to Berkman and Syme’s (1979) Social Network Index, Obisesan and Gillum (2009) found that low scores on their index involving marital status, contact with friends and relatives, religious attendance, and voluntary association membership, were associated with a higher risk of dying. Participation in social and productive activities had salutary effects on mortality over a study period of 6 years (Menec, 2003). Low social engagement in the form of an additive scale of 20 items (including both social and solitary activities) was a significant precursor of mortality after 8 years (Bennett, 2002). Participation in more social activities was an independent predictor of survival, even beyond participation in productive activities and fitness activities (Glass, Mendes de Leon, Marottoli, & Berkman, 1999). Greater social engagement has been associated with lower risk for mortality among British men (Ramsay et al., 2008) and French employees (Berkman et al., 2004). For nursing home residents, those with higher levels of social engagement (defined by ease of interaction in various group activities) had reduced odds of dying (Kiely & Flacker, 2003; Kiely, Simon, Jones, & Morris, 2000).
Less empirical research has examined the effects of patterns of change in social integration on mortality. One of the few studies to address this examined respondents’ levels of social ties at two time points to predict mortality (Cerhan & Wallace, 1997). These authors found that among rural elders, those who had low levels of social ties at both time points had an increased risk of mortality while those who had an increase in levels of social ties from low to high had similar mortality risk to those who had stably high social tie levels. Among the Danish elderly, women with consistently low amounts of contact with family and friends or a decline in the frequency of contact over the two time points had higher odds of dying over 4 years than those with consistently high levels of contact (Lund, Modvig, Due, & Holstein, 2000). Male health professionals who were socially isolated had higher mortality rates due to accidents, suicide, and noncancer and noncardiovascular causes, while an increase in social ties over the two time points of the study had protective effects on mortality (Eng, Rimm, Fitzmaurice, & Kawachi, 2002).
Although these studies are an important initial step in studying changes in social integration over time and how these patterns affect mortality, these studies largely construct ad hoc categories reflecting changes in social relations based only on two time points. It is important to incorporate three or more times of measurement to better assess patterns of change (George, 2009). Furthermore, ad hoc classification has several disadvantages to empirically derived trajectories because ad hoc classification cannot be statistically verified, may fail to identify rare but real patterns, and cannot measure the precision with which individuals are classified (Nagin & Tremblay, 2005). Trajectories in the present study are empirically derived via growth mixture modeling using four waves of nationally representative panel data. These trajectories reflect intraindividual patterns of change in social engagement over time.
Previous studies illustrate the importance of examining patterns of change in social integration and suggest their potentially protective effect on mortality. Based on this evidence and social integration theory within a life course framework, this study hypothesizes that those who maintain high levels of social engagement or increase in social engagement over time will have lower risk for mortality than those with low and decreasing social engagement.
Method
Data
Data come from the Americans’ Changing Lives (ACL) survey housed at the University of Michigan’s Institute for Social Research and funded by the National Institute on Aging (House, 2007). This nationally representative panel study collected data in 1986, 1989, 1994, and 2002. Wave 1 (N = 3,617) used a multistage stratified area probability sample of the continental United States’ household population aged 25 and older, with an oversampling of African Americans and adults aged 60 and older. The current analysis focuses on adults aged 60 and older (N = 1,667 in Wave 1).
Measures
Mortality
The National Death Index provided information on the mortality of respondents in the Americans’ Changing Lives survey from 1986 until 2005. In almost every case, deaths were verified with death certificates. Time to death is measured in years. There were 1,138 deaths (68% of the sample) among adults aged 60 and older during this time period.
Social engagement
The latent variable social engagement is measured with five observed variables indicating frequency of involvement in several social activities: (a) “In a typical week, about how many times do you talk on the telephone with friends, neighbors, or relatives?” (b) “How often do you get together with friends, neighbors, or relatives and do things like go out together or visit in each other’s homes?” (c) “How often do you attend meetings or programs of groups, clubs, or organizations?” (d) “How often do you usually attend religious services?” and (e) about how many hours were spent on volunteer work during the last 12 months. Response categories for volunteering were 0 = did not volunteer, 1 = less than 20 hr, 2 = 20 to 39 hr, 3 = 40 to 79 hr, 4 = 80 to 159 hr, 5 = 160 hr or more. Response categories for frequency of talking on the phone with friends/family were 0 = never, 1 = less than once a week, 2 = about once a week, 3 = 2 or 3 times a week, 4 = once a day, 5 = more than once a day. Response categories for the other indicators were 0 = never, 1 = less than once a month, 2 = about once a month, 3 = two or three times a month, 4 = once a week, and 5 = more than once a week. Each of these observed variable items is weighted based on its loading on the latent variable of social engagement, and this continuous latent variable ranges from 0 to 5. The trajectories of social engagement are based on changes in respondents’ levels of social engagement across time. The derivation of these trajectories is described in greater detail in the analytic strategy section below.
Control variables
This study controls for sociodemographic characteristics, health conditions, and health behaviors. Sociodemographic characteristics include age (in years), race (1 = White, 0 = non-White), sex (1 = female, 0 = male), marital status (1 = currently married, 0 = not currently married), employment status (1 = currently employed, 0 = not currently employed), family income (10 income categories, ranging from US$2,500 to US$110,000), and education (continuous measure of highest grade completed). Marital status, employment status, and income are time-varying covariates.
All of the health behavior and health condition variables included are time varying. Cigarette smoking contains three categories: never smoked, former smoker, and current smoker. Alcohol Consumption is a three-category variable based on the number of alcoholic drinks consumed per month: nondrinkers (zero drinks consumed in the past month), moderate drinkers (1 to 79 drinks in the past month), and heavy drinkers (80 or more drinks in the past month). Body mass index (BMI) is weight in kilograms divided by height in meters squared (both self-reported). Established cut-points in the distribution of BMI generated the following categories: underweight (BMI less than or equal to 18.5), average weight (18.6 to 24.9), overweight (25 to 29.9), and obese (30 or higher). Three categories comprise self-rated health: excellent or very good, good, and fair or poor. The inclusion and coding of the preceding variables is consistent with Lantz, Golberstein, House, and Morenoff’s (2010) study on mortality using ACL data. The inclusion of number of chronic conditions appears in several mortality studies (e.g., Hsu, 2007; LaVeist et al., 1997), and in this study can range from 0 to 9, and includes the following conditions: arthritis, lung disease, hypertension, heart attack, diabetes, cancer, stroke, broken bones, and urination beyond control. The health limitations variable comes from a question asking, “How much are your activities limited by health?” (0 = not at all, 1 = a little, 2 = some, 3 = quite a bit, and 4 = a great deal). Two physical activity variables were included, which asked how often respondents engaged in active sports/exercise and how often respondents took walks (0 = never, 1 = rarely, 2 = sometimes, 3 = often).
Analytic Strategy
This study uses growth mixture modeling (GMM) to estimate trajectory classes of social engagement over time. Class membership in the social engagement trajectories derived from the GMM analysis are then used as a set of dummy variables in Cox proportional hazards models to examine the relationship between membership in these social engagement trajectory classes and mortality. Analyses were conducted using Mplus (Muthén & Muthén, 2007) and Stata.
Growth mixture models are instances of finite mixture models useful for modeling data that are suspected to contain multiple subgroups or that have unknown distributional shapes (Everitt, 1996; McLachlan & Peel, 2000). These models began to be applied in the social sciences with Heckman and Singer’s (1984) article on mixtures of hazard regressions, were developed and extended over the years (Nagin, 2005; Nagin & Land, 1993), and are now applied to study many types of trajectories (George, 2009). Conventional latent growth curve models estimate a mean growth curve, describing an overall pattern of change in a single population (Muthén & Muthén, 2000). The intercept (initial level) and slope (growth rate over time) are latent factors comprising the model and are allowed to vary across individuals. GMM relaxes the conventional growth curve modeling assumption of a single population and describes longitudinal change in unobserved subgroups using latent trajectory classes (Ram & Grimm, 2009). Similar to latent class growth analysis (LCGA), growth mixture models estimate mean growth curves for each class rather than one average trajectory (Muthén, 2004). The following equations are for a linear growth mixture model with K latent trajectory classes, where in Class k (k = 1, 2, . . . , K):


Equation 1 represents within-individual change over time. Equations 2a and 2b represent between-individual change over time. The outcome variable (i.e., social engagement) is yit, η0 is the intercept, η1 is the slope, t is the time point, and w is the covariate. The subscript i indicates that the parameter varies across individuals. The αk parameters vary across classes to capture different types of trajectories. The γk parameters allow the influence of the covariates on the growth factors to vary across class (Muthén, 2002). Residuals are represented by ϵit, ζ0i, and ζ1i Typically linear time scores are estimated with scores of 0, 1, 2, 3 for four waves. Due to the unequal spacing between waves in the ACL, the time scores reflect the number of years since Wave 1 (with the Wave 1 time score equal to zero).
Several fit indices were used to determine the number of class trajectories in the growth mixture models. Models were iteratively tested with increasing numbers of classes, and models with linear and quadratic slopes were tested. Muthén (2004) argues that it is important to take covariates into account when determining the number of classes in growth mixture modeling. Thus, age, sex, race, marital status, employment status, income, and education were included in the modeling process determining the number of trajectory classes (though unconditional baseline models [without covariates] were estimated for comparison purposes and had larger information criteria values). Preferred models had smaller Bayesian Information Criteria (BIC), sample-size adjusted BIC, and Akaike Information Criteria (AIC) values and a significant Lo, Mendell, and Rubin (2001) likelihood ratio test (LMR-LRT) statistic (Jung & Wickrama, 2008). A significant p value for the LMR-LRT statistic indicates a solution with C-1 classes is not sufficient and should be rejected in favor of C classes (Ram & Grimm, 2009).
This study uses full information maximum likelihood (FIML) to handle missing data when deriving the social engagement trajectories in Mplus. FIML is a theory-based approach to missing data that incorporates all respondents in the data regardless of whether they participated in every wave of the survey or responded to every item (Wothke, 2000). FIML has been shown to be less biased and more efficient than other ways of handling missing data, such as listwise deletion, pairwise deletion, or mean substitution (Schafer & Graham, 2002; Schlomer, Bauman, & Card, 2010; Wothke, 2000). FIML often produces biases equivalent to multiple imputation methods (Collins, Schafer, & Kam, 2001). Listwise deletion was used for the Cox proportional hazards models in Stata; however, ancillary analyses using multiple imputation following Royston’s approach yielded the same patterns of results.
Once the social engagement trajectory classes were derived from the growth mixture models, the classes were coded into a series of dummy variables to examine the relationship between the patterns of social engagement over time and mortality using Cox proportional hazards models, which are semiparametric models that do not assume a specific hazard function. Tests confirmed that the proportionality assumption held. Although GMM allows for individual variation around each of the growth curves (Muthén & Muthén, 2000), individuals were then assigned to their best fitting trajectory class as a fixed variable, which eliminates that variation when they were coded as dummy variables for the Cox proportional hazards models. The data were expanded into person-years, with an analytic sample of 18,570 person-years.
Results
Table 1 displays the descriptive statistics of key variables. At baseline, the mean age of respondents was 70 years, and respondents averaged 10.3 years of education and US$17,500 of income. A majority of respondents were women (67.1%) and White (68.5%), a little more than half were married, and around 22% were employed. Forty-four percent of respondents rated their health as “excellent” or “very good,” 25% as “good,” and 31% as “fair” or “poor,” and respondents had an average of 1.7 chronic conditions at baseline. On average, respondents experienced a little bit of limitation in their activities due to their health. About 3% of respondents were underweight, 41% were average weight, 37% were overweight, and 18% were obese. Approximately half of respondents had never smoked cigarettes, 30% were former smokers, and 20% were current smokers. About 64% of respondents did not consume any alcoholic drinks in the past month, 34% were moderate drinkers, and 2% were heavy drinkers at baseline. On average, respondents rarely or sometimes engaged in active sports or exercise and sometimes took walks.
Descriptive Statistics (Means or Percentages)

Figure 1 displays the social engagement trajectory classes. A five-class linear solution for trajectories of social engagement fit the data best in the growth mixture models. This model had smaller information criteria values (AIC, BIC, sample-size adjusted BIC) relative to other class solutions and a significant Lo, Mendell, and Rubin (2001) likelihood ratio test statistic. The model had high entropy at 0.92, indicating a clear delineation of classes with little overlap (Celeux & Soromenho, 1996). Trajectory Class 1 (59.7% of the sample, N = 996) was characterized by high levels of social engagement with a slight decrease over time. Trajectory Class 2 (10.6% of the sample, N = 176) was also characterized by high initial levels of social engagement, but decreased more than the Class 1 trajectory over time. Approximately 13% of the sample (N = 222) belonged to the Class 3 trajectory, which was characterized by high levels of social engagement that increased slightly over time. About 7% of the sample (N = 112) comprised trajectory Class 4, which had medium levels of social engagement that increased over time. Finally, trajectory Class 5 was characterized by relatively low and decreasing levels of social engagement over time, with 9.7% belonging to this class (N = 161).
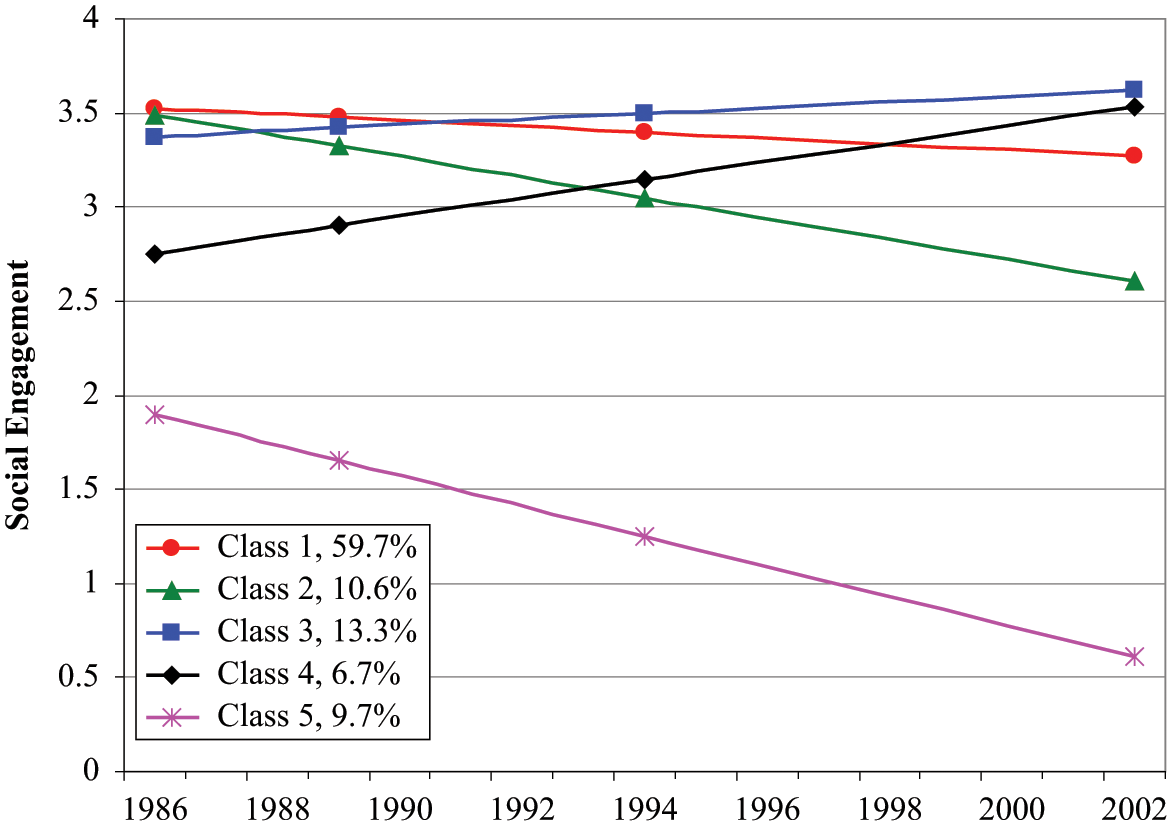
Estimated means for trajectory classes of social engagement
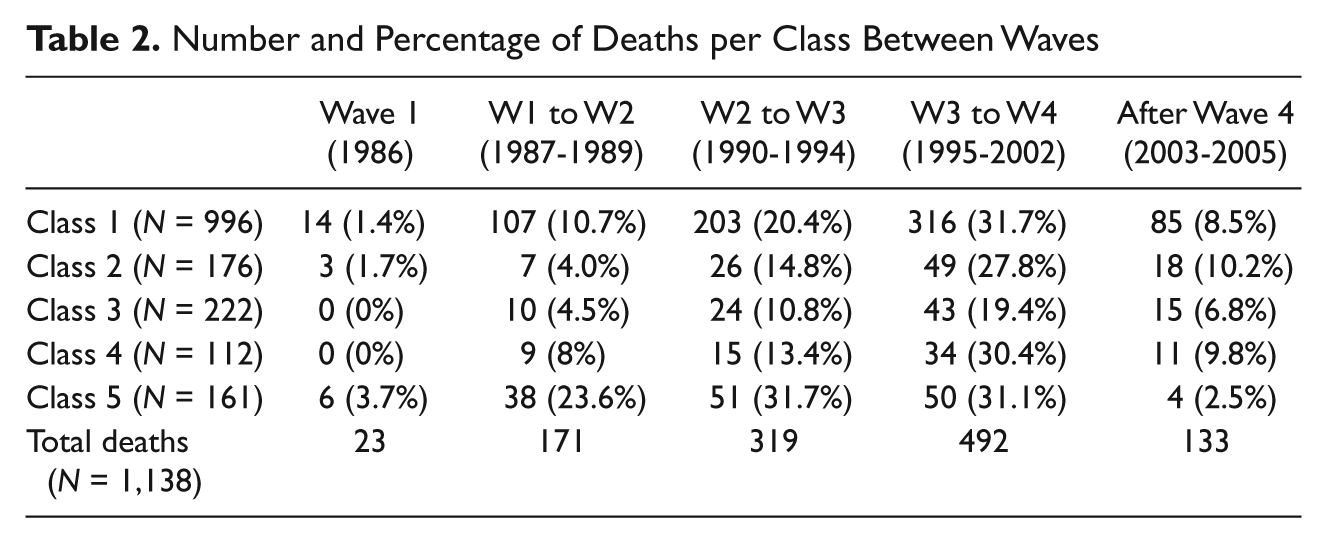
Next, the relationship between patterns of social engagement and mortality was tested. Table 2 provides information on the number and percentage of deaths within each social engagement trajectory class between each wave.
Number and Percentage of Deaths per Class Between Waves
The social engagement trajectory classes were used as dummy variables in Cox proportional hazards models to examine the relationship between patterns of social engagement and mortality (shown in Table 3). Class 5 (low-decreasing social engagement) was the reference category. In the unadjusted model with only the social engagement trajectories (Model 1), any level of social engagement was related to significantly lower risk of dying than belonging to the low-decreasing social engagement trajectory. Those belonging to Class 3 (high-slightly increasing social engagement) had the lowest hazard ratio of mortality out of all the social engagement trajectory classes.
Hazard Ratios for the Relationship Between Social Engagement (SE) Trajectory Class Membership and Mortality

Note: Class 5 (low-decreasing social engagement) is the reference group for the class membership variables.
95% confidence intervals in brackets
p < .05. **p< .01. ***p < .001.
Model 2 adjusted for sociodemographic variables. Class 1 (high-slightly decreasing social engagement) and Class 3 (high-slightly increasing social engagement) remained significantly related to lower mortality. The addition of sociodemographic variables rendered Class 2 (high-moderately decreasing social engagement) and Class 4 (medium-increasing social engagement) nonsignificant, however. Younger people, women, and those who were married or who were employed had lower odds of dying. Models 3 and 4 added health conditions and health behaviors separately to the sociodemographic model. In both cases, Class 3 (high-slightly increasing social engagement) was the only social engagement trajectory class to remain significantly related to mortality.
Model 5 contained the full model of all of the sociodemographic, health condition, and health behavior variables. Again, Class 3 remained significant, with those belonging to this high-slightly increasing trajectory of social engagement about 37% less likely to die than those belonging to the low-decreasing trajectory of social engagement (Class 5). Women, younger people, and Whites had significantly lower hazard ratios for mortality. Those who had more chronic conditions, poor self-rated health (compared with excellent/very good health), and more health limitations reducing their activities had significantly higher risk of mortality. Compared with those who had average BMI, those who were underweight experienced significantly higher hazard ratios for mortality while those who were overweight or obese experienced significantly lower hazard ratios. Compared with those who had never smoked cigarettes, both current smokers and former smokers had higher risk of dying, though the odds of dying were higher for current smokers. Nondrinkers had a significantly higher risk of mortality than those who moderately consumed alcohol, and those who participated in active sports/exercise or took walks more often had lower risk of mortality. In supplementary analyses, all models were tested among only those who were employed, with similar results.
Discussion
The present study uses social integration theory within a life course framework to examine the relationship between patterns of change in social engagement and mortality. This study suggests that social engagement may be an important source of social integration for older adults that can benefit health. In the unadjusted model, membership in each of the social engagement trajectory classes was associated with reduced risk of mortality compared with membership in the low-decreasing social engagement trajectory class, as social integration theory would suggest; however, controlling for (mostly time-varying) sociodemographic, health behavior, and health condition variables mediated the impact of most of the social engagement trajectories. Membership in the high, slightly increasing social engagement trajectory class, however, remained significantly related to lower mortality even controlling for these important variables. This suggests that social integration through social engagement can be important for mortality risk; however, this protection may depend on maintaining high levels of social engagement over time.
With mortality as the outcome, reverse causality for social engagement and mortality is not an issue in the traditional sense. Poor health, however, could have a causal effect on both patterns of social engagement and mortality. Consequently, the fact that the pattern of high, slightly increasing social engagement remained a robust significant predictor of mortality even with measures of health status and health behaviors controlled is especially important and provides strong evidence for the benefits of social engagement for mortality risk.
This study contributes to the literature on social integration and health in several ways. Situating social integration theory within the life course framework can provide important insights into its relationship with health. The life course perspective emphasizes stability and change in individuals’ lives as they age and the interdependence of lives in shared relationships (Elder & Shanahan, 2005; George, 1993). The linking of lives through social attachments is important for health (House, Landis, & Umberson, 1988), but these social attachments are not fixed across time. Static conceptions of social integration can mask our understanding of its connections with health. Most studies on social integration and mortality, however, do not take into account the dynamic nature of social integration over time.
The few studies that do incorporate patterns of change in social attachments into mortality analyses typically only use two time points (Cerhan & Wallace, 1997; Lund et al., 2000), which can limit the ability to assess patterns of change over time (George, 2009). Furthermore, these studies typically construct ad hoc trajectories, which have several limitations such as the inability to statistically verify the trajectories, to identify rare but real patterns, or to measure the precision with which individuals are classified, all of which can be done with empirically derived trajectories (Nagin & Tremblay, 2005).
The conceptualization and measurement of social engagement provides further contribution to the literature by incorporating frequency of participation in a broader array of social interactions than often used in research employing social integration theory. Focusing solely on formal social roles, as is common in much literature on social integration (e.g., Moen, Dempster-McClain, & Williams, 1992; Verbrugge, 1983), may neglect important sources of social interactions that can provide social attachments that may benefit health. This may be especially important in the context of the loss of formal social roles that often occurs as adults age (Evandrou & Glaser, 2004; Lee & Powers, 2002). This study’s measurement of social engagement further improves on past research by using a latent variable approach that reduces measurement error rather than a summed index (e.g., Obisesan & Gillum, 2009).
This study has several limitations, however. First, the social engagement indicators did not take into account the quality of the social interactions involved. It is likely that negative experiences while participating in social engagement activities affect health differently than positive experiences (August, Rook, & Newsom, 2007). It is important for future research to explore this. Selective survival is another limitation. The members of this sample have already survived until at least age 60 at the beginning of the survey, and selection due to survival could be a source of bias. Another limitation in this study is that by coding the social engagement trajectory classes as dummy variables for the survival analysis, this treats social engagement trajectory class membership as a fixed variable, which ignores the interindividual heterogeneity around each trajectory class of social engagement derived from the growth mixture modeling. The coding of dummy variables from trajectory classes derived from growth mixture modeling to use as predictors in a semiparametric model is a newer approach, so future research could provide validation or improvements to this method.
Despite these limitations, this study provides important information about the relationship between social engagement and mortality. This study provides support for social integration theory within a life course framework emphasizing patterns of stability and change in social engagement. The use of trajectories and the life course perspective enriches this study by incorporating a more dynamic, longitudinal analysis. A trajectory of high, slightly increasing social engagement over time is related to lower mortality, even after adjusting for sociodemographic variables, health conditions, and health behaviors. These findings indicate the importance of maintaining high levels of social engagement over time. The links between social engagement and better health outcomes highlight the benefits of older adults’ participation in broader social activities. The results of this study, combined with the life course perspective’s emphasis on individual agency within the constraints of social circumstance (Elder et al., 2003), could encourage older adults to maintain high levels of social engagement over time as one of several ways to reduce their risk of mortality.
Footnotes
Acknowledgements
The author is very grateful to Linda K. George, Kenneth C. Land, Nan Lin, Angela O’Rand, Deborah T. Gold, and Chongming Yang for valuable guidance and suggestions.
The author declared no potential conflicts of interest with respect to the research, authorship, and/or publication of this article.
The author disclosed receipt of the following financial support for the research, authorship, and/or publication of this article: This researcher has received support from the grant, 5 T32 HD007081, Training Program in Population Studies, awarded to the Population Research Center at The University of Texas at Austin by the Eunice Kennedy Shriver National Institute of Child Health and Human Development. She was also supported by the Philip Jackson Baugh Fellowship for research on aging at Duke University while completing this study.