




Abstract
Introduction
Hearing impairment (HI) is highly prevalent in older adults (F. R. Lin, 2012; F. R. Lin, Thorpe, Gordon-Salant, & Ferrucci, 2011), and is independently associated with social isolation, depression, poor quality of life, and accelerated decline in cognitive functioning (Dalton et al., 2003; Li et al., 2014; F. R. Lin, Ferrucci, et al., 2011; Weinstein & Ventry, 1982). There has been an increasing understanding that HI may be associated with impaired physical functioning in older adults (Chen, Genther, Betz, & Lin, 2014; Genther, Frick, Chen, Betz, & Lin, 2013; Gispen, Chen, Genther, & Lin, 2014; F. R. Lin, Metter, et al., 2011; F. R. Lin et al., 2013). Previous studies have explored several mechanistic pathways that could potentially mediate the association between HI and decline in physical functioning, which include increased cognitive load and shared attention in individuals with HI from constantly processing degraded signals, social isolation and loneliness from communicative impairment, and reduced awareness of auditory environment (Chen et al., 2014; Coppin et al., 2006; Perissinotto, Stijacic Cenzer, & Covinsky, 2012; Tun, McCoy, & Wingfield, 2009). However, epidemiologic studies investigating the association of HI with functional outcomes in older adults have been inconsistent at times with some studies demonstrating positive associations (Bess, Lichtenstein, Logan, Burger, & Nelson, 1989; Chia et al., 2007; Dargent-Molina, Hays, & Breart, 1996; Gopinath et al., 2012; Keller, Morton, Thomas, & Potter, 1999; Lopez-Torres Hidalgo et al., 2009; Reuben, Mui, Damesyn, Moore, & Greendale, 1999; Strawbridge, Wallhagen, Shema, & Kaplan, 2000; Viljanen et al., 2009) and others demonstrating no association (Laforge, Spector, & Sternberg, 1992; M. Y. Lin et al., 2004; Rudberg, Furner, Dunn, & Cassel, 1993). These inconsistencies may be explained in part by differences in how HI has been measured across studies. While some studies have used audiometric measures of hearing (Bess et al., 1989; Chia et al., 2007; Gopinath et al., 2012; M. Y. Lin et al., 2004; Viljanen et al., 2009), others have relied on self-reported measures of hearing (Dargent-Molina et al., 1996; Laforge et al., 1992; Lopez-Torres Hidalgo et al., 2009; Reuben et al., 1999; Rudberg et al., 1993; Strawbridge et al., 2000). However, the agreement between self-reported assessments of hearing and gold-standard audiometric assessments varies substantively by demographic factors such as age, sex, race, and education. For example, older adults tend to underestimate their HI, and the agreement rates were relatively lower among older women, Blacks, and Hispanics compared with their respective younger age groups (Kamil, Genther, & Lin, 2015; Kiely, Gopinath, Mitchell, Browning, & Anstey, 2012; Sindhusake et al., 2001; Valete-Rosalino & Rozenfeld, 2005). The agreement rate between two different measures of hearing is also likely affected by other environmental and personal factors (e.g., personality, lifestyle, interactions with family members, etc.). However, whether these factors are substantial enough to result in different levels of associations in epidemiologic studies with functional outcomes in older adults is unknown. The aim of this study is to investigate whether associations of HI with functional outcomes differ when using self-reported versus audiometric measures of hearing in a nationally representative cohort of older adults in the United States.
Method
Study Population
Our analytic cohort was composed of 1,669 individuals participating in the National Health and Nutrition Examination Survey (NHANES) who were 70 years of age or older and who had complete data on both self-reported hearing and audiometric testing. NHANES is an ongoing program of studies designed to assess the health, function, and nutritional status of the non-institutionalized, civilian U.S. population. Each of the sequential, cross-sectional study cycles in NHANES uses a stratified, multistage probability sampling design to survey a sample of the U.S. population with selective oversampling of low-income individuals, racial minorities, and older adults. Sampling weights allow for analyses that account for the complex survey design and yield results that are generalizable to the U.S. population. Hearing was measured using self-reports in 1,994 adults aged 70 years and older in two NHANES cycles, 2005-2006 and 2009-2010, and of these, 1,669 (84%) had hearing measured using pure-tone audiometry. Those without audiometric measurement of hearing were more likely to be older, female, non-White, less educated, have lower income, and never smokers. Their characteristics did not differ across history of comorbidities including hypertension, diabetes, stroke, cardiovascular diseases, or hearing aid use.
Audiometric Assessment
Audiometric assessment was performed by a trained examiner according to established NHANES protocols (McClay, Booth, Parry, Johnson, & Roland, 2008). A trained examiner determined the air conduction hearing threshold for each ear without hearing aid in a sound-isolated room in the mobile examination center. Testing was conducted according to a modified Hughson Westlake procedure using the automated testing mode of the audiometer (Model AD 226; Interacoustics, Assens, Denmark). Quality assurance and control were established through daily calibration of equipment and monitoring of ambient noise levels using a sound level meter. Thresholds were measured twice at 1 kHz in each ear as an additional quality measure, and audiometry was repeated if there was a greater than 10-dB discrepancy between the threshold measurements. HI was defined as a speech-frequency pure-tone average of thresholds at 0.5, 1, 2, and 4 kHz in the better hearing ear as defined by the World Health Organization (Sennaroglu & Saatci, 2002). Severity of HI was categorized into ordinal and binary variables in our analyses based on the American Speech-Language Hearing Association guidelines (Clark, 1981) to allow for a comparison with the self-reported hearing (analyses using an ordinal indicator of audiometric hearing: “normal hearing” ≤ 25 dB, “mild HI” = 25.0-39.9 dB, and “moderate-or-greater HI” ≥ 40.0 dB—individuals with moderate or greater HI were collapsed together to account for the small number of individuals with severe-to-profound HI, n = 104; analyses using a binary indicator of audiometric hearing: “normal hearing” < 25 dB and “any HI” ≥ 25 dB).
Self-Reported Hearing Assessment
Self-reported hearing was assessed by the interviewer using the Computer-Assisted Personal Interviewing (CAPI) system. Respondents were asked, “Which statement best describes your hearing (without a hearing aid)? Would you say your hearing is excellent, good, that you have a little trouble, moderate trouble, a lot of trouble, or are you deaf?” A priori, self-reported measure of hearing was categorized into ordinal variables comparable with the severity categories of audiometric hearing (“excellent or good hearing,” “a little to moderate trouble hearing,” and “moderate-or-greater trouble hearing”). Self-reported hearing was categorized into binary variables for additional comparison with the audiometric hearing, which were defined using relatively ubiquitous cutoffs for both audiometric and self-reported hearing (“excellent or good hearing” and “any trouble hearing”).
Objective Outcomes: Physical Activity and Hospitalization
As defined previously (Bamiou, Worth, Phelps, Sirimanna, & Rajput, 2001), physical activity was measured using accelerometers in the 2005-2006 NHANES cycle (AM-7164; ActiGraph, Fort Walton Beach, Florida). Participants who were physically able to walk were asked to wear accelerometers for 7 days (Gispen et al., 2014). Moderate activity was defined according to previously established thresholds of 2,020 intensity counts or more per minute, and vigorous activity was defined as 5,999 intensity counts or more per minute (Metzger et al., 2008; Troiano et al., 2008; Tucker, Welk, & Beyler, 2011). A minute of vigorous activity was counted as 2 minutes of moderate physical activity (MPA), and the final variable of physical activity was calculated by counting weekly minutes of MPA per participant. Accelerometer-measured physical activity was collapsed into three levels based on the Physical Activity Guidelines for Americans (U.S. Department of Health and Human Services, n.d.): “inactive,” 0 min/week of MPA; “active,” <150 min/week of MPA; and “sufficiently active,” ≥150 min/week of MPA.
Prior hospitalization was determined from interviews. Respondents were asked whether they had stayed in any hospital overnight or longer during the past 12 months (“yes” or “no”). Respondents were further questioned how many different times they had stayed in hospital during the past 12 months. The number of hospitalizations was categorized into “0,” “1,” and “>1.”
Subjective Outcomes: Self-Reported Healthy Days and Difficulties in Physical Functioning
Subjective outcomes included measures of self-reported healthy days and difficulties in physical functioning that were previously found to be associated with audiometry-measured HI and that were based on qualitative self-ratings by participants (Chen et al., 2014; Genther et al., 2013). Self-reported healthy days were assessed by an interviewer using the CAPI system. Respondents were asked to specify the number of days in the last 30 days during which their physical health (physical illness and injury) was poor. As in a previous report, the final variable was analyzed as a binary variable where poor physical health was defined as reporting greater than 10 days of poor physical health out of the prior 30 days (Genther et al., 2013). Similarly, respondents were asked to specify the number of days during which their mental health (stress, depression, and problems with emotions) was poor. Poor mental health was defined as reporting greater than 10 days of poor mental health out of the prior 30 days (Genther et al., 2013).
Self-reported difficulties in physical functioning were assessed by an interviewer using the CAPI system. Respondents were asked a series of questions regarding any difficulties they had performing physical tasks. The physical tasks were categorized into five domains including activities of daily living (ADLs; that is, difficulties getting in and out of bed, eating, and dressing), instrumental activities of daily living (IADLs; that is, difficulties managing money, performing house chores, and preparing meals), leisure and social activities (i.e., difficulties going to the movies, attending social events, and performing leisure activity at home), lower extremity mobility (i.e., walking, stooping/kneeling/crouching, standing up), and general physical activities (lifting, reaching up, grasping/holding, standing/sitting for long periods; Chen et al., 2014; Plantinga et al., 2011). Difficulty in a physical domain (“yes” or “no”) was defined as reporting some or more difficulty in at least one of the physical task questions within a domain. Respondents were also asked about whether they had general functional limitations (“yes” or “no”) in walking and limitations due to confusion and memory.
Other Study Variables
Data on demographics and medical history were obtained from interviews. Age was truncated at 80 in the NHANES database to protect confidentiality; therefore, age was treated as a categorical variable and was collapsed into three categories (70 to 74, 74 to 79, and 80 and older) instead of being treated as a continuous variable. Sex was included as a binary variable, and self-reported race and ethnicity were grouped as Hispanic (Mexican American or other Hispanic), White (non-Hispanic White), Black (non-Hispanic Black), or Other race. Education was collapsed into three categories (<12th grade, high school graduate, or some college or more). Household income was collapsed into five categories (<US$20,000, US$20,000-US$44,000, US$45,000-US$74000, ≥US$75,000, and refused/do not know). Medical history variables included hypertension (having been diagnosed by a physician on at least two visits with high blood pressure or taking antihypertensive medication), cardiovascular disease (congestive heart failure, coronary artery disease, angina pectoris, or myocardial infarction), diabetes mellitus, stroke, and smoking status (current, former, never).
Statistical Methodology
The complex sampling design was accounted for by using sample weights according to the National Center for Health Statistics guidelines in all analyses except for Table 1. Table 1 provides the descriptive statistics using self-reported and audiometric measures of hearing as ordinal variables to characterize the study cohort, and therefore, unweighted numbers were reported. The Pearson chi-square test was used to compare baseline characteristics of the study participants.
Demographic and Health-Related Characteristics of Participants Aged 70 and Older With Audiometric Testing and Self-Report, NHANES, 2005-2006 and 2009-2010, N = 1669.

Note. NHANES = National Health and Nutrition Examination Survey; HI = hearing impairment; MPA = moderate physical activity.
Variables were considered as binary, for example, the number of patients with hypertension in audiometry-measured “no HI” group is 353. Therefore, the total number of patients without hypertension is 179 (total n = 523 − 353).
Cardiovascular disease includes any history of congestive heart failure, coronary artery disease, angina pectoris, or myocardial infarction.
Accelerometer data are available for a subset of complete cohort.
Multivariable binary and ordinal logistic regression was used to examine the relationships between HI and measures of functional outcomes. These relationships were assessed using audiometric HI defined as three different types of variables: continuous, binary, and ordinal. Self-reported HI was defined in the analyses as two different types of variables: binary and ordinal. Regression models were adjusted for demographics and cardiovascular risk factors. The proportional odds assumption in ordinal models was assessed using the Brant test, and partial proportional odds models were used to address violations of proportionality. Ordinal covariate parameterizations were compared against categorical parameterizations using the likelihood ratio test. Linearity of associations with continuous covariates was assessed using smoothed residual plots. Significance was considered using a two-tailed t test with p < .05. All analyses were conducted using Stata 11.1 (StataCorp, College Station, Texas).
Results
Data from a total of 1,669 participants aged 70 years or older were examined in this study (Table 1). Within the study population, 529 (31.7%) had normal audiometric hearing, and 828 (49.6%) reported that they had excellent or good hearing based on self-report. The agreement rate between audiometric and self-reported binary assessments of HI was 69%, with 79% of misclassification attributable to underestimation of HI (κ = 0.38). Figure 1 shows the relationship between audiometry-measured hearing and self-reported general condition of hearing. There is an overall linear relationship between the two measures of hearing, but wide distributions within each category of self-reported hearing with trends toward underestimation of HI can be noted. Poorer hearing measured by both audiometry and self-report was associated with being male, older, White, having cardiovascular disease, and using hearing aids. Poorer hearing measured by audiometry alone was associated with having less education, lower income, history of stroke, and smoking history.

Violin plots combined with jittered scatter plots of self-reported general condition of hearing and pure-tone audiometry hearing level in dB among participants aged 70 and older, NHANES 2005-2006 and 2009-2010, N = 1669.
Associations Between HI and Objective Outcomes
In a model adjusted for demographics and cardiovascular risk factors, a 25-dB difference in hearing threshold of the pure-tone average was associated with greater odds of being in a lower category of physical activity measured by the accelerometer (odds ratio [OR] = 1.67, 95% confidence interval, CI [1.05, 2.64]), any hospitalization (OR = 1.32, 95% CI [1.07, 1.63]), and greater number of hospitalizations (OR = 1.35, 95% CI [1.09, 1.68]), as shown in Table 2. Ordinal measures of audiometric HI were also significantly associated with poorer physical activity and hospitalizations when comparing moderate or greater HI with normal hearing. In contrast, there were no significant associations between self-reported HI and accelerometer-measured physical activity or hospitalization. Compared with individuals reporting excellent or good hearing, individuals self-reporting moderate or greater trouble hearing did not have greater odds of being in a lower category of physical activity measured by the accelerometer (OR = 1.19, 95% CI [0.69, 2.06]), any hospitalization (OR = 1.14, 95% CI [0.90, 1.43]), or number of hospitalizations (OR = 1.15, 95% CI [0.92, 1.44]).
Association Between HI and Functional Outcomes, NHANES 2005-2006 and 2009-2010, N = 1669.
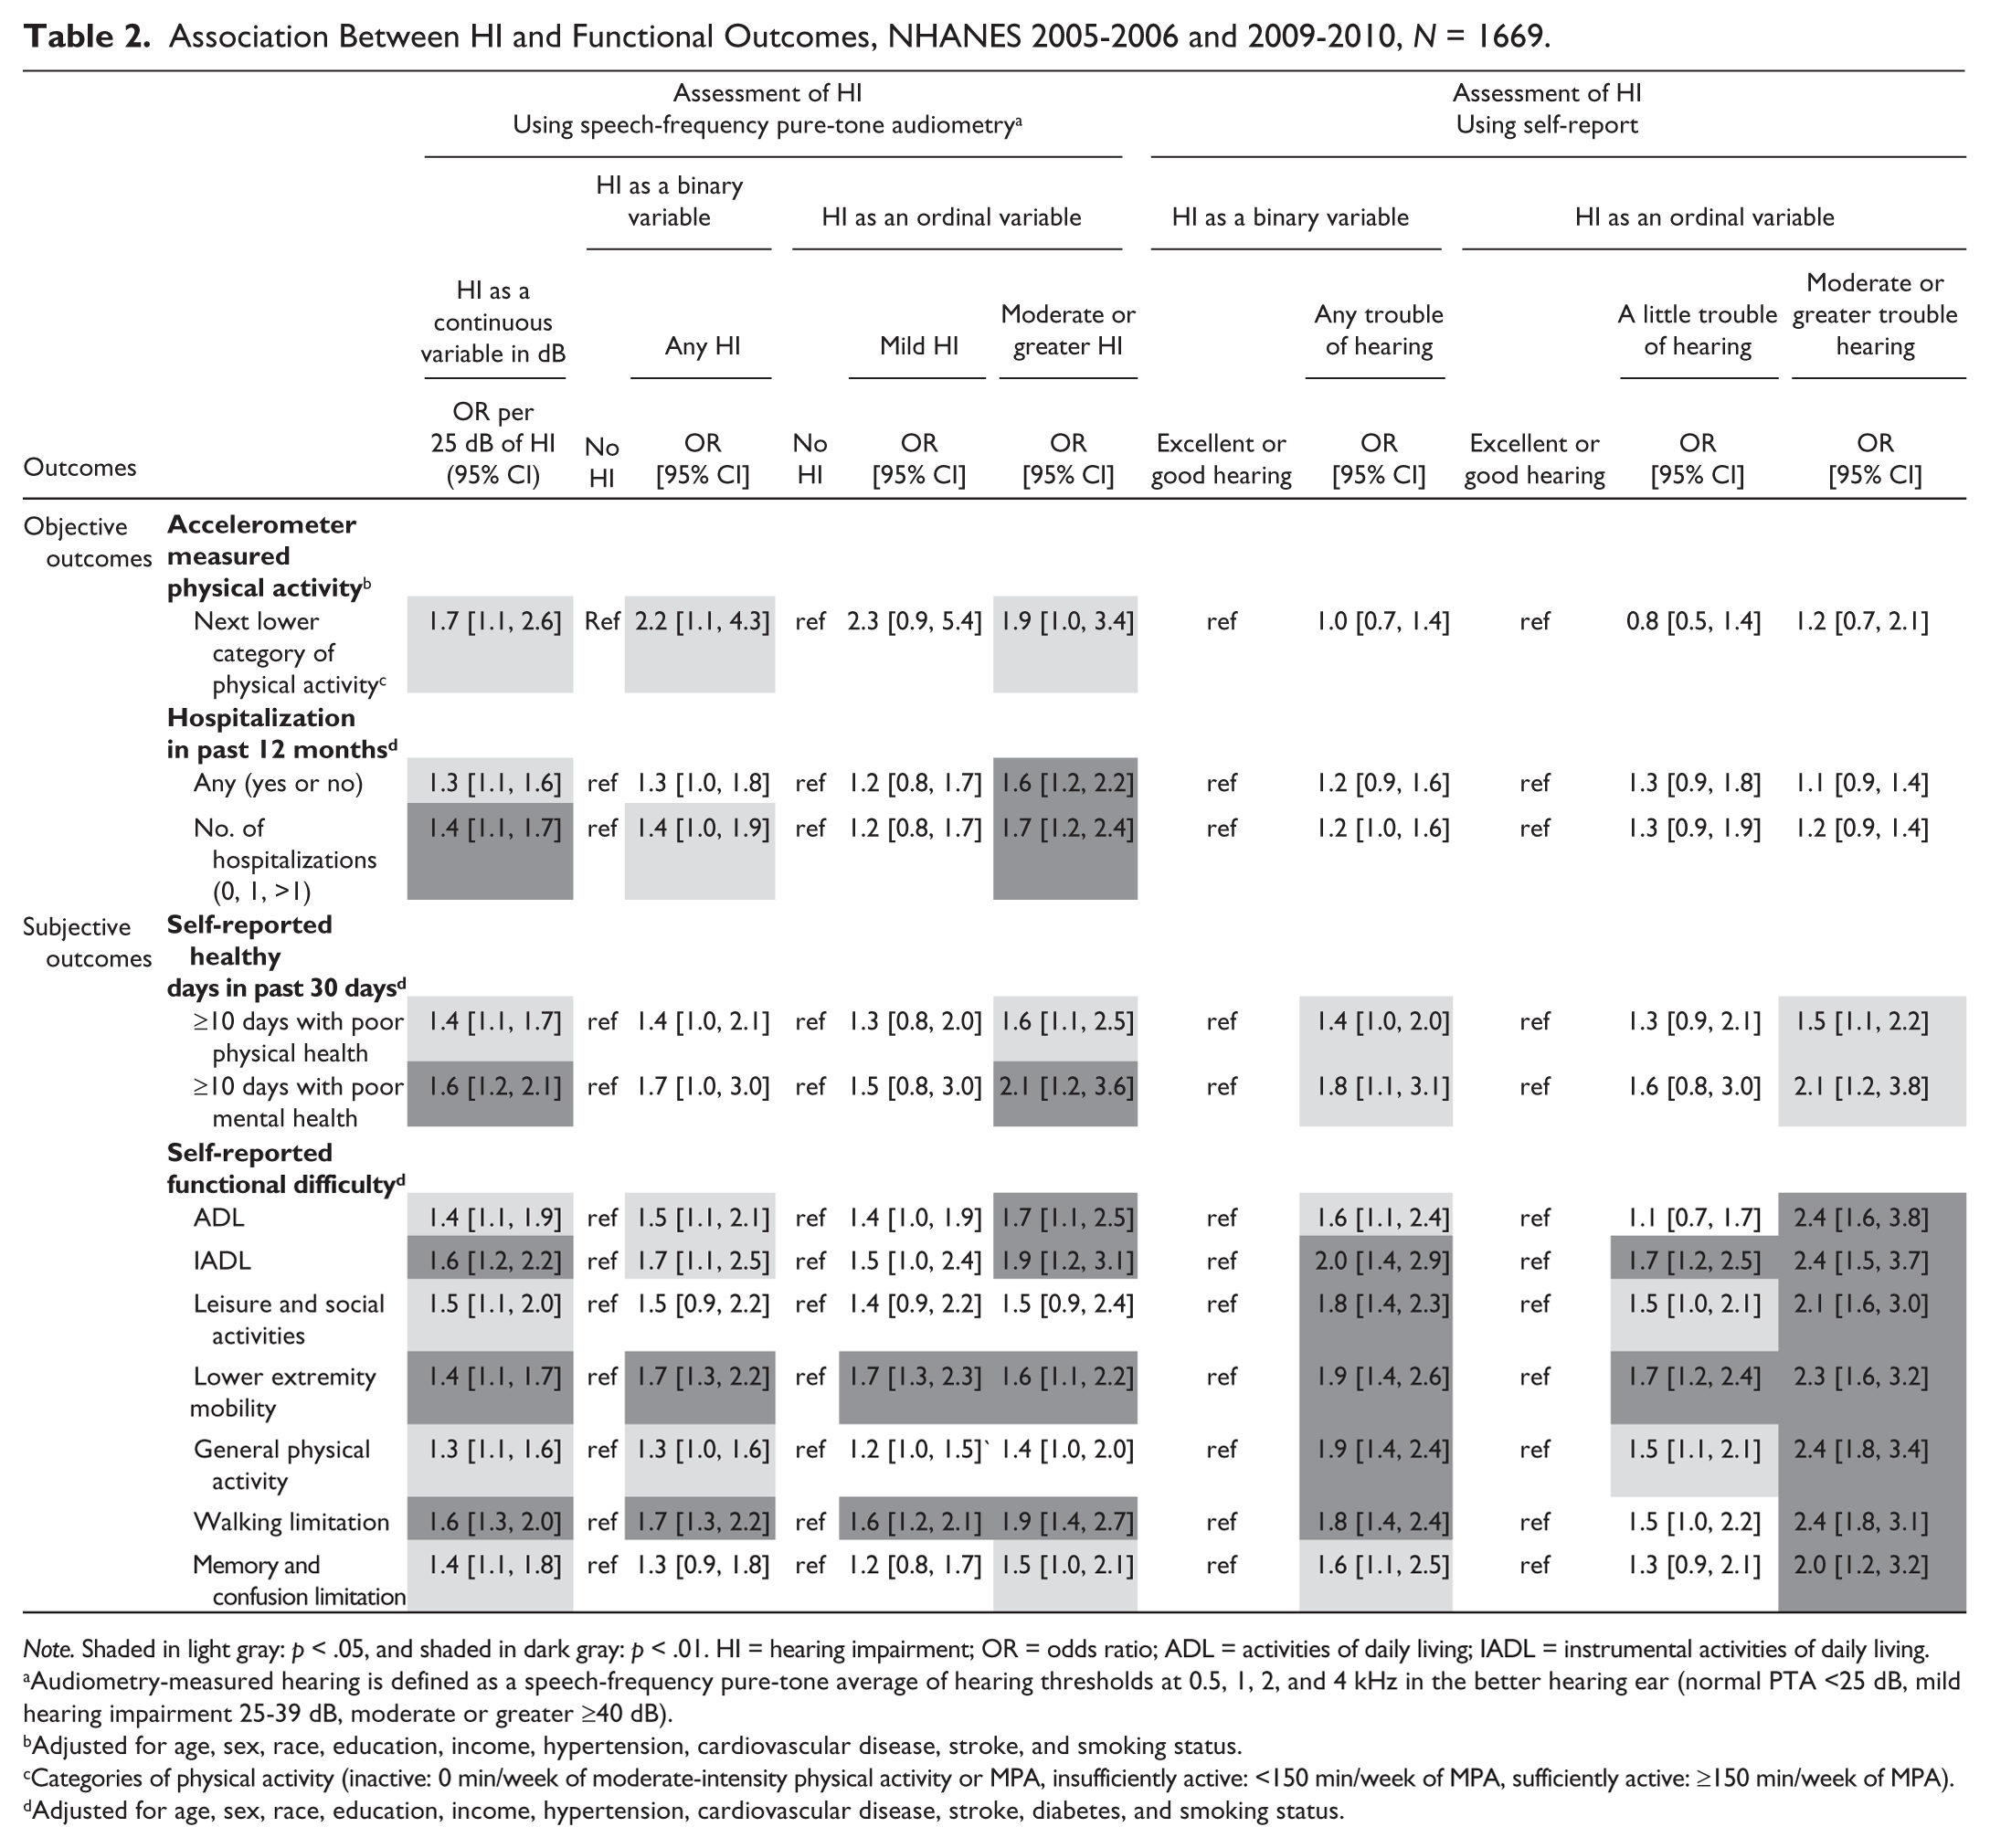
Note. Shaded in light gray: p < .05, and shaded in dark gray: p < .01. HI = hearing impairment; OR = odds ratio; ADL = activities of daily living; IADL = instrumental activities of daily living.
Audiometry-measured hearing is defined as a speech-frequency pure-tone average of hearing thresholds at 0.5, 1, 2, and 4 kHz in the better hearing ear (normal PTA <25 dB, mild hearing impairment 25-39 dB, moderate or greater ≥40 dB).
Adjusted for age, sex, race, education, income, hypertension, cardiovascular disease, stroke, and smoking status.
Categories of physical activity (inactive: 0 min/week of moderate-intensity physical activity or MPA, insufficiently active: <150 min/week of MPA, sufficiently active: ≥150 min/week of MPA).
Adjusted for age, sex, race, education, income, hypertension, cardiovascular disease, stroke, diabetes, and smoking status.
Associations Between HI and Subjective Outcomes
We observed an opposing pattern of results for associations of HI with subjectively measured outcomes. In general, both audiometric and self-reported assessments of hearing remained significantly associated with self-rated health and physical function, with the associations of the greatest magnitude being observed between self-reported assessments of hearing and subjective outcomes (see Table 2). Relative to individuals with normal hearing, those with moderate or greater audiometric HI reported poorer self-rated physical health (OR = 1.61, 95% CI [1.14, 2.46]) as individuals with moderate or greater trouble hearing reported poorer health than those with excellent or good hearing (OR = 1.54, 95% CI [1.10, 2.15]). Self-reported limitations in several domains of physical functioning that were not significantly associated with binary measures of audiometric HI (limitation in leisure and social activities, OR = 1.45, 95% CI [0.94, 2.23]; and work limitation, OR = 1.17, 95% CI [0.85, 1.60]) were significantly associated with binary measures of self-reported HI (limitation in leisure and social activities, OR = 1.76, 95% CI [1.36, 2.27]; and work limitation, OR = 1.51 95% CI [1.15, 1.98]).
Discussion
We investigated the association of audiometric versus self-reported measures of hearing with functional outcomes in older adults using a nationally representative sample of the U.S. population. Our results demonstrate that using self-reported measures of hearing in epidemiologic studies may underestimate the magnitude of associations of HI with objective functional outcomes, such as accelerometer-measured physical activity and number of hospitalizations. Conversely, using self-reported measures of hearing compared with audiometry may overestimate the magnitude of associations with subjective outcomes, such as self-reported healthy days and limitation in physical functioning. The differential associations by method of hearing assessment bring into question the validity of using self-reported hearing as a proxy for standard audiometry.
There have been several studies reporting the associations between HI measured by both audiometry and self-report and their selected functional outcomes. Gopinath et al. (2012) demonstrated significant association between moderate-or-greater HI and impaired ADL, which was not found when hearing was measured with the Hearing Handicap Inventory for the Elderly–Screening (HHIE-S). However, most of the previous studies have used either self-reported hearing or audiometry only. Even within the studies using self-reported hearing, the interview questions used to assess hearing varied depending on whether a single question or more detailed questionnaire (i.e., HHIE-S) was used, whether respondents rated their hearing with or without hearing aid, one or both ears were investigated, and/or tinnitus was considered as HI (Curhan, Eavey, Wang, Stampfer, & Curhan, 2013; Dargent-Molina et al., 1996; Kiely et al., 2012; Laforge et al., 1992; Sindhusake et al., 2001; Strawbridge et al., 2000). The definitions of self-reported HI used in their analyses also varied significantly, with variables being defined as binary or categorical with or without combination with visual impairment, making it difficult to compare previous findings with the present study.
Our results indicate that there may be weaker associations of HI with objective outcomes including low physical activity and number of hospitalizations when using self-report versus audiometry. One potential explanation is that the imprecise assessment of hearing when using self-report causes attenuation of the observed associations as older adults often underestimate their HI, either considering it to be a normal part of the aging process or denying their HI altogether due to the stigma of HI being associated with ageism and the perception of HI as a disability (Dalton et al., 2003; Gopinath et al., 2012; Gordon-Salant, 2005; Kamil et al., 2015; Wallhagen, 2010; Wiley, Cruickshanks, Nondahl, & Tweed, 2000). In addition, older adults may not report trouble hearing when its severity is mild due to the gradual nature of the age-related HI. Systematic misclassification of HI, such as the underestimation of HI observed in this cohort, results in bias, especially when factors associated with underestimation are also associated with the outcome of interest. The weaker associations observed in our study between self-reported measures of hearing and objective functional outcomes were similar to results from previous studies investigating differences between subjective and objective measures of physical activity and their associations with biomarkers (Atienza et al., 2011; Schmidt, Cleland, Thomson, Dwyer, & Venn, 2008).
In contrast to the objective outcomes, subjective functional outcomes were generally associated with self-reported HI. These results may be related to the concept of health pessimism, which purports that individuals who report difficulty hearing are more likely to report difficulties in other domains of health, such as physical functioning and self-reported general health status (Bailey, 2013; Scheier & Carver, 1985; Vavreck, 2007). The potential threats to validity caused by using self-report for both independent and dependent variables have been discussed across various research fields (Chan, 2009; Del Boca & Noll, 2000; Podsakoff, MacKenzie, Lee, & Podsakoff, 2003; Spector, 1994; Vavreck, 2007). Drawing inferences from associations among self-report at one point in time is often difficult and warrants caution in its interpretation. Our findings suggest that self-reported measure of hearing may not be a proxy of audiometric hearing but rather provide distinct aspects of hearing in relation to the personal factors and communication environments. It is important to note that self-reported hearing may be a more sensitive measure of hearing in regard to the functional impairment in daily lives of older adults compared with the audiometric hearing (Hickson et al., 2008). The additional use of validated measures of self-reported hearing, which provides useful information in association with self-perceived handicapping from HI and its impact, may improve rehabilitation of older adults with HI in clinical settings (Tomioka et al., 2013; Weinstein, 1994).
There are several limitations to the present study. The data from NHANES are cross-sectional, limiting the ability to assess the temporal order of the associations observed in this study. Second, potential effect modifiers (e.g., marital status, living status of partner, vision impairment, etc.) that could affect the magnitude of the association between hearing and the functional outcomes were not addressed in this study. However, we note that all analyses were adjusted for potential confounders. In addition, we collapsed self-reported and audiometric measures of hearing as ordinal variables a priori for simpler comparison of the two predictors. Although it is possible that different results may have been obtained if we used different cutoffs for defining levels of these predictors, similar results were observed when both predictors were collapsed into binary variables that were defined with relatively ubiquitous cutoffs. Furthermore, quantitative comparison of the difference between the observed associations is not possible, as self-reported and audiometric assessments of hearing are fundamentally different, albeit related measures of HI. Our results only suggest differential patterns of associations with functional outcomes when using self-reported versus audiometric measures of hearing. Future research can further explore the difference between self-reported hearing and audiometric hearing measured on a continuous scale, by using the sums and differences of these measures as covariates in statistical models (Gelman & Stern, 2006).
In summary, using self-reported hearing instead of audiometric hearing may underestimate the associations with objective functional outcomes and overestimate the associations with subjective outcomes in older adults relative to pure-tone audiometry. The results of this study suggest that epidemiological studies using self-reported hearing in older adults should be interpreted with caution, as self-reported measures may capture distinct aspects of HI among older adults. Results obtained from self-reported hearing should not be considered representative of results from using audiometric measures of hearing.
Footnotes
Authors’ Note
The contents of this article are solely the responsibility of the authors and do not necessarily represent the official view of the Johns Hopkins Institute for Clinical and Translational Research (ICTR), the National Center for Advancing Translational Sciences (NCATS), or the National Institutes of Health (NIH).
Declaration of Conflicting Interests
The authors declared the following potential conflicts of interest with respect to the research, authorship, and/or publication of this article: Dr. Frank Lin reports being a consultant to Cochlear, on the scientific advisory board for Autifony and Pfizer, and a speaker for Med El and Amplifon.
Funding
The authors disclosed receipt of the following financial support for the research, authorship, and/or publication of this article: This article was supported in part by the National Institutes of Health (NIH) K23DC011279, the Eleanor Schwartz Charitable Foundation, a Triological Society/American College of Surgeons Clinician Scientist Award, and the Johns Hopkins Institute for Clinical and Translational Research (ICTR), which is funded in part by NIH TL1 TR001078 from the National Center for Advancing Translational Sciences (NCATS).