
Abstract
Introduction
The literature on population aging in developed countries is exploding. Much of this literature focuses on the challenges to current economic and social arrangements associated with an ever more elderly population. However, the concepts and measurements used in that literature have remained largely unchanged for more than half a century. Sanderson and Scherbov (2005, 2007, 2008, 2010, 2013) presented and further developed a new forward-looking definition of age called “prospective age.” The traditional age measure is a backward-looking one. It tells us how many years a person has already lived. But this is an incomplete measure because it ignores changes in life expectancy and, more generally, it ignores the changing characteristics of people. Aging is a multidimensional process, and chronological age is only one characteristic of people. However, different populations have very different characteristics at a given chronological age.
Why is someone aged 60 considered to be middle-aged today, while 150 to 200 years ago, a person of the same age would be considered elderly? The reason is that young and old are relative notions and their common reference point is life expectancy. In 1800, only about one third of women would have survived until age 60, while today in developed countries, more than 90% of women will celebrate their 60th birthday. Prospective age measures how old people are, not only from the date of their birth but also in relation to their lengthening life expectancies.
For many crucial social questions, such as the viability of public pension systems, we need to know not only how old people are but also how many remaining years of life they are expected to have. From an individual perspective, expected remaining years of life affect a host of decisions from saving and investment to the acquisition of new skills. In an era of increasing life expectancies, we obtain a much more complete picture of population aging by combining the backward-looking approach embodied in the traditional age measure with the forward-looking one using prospective age.
The article is structured in the following way. First, we introduce the concept of prospective age, that was historically the first measure of aging that took into account the remaining life expectancy. Then, we compare conventional measures of aging such as median age, proportion old, and old-age dependency ratio (OADR) with their analogs that employ the concept of prospective age. We show that measures of aging that take into account life expectancy show a very different dynamics, compared with traditional measures. In the “Method” section, we introduce the characteristics approach to population aging that generalizes existing approaches to measuring aging. Several applications of the characteristics approach are presented, and a discussion concludes the article.
Prospective Age and Traditional Measures of Aging
Prospective Age
To understand the concept of prospective age, let us imagine two people, one alive in 1950 and the other in 2000. If these two people both were 40 years old, then naturally each would have lived 40 years by those two dates. People who share a prospective age, however, share a remaining life expectancy. If a 40-year-old person in 1950 had a remaining life expectancy of 30 years and a 50-year-old person in 2000 also had a remaining life expectancy of 30 years, then the 50-year-old in 2000 would have a prospective age of 40, using 1950 as a year of reference. In this case, all people who had a remaining life expectancy of 30 years would have a prospective age of 40 (again using 1950 as the reference year).
Table 1 provides another illustration of the concept. In 1900, in England and Wales, remaining life expectancy of 40-year-old females and males was 27.4 and 25.0 years, respectively. At all other time periods, the same remaining life expectancy was achieved at different ages. For example, in 1990, it was achieved at ages 53.5 and 51.0 for females and males, respectively. Table 1 shows the prospective ages of females and males who had the same prospective age as 40-year-olds in 1900. In 2001 to 2003, those prospective ages were 55.3 for women and 54.1 for men.
Constant Prospective Age 40, England and Wales, Standard Year—1900.
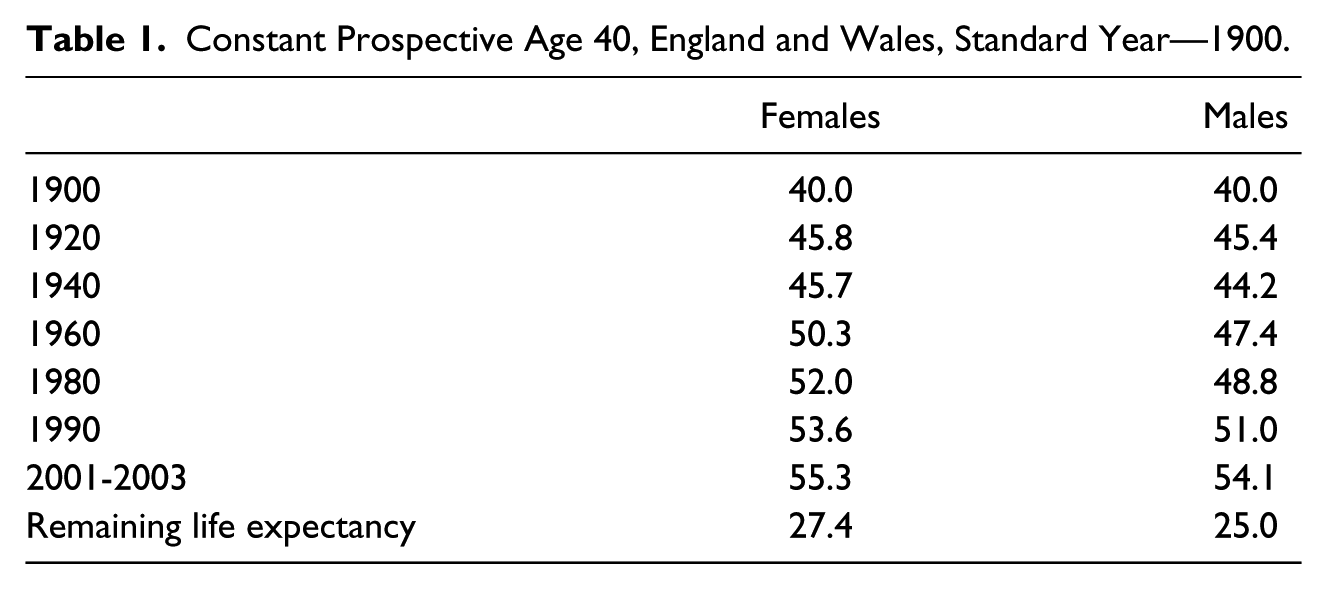
Figure 1 illustrates the concept of prospective age with an example for females in the Republic of Korea. Each line corresponds to a different prospective age where 2000 is selected as a standard year. For example, the line marked as 70 shows at which age (Y axis) remaining life expectancy was the same as for a 70-year-old female in the year 2000. We read from this chart that a 70-year-old person had in 2000 the same remaining life expectancy as a 65-year-old woman in 1970. Or if we take a line that corresponds to the prospective age 40 at a standard year 2000, then we can see that a woman at age 40 in 2000 had the same remaining life expectancy as a 30-year-old woman had around 1947. This gives support to the famous saying that 40s is a new 30s. In fact, today in the case of the Republic of Korea, we may even say that the 40s are the new 20s.
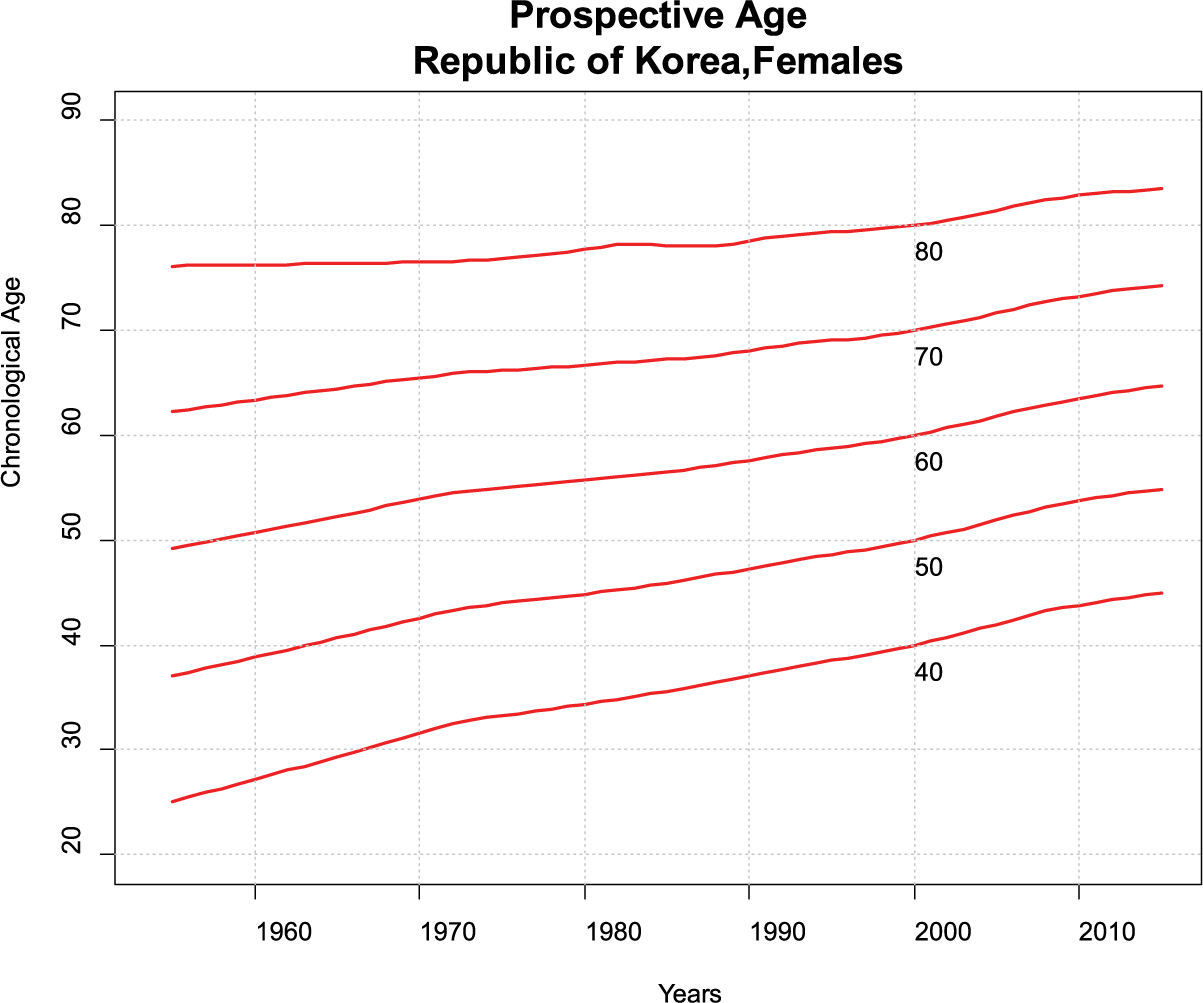
Prospective ages for Korean females.
Like the use of constant dollars to compare values from one period with another by taking inflation into account, prospective age serves an analogous purpose by comparing ages taking the increase in life expectancy into account. Any kind of financial data that can be represented in dollar terms can be converted into constant dollars by using an appropriate price index. Similarly, age can be converted into prospective age through the use of appropriate life tables.
Median Age
A commonly used measure of population aging is the change in the median age of the population. If, for example, the median age of a population were to rise from 40 to 45 over the half century from 2000 to 2050, we are lead implicitly to think that the average person in the population of 2050 would behave like a 45-year-old in 2000, but because of life expectancy increases, this is unlikely to be the case. A 45-year-old in 2050 might well behave in many ways like a 35-year-old in 2000, because the 45-year-old could have the same remaining life expectancy as a 35-year-old person in 2000. It is precisely because many behaviors depend on the number of years left to live that it is important to supplement the usual backward-looking definition of age with a forward-looking one.
In Figure 2, we present the median age and the prospective median age for the female populations of China and the Republic of Korea over the period 1955 to 2045. The prospective median age for any particular country is the age in the base year (in our case 2010) where remaining life expectancy is the same as at the median age in the indicated year for the same country. The median ages for 2015 and onward are taken from UN projections and we calculated prospective median ages using UN assumptions regarding expected increases in life expectancy (United Nations, 2013). Although median ages have been rising for both countries during 1955 to 2005, prospective median ages initially declined and subsequently slightly increased. 1
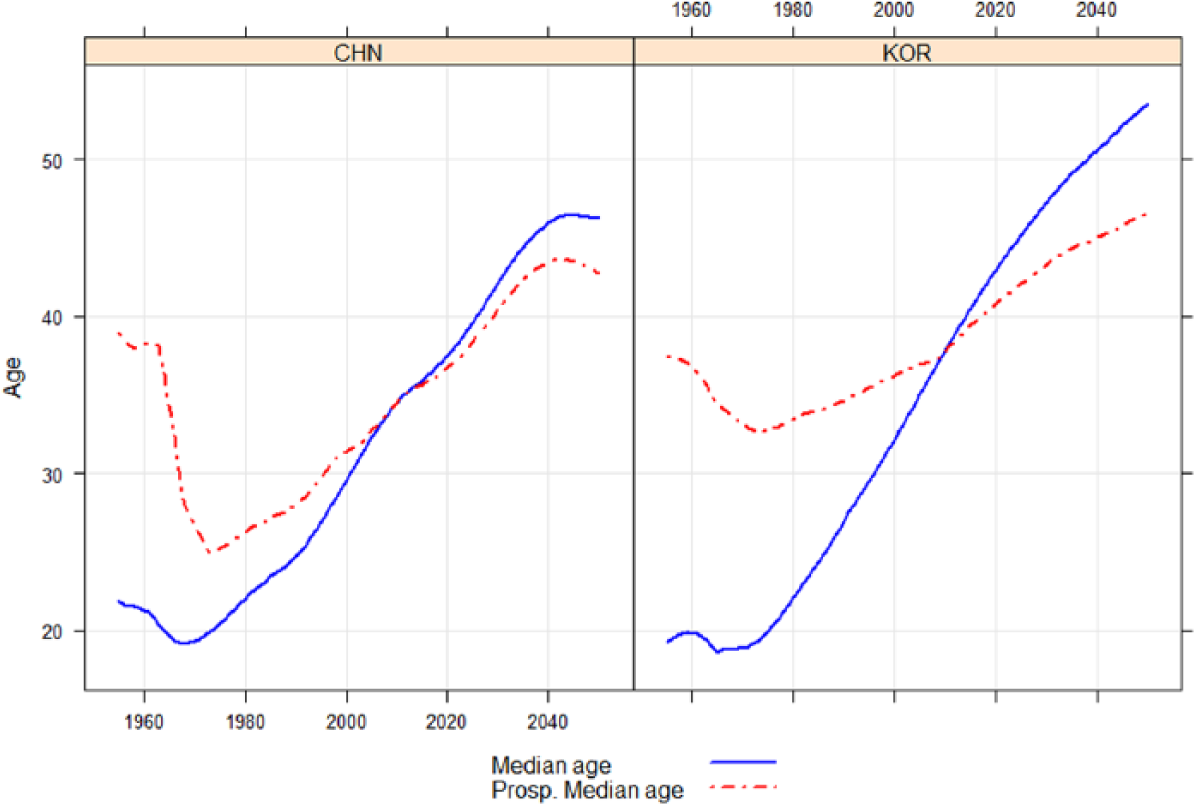
Median age and prospective median age for China and Republic of Korea, 1955-2045.
Even though we consider UN assumptions somewhat conservative with respect to life expectancy growth, 2 we see that the increase in the prospective median age is much less dramatic than in the conventional median age. Although according to United Nations, the median age in China and in the Republic of Korea increases during the past 50 to 60 years by more than 15 years, the prospective median age today is about the same or even lower than it was 50 to 60 years ago.
In Figure 3, we present median age and prospective median age for the countries of South East Asia. Prospective median age is based on mortality and population projections using UN assumptions. While the conventional median age rises during the projection period, the prospective median age by 2050 is even lower than it used to be in 2009.
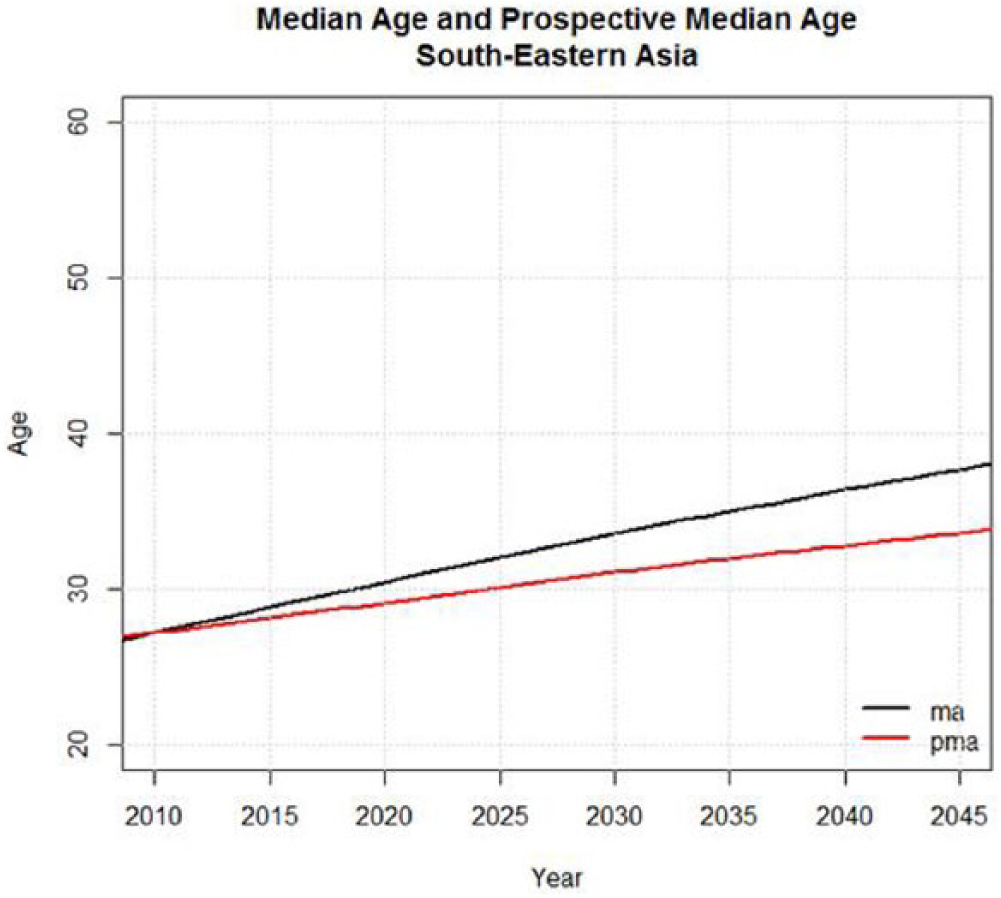
Projected median age (ma) and prospective median age (pma; for South-Eastern Asia), 2010-2045.
For many countries of the world, where the increase of the median age is accompanied by an increase in life expectancy, the prospective median age will behave as we have observed it here—it will increase, if it increases at all, much less dramatically than the median age.
Proportion Old
Another widely used measure of aging is the proportion of people who are aged 65 and older. In Figure 4, we present the evolution of the proportion of people 65 and older for selected Asian countries in the period 1955 to 2055. In the period 1955 to 2010, this proportion increased more than four times for Japan and more than three times for the Republic of Korea. For the rest of the countries, a considerable increase in the proportion of old was also observed. For the projection period from 2010 to 2055, the proportion 65+ is expected to increase by more than threefold in Iran, Indonesia, Thailand, and the Republic of Korea. Of course, here everyone who reaches age 65 is treated as being old. However, life expectancy at age 65 also changed dramatically in the course of the last century. In the period 1955 to 2010, it increased by almost 9.5 years in Japan and 8 years in the Republic of Korea. In the other countries, considerable changes in the remaining life expectancy at age 65 also occurred and these changes are expected to continue into the future.
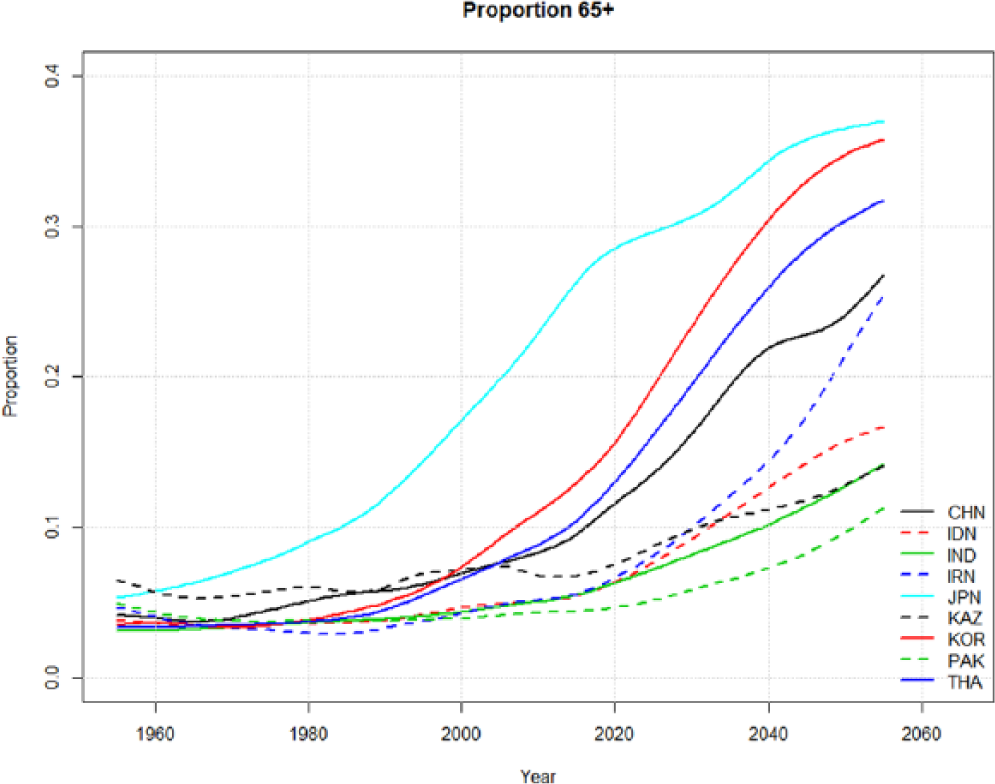
Proportion of people 65+ for selected Asian countries.
Figure 5 presents the dynamics of remaining life expectancy for low mortality Organisation for Economic Co-Operation and Development (OECD) countries over the course of the 20th century. In 1900, a person who reached age 65 would, on average, expect to live another 12 years. In 2010, the person at age 65 would expect to live about 20 years, 8 years more than in 1900. But in the conventional approach, both of them are considered to be at the threshold of being old.
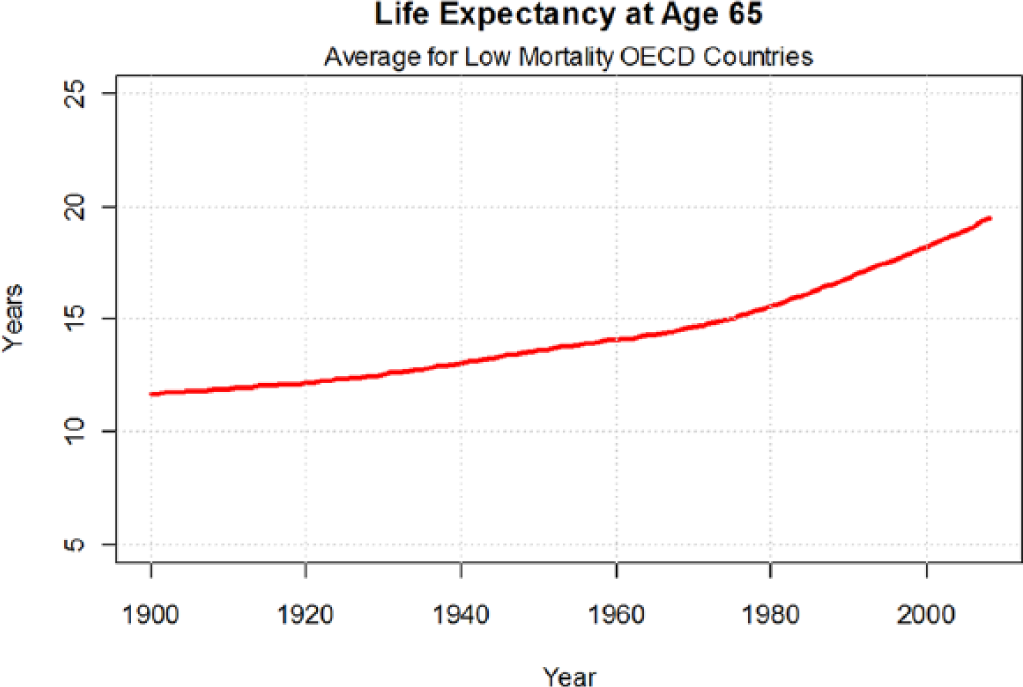
Life expectancy at age 65 (average for low mortality OECD countries), 1900-2009.
In the 1970s, life expectancy at age 65 reached 15 years in many low mortality countries, so, in the conventional approach, someone at age 65 with 15 years of remaining life would be considered old. Let us assume, like in the 1970s, that someone with remaining life expectancy 15 years or less is old. In Figure 6, we present what the proportion of old people would look like with this definition of elderly people. The historical trend of aging looks very different, compared with the trend presented in Figure 4. An increase between 1970 and 2010 is observed only for a few countries in proportion of those considered old, if we define old people as those who have an average remaining life expectancy of 15 years or less. For several countries, we even observe a decrease in the proportion elderly, once the threshold of being old is redefined. After 2010, in countries such as China, Republic of Korea, and Thailand, we still expect a growing proportion of elderly, but the increase is much more modest compared with the increase in the proportion 65+. In fact, the concept of age when remaining life expectancy is equal to 15 years is related to the concept of prospective age and corresponds to a constant prospective age without defining any standard year.
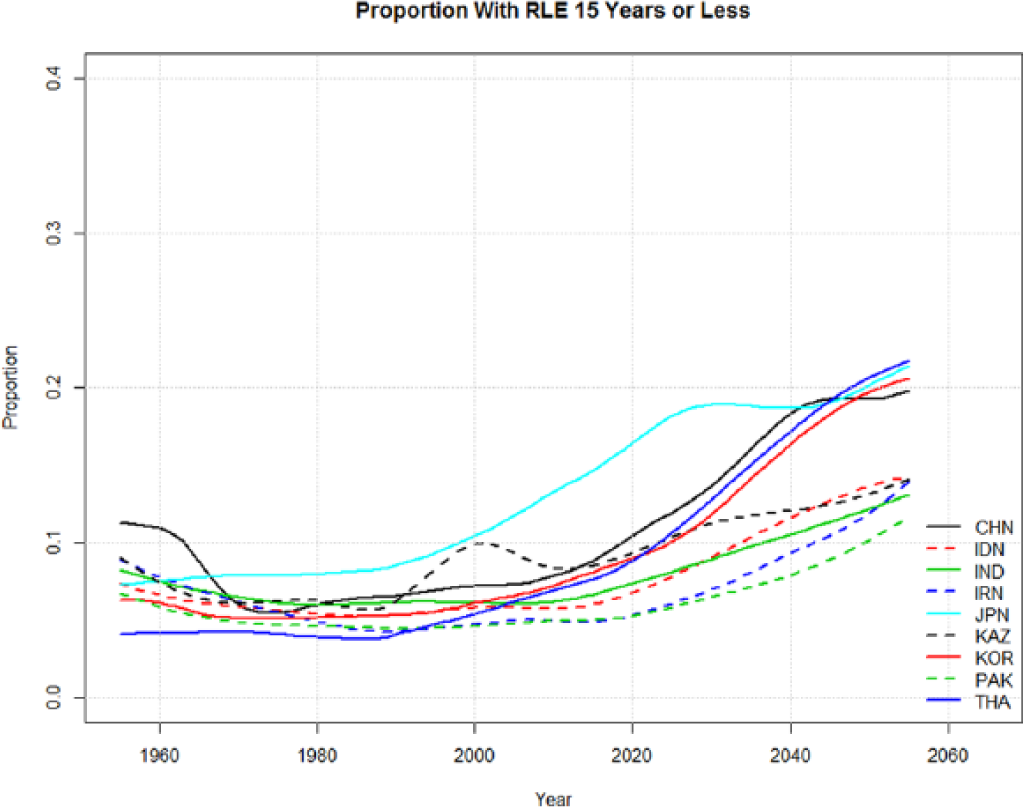
Proportion of people with the remaining average life expectancy 15 years or less (selected Asian countries), 1955-2055.
Dependency Ratio
The conventional OADR and the prospective old-age dependency ratio (POADR) are presented in Figures 7 and 8. Here, the old age threshold affects both the numerator (the number of elderly people) and denominator (the number of people at working ages), but it affects them in opposite directions. Increases in threshold age decrease the number of old and increase the number at working ages. Thus, the difference between conventional and prospective measures is even more striking than in the case of the proportion old. For Japan, by 2055, the OADR is projected to be around 80%, which means that there would be eight elderly people per 10 people in the working ages. In the Republic of Korea, the OADR reaches 70%, and in Thailand, it exceeds 60%. For all other selected countries except Pakistan, it is above 20% by 2050. Prospective OADRs manifest a very different dynamic. For China, Japan, Republic of Korea, and Thailand, it is projected to be between 30% and 40% by 2050. For all other countries, it stays around 20%.
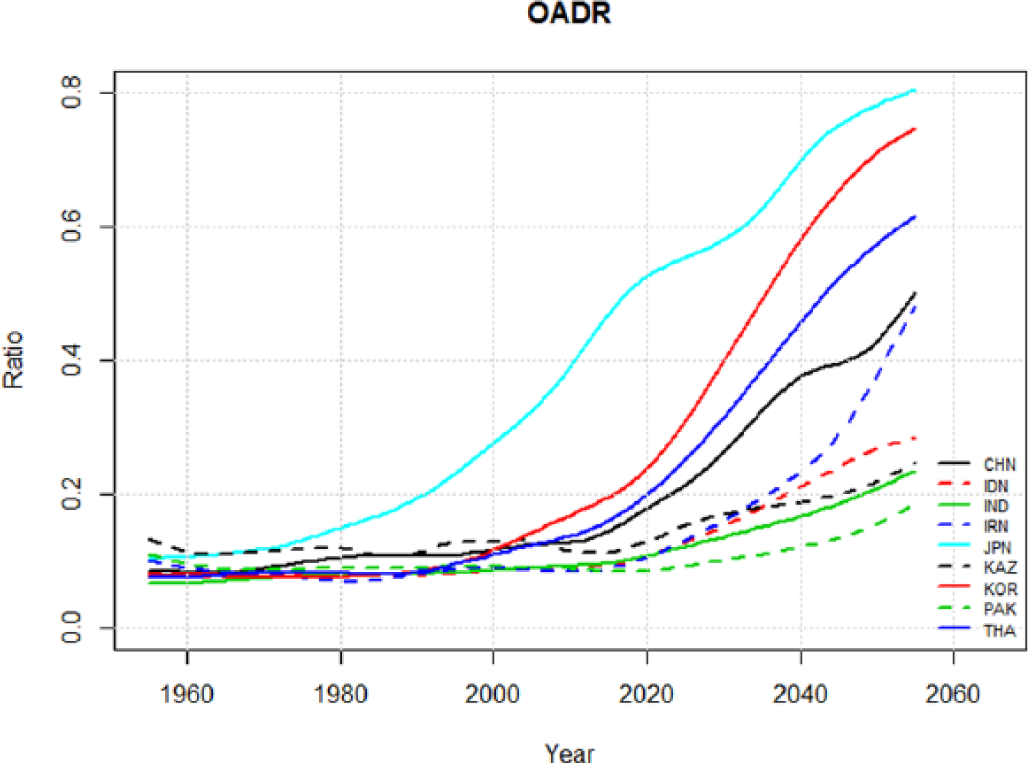
OADR (selected Asian countries), 1955-2055.
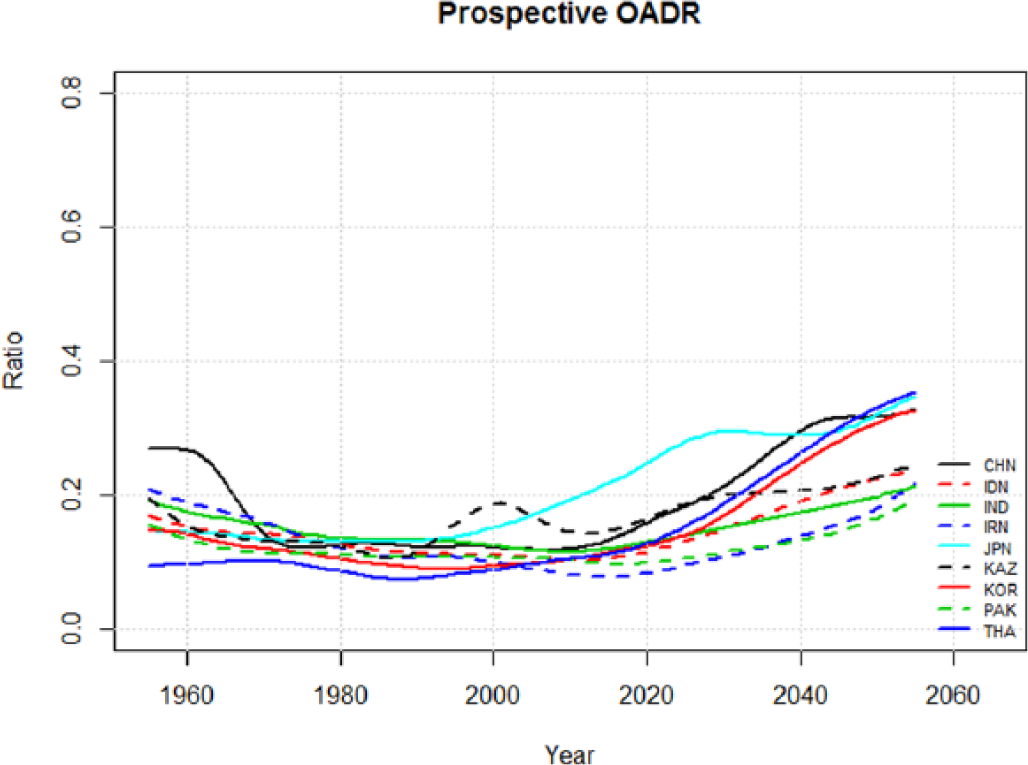
POADR (selected Asian countries), 1955-2055.
Method
Characteristics Approach
In the previous sections, we introduced new measures based on remaining life expectancy. We fixed it at an average of 15 years and observed how the age that corresponded to this characteristic changed with time. In this way, we defined a particular dynamic threshold of old age. But aging is a multidimensional phenomenon and many more characteristics could be used in defining an old age threshold. Remaining life expectancy may be considered as one of the characteristics of people. Following Sanderson and Scherbov (2014), we call the ages that correspond to different characteristics of the population “α-ages.” The characteristics approach developed in Sanderson and Scherbov (2014) employed additional characteristics as well. We call the α-ages based on invariant characteristics constant characteristic ages.
Each of these characteristics may be used to define thresholds reflecting different features of population aging. For example, a health-based characteristic could be also used to mark the entrance to old age. Health is a complex concept, but a rough and readily accessible measure of it at each given age would be the level of the corresponding age-specific mortality rate. In this case, α-ages based on the life table mortality rate, mx, would provide ages of comparable population health across space and time (Cutler, Liebman, Shepard, & Smyth, 2007; Fuchs, 1984; Vaupel, 2010) and could also be used to mark an old age threshold.
Another important transition is the one at which people become eligible for a full public pension. Pension systems become unsustainable if eligibility ages are fixed while life expectancy steadily rises. α-ages allow us to specify a simple alternative public pension system where the fraction of adult person-years spent eligible for a pension remains constant. Such a system is equitable in the sense that the ratio of years of pension to years in the working ages remains fixed, even as life expectancy changes. We call the ratio of person-years lived at age x and beyond to the number of person-years lived from age 20, Tx/T20 in life table notation, the “life-course ratio” because it allows fruitful links to life-course studies (Lee & Goldstein, 2003). In the special case where the life-course ratio is equal to the proportion of adult person-years in which people are eligible for a pension in a specific base year, the corresponding α-age provides an easily understood measure that defines the age at pension eligibility and can, therefore, be used to inform discussions of pension age changes (Sanderson & Scherbov, 2015).
In Figures 9 and 10, we show the α-age trajectories for an old age threshold for Japan and the Republic of Korea based on chronological age and on three life table characteristics: (a) remaining life expectancy (ex), (b) mortality rates (mx), and (c) the life-course ratio (Tx/T20). For each of the characteristics, we fix its value at the level observed for 65-year-olds in 2010 and plot the age at which this characteristic is reached at different time periods.
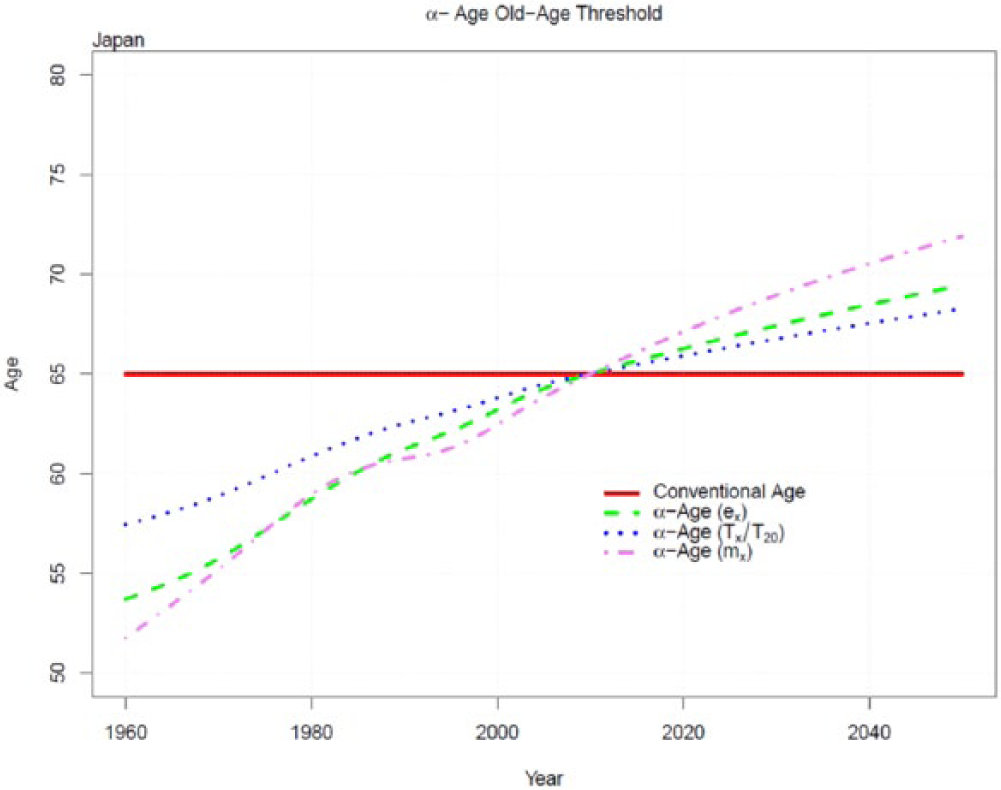
α-ages associated with three population aging characteristics—remaining life expectancy (ex), the mortality rate (mx), and the life-course ratio (Tx/T20)—for Japan.
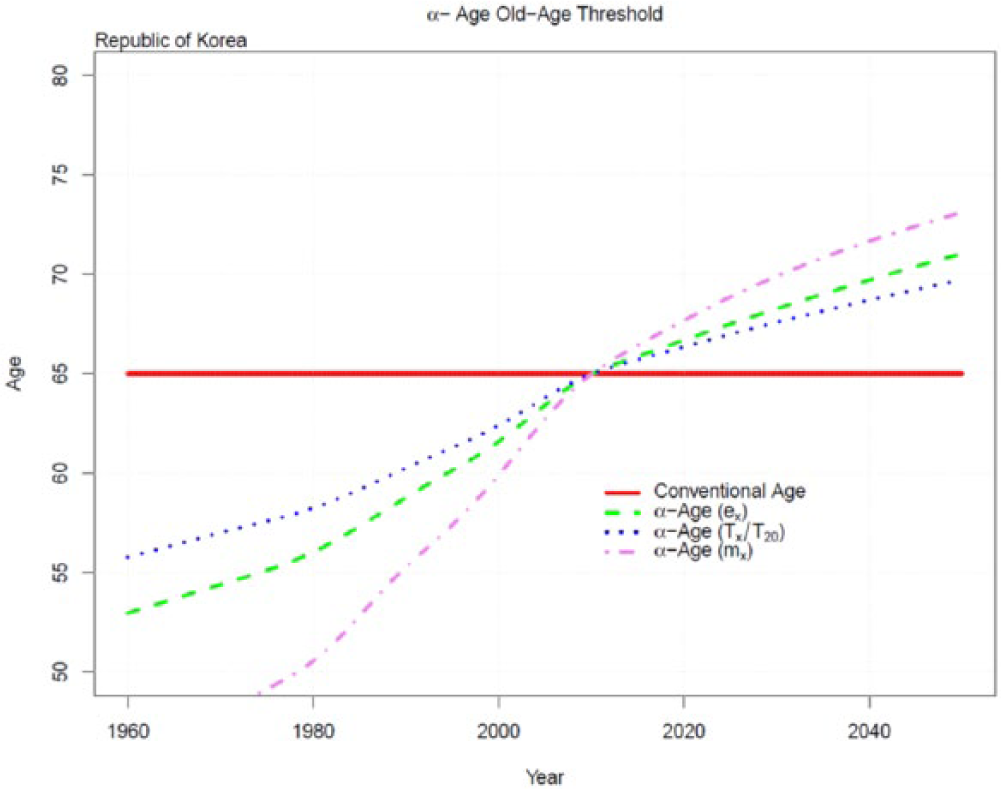
α-ages associated with three population aging characteristics—remaining life expectancy (ex), the mortality rate (mx), and the life-course ratio (Tx/T20)—for Republic of Korea.
The α-age ex transition trajectory shows the chronological ages that had the same remaining life expectancies as observed in the country at age 65 in 1965. The α-age mx trajectory shows the chronological ages at which people had the same single-year mortality rate as was observed in the country at age 65 in 1965. The α-age Tx/T20 transition trajectory does the same thing for the life-course ratio. For example, if the selected characteristic is the mortality rate, mx, then around 2040, a 70-year-old person in Japan is projected to have the same mortality rate as a 65-year-old person had in 2010. The same rate was observed in 1970 for a 55-year-old person. The red solid line in Figures 9 and 10 indicate the chronological age 65.
From Figure 9 and 10, we observe that the mx-based α-ages rise faster than the α-ages for the other two characteristics, and the α-age based on the life-course ratio rises most slowly. It also demonstrates that if the age at eligibility for a public pension would correspond to the old age threshold based on life-course ratio, then people who begin receiving pensions would become, on average, healthier over time.
In Figures 11 and 12, we estimate OADRs that correspond to α-ages based on characteristics described above. We call them α-OADRs. We can clearly see that the temporal changes in traditional OADRs and α-OADRs are very different. The graphs for α-OADRs based on ex for the Republic of Korea and Japan differ considerably from similar charts in Figure 8. The reason is that in Figure 8, the calculation of the prospective OADR was computed assuming an old age threshold of 15 years of remaining life expectancy. In Figures 11 and 12, remaining life expectancy is fixed at different levels. The levels of the remaining life expectancy at age 65 in 2010 for Japan and the Republic of Korea are 21.3 and 19.3 years, respectively, in those figures.
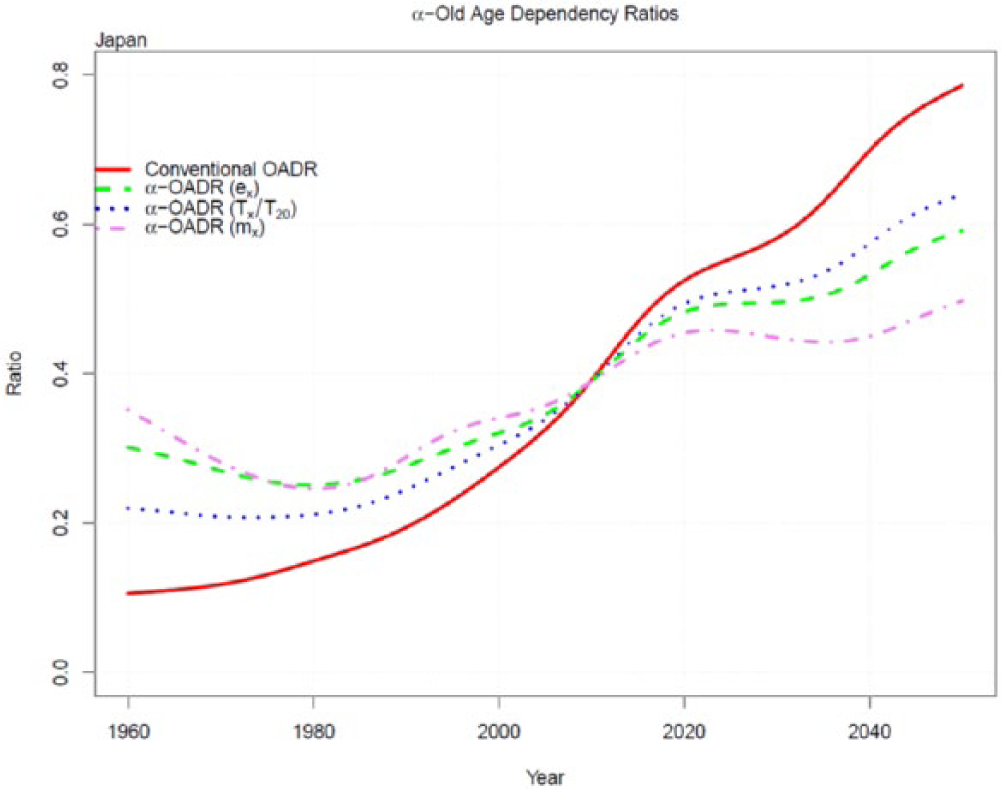
α-OADRs computed using the three α-ages in Figure 8, and conventional OADR, Japan.
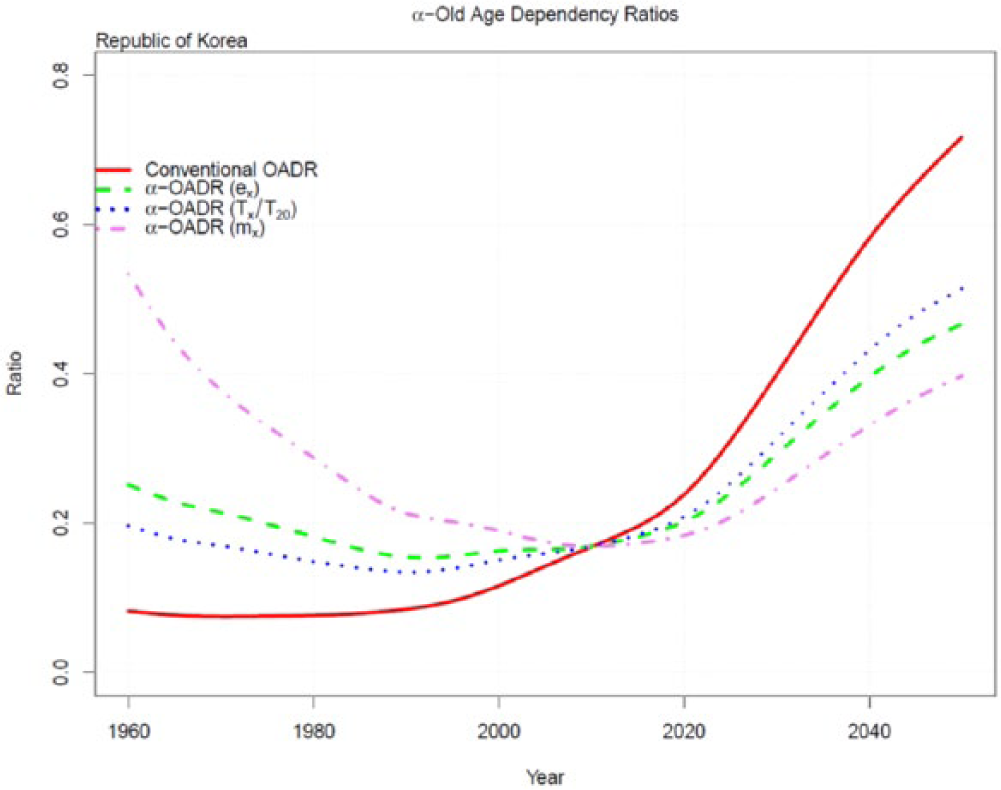
α-OADRs computed using the three α-ages in Figure 9, and conventional OADR, Republic of Korea.
Characteristics Approach: More Applications
In the previous section, we employed the characteristics approach to study the changes of α-ages that occur in time in one population. We fixed a particular characteristic in a population and observed the changes of α-ages that correspond to that characteristic at different times. However, the characteristics approach can be used more generally. To evaluate α-ages, we always need two characteristics schedules. They may belong to the same population, but at different points in time, and this results in the α-age dynamics that were shown in the previous sections. We may also use different populations or population subgroups at the same time point. Selecting one of the populations as a reference, we could analyze the difference in a group of populations in a relation to the selected reference characteristic schedule. Depending on our task, this analysis may be performed as a static one, where α-ages are calculated for each population or population subgroup at a single point of time, or in addition characteristic schedules, including a standard one, may be changing with time and, thus, analyzed at different time points.
Another interesting way of using the characteristics approach is to look at two characteristic schedules and to calculate α-ages not just for one particular age, but for a set of ages.
We illustrate this with three examples. In Figure 13, we show the α-ages of men in Iceland, Germany, China, and Russia at age 65 in 2013 based on their remaining life expectancy at that age. As a standard characteristic schedule, we use the remaining life expectancy by age of Japanese men in 2013. For each country, we take the remaining life expectancy at age 65 and estimate the age where the remaining life expectancy in the Japanese life table has the same value. For example, Russian males at age 65 have the same remaining life expectancy as Japanese men at age 73.7. However, males in Iceland at age 65 have the same life expectancy as Japanese men had at age 64.7.
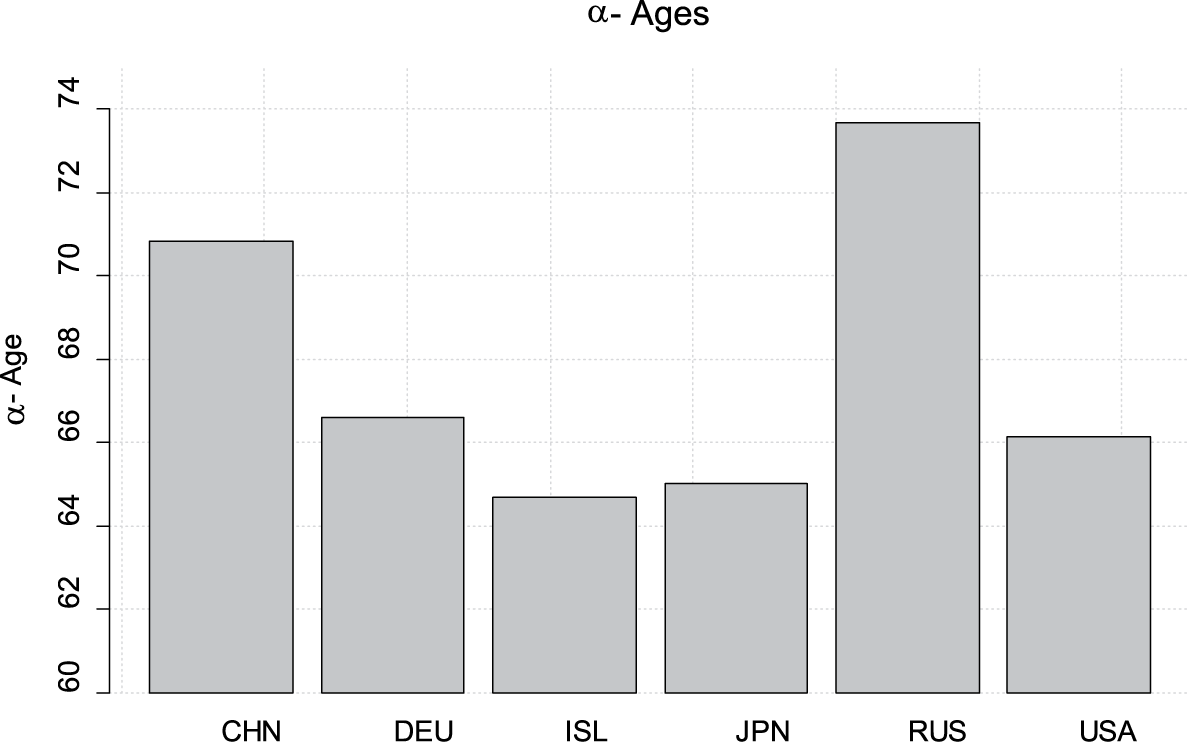
α-ages of 65-year-old men in China, Germany, Iceland, Japan, Russia, and the United States.
In Figure 14, we present an example of what we call a characteristic impact trajectory (CIT). In this particular case, the characteristic is the 5-year survival probabilities of males and females, and it is calculated using life tables in the following way. At each chronological age, we evaluate the survival probability of males and find out at what age the same survival probability is observed for the female population. The difference between this age and chronological age is shown in the figure. In the case of Russia, males at age 40 have the same 5-year survival probability as females who are almost 17 years older. The survival probability of 70-year-old males corresponds to the survival probability of females at the age of 77.2.
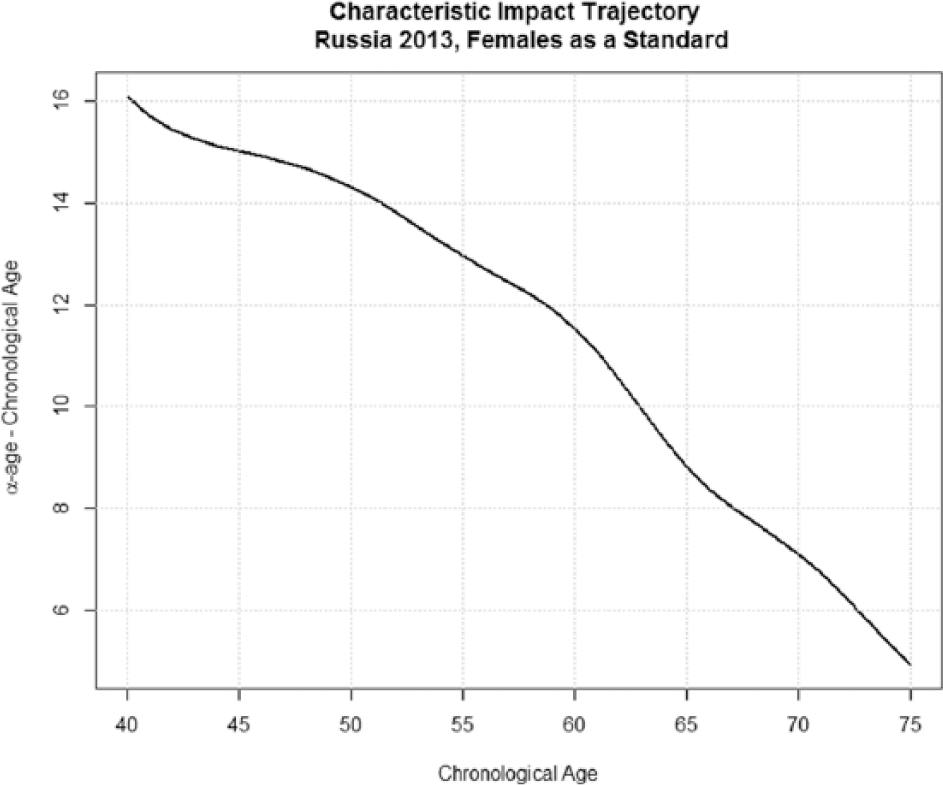
CIT associated with 5-year survival probability, Russia, 2013.
In Sanderson and Scherbov (2014), we introduced characteristic schedules based on grip strength classified by age, gender, and two levels of education—a high school education or more and those with less than a high school education. Data were obtained from the Health and Retirement Study (HRS). As the standard characteristic schedule, here, we employ the grip strength of males and females with a lower educational level at different chronological ages. From Table 2, we see that in terms of grip strength, a less educated White male at age of 60 performs the same as a 6 years older, more educated male. A similar situation is observed for White females. Thus, in terms of grip strength, which reflects the upper body performance, females and males with a high school education or more age less rapidly than those with less than a high school education.
Age of More Educated People Who Have the Same Hand-Grip Strenght as Less Educated People of the Indicated Age, Means, and 95% Confidence Intervals.
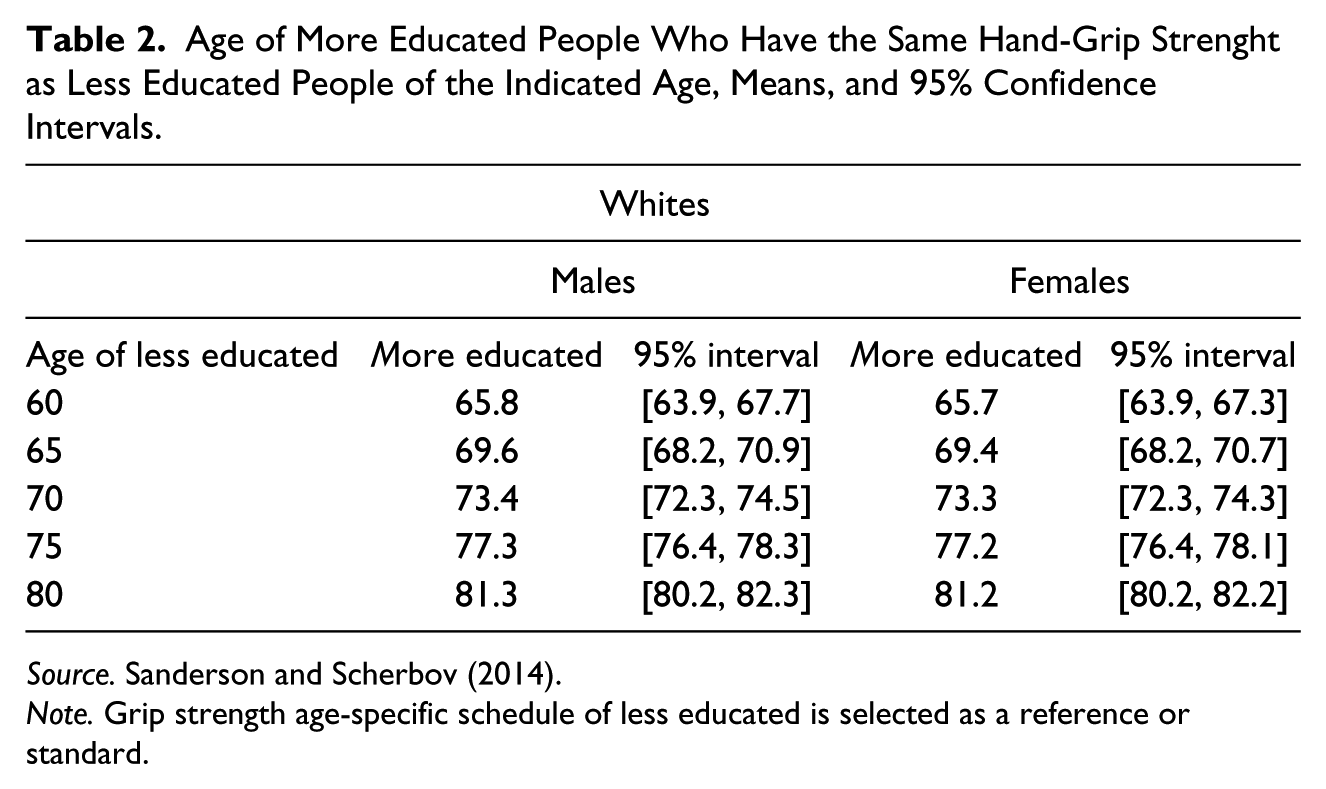
Source. Sanderson and Scherbov (2014).
Note. Grip strength age-specific schedule of less educated is selected as a reference or standard.
Discussion
Our calculations show that there are important dimensions in which aging will occur much more slowly than is apparent from the conventionally computed measures. For instance, retired people are already more likely to take courses to help them enjoy new leisure time activities because they have more expected years of life. It is not a big surprise these days to see people studying to get their second or even first university degree at ages approaching 50. That would have been very unusual a century ago, but it will certainly continue to become more common in the future. Requests for and the provision of certain medical procedures also depend on the number of remaining years of life. One example of this is knee replacement surgery, which is now often performed on people above the age of 70. It would not make much sense to do this if the operation did not significantly increase a person’s number of years of mobility.
It is important to have characteristic-based measures of age, not only because many behaviors are influenced by a person’s expected remaining years of life but also because important economic and social magnitudes depend on it as well. For example, medical expenditures are especially high in the last years of life. In forecasting these expenditures, it is important to take into consideration that, with increasing life expectancies, those last years of life happen at an ever older age. Forecasting medical expenditures only on the basis of chronological age produces figures that are too high and could lead to erroneous policy decisions. The same is true with respect to forecasts for specific health-related items, such as the need for nursing home beds.
α-ages may also help in assessing future policies concerning the age at the entitlement to a full public pension. By computing α-ages based on life-course ratio at the current entitlement age and holding it constant in population forecasts, we demarcate the border between policies that allow people to have a fixed proportion of adult person-years in receipt of a full public pension and those that do not (Sanderson & Scherbov, 2015).
α-age can also be useful in determining likely changes in the concerns of future voters. Thus, for many reasons, supplementing the concept of age with the concept α-age allows us to analyze aging more deeply than if we were to use only one age measure. The broader view of aging that we recommend, incorporating both backward-looking and forward-looking measures, is crucial if we are to understand and react appropriately to the challenges of population aging.
Footnotes
Declaration of Conflicting Interests
The authors declared no potential conflicts of interest with respect to the research, authorship, and/or publication of this article.
Funding
The authors disclosed receipt of the following financial support for the research, authorship, and/or publication of this article: This work was supported by the European Research Council (Grant ERC2012-AdG 323947-Re-Ageing).