
Abstract
Understanding and working to address the health and well-being disparities observed within the U.S. aging minority populations is a public health priority of the 21st century (Ng et al., 2014; Reyes & Hardy, 2015; Vega, Markides, Angel, & Torres-Gil, 2015). Racial and ethnic minority elders represent the fastest growing segment of the older population. While the proportion of non-Hispanic White older adults is projected to decline by more than 20% between 2010 and 2050, the Black older adult population is projected to increase by 10% and the Asian older adult population by 11% during the same period. Older Hispanics will experience the most dramatic increase: almost 14%. By 2050, Hispanics will be the largest minority group of older adults in the United States (Vincent & Velkoff, 2010). This demographic shift stems partly from the large population of working-age adults who immigrated to the United States during the 1980s and 1990s who are aging into the 65 and older group, as well as the fact that many immigrants are gaining citizenship and sponsoring their parents to come to the United States. Currently, older immigrants account for 15% of the 40.4 million adults age 65 and older in the United States (Population Reference Bureau, 2013).
The growing diversity of the older adult population calls for a better understanding of the factors associated with their successful aging. A significant proportion of older minorities share a history of lifelong disadvantage that influences their aging experiences (Jackson, Govia, & Sellers, 2010). As a result, when successful aging is defined by income/wealth and education, and absence of physical and cognitive impairments, older minorities tend to be considered less successful than their non-Hispanic White peers (Cené et al., 2016). However, as previous studies have argued (Calvo, Carr, & Matz-Costa, 2017; Mejía, Ryan, González, & Smith, 2017), later-life success may be also defined by individuals’ appraisals of their own well-being (Angel, 2009; Jeste & Palmer, 2013). Life satisfaction, a core component of subjective well-being, does not establish a set of predetermined factors to gauge success. Instead, it allows individuals to assess the quality of their lives according to their own standards (Pavot & Diener, 1993).
Life satisfaction is an important health outcome in and of itself, but higher levels are also associated with other health benefits (George, 2010). Satisfied older adults have been shown to live longer and healthier lives (Diener & Chan, 2011; St. John, Mackenzie, & Menec, 2015), as well as to age with higher functional capacity (Steptoe, de Oliveira, Demakakos, & Zaninotto, 2014) and cognitive function (Peitsch, Tyas, Menec, & St. John, 2016). However, despite the growing relevance of subjective measures of well-being as complementary indicators of successful aging, there is little research on the life satisfaction of aging minorities, particularly by nativity status.
Prior to the research reported by Calvo et al. (2017), there had been no published research that examined disparities in the life satisfaction of older Hispanic immigrants, relative to their native-born Hispanic and non-Hispanic counterparts (i.e., the interaction of ethnicity and nativity). In this study, Calvo et al. found what might be termed a “happiness paradox”—that older Hispanic immigrants had significantly higher levels of life satisfaction than native-born Hispanics and non-Hispanic Whites in the United States, despite experiencing the greatest financial disadvantage and the most functional limitations of all groups examined. This counterintuitive finding is in line the “Hispanic paradox” (Markides & Coreil, 1986), which refers to the observation that older Hispanics in the United States tend to have better health outcomes than non-Hispanic Whites despite their limited socioeconomic resources. Given that the Hispanic paradox is believed to stem from cultural and/or social factors specific to immigrants of Hispanic origin, there is a particular need for research that disentangles the interaction between race/ethnicity and nativity status in life satisfaction. In other words, it is unknown whether the “happiness advantage” observed among Hispanics also exists for immigrants from other ethnoracial groups. Disentangling this paradox is the goal of the present research.
While it is important to acknowledge that there are significant differences within minority groups, especially among Hispanics, older Hispanics and African Americans tend to have lower incomes and more cognitive and functional limitations than their non-Hispanic peers (Jackson et al., 2010). Identifying the specific factors associated with their life satisfaction is particularly important as it may inform interventions that are tailored to increase the subjective well-being of vulnerable groups of older adults.
Drivers of Life Satisfaction Differences in Older People
Life satisfaction is often understood as a personal assessment of one’s own well-being, and captures individuals’ happiness derived from optimal functioning (McDowell, 2010). It has been shown to provide a valid and reliable measure of subjective well-being in later life (Diener, Inglehart, & Tay, 2013) because it relates to psychological and physical health (Diener & Seligman, 2004), and is an indicator of successful aging (Jeste & Palmer, 2013).
Life satisfaction research later in life has been informed by theories of social stratification (George, 2010). A classic in the sociological literature since Marx and Weber debated the foundations of social inequality (Weber, 1947); social stratification theories deal with the role that societal norms and structures play in granting opportunities to individuals (Lenski, 1966). In the United States, the allocation of opportunities is mostly stratified by racial and ethnic norms, and by socioeconomic status (George, 2010). From this perspective, life satisfaction later in life is expected to stem from opportunities to accumulate resources in life, such as income/wealth, education, and health, which protect individuals against stressful life events such as poverty and disease. Older minorities, and older minority immigrants in particular, have generally less opportunities to accumulate resources than their non-Hispanic White counterparts. Consequently, we would expect minorities to have lower levels of life satisfaction later in life than their better resourced counterparts.
Resource-Based Factors and Life Satisfaction
Previous research suggests that social stratification theories of subjective well-being are inconsistent with the experiences of Hispanics generally, and with Hispanic immigrants in particular, who have fewer economic resources and years of education, and more functional limitations than native-born White Americans and, yet, report much higher levels of overall life satisfaction (Calvo et al., 2017; Marquine et al., 2015). While resource-based factors may have not been entirely able to account for the Hispanic and immigrant advantage observed in previous research, this is not to say that such factors are unimportant for the life satisfaction of older minority adults (Chatters, 1988). It is well established that there is a positive, although moderate, relationship between income and life satisfaction across the life span (Cheung & Lucas, 2015).
Subjective well-being and health are also linked. Older adults with chronic illnesses are generally less satisfied with their lives. By contrast, those with higher levels of life satisfaction have been shown to live longer (Steptoe, Deaton, & Stone, 2015). In addition, human and financial capital has been shown to moderate health-related outcomes among ethnic and racial minorities (Calvo et al., 2017; Marquine et al., 2015; Shobe & Boyas, 2011). However, it is important to note that there is variation in how resource-based factors contribute to the life satisfaction of older ethnoracial groups. For instance, education has been shown not only to increase the life satisfaction of non-Hispanic Whites but also to decrease the life satisfaction of Hispanics (Baxter et al., 1998; Calvo et al., 2017).
Social Integration Factors and Life Satisfaction
Some suggest that unique cultural factors that emphasize social integration, such as familismo (strong priority placed on family relationships and reliance on family members for support) and collectivism (the needs, goals, views, and beliefs of the group are emphasized over those of the individual) (Schwartz et al., 2010), may drive the happiness advantage observed among older Latinos by counteracting the negative effects of a lack of resources (Knight & Sayegh, 2010). As a result, it is plausible that the happiness advantage that Hispanics experience might not translate to other groups, or may be driven by other factors.
Social integration is one factor that has long been tied to subjective well-being among older adults (George, 2010). It can be measured along three sets of indicators: institutional engagement, household composition, and informal interactions. Institutional engagement, or engagement in church activities, work, or volunteering, has been linked to health and well-being in later life (Greenfield & Marks, 2004; Kuwert, Knaevelsrud, & Pietrzak, 2014; Rote, Hill, & Ellison, 2013). It is thought that such activities enhance health and well-being primarily through meaningful social interactions (Li & Ferraro, 2005). With regard to household composition, those who do not live with a spouse or partner either due to widowhood, divorce, separation, or never having married are at significant risk for negative health and well-being (Lim & Kua, 2011), while coresiding with adult children has been shown in some research to be beneficial for older adults (Courtin & Avendano, 2016). Third, informal interaction refers to having friends and relatives that live nearby and those that they can rely on for help when needed, both of which have been found to relate strongly to health and well-being outcomes (Lubben & Gironda, 2003). Finally, discrimination is a factor that negatively affects the subjective well-being of individuals later in life by decreasing longevity (Barnes et al., 2008).
Some social integration factors may differentially benefit some groups over others. For instance, older African Americans participate more often in religious activities than other ethnoracial groups, and this institution offers a particularly beneficial resource for coping with challenges in life, which translates to a life satisfaction advantage for African Americans relative to other groups (Taylor, Chatters, & Jackson, 2007). This benefit may be equally relevant for Black immigrants, who are also known to be strongly connected with religious institutions. Similarly, interacting with co-ethnics in the neighborhood, a social integration indicator of informal interactions, seems to be particularly beneficial for older Hispanics (Eschbach, Ostir, Patel, Markides, & Goodwin, 2004).
It is clear that these kinds of social integration resources shape life satisfaction in later life in important ways (McAuley et al., 2000; Park, Roh, & Yeo, 2012; Tang, Copeland, & Wexler, 2012). What is less clear is if these factors differentially shape life satisfaction for immigrants relative to native-born peers across ethnoracial groups. Thus, the current study seeks to build on previous research to explore the following questions:
Method
Data and Sample
Our sample was drawn from the Health and Retirement Study (HRS). The HRS is a nationally representative panel survey of adults above the age of 50 in the United States. It oversamples for Hispanics and Blacks, is offered to respondents in English or Spanish, and has been conducted biennially since 1992 (Sonnega et al., 2014). Our primary outcome measure comes from the psychosocial Leave Behind Questionnaire (LBQ), which was fully implemented in the 2006 survey. A randomized selection of half of all survey participants in 2006 was surveyed, and the other half of the HRS households completed the psychosocial LBQ in 2008, with each biennial survey alternating such that each participant completes the survey every 4 years. The response rate for the 2012 LBQ was 77%, based on the sample indicator variable, PSYSOC12, included in the HRS tracker file. This response rate represents the proportion of people who completed the LBQ relative to those who were randomly selected from the core survey for the 2012 survey year. Data on completion rates for the 2014 LBQ are not yet available. However, previous waves show similar response rates. For the purposes of this study, we created a pooled cross-sectional sample of all individuals who completed the LBQ in 2012 or 2014. Individuals 60 years of age and older were included in our final sample (n = 7,348). One observation period was used for each individual.
Measures
Dependent variable
Life satisfaction was measured using the Satisfaction With Life Scale (SWLS; Diener, Emmons, Larsen, & Griffin, 1985). The SWLS captures satisfaction with life as a whole based on respondents’ answers to five items (Pavot & Diener, 1993): (a) “In most ways, my life is close to ideal”; (b) “The conditions of my life are excellent”; (c) “I am satisfied with my life”; (d) “So far, I have gotten the important things I want in life”; and (e) “If I could live my life again, I would change almost nothing.” Answers ranged from 1 (strongly disagree) to 7 (strongly agree) in both the 2012 and 2014 waves of data.
The SWLS has shown validity and reliability across languages (Pavot & Diener, 1993), including English and Spanish (Vázquez, Duque, & Hervás, 2013). The Cronbach’s alpha for life satisfaction was .79 for our total sample. In addition, we tested the SWLS alpha within each ethnoracial group by nativity. Scores ranged from .71 (native-born Blacks) to .84 (foreign-born Hispanics). Scores were averaged if there were at least two nonmissing values and then standardized using z scores. Scores approximated a normal distribution. Analyses use robust standard errors to account for heteroskedasticity.
Independent variable
Our main variable of interest combined information on race and ethnicity, and nativity status. To capture race/ethnicity, we identified four groups. First, if individuals identified as Hispanic, they were identified as Hispanic regardless of their race. Among non-Hispanics, individuals were asked, “Do you consider yourself primarily White or Caucasian, Black or African American, American Indian, or Asian, or something else?” Individuals who identified as White were coded as non-Hispanic White. Individuals who identified as Black were coded as non-Hispanic Black. The publicly available version of HRS does not allow for further differentiation among other ethnoracial groups. Thus, our final ethnoracial category included non-Hispanic Other Race. Next, nativity status (native/immigrant) was determined using participants’ responses to the question of whether they were born in the United States. We combined these two variables to create an eight-level categorical variable: (a) our reference group, which included non-Hispanic Whites, native-born (n = 5,642); (b) non-Hispanic Whites, foreign-born (n = 251); (c) non-Hispanic Blacks, native-born (n = 807); (d) non-Hispanic Blacks, foreign-born (n = 55); (e) Hispanics, native-born (n = 263); (f) Hispanics, foreign-born (n = 175); (g) non-Hispanic Other Race, native-born (n = 90); and (h) non-Hispanic Other Race, foreign-born (n = 65). Given the small sample size for some of the immigrant ethnoracial groups, we conducted power analyses to ensure that the sample sizes provided sufficient power to observe statistical differences. Result suggested that the samples were sufficiently large.
Control variables
Sex was dichotomously coded as: 1 = female, 0 = male. To account for the time individuals have spent in the United States since migration, we controlled for years in the United States. This variable reflects the current age of native-born respondents and the number of years in the United States for foreign-born respondents. As the number of years in the United States is highly correlated with age and these two effects are confounded in most statistical models, we conducted sensitivity analyses to assess which of the two variables to include in our models. Years in the United States produced a better model fit in multivariate analyses than did age; thus, we retained years in the United States and did not control for age in the analyses.
Three measures of resource-based factors were controlled for in our analyses: education, wealth, and health. Education included completed years of schooling, ranging from 0 to 17. We measured wealth as all nonhousing assets less all debt. Assets here include real estate, transportation (vehicles), business, Individual Retirement Arrangement’s (IRA’s), stocks, mutual funds, checking and savings accounts, Certificate of Deposit’s (CD’s), savings bonds, treasury bills, bonds, and other savings. Cubbin et al. (2011) argued that wealth may be more important to examine in relation to health and well-being outcomes than income among older adults, as income typically drops dramatically following retirement. Furthermore, given that many immigrants lack housing wealth relative to native-born older people (Shobe & Narine, 2006), we excluded housing assets from our measure of wealth. We use the RAND version of the HRS core variables, which includes imputed values for all financial variables, including wealth (RAND Corporation, 2016). We adjusted for the asymmetry of the wealth distribution by transforming this variable using an inverse hyperbolic sine. Health was measured using a comprehensive indicator of functional limitations. Specifically, our measure was a count of deficits in (a) walking one-half mile (five to six blocks); (b) walking around in the house; (c) getting out of a bed or chair; (d) walking up a flight of stairs (about 10 steps); (e) shopping for personal items; (f) preparing meals; (g) managing money, such as paying bills; (h) using the telephone; (i) feeding oneself; (j) dressing oneself; (k) bathing oneself; (l) getting to and using the toilet; (m) lifting or carrying something as heavy as 10 pounds; (n) reaching out and above head with arms; and (o) gripping small objects with hands. Our measure is a sum of all items, ranging from 0 to 15.
We controlled for three domains of social integration: institutional engagement, household status, and informal interactions. Institutional engagement was measured with three dichotomously measured variables: church attendance, engagement in formal volunteerism, and paid work. Church attendance was a measure of individuals who attend church once a month or more frequently. Volunteer was a measure of individuals who had volunteered in the last 12 months at an organization. Paid work was a measure of individuals who have worked for pay during the last month. Household composition was measured using two dichotomously coded variables: (a) an indicator of whether or not an individual coresided with a child; and (b) an indicator of whether an individual was married. Informal interactions were measured using three indicators. First, we measured whether an individual indicated that, should they need help with everyday living activities, a friend or family member would be available to provide care in the future. Second, we measured for whether the respondent indicated that at least one friend lives in their neighborhood. Finally, we measured for whether the respondent indicated that at least one relative lives in their neighborhood.
We also included a measure to control for everyday discrimination, which plays an important role in shaping health among minorities in the United States (Williams, Neighbors, & Jackson, 2003). Our measure of everyday discrimination was based on the question “In your day-to-day life, how often have any of the following things happened to you?” with the following associated six questions: (a) You are treated with less courtesy or respect than other people; (b) you receive poorer service than other people at restaurants or stores; (c) people act as if they think you are not smart; (d) people act as if they are afraid of you; (e) you are threatened or harassed; and (f) you receive poorer service or treatment than other people from doctors or hospitals. Response categories included (1) almost every day, (2) at least once a week, (3) a few times a month, (4) a few times a year, (5) less than once a year, (6) never. The measure is a scale created by reverse-coding all items and calculating an average (α = .81).
Analytic Strategy
To address our research questions, we started by comparing the characteristics of native-born versus foreign-born individuals within ethnoracial groups, using bivariate t tests or chi-square tests to identify significant differences. Second, we estimated several ordinary least squares (OLS) regression models to control for differences. In Model 1, we regressed life satisfaction on the ethnoracial groups by nativity only to examine the unadjusted relationship between the groups and life satisfaction. In Model 2, we adjusted for resource- and nonresource-based factors, as well as for demographic characteristics. Finally, to address our second research question, we tested for resource-based and nonresource-based moderators that may explain immigrant advantages across ethnoracial groups by nativity. Significant interaction effects were tested using adjusted Wald tests, and we reported only those that were significant after adjusting for all other factors. In addition, to further examine significant moderating effects, we calculated marginal probabilities of life satisfaction for the different ethnoracial groups by nativity status holding all other covariates in the model at their mean. We conducted our analyses using Stata SE 14.
Results
Descriptive Information and Bivariate Analysis
Table 1 provided the descriptive data for the sample. The majority of the sample was native-born (93%), female (59%), and married (62%), and the mean education level was 13.1 years. Participants had, on average, 1.27 functional limitations. With regard to our various indicators of social integration, more than half attended church on a regular basis (56%), two out of five volunteered (42%), and a little over a quarter engaged in paid work (27%). Two thirds said future care was available to them (65%), about one in five coresided with a child (19%), two thirds said they had good friends in their neighborhood (67%), and one quarter had relatives in their neighborhood (26%).
Descriptive Characteristics and Correlates of Life Satisfaction by Ethnic/Racial and Nativity Group.
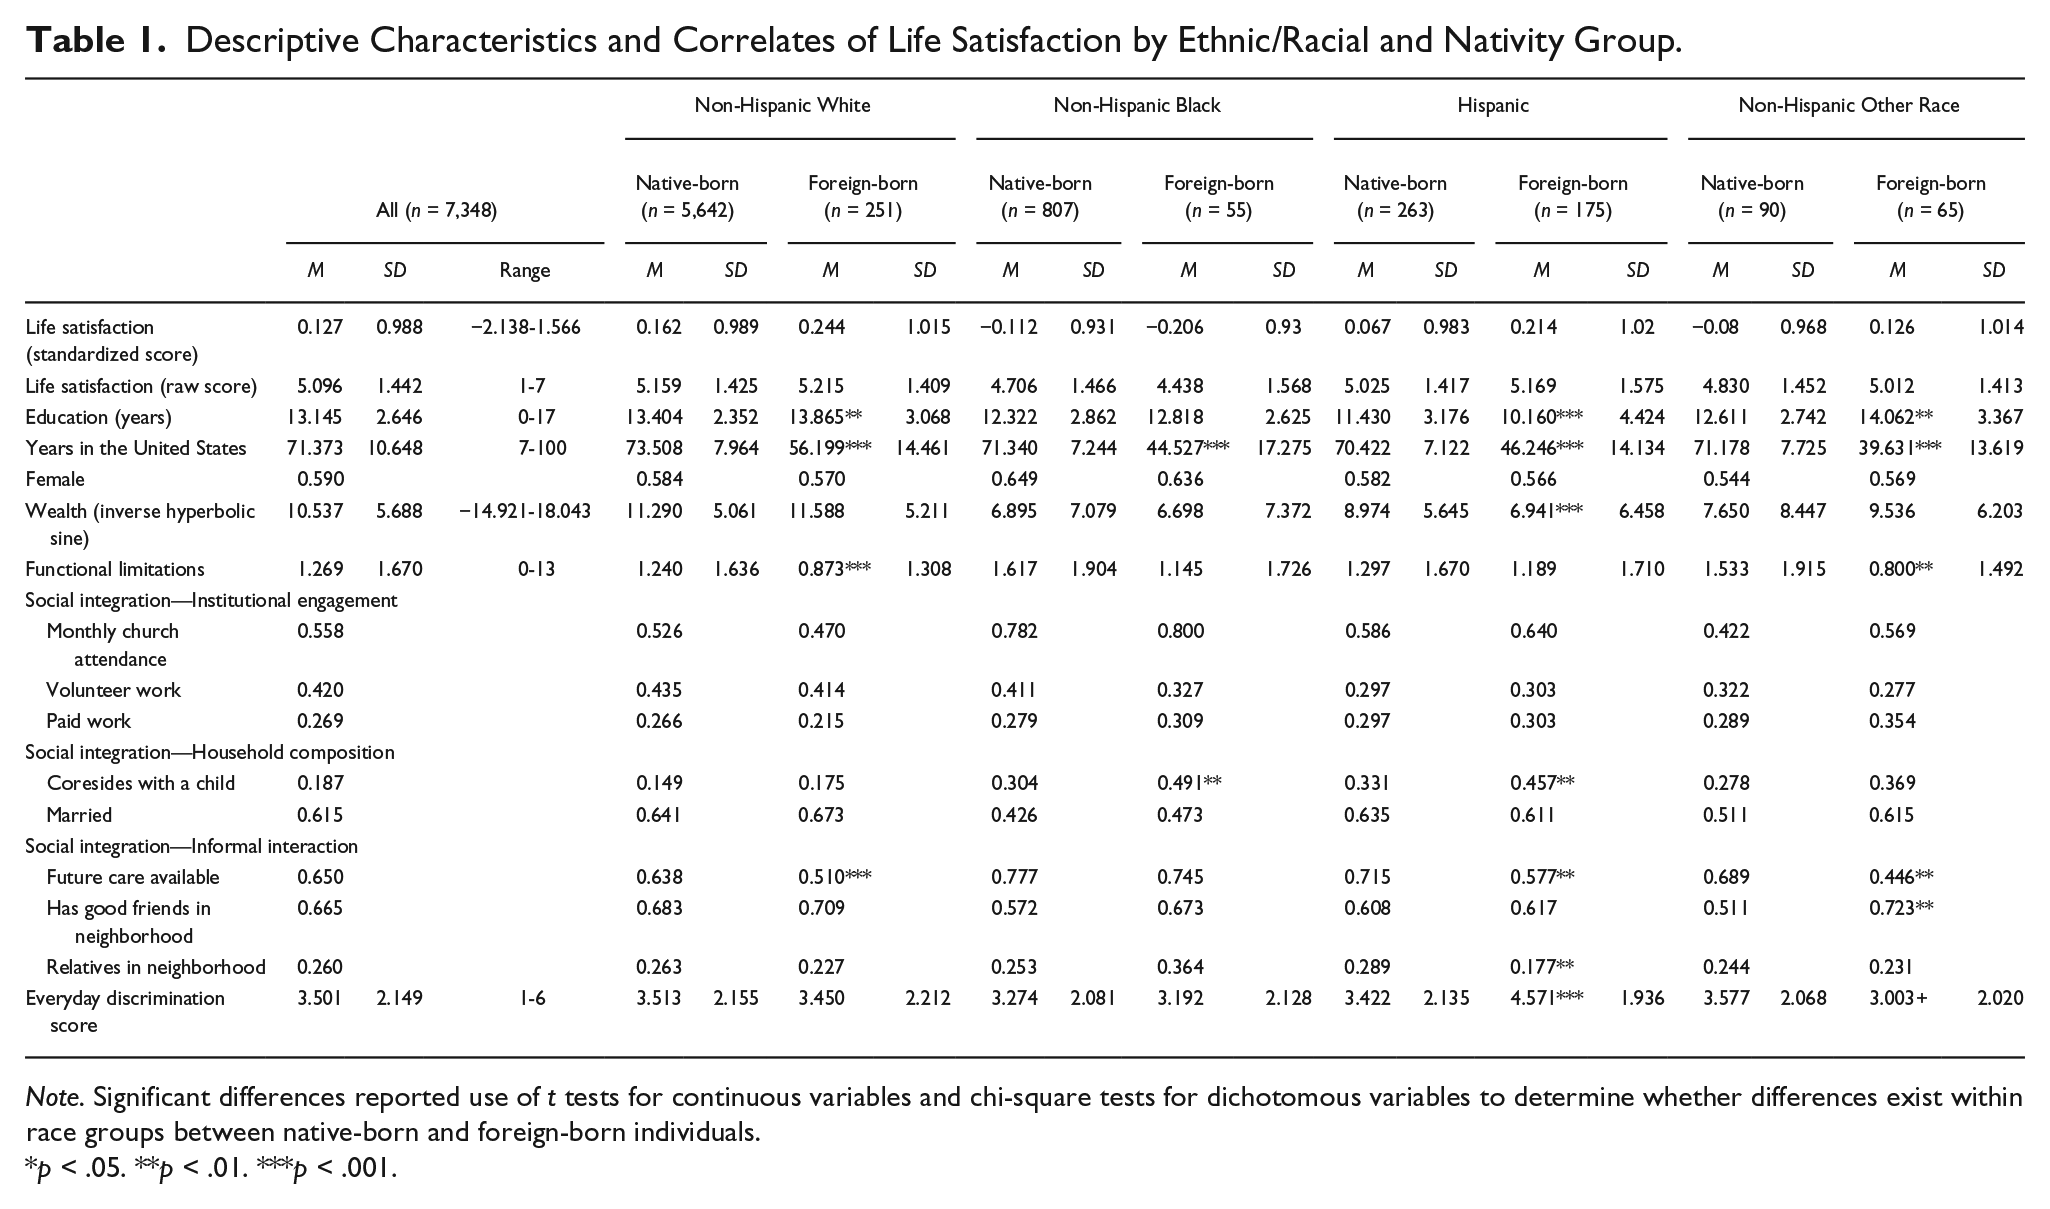
Note. Significant differences reported use of t tests for continuous variables and chi-square tests for dichotomous variables to determine whether differences exist within race groups between native-born and foreign-born individuals.
p < .05. **p < .01. ***p < .001.
We performed t tests and chi-square tests to identify significant differences in characteristics of immigrant versus native-born groups within each ethnoracial group. Results are shown in Table 1. Overall, the largest number of significant differences was found between the Hispanic groups. Foreign-born Hispanics had less education, had less wealth, were less likely to have future care available and to have relatives living nearby, and were more likely to be coresiding with a child and to experience everyday discrimination compared with native-born Hispanics. Foreign-born Whites and foreign-born Other Race had higher education, had fewer functional limitations, and were less likely to have future care available relative to their native-born counterparts. In addition, the foreign-born Other Race group was more likely than the native-born Other Race group to have relatives living nearby. The only difference for the Black groups by nativity was that foreign-born older adults were more likely to coreside with children than their native-born counterparts. In addition, there were significant differences in the number of years that foreign-born groups lived in the United States compared with native-born groups across all ethnoracial groups, with the mean for native-born groups being between 70.4 and 73.5 years, while the mean for foreign-born groups ranged from 39.6 years for the Other Race group to 56.2 for the White group.
OLS Regression and Moderation Analysis
We controlled for these significant differences between groups using OLS regression as shown in Table 2. First, we calculated coefficients for each ethnoracial group without controlling for other factors, which is provided in Model 1. In Model 2, we controlled for resource and nonresource-based correlates of life satisfaction. Accounting for these factors explains some of the nativity differences across ethnoracial groups. Foreign-born Whites, foreign-born Hispanics, and foreign-born individuals identifying as some Other Race had higher life satisfaction than native-born Whites, with this effect being the largest for foreign-born Hispanics. By contrast, Blacks (regardless of nativity status), native-born Hispanics, and native-born individuals of other races did not differ significantly in their life satisfaction from native-born Whites in Model 2.
OLS Regression Models on Ethnic/Racial and Nativity Disparities on Life Satisfaction (N = 7,348).
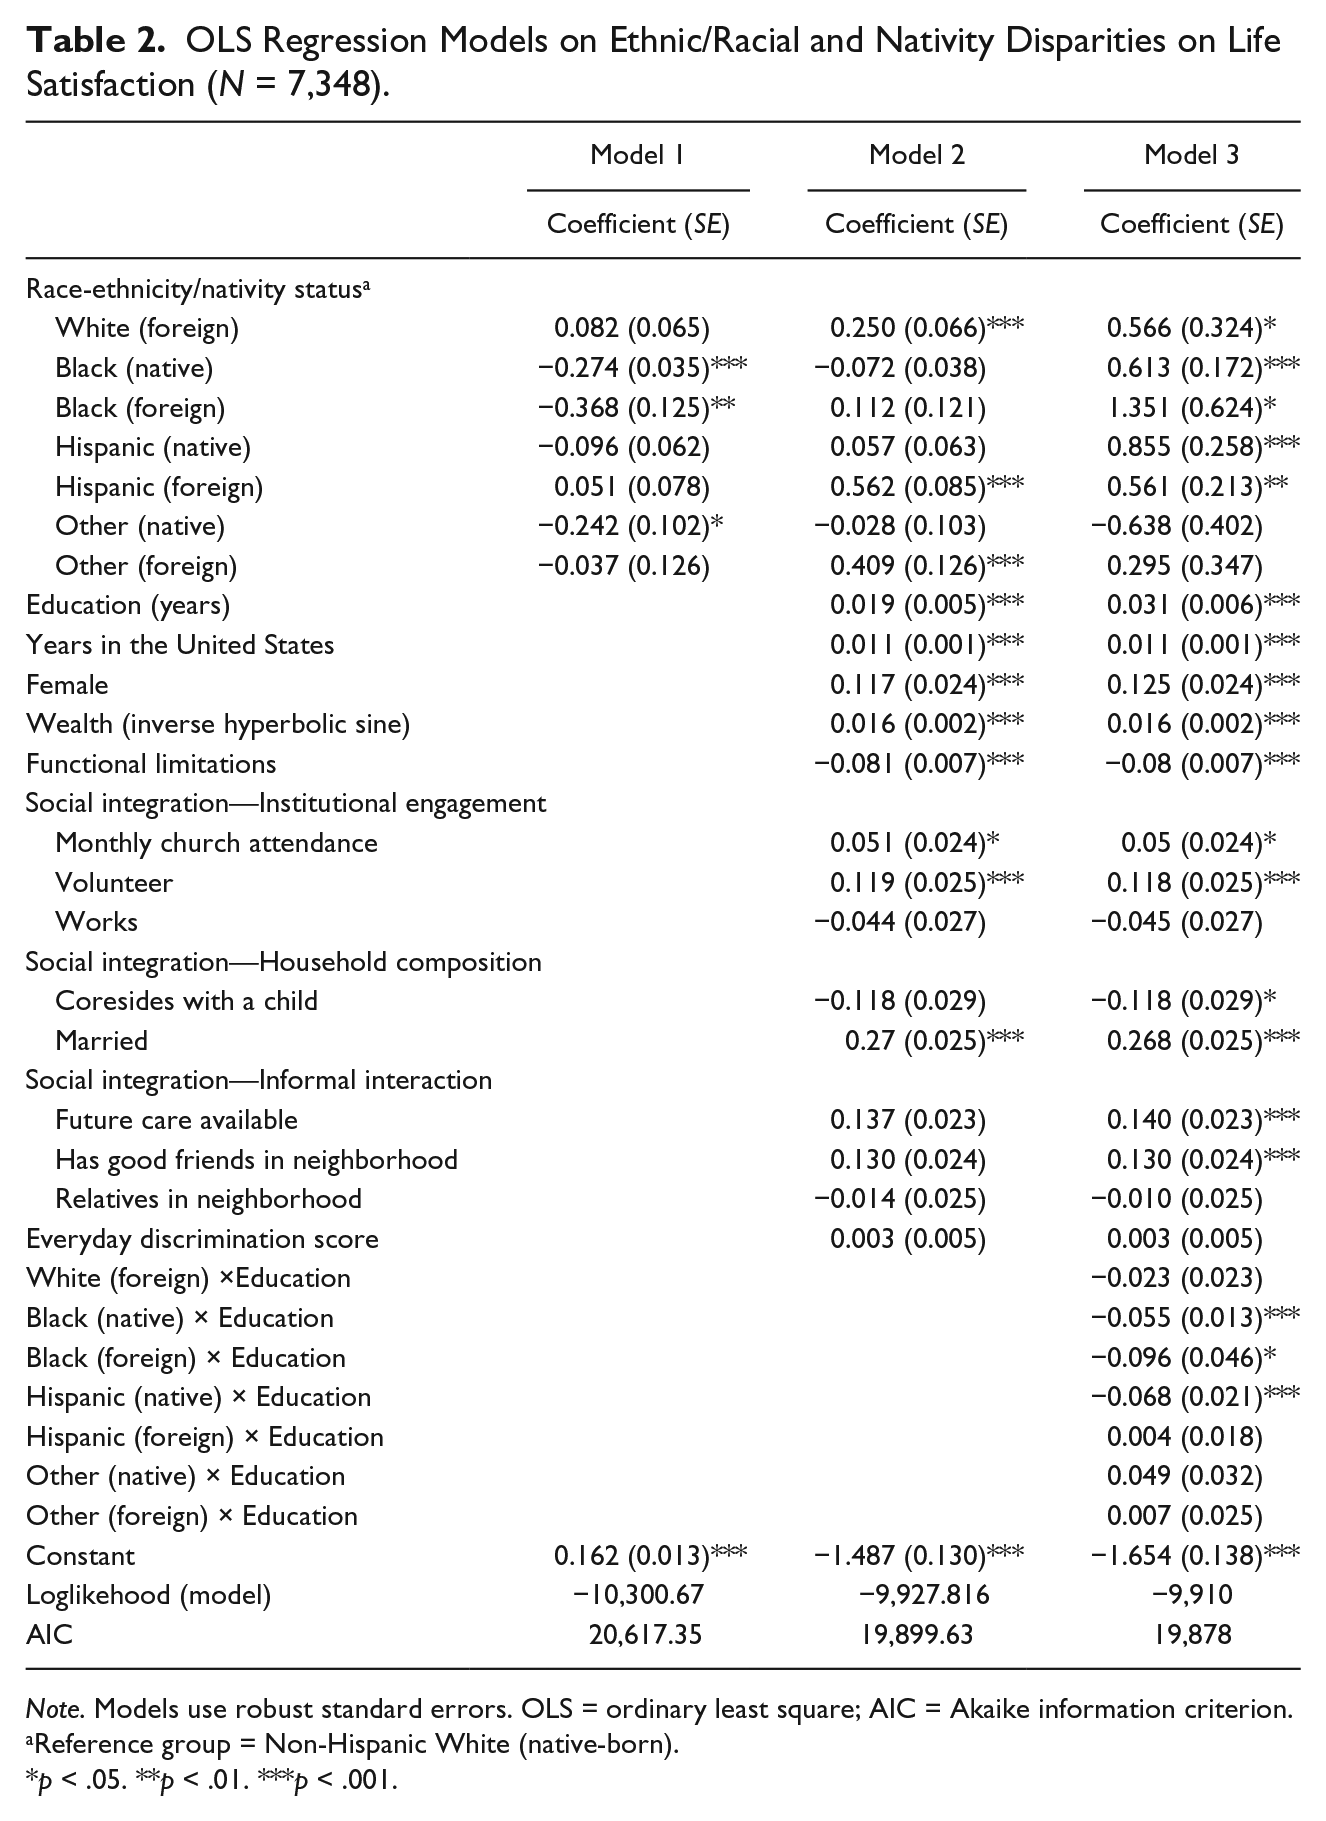
Note. Models use robust standard errors. OLS = ordinary least square; AIC = Akaike information criterion.
Reference group = Non-Hispanic White (native-born).
p < .05. **p < .01. ***p < .001.
In Model 2, we also observed several factors that were significantly related to life satisfaction: education, number of years in the United States, being female, wealth, monthly church attendance, volunteerism, and being married were all positively associated with life satisfaction, while functional limitations was negatively associated with life satisfaction.
Figure 1 provided the calculated marginal probabilities for life satisfaction based on Model 2, holding all other factors in the model at the mean. Foreign-born status seems to offer an advantage in terms of life satisfaction for all ethnoracial groups except for Blacks. Hispanics seems to have a larger advantage than the rest of groups. By altering the reference group in Model 2, we tested whether these observed differences were statistically significant (results not shown but available upon request from authors). Specifically, foreign-born Hispanics reported significantly higher life satisfaction than all the other groups (regardless of nativity), and all groups of foreign-born individuals, except for Blacks, reported significantly higher life satisfaction than their native-born counterparts. These differences were all found to be statistically significant at the p < .05 level.
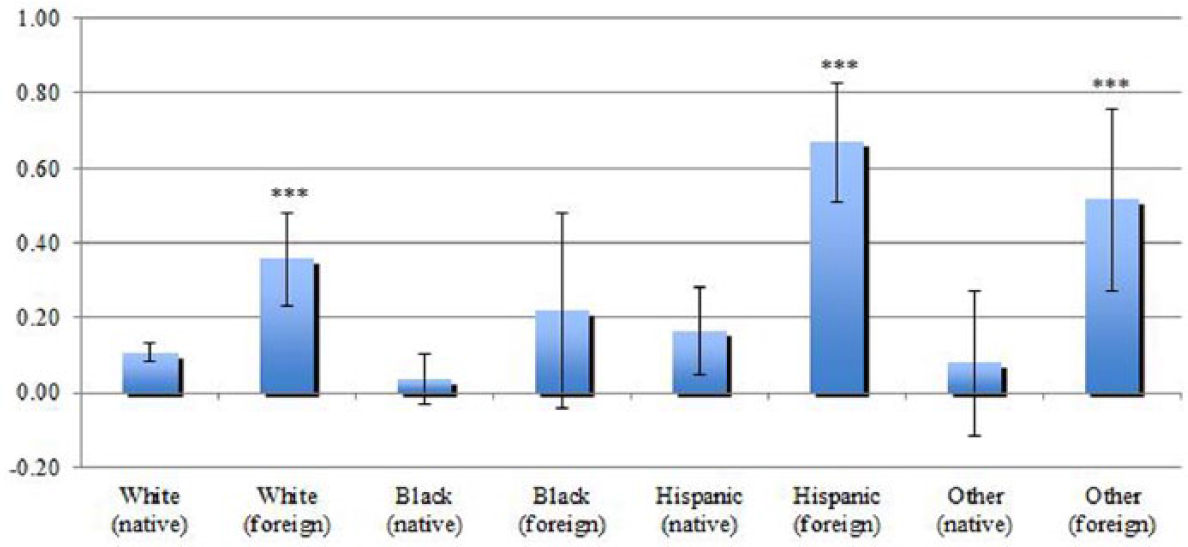
Marginal probabilities for life satisfaction by race/ethnicity and nativity status (calculated based on Model 2 and results holding all other factors in the final model at the mean).
To address our second research question, we examined resource and nonresource-based moderators of life satisfaction for ethnoracial groups by nativity. We performed a series of tests to identify moderators in these groups, and we present the only significant moderator in Model 3 of Table 2. Specifically, we found that the only moderator of life satisfaction across ethnoracial groups by nativity status was education, with a postestimation Wald test showing strong significance (p < .001). Correlates that were significant in Model 2 remained significant in Model 3, but some additional statistically significant relationships emerged when controlling for the moderating effect of education. Specifically, having future care available and having good friends in one’s neighborhood were positively associated with life satisfaction, and coresiding with a child was negatively associated with life satisfaction.
We calculated the marginal probabilities by years of education for each group, holding all other factors in the final model at the mean. These calculations are showed in Figure 2. Education was a significant moderator of life satisfaction, although its role in shaping the life satisfaction of older adults differed by group. For Whites and Other Race respondents, as education increased so did life satisfaction, with the immigrant advantage concerning happiness disappearing for Whites when higher levels of education were reached. However, there was no significant happiness immigrant advantage for Other Race groups; the educational advantage was similar for immigrants and native-born comparators. This was in part due to the sample size being small and, subsequently, very large standard errors. For Blacks, education was negatively associated with life satisfaction. For Blacks, as education increased, life satisfaction declined, and this effect was the same for immigrants and native-born participants. For Hispanics, as education increased, life satisfaction declined, but only among native-born individuals. Among foreign-born Hispanics, as education increased, life satisfaction increased. The immigrant advantage concerning happiness persisted, and even increased, with additional education.

Marginal probabilities of life satisfaction by race/ethnicity, nativity, and education (calculated based on Model 4 results and results holding all other factors in the final model at the mean).
Discussion
Prior research has shown that older Hispanic immigrants have higher levels of life satisfaction than older adults with more resources in the United States. Our study built on this literature to explore (a) if the “happiness advantage” observed among older Hispanic immigrants extended to other immigrant groups, and (b) what were the potential drivers of such disparities. To our knowledge, this is the first study that has attempted to disentangle the potential protective effect of immigrant status on the life satisfaction of older adults from diverse ethnic and racial backgrounds in the United States. Concerning the first question, our findings are novel, and reveal that, with the exception of Blacks, immigrants of all groups included in the study had higher levels of life satisfaction than comparable native-born counterparts, and this “happiness advantage” was particularly salient for Hispanics. Hispanic immigrants had the highest levels of life satisfaction of all older adults.
The finding that older immigrants have higher levels of life satisfaction than comparable native-born individuals is inconsistent with previous population-based studies. Studies have shown that immigrants were less satisfied than native-born peers in the United States (Bartram, 2011) and in other traditional destinations (de Vroome & Hooghe, 2014; Hendricks, 2015; Olgiati, Calvo, & Berkman, 2013). It is also inconsistent with other population studies conducted among Hispanic (Coverdill, Lopez, & Petrie, 2011) and Asian immigrants (John, de Castro, Martin, Duran, & Takeuchi, 2012). The only study that we were able to identify that examined disparities in life satisfaction between older immigrant and native-born individuals was conducted by Cuellar, Bastida, and Braccio (2004). Findings did not reveal significant differences in life satisfaction between older Mexican immigrants and their native-born counterparts. However, the sample in this study was likely not representative of the Hispanic older adult population in the United States as it was conducted in a border community with very high levels of poverty, and it did not examine multiple racial and ethnic categories. Moreover, the limited evidence that exists varies considerably in terms of data sources, samples, drivers of life satisfaction examined, and analytical approach. As such, it is difficult to draw definitive conclusions about the comparability of our findings with prior studies.
Concerning the second research question asking about potential drivers of the observed immigrant advantage, our findings revealed that established resource-based factors such as education and wealth and established social integration factors such as monthly church attendance and volunteerism were all positively associated with life satisfaction. By contrast, functional limitations were negatively associated with life satisfaction. Interestingly, not all resource-based factors behaved the same across ethnoracial and nativity groups. For Whites and Other Race groups, as education increased, there was an associated increase in life satisfaction, regardless of nativity. For native-born Hispanics and Black older adults, regardless of nativity, however, as education increased, there was an associated decrease in life satisfaction.
Our findings align with prior evidence on the positive effect of education on happiness for non-Hispanic White and Other Race groups. Education has long been linked to higher levels of life satisfaction (e.g., Cuñado & Pérez de Gracia, 2012). People with more human capital are generally better equipped to compete in the job market, have access to occupations associated with better quality of life (e.g., more flexible and fulfilling), and get higher salaries (Florida, Mellander, & Rentfrow, 2013; Stevenson & Wolfers, 2009). By contrast, a mismatch between expectations and reality may lie behind the negative impact of education on the life satisfaction of native-born Hispanics and of the Black communities. Educated minority populations are more likely to experience structural barriers, such as institutional discrimination, that limit their opportunities for social advancement. Using micro data from 5,000 British workers, Clark and Oswald (1996) found a negative relationship between education and happiness among individuals whose careers were not aligned with their amount of human capital. In addition, Massey and Akresh (2006) observed that more educated immigrants were less satisfied with their lives than comparable native-born counterparts because they could not fulfill their professional aspirations in destination countries. The discrepancy between aspirations and reality may stem from the fact that human capital and labor market experience accumulated prior to migration are not easily transferable in destination countries. As a result, highly educated immigrants are underemployed in low-skilled, low-wage occupations (Basilio & Bauer, 2010).
In any case, from the perspective of stratification theories of subjective well-being, our findings are counterintuitive. Not only did resource-based and social integration factors not fully account for the disparities in life satisfaction among groups, but Hispanic immigrants, the group with the least accumulated resources, reported the highest levels of life satisfaction. A potential explanation for our divergent findings could stem from our focus on long-term older immigrants. Emerging evidence shows that life satisfaction increases with time in destination countries (Angelini, Cassi, & Corazzini, 2015). The positive link between years in the United States and happiness observed across immigrant groups aligns with these findings. Our sample was mostly composed of individuals who migrated as young adults, and who had spent most of their adult life in the United States. Unlike the primarily working-age immigrants included in prior population-based studies (i.e., Bartram, 2011; de Olgiati et al., 2013; de Vroome & Hooghe, 2014), the adults in our sample were at the end of their migratory careers. Most respondents had moved to the United States decades before reaching later life and had long overcome the initial stressors associated with starting a new life in a foreign land. In other words, our sample may have been more used to life in the United States than more recent working-age immigrants included in prior studies. These circumstances may have precipitated our respondents to cast a more positive assessment about their quality of life than what has been previously observed among immigrants that are still getting used to life in a foreign country.
Alternatively, the immigrant happiness advantage may stem from social standing. It is widely acknowledged that our happiness not only depends on our life circumstances but also on how we assess such circumstances relative to others. Thus, we use downward comparisons later in life more often than we do during our youth and young/mid-adulthood, and this mechanism has been shown to account for much of the happiness increase observed among older adults (Beaumont & Kenealy, 2004; Gana, Alaphilippe, & Bailly, 2004). In addition, there is evidence that immigrants compare themselves with stayers from their home countries throughout their migratory careers (Gelatt, 2013). First-generation immigrants maintain strong ties with their home countries over the life course. Such transnational ties often result in circular migration at old age (Razum, Sahin-Hodogluil, & Polit, 2005; Vega & Brazil, 2015). In other words, immigration is not a single occurrence and first-generation immigrants tend to spend long periods of time at older age between the countries of origin and destination. Thus, it is possible that the happiness advantage found across immigrant groups stems from processes of downward comparisons with nonimmigrants from the home country. A recent study exploring disparities in life satisfaction among older Turkish immigrants and stayers from the same region of origin observed that first-generation immigrants reported higher levels of happiness than counterparts that never left home (Baykara-Krumme & Platt, 2016). Finally, it is well-established that most immigrants advance socially and economically with time in destination countries (e.g., Constant & Massey, 2005). It is plausible that immigrants in our sample compared their lifelong achievements both with compatriots from the home country and with themselves at the beginning of their migratory careers, and that these comparisons boosted their life satisfaction.
Limitations
Findings from this study do not come without limitations. First, and perhaps most importantly, it should be noted that caution should be applied in interpreting these findings, given that the sample of foreign-born Blacks (n = 55) and of foreign-born “Other Race” groups (n = 65) were quite small. However, we are not aware of any nationally representative studies on life satisfaction disparities among older adults that have sample sizes any larger for these subgroups. Future studies are needed that explore whether these findings hold true with larger sample sizes of foreign-born older adults from various ethnoracial backgrounds.
Second, we did not have premigration data, which precluded us from adjusting for selection effects. It is possible that those who choose to migrate are generally healthier and happier than those who choose not to migrate; however, it is important to note that evidence has not supported this hypothesis. A study conducted by Graham and Markowitz (2011) across 18 countries in Latin America showed that unhappiness drove migration and not the other way around. Another possibility is that unhappy immigrants were systematically excluded from our sample because they returned home or because they were deceased. Unhappiness and higher mortality risk have been linked in the literature (Kim et al., 2016; Markides & Lee, 1990).
Third, this study relies on observational data and thus limits our ability to draw causal conclusions about the relationships between immigration and life satisfaction among different racial/ethnic older adult groups. Future research should collect more information regarding why different groups are satisfied with their lives to try to better understand the mechanisms through which this observed effect is operating.
Finally, given that the happiness paradox was more apparent for foreign-born Hispanics than for any other groups, one could argue that survey translation or language-related cultural norms may have played a role in the findings. Of the 175 foreign-born Hispanics in our sample, 55.4% took the survey in Spanish. Similarly, of the 263 native-born Hispanics, 2.3% took the survey in Spanish. While it was beyond the scope of the current study to do an in-depth assessment of the measurement equivalency of life satisfaction across ethnoracial groups by nativity, prior research has demonstrated the strong psychometric properties of our measure of life satisfaction using both the English version and the Spanish version of the scale (Pavot & Diener, 1993; Vázquez et al., 2013). Furthermore, our assessment of reliability across groups showed that the SWLS Cronbach’s alpha was above .70 for all groups. Interestingly, it was particularly high and similar for the White and Hispanics groups (approaching .80) and lower, but still high, for Black respondents. Future studies should further examine whether measurement equivalency issues affect the observed happiness paradox.
Implications for Practice
The findings have implications for both micro and macro practice with diverse older adults. Specifically, results suggest that foreign-born individuals, and especially foreign-born Hispanics, seem to have a unique advantage when it comes to life satisfaction in later life. As noted above, future research is needed to explore the mechanisms of these advantages, but these findings emphasize the need for practitioners to pay attention to factors that may be driving higher levels of life satisfaction among those born elsewhere. It may be possible to develop programs or services that help bolster well-being among native-born individuals, particularly those with the greatest disadvantages such as older African Americans, using insights gained from foreign-born groups. For instance, those born in other countries may maintain a stronger sense of social embeddedness within their ethonoracial group and may compare their own experiences with those with similar backgrounds, leaving them more satisfied with the opportunities and circumstances they have. Programs or interventions could be developed for ethnoracial minorities to help enhance social embeddedness, build stronger levels of social capital, and enhance overall well-being. As an example, previous research has shown that volunteer engagement is associated with a range of benefits to health and well-being (Li & Ferraro, 2005). It may be possible that identifying ways for ethnoracial minorities to engage in volunteer opportunities that are uniquely relevant to individuals within their own ethnoracial communities could help facilitate greater embeddness and overall improvements in health and well-being.
Furthermore, differences in life satisfaction that emerged in this study between native and foreign-born minority groups may indicate that immigrants seem to lose their ability to derive life satisfaction with assimilation. Second- or third-generation immigrants are likely to be more assimilated to the American culture than first-generation immigrants and may find it more difficult than first-generation immigrants to integrate aspects of both American culture and their culture of origin (e.g., by honoring traditions from their culture of origin, being bilingual, etc.). This idea is supported by research that found that, among Latino immigrants, those that are bicultural have better mental health outcomes than those who chose to remain culturally separate from the American culture (primarily Spanish speaking), and that immigrants who had fully assimilated (primarily English speaking) did not show high ratings of life satisfaction (Marsiglia, Booth, Baldwin, & Ayers, 2013). Policymakers and practitioners should be aware of and foster policies that support ethnoracial minorities’ ability to live, work, and socialize in spaces that reflect, honor, and respect their culture of origin rather than impose American norms and values. More emphasis on adapting existing social service programming and health and well-being interventions in ways that acknowledge and respect cultural values and norms is an example of such support.
In sum, as Takamura (2015) noted, closing the health disparity gap among older adults requires an integrated response from policy, research, and programs. By identifying modifiable structural factors that may account for systemic disparities in life satisfaction across different ethnic and racial groups of older adults, we come closer to this goal. The main insight of the current study is that there may be an immigrant advantage on life satisfaction later in life. We say this cautiously, recognizing the small sample sizes of some groups of foreign-born older adults in the data. These findings contribute to knowledge in this area by suggesting that the happiness paradox may not only be a matter of Hispanic ethnicity, but that it may extend to other immigrants as well.
Footnotes
Authors’ Note
The content is solely the responsibility of the authors and does not necessarily represent the official views of the Institute on Aging.
Declaration of Conflicting Interests
The authors declared no potential conflicts of interest with respect to the research, authorship, and/or publication of this article.
Funding
The authors disclosed receipt of the following financial support for the research, authorship, and/or publication of this article: A Grant from the Boston College’s Institute on Aging supported research reported in this manuscript. The funder did not have any role in the study design, in the collection analysis and interpretation of data, in the writing of the report, and in the decision to submit the article for publication.