



Abstract
Reducing socioeconomic status (SES) inequalities in health is a primary goal of health policy (World Health Organization [WHO], 1985). Evidence suggests, however, that after 50 years of declining income inequality in many countries, including both the United States and Sweden, income inequality has been increasing since the 1980s (Atkinson, 2008). At the same time, inequalities in health and life expectancy are also increasing (Lynch, 2003; Mirowsky & Ross, 2003; Pappas, Queen, Hadden, & Fisher, 1993; van Kippersluis, Van Ourti, O’Donnell, & van Dooslaer, 2009), even in countries like Sweden with universal access to health care and a health care policy focused on addressing systemic inequalities (Burström, Johannesson, & Diderichsen, 2005). SES has been identified as a fundamental cause of these health disparities because income, status, and knowledge associated with higher SES allow people to take advantage of health-related information to support health (Everett, Rehkopf, & Rogers, 2013). The vital role of knowledge in this process has lead to a focus on the unique role of education, per se, in the SES-health relationship (Mirowsky & Ross, 2003; Ross & Wu, 1996).
Not only does education precede and contribute to subsequent occupation and income, but even the underemployed or unemployed will have an educational attainment that does not change with current conditions or health, thus avoiding possible missing data and reverse causality issues (Herd, 2006; Ross & Wu, 1996). Moreover, the cumulative advantage theory argues that education represents human capital in the abilities to acquire and leverage health information (Lynch, 2003, 2006; Mirowsky & Ross, 2003; Ross & Wu, 1996). As a result, SES differences in health status grow with increasing age, arising both from amplification of early differences and continued accumulation of health benefits (Mirowsky & Ross, 2003). Research indicates that education has a larger impact on health than income and occupational status components of SES (Lynch, 2003, 2006; Mirowsky & Ross, 2003) and educational disparities in health are larger for preventable than for unpreventable illnesses (Masters, Hummer, & Powers, 2012). Although the cumulative advantage theory posits consistent increases in education-based health disparities across the lifespan, the age-as-a-leveler hypothesis suggests that at later ages the aging process itself overwhelms the education advantage, resulting in reduction in education disparities in health in late adulthood (e.g., Herd, 2006; House et al., 1994).
Though there is evidence to support both theories (e.g., Corna, 2013), changes in medical science and educational practices during the 20th century suggest that examination of cohort differences in education–health relationships can provide insight (Lynch, 2003). As the causes of death transitioned in the 20th century from communicable diseases to more chronic illnesses (the epidemiological transition), the role of SES and education in health and mortality may also have changed (Lynch, 2003; Pappas et al., 1993). The oldest individuals lived when relevant health information was generally less available and thus education may have less impact on health in earlier cohorts (Mirowsky & Ross, 2003). Not only is education becoming an even greater resource to shape access to new health knowledge (Masters et al., 2012), but the role of education in providing access to occupation and income may be intensifying in the last decades (Lynch, 2003, 2006). In fact, evidence suggests that the education–health disparity is getting larger in later born cohorts (Kim, 2008; Lynch, 2003, 2006; Rogers, Hummer, & Everett, 2013; Steenland, Henley, & Thun, 2002), especially with regard to preventable causes of death (Everett et al., 2013; Masters et al., 2012).
Previous investigations of cohort differences in the relationship between education and health tended to focus on mortality and estimated life expectancy (Burström et al., 2005; Everett et al., 2013; Masters et al., 2012) or self-report of health or functional limitations (Burström et al., 2005; Herd, 2006; House et al., 1994; Kim, 2008; Lynch, 2003, 2006; Ross & Wu, 1996; van Kippersluis et al., 2009). As Kim (2008) suggests, results of analyses of cohort differences in the relationship between education and health across the lifespan may differ by outcome variable. Physical impairment may be one of the best indicators of the education–health relationship because it is so closely related to health care utilization (Ernsth Bravell, Berg, & Malmberg, 2008; Ernsth Bravell, Westerlind, et al., 2011); however, evidence suggests only modest correlations between self-reported disability and measured functional impairments (Ernsth Bravell, Zarit, & Johansson, 2011; Farag et al., 2012). Whereas subjective measures of health tap physical, cognitive, and emotional dimensions, as well as cultural constructs of health (Benyamini, 2011; Jylhä, 2009), objective measures provide a more focused assessment of health, per se. The current analysis reports one of the first analyses of cohort differences in relationship between education and objective measures of functional abilities across the lifespan.
The LIFEPATH Consortium recently reported an analysis of SES disparities in measured walking speed using data from 24 countries (Stringhini et al., 2018). They found support for the cumulative disadvantage theory: SES disparities in walking speed increased with age. Moreover, years of functioning lost due to low SES was greater than years of life lost, suggesting that functional abilities may be more sensitive to education–health relationships than simple longevity. The LIFEPATH data were cross-sectional, included only one measure of physical function, and the analyses did not estimate the impact of cohort on SES–health disparities. In the current analyses, we use 20 objective measures of functional abilities available from the longitudinal Swedish Adoption/Twin Study of Aging (SATSA; Finkel & Pedersen, 2004). Participants in two cohorts (born 1900-1924 and 1925-1948) aged 50 to 90 years at intake completed up to nine assessments covering a 26-year period. Following the approach of Lynch (2003, 2006), we use growth curve models to track individual change in functional abilities over age. We predict a significant relationship between accelerating change with age and education, providing support for the cumulative advantage model. Furthermore, we predict that impact of education on age trajectories for functional abilities will be greater in the later cohort than the early cohort.
Method
Participants
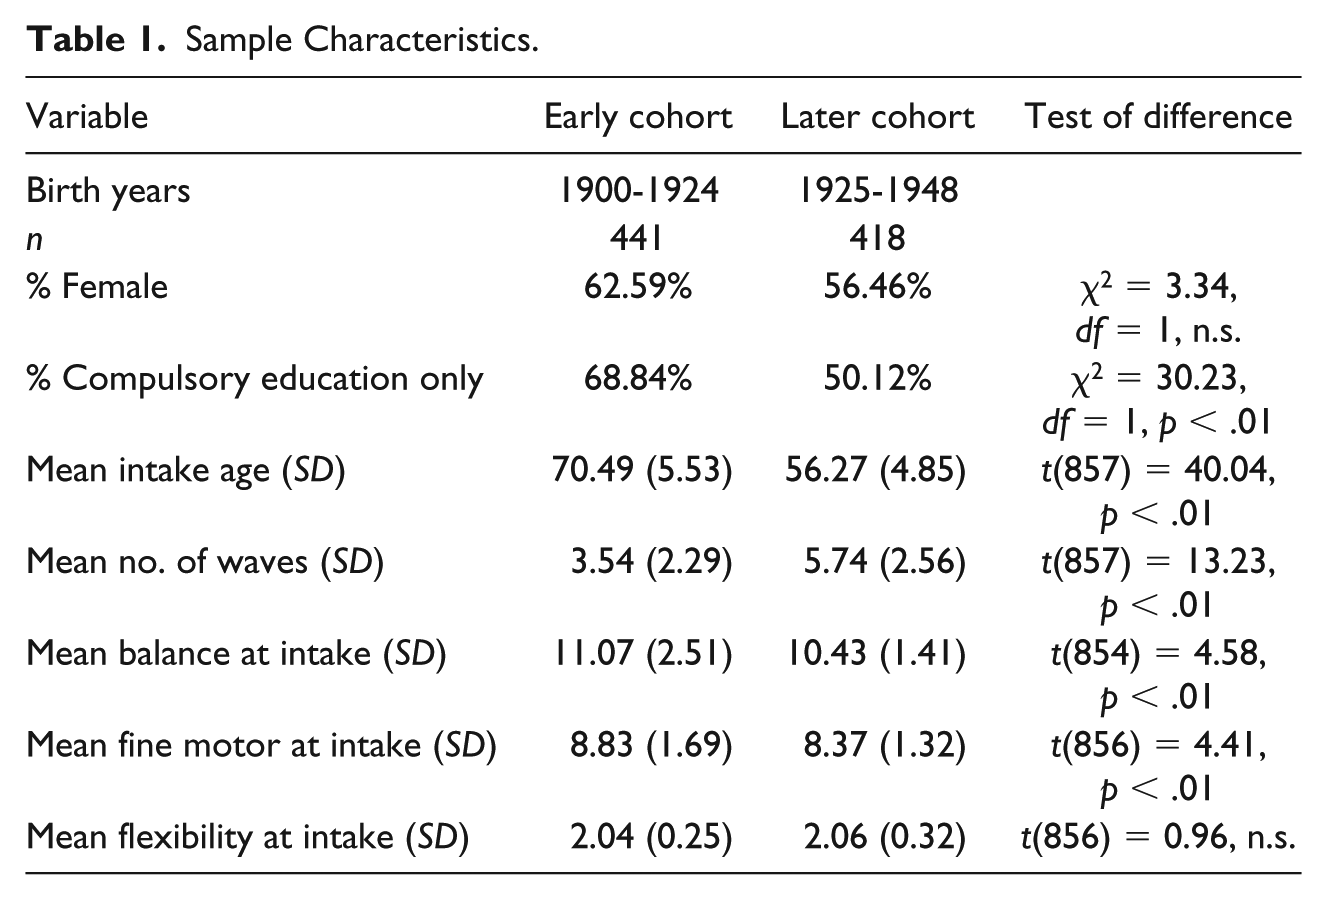
Accrual procedures for SATSA have been described previously. In brief, the sample was recruited from the population-based Swedish Twin Registry (Finkel & Pedersen, 2004). In-person testing (IPT) took place in a location convenient to the participants and was completed during a single 4-hr visit. At IPT2 through IPT5, additional twins who had reached age 50 since the last wave were invited to participate in SATSA. Intervals between testing intervals ranged from 2 to 7 years; the total time span from IPT1 to IPT10 was 26 years (note that IPT4 had a reduced sample and thus is not included in the current analyses). Dividing the sample at the median birth year (1925) created two cohorts of approximately equal size: early cohort (born 1900-1924) and later cohort (born 1925-1948). Historical differences in educational policies (access for women, minimum number of years) also differentiate the two cohorts. Demographic characteristics of the cohorts are provided in Table 1. The early cohort is significantly older, on average, and thus tends to include more women, but the cohort difference in gender distribution was not significant. Because they were younger at intake, the later cohort was able to participate in about two more testing waves, on average. The number of waves of participation ranged from one to nine in both cohorts, and even in the early cohort the average participation was greater than the three waves that support latent growth curve (LGC) analyses.
Sample Characteristics.
Measures
Education
Education was rated on a 4-point scale from 1 (elementary school) to 4 (university or higher). For the purposes of these analyses, education was reduced to a dichotomous variable: compulsory education (elementary school) versus more than compulsory education (values of 2 through 4). Percent of the sample in each cohort with more than compulsory education is reported in Table 1. Not surprisingly, the later cohort had significantly more education than the early cohort, but only about half of the later cohort completed more than compulsory education.
Motor function
Twenty-four measures of motor functioning were collected at each IPT. Analyses indicated that nurse ratings of successful performance (1 = no difficulty, 2 = some difficulty, 3 = impossible) were more sensitive than performance time to subtle changes with age (Ernsth Bravell et al., 2017; Ernsth Bravell, Zarit, et al., 2011). In other words, timed performance of young-old adults on these measures did not vary extensively; in contrast, qualitative ratings demonstrated more variance across the entire age range included in these analyses, providing better measures for data reduction efforts. Data reduction for the motor functioning measures has been described previously (Ernsth Bravell et al., 2017). In brief, 20 motor functioning measures were used to generate three factors with consistent factor loadings across IPT and age. The remaining four measures did not load consistently on any factor. The Flexibility factor included two items: touch left earlobe with right hand behind the head, and vice versa. The Fine Motor Movement factor included eight measures of motor functioning: pour water from a jug into a glass, pour water from one hand to the other (both dominant & non dominant hands), insert key into lock and turn, insert electrical plug into socket, screw in a light bulb, put coins in a coin slot, and dial the numbers 1 through 9 on a rotary phone. The Balance factor included 10 measures of motor functioning and can also be considered a measure of gross motor function: walk and turn 3 meters, single-chair stand, five-chair stands, standing balance with feet side-by-side for up to 10 s, standing balance with feet together and arms extended for up to 10 s, lift a glass, lift a 1 kg packet, pick up a pen from the floor from a standing position, touch right fingers to left toes while seated (and vice versa).
Minimum and maximum scores on the three factors were 2 and 6 (Flexibility), 8 and 24 (Fine Motor), and 10 and 30 (Balance); higher scores indicate more difficulties completing the tasks. Correlations among the motor factors were significant at p < .01 but modest (Flexibility × Balance = .24, Flexibility × Fine Motor = .17, Balance × Fine Motor = .29), indicating that each factor taps a different aspect of motor functioning. As SATSA progressed, some changes were made in the assessment protocols. Only two of the eight measures that make up the Fine Motor factor were collected at IPT8 through IPT10; therefore, Fine Motor factor scores could not be calculated for those waves of participation. Given the large age range at any wave, the age range available for Fine Motor does not differ from the other factors; however, the coverage of data in the later ages is thinner, particularly in the later cohort. Mean performances on the three motor factors at intake are presented for both cohorts in Table 1. Mean differences between the two cohorts were modest but significant for the Balance and Fine Motor factors, but were not significant for the Flexibility factor.
Statistical Method
Lynch (2003) discussed the advantages of using a growth curve model over traditional regression models to examine age and cohort differences in the education–health relationship. Due to the range in age at each wave, an age-based LGC model was used to estimate trajectories of change with age in the motor factors. The structural model can be considered as a multilevel random coefficients model (Bryk & Raudenbush, 1992; McArdle & Anderson, 1990). The model provides estimation of fixed effects, that is, fixed population parameters as estimated by the average growth model of the entire sample, and random effects, that is, interindividual variability in intraindividual change in growth model parameters. The age basis serves as a marker for the age of the subject at each time of measurement, adjusted for the centering age. Therefore, age basis coefficients are defined as an individual’s observed age at each measurement occasion minus the centering age (70 years). Accelerating change with age is captured by the second age basis: age2. Growth curve models take into account missing data by giving more weight to individuals with the most time points. The random and fixed effects parameter estimates were obtained using PROC Mixed in SAS 9.4 and models were corrected for twinness by modeling both between and within pair variance in the random effects. To test cohort differences and cohort by education interactions in trajectories of change with age in the motor factors, four LGC models were compared. Nested LGC models can be compared using a likelihood ratio test (LRT), which is the difference in the model fit statistic (log likelihood) for the two models, with degrees of freedom equal to the difference in parameters estimated.
Results
Model fit statistics and results of comparing models are presented in Table 2. Number of observations available across participants and waves is reported in the first row; inability to compute the Fine Motor factor at IPT8 through IPT10 resulted in a reduction of about 20% in the number of available observations. In the first model, the basic quadratic LGC was fit to the data, including intercept, age, and age2. In the second model, sex was included as a covariate with all three LGC parameters (three additional parameters), but no significant change in model fit was indicated for any of the motor factors. Thus, there were no significant sex differences in level of functioning or rates of change. By incorporating cohort interactions with all existing fixed effects, the third model tested one of the primary questions of the current analyses: cohort differences in age trends in physical functioning. Model 3 produced a significant change in model fit for all three motor factors. For example, the LRT comparing Model 3 to Model 2 for the Balance factor was 65.7 (df = 6, p < .01). For all three factors, the quadratic LGC parameter was significantly larger for the early cohort versus the later cohort, indicating that the early cohort demonstrated a faster rate of accelerating increases in functional difficulties with age than the later cohort.
Comparing Model Fit (–2LL) of Latent Growth Curve Models for the Three Motor Factors.
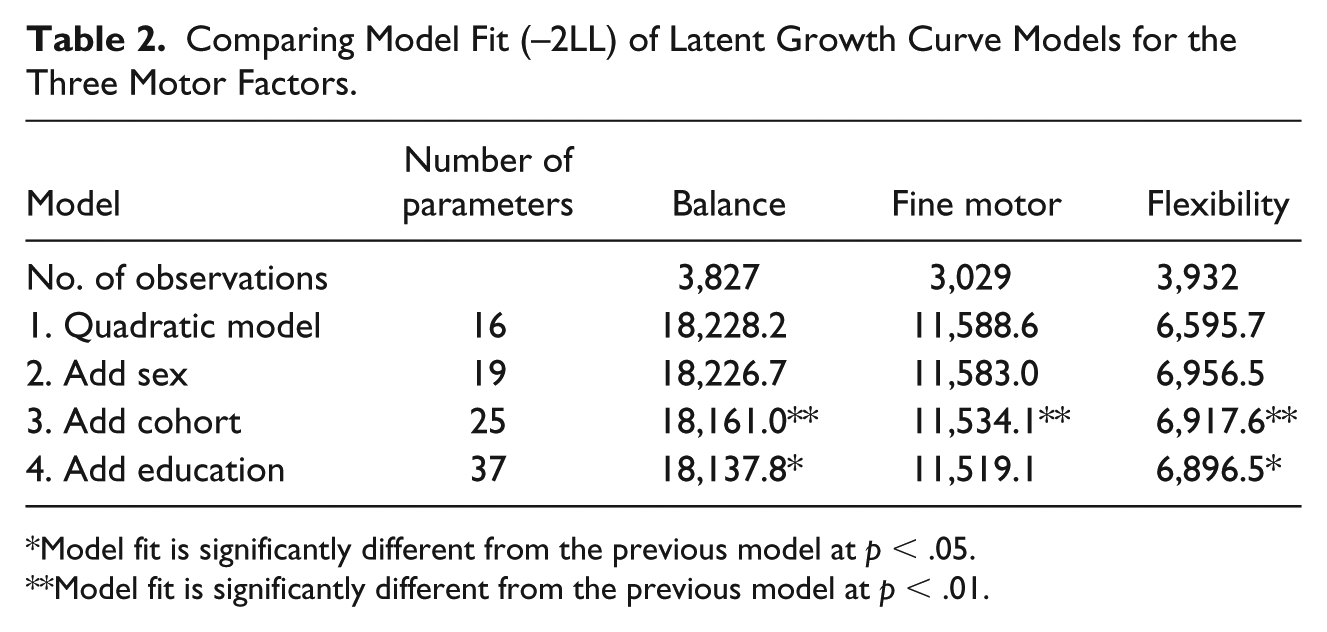
Model fit is significantly different from the previous model at p < .05.
Model fit is significantly different from the previous model at p < .01.
Finally, to examine the role of education in the cohort differences identified by Model 3, the fourth LGC model incorporated education interactions with all existing fixed effects. Model 4 produced a significant change in model fit for Balance and Flexibility factors, but not for the Fine Motor factor, indicating that education played a role in the cohort differences in age trends for two of the three motor factors. Examining the LGC parameter estimates and standard errors from Model 4 for the three motor factors (presented in Table 3) allowed us to identify the nature of the role education played in the cohort differences. The base LGC parameters (intercept, age, and age2) indicate the values for the higher education group in the later cohort. The interaction parameters indicate the adjustments to those base values for the early cohort and/or the lower education group. As shown in Table 3, the main effect of cohort on intercept was significant and negative for all three motor factors, indicating that the early cohort demonstrated significantly lower values at age 70. In contrast, education had a significant positive effect on the intercept for Balance and Flexibility factors, indicating higher values at age 70 for the low education group. Education had the same impact on linear change with age: significant positive values for Balance and Flexibility indicating faster rates of increasing difficulties at age 70. The cumulative disadvantage model predicts significant interactions between education and accelerating change with age (age2): This term was significant and positive, but only for the Balance factor. However, it is the Age2 × Cohort × Education term that tests whether the cumulative disadvantage model is supported in both cohorts. That term was significantly negative for both Balance and Flexibility factors, indicating that the cumulative disadvantage outcome was supported for the later cohort, only.
Parameter Estimates and Standard Errors From Model 4 for the Three Motor Factors.
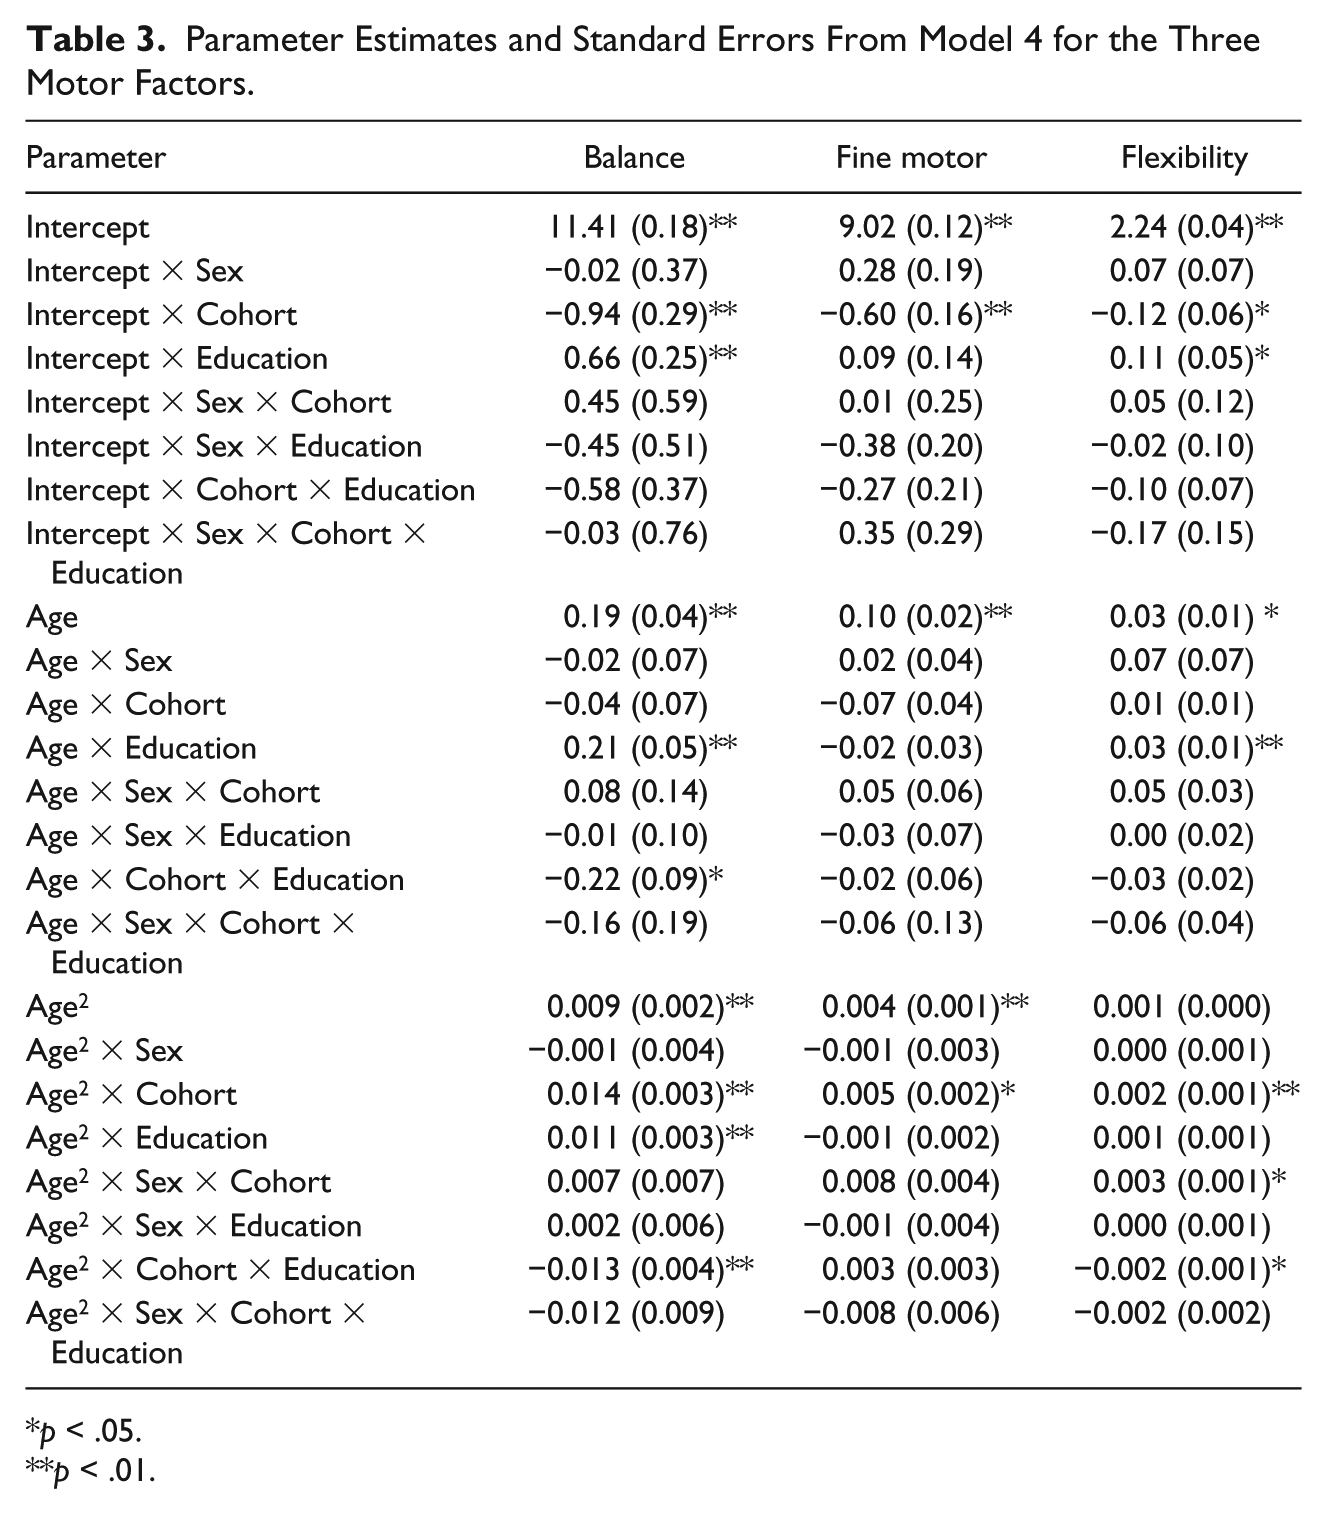
p < .05.
p < .01.
Trajectories estimated for each motor factor from the LGC parameters are presented in Figure 1. For all three factors, the figures show that the trajectories for the early cohort are nearly identical, regardless of education level. In contrast, the trajectories for the later cohort differ dramatically by education level for the Balance and Flexibility factors. The later cohort–high education group demonstrated slower trajectories of change in functional abilities than the early cohort; however, the later cohort–low education group actually demonstrated faster trajectories of change than the early cohort. The absence of significant Sex × Cohort × Education interaction demonstrates no gender differences in the Cohort × Education effects shown in the figure.
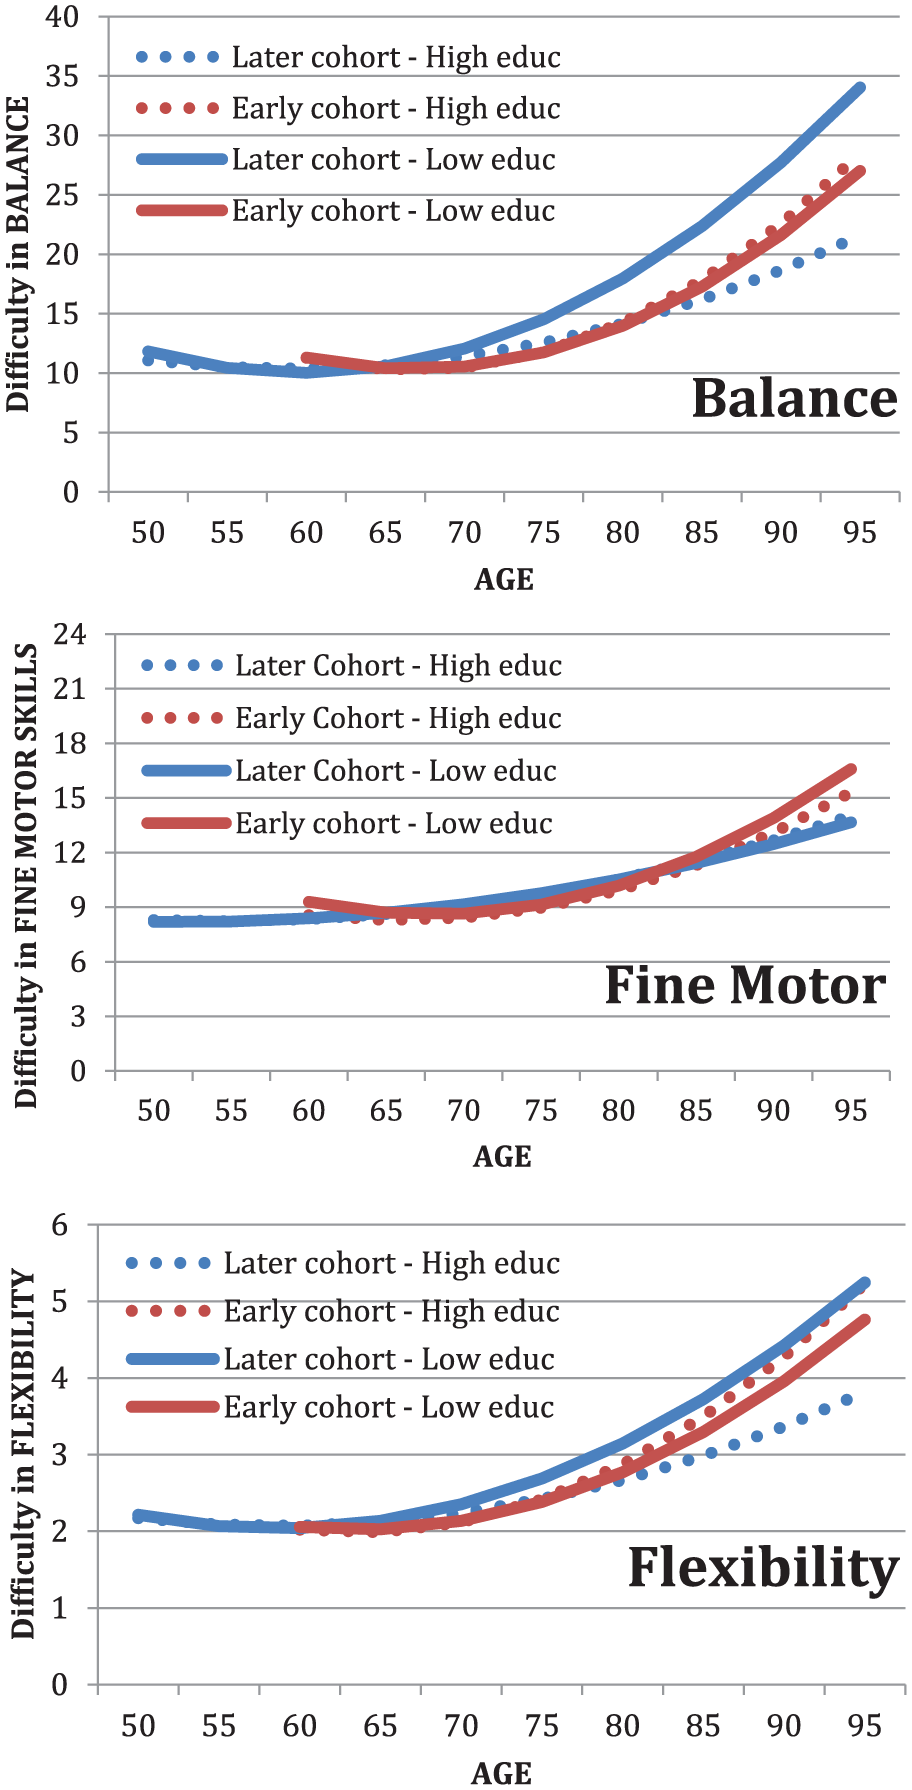
Latent growth curve trajectories for the three motor factors indicating interactions between cohort and education.
Discussion
Longitudinal trajectories of change with age in three factors of objectively measured functional ability tasks were examined for interactions between cohort (early vs. later born) and education level (elementary education vs. higher education). On average, the later born cohort demonstrated slower rates of increasing difficulties in performance in all three factors: balance, fine motor skills, and flexibility. Education level had no impact on rates of change with age in the early cohort. As predicted by the cumulative advantage model, however, only higher educated adults in the later cohort showed slower rates of change in balance and flexibility. Similar results were found by Hörder, Skoog, Johansson, Falk, & Frändin (2015), but only among women. Their results indicated that there was no effect of education on frailty (gait speed and self-reported fitness) in 1987 (early cohort), but in 2005 (later cohort). One could argue that lower education may lead to more high-risk and physically demanding types of occupations and by that affect motor functioning. However, that kind of reasoning would affect both early and later cohorts. Because Sweden developed the education system and offered education on equal terms to a higher extent among the later cohort, one would expect to see a higher rate of low-risk occupations in the later cohort. It is also possible that the changes in education policy in the first half of the 20th century in Sweden that ultimately emphasized universal access resulted in a group of less educated adults who experienced concentrated disadvantages, compared with the rest of the population. Thus, we see that the lower education group in the later cohort actually aged faster than the earlier cohorts on the Balance and Flexibility factors.
The analyses of measured functional ability support results reported for self-reported functional ability and health, as well as morbidity and mortality. Several studies have reported that the health advantage that accumulates to more highly educated adults over the lifespan is increasing in more recent cohorts (Kim, 2008; Lynch, 2003, 2006; Rogers et al., 2013; Steenland et al., 2002). Moreover, research indicates that not only is the education–health relationship increasing in later cohorts, but that the health disparity between education levels is increasing because the less educated are becoming less healthy. Mortality rates are increasing for the less educated in more recent cohorts (Everett et al., 2013; Masters et al., 2012; Olshansky et al., 2012) and the less educated report poorer health and poorer function (Burström et al., 2005; Kim, 2008). Similarly, in the current analyses we found that less educated adults in the later cohort had higher mean difficulties in balance and flexibility at age 70 and faster rates of increasing difficulties with age than the early cohort, on average. One proposed explanation for this outcome is the impact of the epidemiological transition during the 20th century: As the causes of death changed from infectious diseases to more chronic illness, treatments also changed as did access to those treatments (Lynch, 2003; Pappas et al., 1993). As new treatments emerge, there is a tendency for the new health developments to be distributed to or adopted by individuals with higher education before individuals with less education. The role of education in access to and adoption of health resources may have intensified in recent decades, such that less educated adults are at even higher risk than in previous generations (Lynch, 2003, 2006). Evidence for greater education disparities in outcomes for preventable versus nonpreventable illnesses provides support for this conclusion (Everett et al., 2013; Masters et al., 2012).
Clearly, it is important to acknowledge the role of social class of origin, gender, and race in access to education and its health-promoting qualities (e.g., Corna, 2013). It is possible that educational attainment simply reflects parental SES, but when the SES or education levels of adult offspring differ from that of their parents, the major predictor of health outcomes is attained SES or education, rather than rearing SES (De Grande, Vandenheede, & Deboosere, 2015; Mirowsky & Ross, 2003; Sweeting, Green, Benzeval, & West, 2016), although there is some disagreement (Ericsson et al., 2017; Zimmer, Hanson, & Smith, 2016). Given the gender differences in access to higher education in the 20th century, gender differences in education–health disparities might be expected. Compulsory education applies to both boys and girls in Sweden, but the percent of individuals in this sample receiving only compulsory education was significantly less in the later cohort for girls (44% vs. 28%) and not for boys (25% vs. 22%). When gender effects are examined, some authors report significant gender differences in the education–health relationship (e.g., Masters et al., 2012), whereas others concur with the current results in finding no gender differences (e.g., Everett et al., 2013). Issues of access to education versus the ability to implement health information are likely clouded for women in these cohorts, making interpretation of the results difficult.
In addition to differences in compulsory education in Sweden and the United States, there are important differences in health policies and systems. The Swedish National Health Insurance Act was passed in 1946, and the new health care system was implemented in 1955. As a result, the early cohort in the current analyses was at least 31 years old when the health care system came on line, having experienced their entire childhood and young adulthood without national health care coverage. In contrast, the later cohort was aged 7 to 30 years in 1955 and experienced the support of the newly functioning health service for most of their childhood and young adulthood. Even so, it is in the later cohort that we find support for the cumulative advantage theory of increasing education disparities in health with increasing age. Moreover, these Swedish data concur with many U.S.-based studies in finding support for the cumulative advantage theory and the increasing education–health disparities in more recent cohorts, regardless of the national differences in health care systems.
Limitations of the current analyses include many of the statistical assumptions common to structural equation models. The data are assumed to be missing at random and the sample is assumed to be relatively homogeneous. As with any longitudinal sample, attrition occurred in SATSA. However, using an age-based growth curve model instead of a time-based model allowed us to maximize power, especially for individuals with more participation waves. Even though the sample was representative of the population at intake, nonrandom dropout through the course of the longitudinal studies results in increasingly select samples of adults who are healthy enough to participate. In SATSA, research nurses visited the participants at their current residence; therefore, data collection could continue even after onset of illness or entry in to care. As a result, wave-to-wave dropout was quite low (about 8%), but dropout accumulates across waves. Consequently, our analyses have likely underestimated the extent of change with age.
Taken together, these results have implications both for future studies of the relationship between education and health and for health policies in general. Given the significant three-way interactions found between education, cohort, and longitudinal changes in physical functioning for two of the three factors, it is clear that any investigation of the relationship between education and health must take historical differences in access to both education and health care, as reflected in these cohort differences, into account. Access to education and health care will continue to change, requiring continued examination of the impact on health outcomes. Furthermore, the fact that these interactions were identified for objective measures of functioning in a country that has extensive support for health and aging highlights the universal character of these relationships. Providing support for health in late adulthood may not maximize the potential impact on health. The results suggest that health policies are incomplete if they do not include support for education (Masters et al., 2012; Mirowsky & Ross, 2003). Cumulative disadvantage theory indicates that initiatives targeting inequalities must be focused on interventions early in the life course, because early differences will only be amplified as life progresses (Corna, 2013; Mirowsky & Ross, 2003). Evidence suggests that the number of years lost to adverse SES and insufficient education is equal to or greater than number of years lost due to major risk factors for chronic disease (Stringhini et al., 2018). The social environment is modifiable by policies at local, national, and international levels, and these policies need to recognize that education can be part of the solution to the problem of social disadvantage (Mirowsky & Ross, 2003).
Footnotes
Acknowledgements
The authors wish to thank Dr. Nancy Pedersen for providing comments on a draft of the manuscript.
Declaration of Conflicting Interests
The authors declared no potential conflicts of interest with respect to the research, authorship, and/or publication of this article.
Funding
The authors disclosed receipt of the following financial support for the research, authorship, and/or publication of this article: Swedish Adoption/Twin Study of Aging (SATSA) was supported by grants R01 AG04563, R01 AG10175, the MacArthur Foundation Research Network on Successful Aging, the Swedish Council For Working Life and Social Research (FAS) (97:0147:1B, 2009-0795) and Swedish Research Council (825-2007-7460, 825-2009-6141).
