



Abstract
Introduction
Financial burden (also called financial toxicity) represents a patient-level impact of the cost of cancer (Bernard, Farr, & Fang, 2011; Khera, 2014; Markman & Luce, 2010; Zafar et al., 2013), resulting from expensive treatments, overutilized care (Anderson, Reinhardt, Hussey, & Petrosyan, 2003), and even health insurance premiums (HHS Report: Average Health Insurance Premiums Doubled Since 2013, 2017). Financial burden can lead to treatment nonadherence (Streeter, Schwartzberg, Husain, & Johnsrud, 2011; Stuart & Zacker, 1999), lower quality of life, and more distress in people with cancer (Ell et al., 2008; Fenn et al., 2014; Hamilton et al., 2013; Lathan et al., 2016; Park & Look, 2018; Sharp, Carsin, & Timmons, 2013). Although numerous studies have found associations between financial burden and distress in cancer, all studies have been cross-sectional. We need to know whether financial burden leads to distress (such as depression or anxiety) and poor health or whether distress and poor health leads to financial burden to maximize clinical interventions.
Drawing from the psychopathology literature, we can theorize that the longitudinal relationship between financial burden and depressive symptoms or general anxiety in older adults with cancer could follow one of several patterns. First, the relationship may mirror stress reactivity or stress exposure, in which a stressful event such as financial difficulty triggers an increase in depressive symptoms or general anxiety (M. X. Hu, Lamers, de Geus, & Penninx, 2016; Monroe, Slavich, Torres, & Gotlib, 2007a, 2007b). Research has generally supported this hypothesis that major life events (also called stressful life events) such as divorce, job loss, or death of a loved one can trigger a major depressive episode (Monroe et al., 2007a). However, not all stressful events are associated with stress reactivity (M. X. Hu et al., 2016). An alternative possibility for the longitudinal relationship of financial burden with depressive symptoms or general anxiety is stress generation. The stress generation hypothesis states that major depressive disorder creates stress in patients’ lives, and this stress triggers further depression (Hammen, 1991, 2006; Liu & Alloy, 2010; Phillips, Carroll, & Der, 2015; Wu & Andersen, 2010). Research has suggested that stress generation occurs mostly for social stressors (Liu & Alloy, 2010) and may not be as strong for stressful life events that include nonsocial stressors (Phillips et al., 2015). In a 5-year study of women with breast cancer, stress generation was only found in the first 2 years after cancer diagnosis (Wu & Andersen, 2010). As with the stress reactivity hypothesis, the stress generation hypothesis is supported but only in certain situations, primarily interpersonal stressors (Liu & Alloy, 2010).
Self-rated health is the subjective rating of one’s overall health. Self-rated health is associated with a host of clinical outcomes including mortality (Idler & Benyamini, 1997; Mossey & Shapiro, 1982). Socioeconomic status has also been associated with self-rated health in cross-sectional and longitudinal studies (Ota et al., 2018; Sulander, Pohjolainen, & Karvinen, 2012; Xiao, Berrigan, & Matthews, 2017). This suggests that financial burden may predict worse self-rated health in older adults with cancer, but poor physical health may also be a risk factor for later financial burden.
An empirical investigation of the relationship of financial burden with physical and mental health is warranted given implications for clinical care. Depending on which predicts which (i.e., whether health predicts financial burden or financial burden predicts health), results could inform interventions in the clinical setting. If financial burden predicts later health, this would support a focus on financial aid for older adults with cancer. If health predicts later financial burden, this would further support screening for distress and poor self-perceived health among older adults with cancer (Andersen et al., 2014; “NCCN practice guidelines for the management of psychosocial distress. National Comprehensive Cancer Network,” 1999). A separate investigation in older adults is also warranted given that they may express distress differently than younger and middle-aged adults (National Institutes of Mental Health, 2016) and that the association of self-rated health and financial burden may be particularly acute in older adults (Sulander et al., 2012).
Method
Participants and Procedures
We used the National Health and Aging Trends Study (NHATS; 2011, 2012, 2015, 2016) because this sample all had Medicare coverage, meaning all participants had insurance, and this would be less likely to confound results. NHATS consists of two cohorts of older adults who are Medicare beneficiaries. The first cohort (n = 8,245) was recruited in 2011, and the second cohort (n = 4,182) was recruited in 2015. Each cohort completed yearly surveys with the most recent data coming from the 2016 survey. For the purposes of this study, we limited the sample to people self-reporting a diagnosis of cancer at the first survey they completed and reporting complete data on the financial burden questions and the depressive symptom, general anxiety, or self-rated health questions (see Figure 1). To be included in this sample, participants had to have complete data on the financial burden questions and at least one of the distress or health variables at both surveys. Participants also had to have complete data on demographic variables used as controls in analyses. Participants who only reported a nonmelanoma skin cancer (such as basal cell carcinoma) were excluded. The NHATS study is conducted by the Johns Hopkins Bloomberg School of Public Health and was reviewed by their institutional review board.
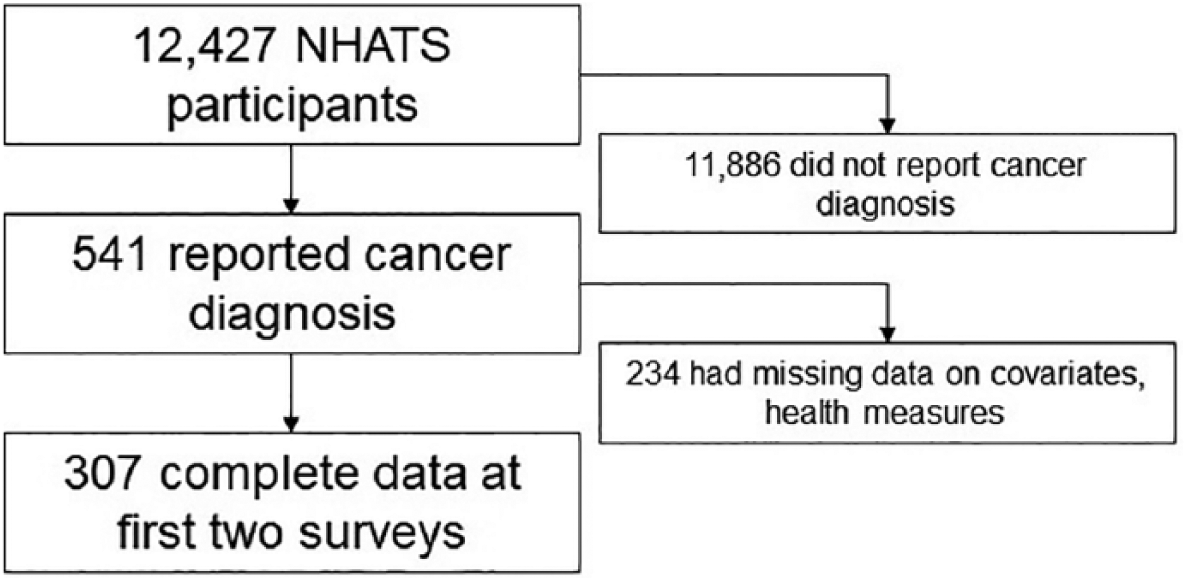
Sample flow diagram.
Measures
Financial burden
Participant-level financial burden was assessed by counting the number of financial problems reported in the past year. The following six financial problems were measured by the survey: not paying off credit card balances each month, paying medical bills over time, receiving financial help from family or friends, receiving Supplemental Nutrition Assistance Program (food stamps), receiving other food assistance, and receiving assistance with utilities.
Depressive symptoms
Depressive symptoms were assessed using the Patient Health Questionnaire 2 (PHQ2). The PHQ2 is a short version of the PHQ9 (Kroenke, Spitzer, & Williams, 2001; Spitzer, Kroenke, & Williams, 1999) and has been shown to have reliability and validity (Lowe, Kroenke, & Grafe, 2005). The PHQ2 asks respondents to rate how often they experienced the following symptoms in the past two weeks: depressed mood and anhedonia (lack of interest in activities). The response scale for each item ranges from 0 (not at all) to 3 (nearly every day). Total scores range from 0 to 6.
General anxiety
General anxiety was assessed using the Generalized Anxiety Disorder 2 (GAD2). The GAD2 consists of two items from the GAD7 (Spitzer, Kroenke, Williams, & Löwe, 2006) that assess feeling nervous, anxious, or on edge and not being able to stop worry. Respondents indicate how often they have experienced these symptoms in the past 2 weeks using the same response scale as the PHQ2 (0 = not at all, 3 = nearly every day). The GAD2 has been shown to be reliable and valid (Kroenke, Spitzer, Williams, & Lowe, 2009; Lowe et al., 2010; Weihs, Wiley, Crespi, Krull, & Stanton, 2018).
Self-rated health
Self-rated health was assessed using the standard single item measure. Respondents are asked to indicate if their health is, in general, excellent (1), very good (2), good (3), fair (4), or poor (5). Self-rated health has been associated with mortality and other health outcomes (Idler & Benyamini, 1997; Mossey & Shapiro, 1982; Schnittker & Bacak, 2014).
Data Analysis
We used a cross-lagged panel design to test the longitudinal relationship between financial difficulties and health (depressive symptoms, general anxiety, self-rated health). A cross-lagged panel design is a specific type of path analysis that models two variables, both measured at two different points in time, one at baseline and the other a year later. With the first cohort, these variables were measured at 2011 and 2012, and for the second cohort, at 2015 and 2016. Regression analysis is used to determine whether each variable at the first time point predicts the other variable at the second time point. We used polychoric correlations as the basis for the path analysis due to the variables not being interval scale or normally distributed. A separate path analysis was constructed for each measure of health. Analyses controlled for age, income, education, gender, race/ethnicity, marital status, whether a participant had drug coverage, and number of comorbid medical conditions. All control variables came from the first survey. Model fit was evaluated using the test of close fit, root mean square error of approximation (RMSEA), and comparative fit index (CFI; Browne and Cudeck, 1993; L. T. Hu & Bentler, 1999). Nonsignificant tests of close fit, RMSEAs below .08 and CFIs above .95 generally indicate good fitting models. For the outcomes at the second survey (financial burden, self-rated health, depressive symptoms, general anxiety), percent of variance accounted for by the control variables, the level of the outcome at baseline and the predictor of interest (i.e., financial burden for the health measures, health for the financial burden measures) was calculated using multivariate regression. Analyses were run using LISREL 9.3. Data management and preparation was conducted in SPSS 25 and SAS 9.4. Our sample size of 307 would be sufficient for path analysis given simulation studies (Wolf, Harrington, Clark, & Miller, 2013).
Results
Description of the Sample
Descriptive statistics from the first survey participants completed are presented in Table 1. Consistent with the NHATS eligibility criteria, all participants (n = 307) were 65 years of age or older and their ages spanned all six age groups. Slightly more than half the sample was male (55%), and most were married (58%) or widowed (27%). Most participants had incomes below US$27,000/year and nearly all had some form of drug coverage (85%). Most participants did not report noteworthy levels of depressive symptoms, general anxiety, or financial burden, although all possible values of the PHQ2 and GAD2 were reported.
Descriptive Statistics for the Sample (n = 307).
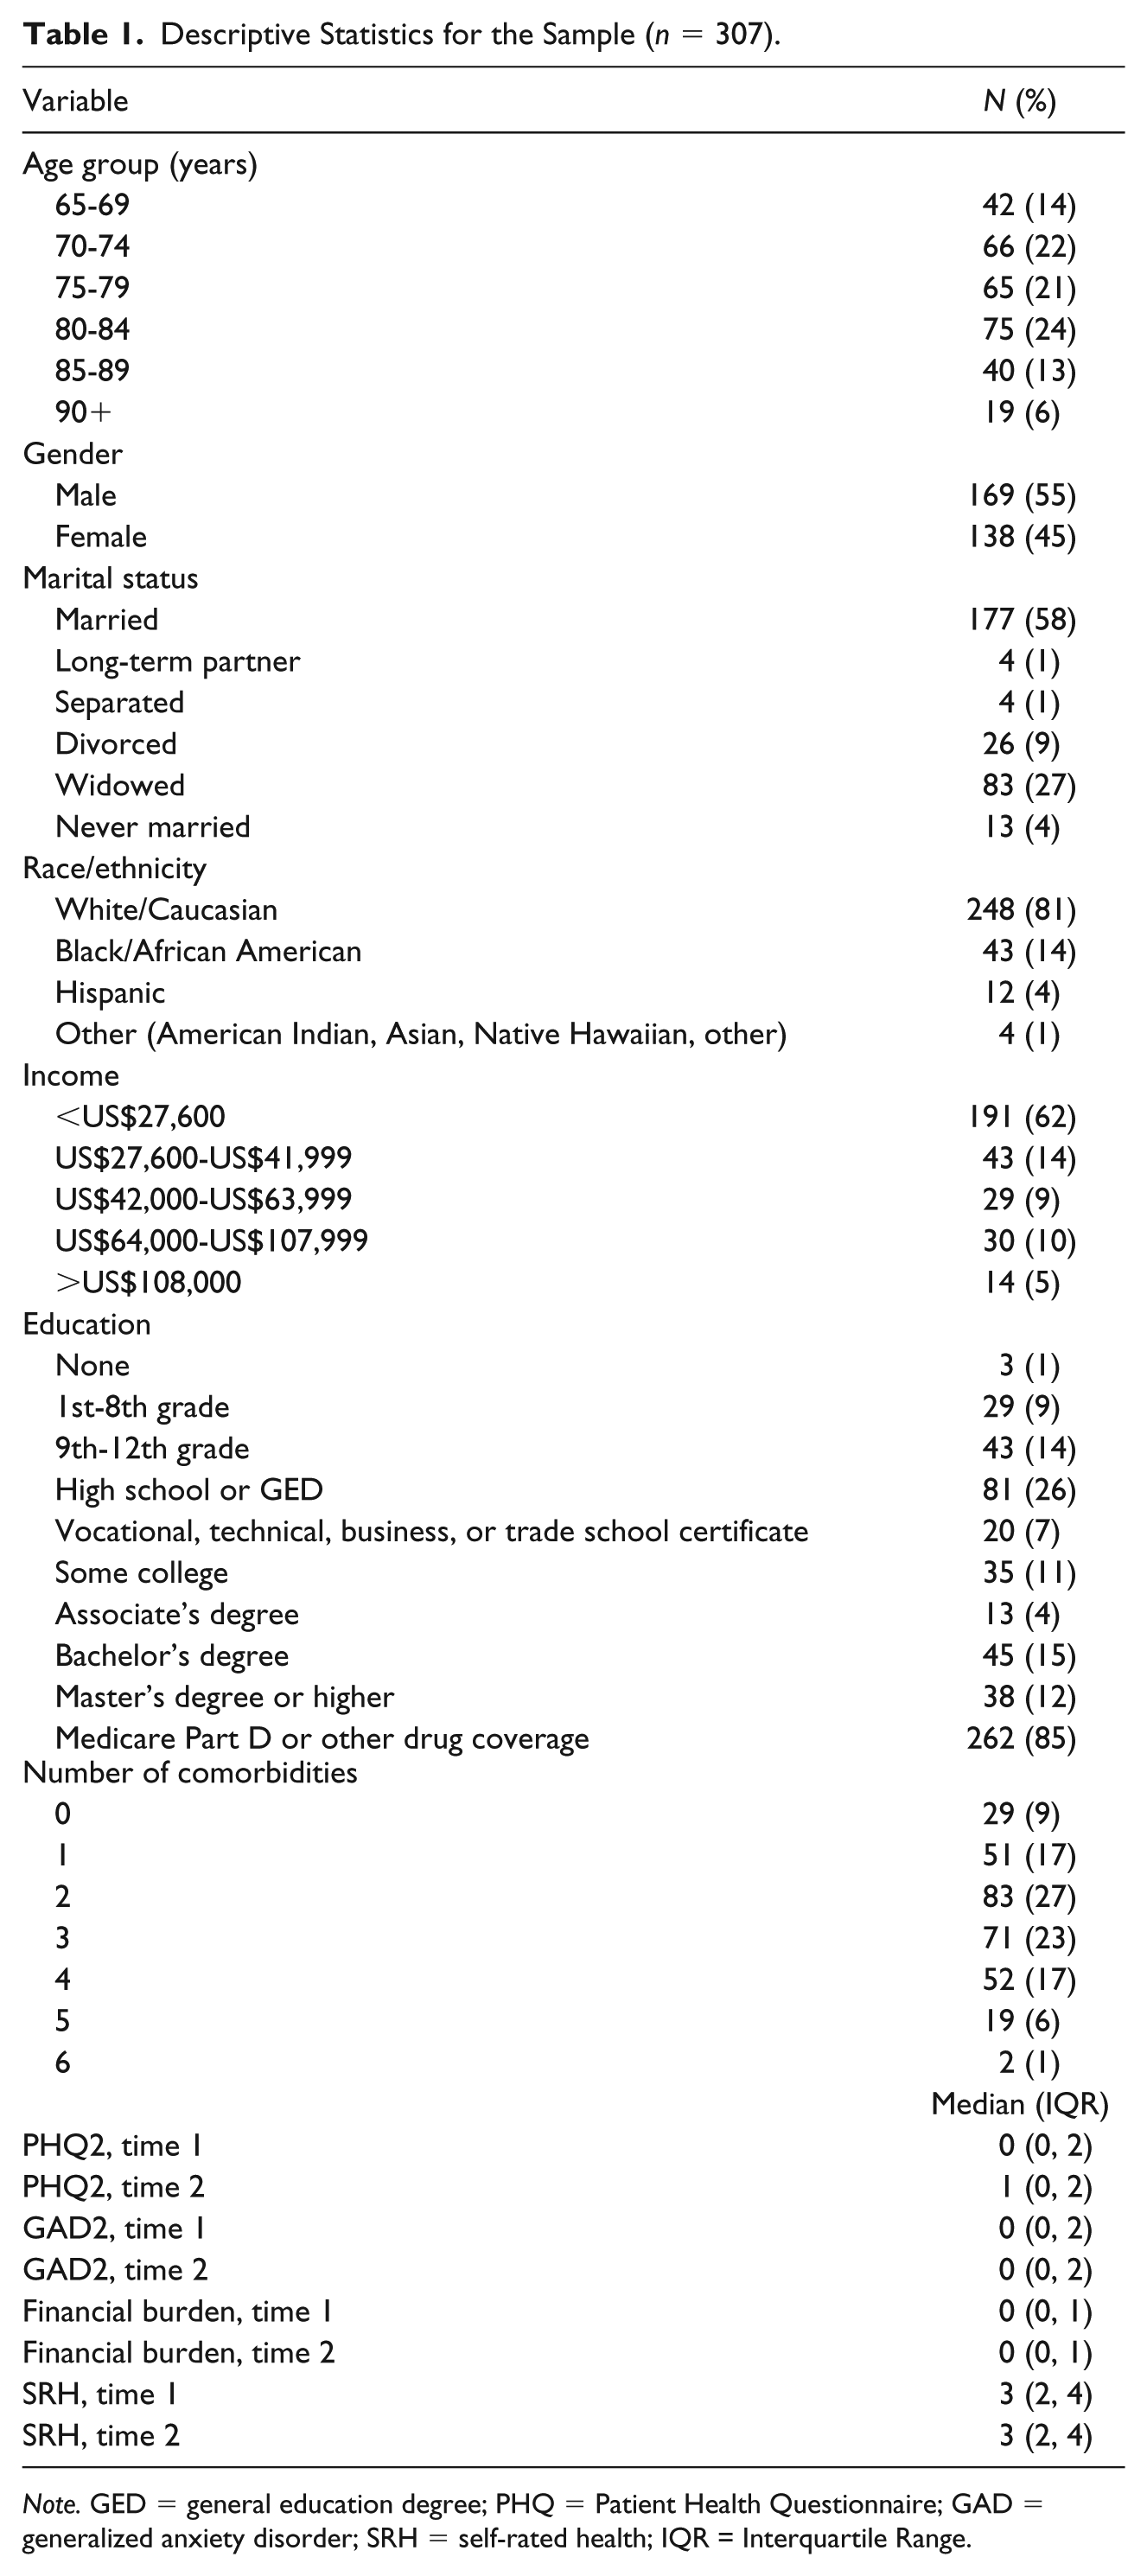
Note. GED = general education degree; PHQ = Patient Health Questionnaire; GAD = generalized anxiety disorder; SRH = self-rated health; IQR = Interquartile Range.
Depressive Symptoms
Results for the cross-lagged panel model of depression and financial burden are reported in Figure 2. Unsurprisingly, depressive symptoms at the first survey predicted depressive symptoms at the second survey (0.544, p < .001). Financial burden at the first survey significantly predicted financial burden at the second survey (0.732, p < .001). Depressive symptoms at the first survey did not predict financial burden at the second survey (0.056, p = .138), but financial burden at the first survey did predict depressive symptoms at the second survey (0.123, p = .036). Overall, 44% of the variability in depressive symptoms at the second survey and 67% of the variability in financial burden at the second survey were explained by the model. The model also fit the data well (RMSEA < .01; CFI = 1.00; p value test of close fit = .531).
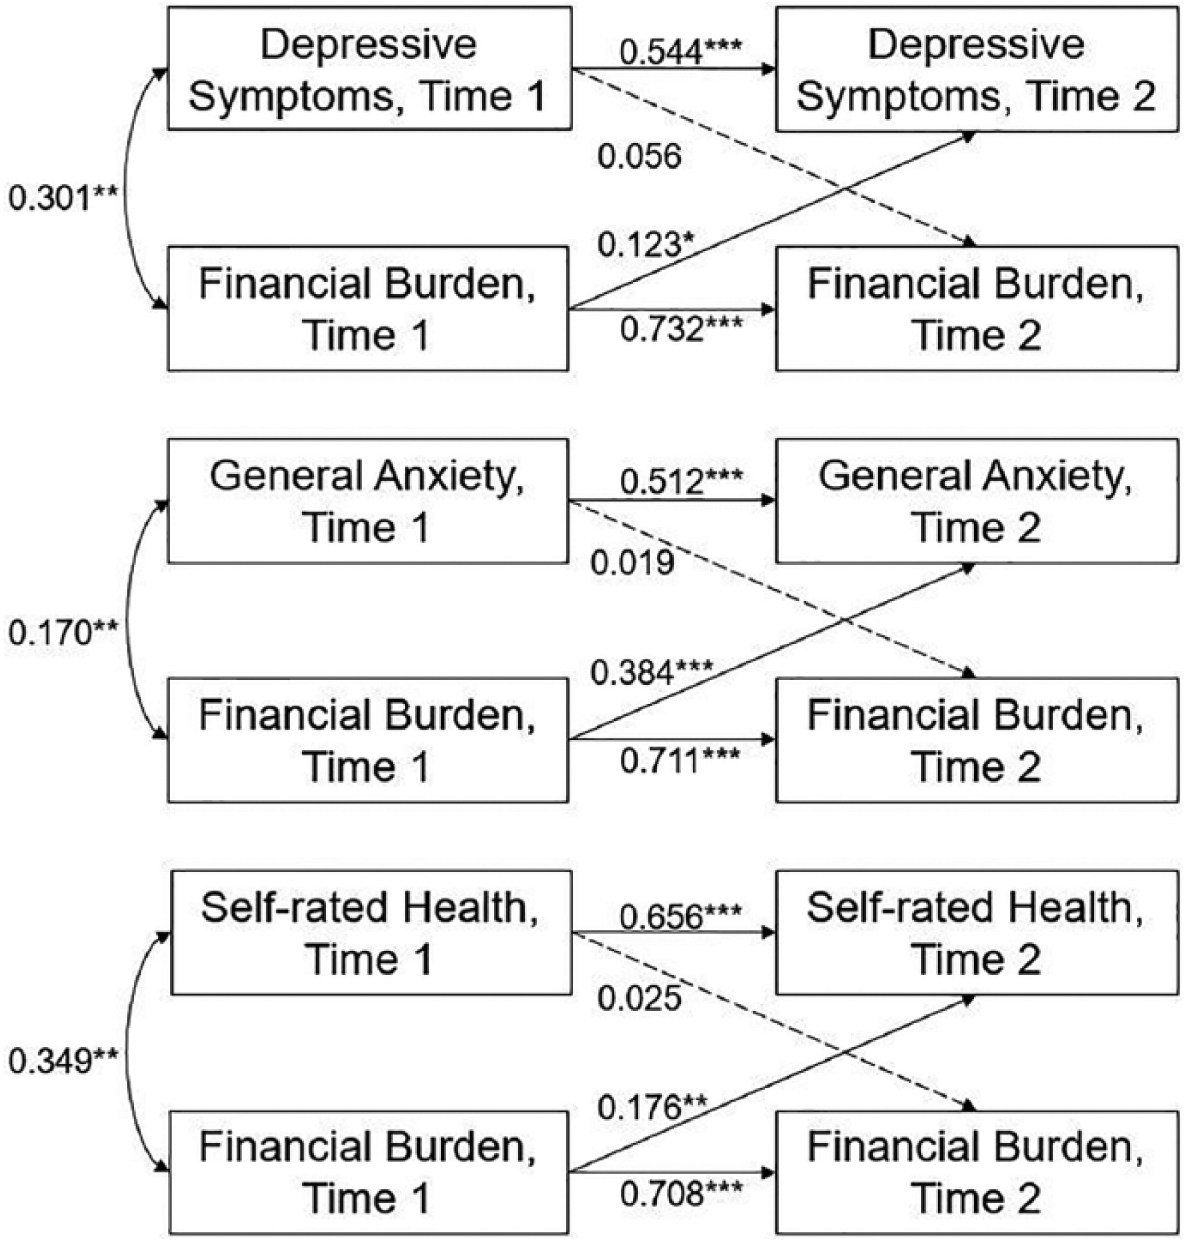
Path diagrams with coefficients.
General Anxiety
The cross-lagged panel analysis for general anxiety is reported in Figure 2. Financial burden at the first survey predicted financial burden (0.711, p < .001) and general anxiety (0.384, p < .001) at the second survey. General anxiety at the first survey predicted general anxiety (0.512, p < .001) but not financial burden (0.019, p = .606) at the second survey. The model had acceptable fit to the sample data (RMSEA < .01; CFI = 1.00, p value for test of close fit = .826). The model explained 39% of the variance in general anxiety at the second survey and 66% of the variance in financial burden at the second survey.
Self-Rated Health
The analysis for self-rated health is reported in Figure 2. Financial burden at the first survey significantly predicted self-rated health at the second survey (0.176, p = .001). Self-rated health at the first survey did not predict financial burden at the second survey (0.025, p = .560). As expected, self-rated health at the first survey predicted self-rated health at the second survey (0.656, p < .001) and financial burden at the first survey predicted financial burden at the second survey (0.708, p < .001). The model fit the data (RMSEA < .01, CFI = 1.00, p value for test of close fit = .850). The model explained 55% of the variance in self-rated health at the second survey and 66% of the variance in financial burden at the second survey.
Discussion
This study used a publicly available data set to examine whether depressive symptoms, general anxiety, and self-rated health were associated with financial burden across time in older adults with cancer. Overall, no evidence was found for distress or self-rated health predicting later financial burden. Support was found for financial burden predicting depressive symptoms, general anxiety, and self-rated health. For distress, the results were consistent with previous research suggesting a stress reactivity model (Association, 2017). For self-rated health, these results are consistent with previous research showing an association with socioeconomic status (Kennedy, Kawachi, Glass, & Prothrow-Stith, 1998; Ota et al., 2018; Sulander et al., 2012; Xiao et al., 2017). This study also extends previous work on cancer-specific financial burden (Ell et al., 2008; Fenn et al., 2014; Hamilton et al., 2013; Lathan et al., 2016; Park & Look, 2018; Sharp et al., 2013) to noncancer-specific financial burden (Ramsey et al., 2016).
The limitations of this study warrant discussion. First, only general anxiety was measured, and a host of research (Becker, Rinck, Margraf, & Roth, 2001; Berggren, 1992; Buss, Davis, Hobel, & Sandman, 2011; Jerndal et al., 2010; Reck et al., 2013) has shown that anxiety specific to a stressor is more predictive of later behavior and outcomes. The survey did not measure financial anxiety specifically, so we were unable to test this, but future research should compare general anxiety and financial anxiety for predicting later financial health. The measure of financial problems was not comprehensive, including missing more severe forms of financial burden (bankruptcy) and less severe forms (cutting down on luxuries) and did not specifically ask about cancer-related financial burden. Also, although all participants had reported a cancer diagnosis on their first survey, no other cancer information is collected in the NHATS survey, so we were unable to describe the types of treatment or time since diagnosis.
Future research on and clinical services for financial burden in cancer and older adults should consider two important issues. First, cancer treatment is unlikely to become less expensive in coming years. Financial assistance interventions that reduce financial burden in patients with cancer (Mackintosh et al., 2006) may need to be deployed in the clinic. Second, oncologists and other health care providers are trained to address disease symptoms and treatments but not the financial aspect of care. Encouraging patients and physicians to discuss financial aspects of care could be helpful (Bestvina et al., 2014; Henrikson, Tuzzio, Loggers, Miyoshi, & Buist, 2014), but how and when financial burden should be included in the treatment, decision-making process requires more research. Social workers are uniquely positioned to assist with addressing financial burden in people with cancer. In addition to helping connect patients to resources to address treatment-associated costs, social workers have the ability to address the distress and anxiety associated with financial burden. Our results, combined with research showing the association of financial burden on survival in cancer (Ramsey et al., 2016), highlight the importance of economic well-being both for clinical practice and future research.
Footnotes
Declaration of Conflicting Interests
The authors declared no potential conflicts of interest with respect to the research, authorship, and/or publication of this article.
Funding
The authors disclosed receipt of the following financial support for the research, authorship, and/or publication of this article: The National Health and Aging Trends Study (NHATS) is sponsored by the National Institute on Aging (grant number: NIA U01AG032947) through a cooperative agreement with the Johns Hopkins Bloomberg School of Public Health.
