




Abstract
Keywords
Introduction
With increased longevity and better health care, people are more often dying expectedly from complex, chronic, life-threatening illnesses (Australian Institute of Health and Welfare, 2011b; Gómez-Batiste et al., 2012). In the last year of life, they frequently present to an emergency department (ED) and/or are hospitalized. Increased use is predominantly initiated as early as 3 months to death (Rosenwax et al., 2011). In the last 30 days, one in two attends an ED, and two in three are hospitalized (Goldsbury et al., 2015). The excess hospital use is challenging for planning a sustainable health care system and is associated with minimal gain in patients’ survival and poorer quality end-of-life care and death (Cardona-Morrell et al., 2016; Gómez-Batiste et al., 2012).
More than half the deaths among older people are clinically expected and are associated with one or multiple chronic conditions with known disease progression trajectories and care pathways (Gómez-Batiste et al., 2012; Rosenwax & McNamara, 2006). Facilitating out-of-hospital deaths and redirecting end-of-life care to less resource-intensive settings in the community have become health priorities (Cohen et al., 2008). Combined with palliative care provision, they are indicators of good end-of-life care and death (Cohen et al., 2008). Availability and use of community services including aged care, primary care, and, in particular, timely palliative care have reduced the cost and burden of end-of-life care on hospitals (Luta et al., 2016; Spilsbury, Rosenwax, Arendts, & Semmens, 2017; Wright, Youens, & Moorin, 2017).
Palliative care can de-escalate active and aggressive treatments for people at the end of life (particularly in acute settings) and support patient’s choices about place of care and death (Temel et al., 2010). It is estimated that two thirds of decedents can benefit from timely palliative care, which improves quality of life for patients with life-threatening illness and reduces excess hospital use (Murtagh et al., 2014). Those who receive palliative care in the community as early as 6 months before death experience fewer unplanned hospitalizations and ED presentations (Wright et al., 2017). Furthermore, early commencement of in-hospital palliative care (in earlier admissions or even at ED) can result in greater reduction in the cost of hospital care, shorter stays, and fewer in-hospital deaths among inpatients (Assareh, Stubbs, Trinh, Muruganantham, & Achat, 2018; Ireland, 2017; Stubbs, Assareh, Achat, & Jalaludin, 2018; Thomas, Mike, Joshua, & Dorothyann, 2015; Wu, Newman, Lasher, & Brody, 2013).
Aged care facilities are increasingly the place of usual residence and death among elderly individuals, leading to reduced in-hospital death rates (Black et al., 2016; Dasch, Blum, Gude, & Bausewein, 2015; Houttekier, Cohen, Surkyn, & Deliens, 2011), days in hospital (Kardamanidis, Lim, Da Cunha, Taylor, & Jorm, 2007), and hospital costs (Ireland, 2017). Having said that, the effect of health care supply on hospital use at end of life is inconclusive. Primary care supply influenced hospital utilization and care costs in the United States (Fisher et al., 2003). Conversely, supply measures for primary care, acute care, and aged care were not associated with care costs and in-hospital death in Switzerland (Luta et al., 2016; Panczak et al., 2017).
Individuals’ characteristics including age, gender, ethnicity, socioeconomic status and place of residence, and their health status and morbidities have driven hospital use at the end of life (Goldsbury et al., 2015). Studies report that the very elderly tend to have fewer hospital encounters (Bardsley, Georghiou, Spence, & Billings, 2016) and incur lower costs (Goldsbury et al., 2015; Panczak et al., 2017). Individuals living in nonmetropolitan areas reportedly have longer last stays in hospitals and higher in-hospital death (Goldsbury et al., 2015; Rosenwax et al., 2011; Spilsbury et al., 2017). Patients with cancer, compared with their noncancer counterparts, more frequently attend EDs and are hospitalized in their last months of life (Reeve et al., 2017); their hospital use increases in the presence of other morbidities (Spilsbury et al., 2017). Rapid deterioration of their health along with physical debility in the last weeks of life often requires resources beyond the capacity of primary care providers and community services (Lunney, Lynn, Foley, Lipson, & Guralnik, 2003). However, the known prognosis of cancer contributes to timely planning for palliative care and desired place of death (Boland & Johnson, 2013; Murray, Kendall, Boyd, & Sheikh, 2005) as observed in Australia and globally (Australian Institute of Health and Welfare, 2017a; National End of Life Care Intelligence Network, 2010; World Palliative Care Alliance, 2014).
Identifying the pattern of hospital use and its drivers is essential for service planning. Local efforts to optimize provision and integration of hospital and community services can be informed by (a) understanding the contribution of demographic, clinical and service availability factors on hospital use, and (b) measuring remaining variations within health care jurisdictions. Initiatives addressing patient-specific needs outside acute care settings can be supported by examining variations in service use by those who received palliative care and the role of potentially influential factors on patients. We used New South Wales (NSW, the largest health jurisdiction in Australia) wide data for a 6-year period to examine areal variations in hospital use, including ED presentations, days in hospital, and in-hospital deaths, by older NSW residents at the end of life.
Method
Data Source and Study Population
NSW has more than 7 million residents and approximately 500 health care facilities, with up to 3 million hospital admissions and close to 50,000 deaths per year (Agency for Clinical Innovation, 2015). We used linked data from the NSW Admitted Patient, Emergency Department Attendance and Deaths Register (APEDDR), NSW Ministry of Health Secure Analytics for Population Health Research and Intelligence (SAPHaRI) (Centre for Epidemiology and Evidence, 2017), to capture all NSW hospital ED presentations (Emergency Department Data Collection [EDDC]), hospital separations (admissions; Admitted Patient Data Collection [APDC]), and deaths (NSW Registry of Births, Deaths, and Marriages [RBDM]). Data of all NSW residents aged 65 years and older who died during 2010-2015 financial years (July 1, 2010, to June 30, 2016) were extracted from the RBDM death registration data. For each decedent (person who died), all APDC and EDDC records from all health care facilities in NSW with a discharge date within the last 3 months of their lives were identified and extracted. From these (254,617), only those who were NSW residents, had their last hospital admission in an NSW public acute-care hospital, and died in hospital or within 30 days of discharge were included (123,944; 48.8% of all records).
Each APDC record includes information on patient demographic data, morbidities and procedures, hospital characteristics, and separation status (discharged, transferred, and deaths). Each record is assigned up to 51 codes for morbidities and interventions (principal and secondary) based on the International Statistical Classification of Diseases and Related Health Problems, Tenth Revision, Australian Modification (ICD-10-AM) and the Australian Classification of Health Interventions, Eighth Edition (National Centre for Classification in Health, 2012). The EDDC collects information about presentations to all NSW public EDs and includes information on patient demographic data, morbidities, hospital characteristics, and separation status (admitted, discharged, transferred, and death). The record-linked APEDDR data sets include a unique patient identifier that enables the identification and linkage of all patient-specific records. Record linkage was carried out by the Centre for Health Record Linkage (Centre for Health Record Linkage, 2015). The de-identified data were accessed remotely through the SAPHaRI system made available by the NSW Centre for Epidemiology and Evidence (2017).
Outcomes and Characteristics
We examined three service use measures of intensity of end-of-life care (Luta et al., 2015): decedents’ number of ED attendances, total days spent in hospital (excluding time in ED) within their last 3 months of life, and death in their last hospital admission or within 30 days of discharge. We identified outcomes for two cohorts: all decedents and decedents who received palliative care in hospital.
We assessed three sets of covariates: decedents’ demographics and health status, characteristics of hospitals to which decedents were last admitted, and characteristics of areas where decedents resided. Demographics included sex, age, marital status, country of birth (regions), and year of death. Health status included the average Charlson comorbidity score over the last 3 months of life (Quan et al., 2005), the presence of selected chronic diseases considered amenable to palliative care based on ICD-10-AM (Australian Institute of Health and Welfare, 2011b; Murtagh et al., 2014; National Centre for Classification in Health, 2012), and, only for the all decedents cohort, whether the decedent received palliative care in hospital. Selected chronic conditions included cancer (C00-C97, D45, D46, D47.1, D47.3, Z03.1, Z08, Z12, Z13, Z40, Z51.0, Z51.1, Z54.1, Z54.2, Z80, Z85), heart failure (I50), chronic obstructive pulmonary disease (COPD; J40-J44), renal failure (N17-N19), liver disease (K70.4, K71.1, K72), dementia and neurodegenerative diseases (F00-F03; G10, G12.2, G20, G21, G22, G30), and HIV/AIDS (B20-B24) (Australian Institute of Health and Welfare, 2011b, 2014; Murtagh et al., 2014). Chronic conditions were flagged if diagnosis codes were recorded in any admission within the last 3 months of life (Assareh, Achat, Stubbs, Guevarra, & Hill, 2016) and then grouped to “cancer only,” “cancer and other chronic conditions,” “noncancer chronic conditions,” and “no chronic conditions.” Palliative care patients were identified based on either hospital “care type” being coded as palliative care or the presence of an ICD-10-AM diagnosis code of Z51.5 (Australian Institute of Health and Welfare, 2011a; NSW Health, 2013). Decedents having either of these codes were identified as palliative care.
Public hospitals account for a half of Australian facilities and are funded by the government. They accommodate almost two thirds of acute beds and annual hospitalizations (Australian institute of Health and Welfare, 2016a). Public hospital characteristics included hospital location (metropolitan vs. rural), peer groups (which ranged from D1b: community hospital without surgery with less than 200 acute admissions per annum, to A1: principal referral hospitals with more than 35,000 acute admissions per year, totaling 115 hospitals; NSW Health, 2016), and whether the hospital had a palliative care unit based on administration data (Australian Institute of Health and Welfare, 2017d). The term “palliative care unit” refers to a hospice unit/ward where patients receive palliative care under a palliative care team or in rural/regional areas under a medical practitioner.
We used Local Government Area (LGA; 153 in total at the end of the study period; NSW Legislation, 2016) as the areal unit. Areal characteristics for decedents’ place of residence included socioeconomic status (Index of Relative Socio-Economic Advantage and Disadvantage of Socio-Economic Indices for Areas [SEIFA]; Australian Bureau of Statistics, 2011), remoteness (Accessibility/Remoteness Index Australia Plus [ARIA+]; Glover & Tennant, 2003), the distance to the last admitted hospital, and supply of primary care and aged care services. The approximate distance to the last admitted hospital was calculated from the centroid of residential LGA. General practitioners (GPs) are usually the first port of call in the Australian health care system, and a universal government-funded medical insurance scheme covers part, if not all, of the cost of a person’s costs for a service use. There are approximately 110 GPs per 100,000 population, and GPs’ expenditure accounts for nearly 10% of the government funds for health care (Britt et al., 2016). We adopted the Geographically-adjusted Index of Relative Supply (GIRS) of GPs, developed by the Australian Institute of Health and Welfare (AIHW), which ranges from zero, areas with least supply, to eight (Australian Institute of Health and Welfare, 2016b). In Australia, the government subsidizes the cost of aged care and recipients contribute through fees and payments. Aged care supply was based on the number of funded aged care beds in 2015 (nearly 90,000 places) across NSW localities (Australian Institute of Health and Welfare, 2017c). We aggregated areal characteristics to LGA level using appropriate concordance references where data were provided for finer areal units (Australian Bureau of Statistics, 2006). Areal indices were then converted to categories based on either their quartiles or established groups (Glover & Tennant, 2003). Records of 13,445 decedents (10.9% of all decedents) and 4,252 decedents who received palliative care (12.2% of all palliative care decedents) were excluded due to missing covariates.
Statistical Analysis
We employed a Bayesian hierarchical scheme and developed spatial models to investigate influencing factors and areal variation in service use across NSW LGAs. Negative binomial, log-normal, and logistic models were, respectively, used to derive adjusted estimates and areal variations in the number of ED presentations, total days spent in hospital, and place of death (in-hospital vs. out-of-hospital). We followed the model specification proposed for spatial models in Gaussian Markov Random Field framework (Rue, Martino, & Chopin, 2009). We used two random effects components: a spatially structured random effect, which was modeled as a so-called intrinsic Conditionally Autoregressive (iCAR), and a spatially unstructured effect, which was modeled as an independent normal distribution (Besag, York, & Mollié, 1991; Rue & Held, 2005). The former accounts for any spatial autocorrelation, whereas the latter captures unexplained variation across LGAs and over dispersion. Spatial dependencies between LGAs were limited to those with shared borders. To quantify and account for interhospital variation in examining in-hospital death, we also included an independent random effect for hospitals. All other individual, areal, and hospital covariates were set as categorical variables and assumed to have fixed effects. Adjusted trends were obtained by multiplying yearly estimated effects with the crude estimate of the reference year (2010); an odds to rate ratio conversion method was used for in-hospital death trends (Grant, 2014).
We used noninformative prior distributions (Rue et al., 2009). We let fixed effects follow a zero-mean normal distribution with a very large variance of 1,000. The unstructured random spatial term and other independent random effects terms were set as a zero-mean normal distribution with an unknown precision following a Gamma distribution with shape and scale parameters of 1 and 2,000, respectively. A similar Gamma prior distribution was also used for the precision parameter of the structured spatial term in iCAR. This setting led to noninformative priors with large variances imposing no pattern (Schrödle & Held, 2011). Multiple models with different sets of covariates were constructed, and proportional change in variances was reported to assess the contribution of influencing factors on areal variation in outcomes. Median rate/mean/odds ratios (MR) were used to translate variations into differences (Merlo et al., 2006). Models with the lowest deviance information criterion (DIC; Spiegelhalter, Best, Carlin, & Van Der Linde, 2002) were chosen to obtain effect estimates and corresponding 95% credible intervals (CIs). We used a pairwise Pearson correlation on areal and hospital-specific estimates to assess association between outcomes within LGAs and hospitals. All analyses were implemented for both cohorts—all decedents and palliative care decedents. Decedents with missing information (13,445; 10.8% of the study population) were excluded from all analyses. In sensitivity analyses, multicollinearity between factors was examined and found to be nonsignificant. Missing values in covariates were random and estimated coefficients remained unchanged where missing categories were used or cases with missing values were included in reduced models. No deviation in results was seen when less defuse prior distributions, including a normal distribution with a variance of 5, 10, and 100 and a Gamma with a smaller scale parameter of 10 or 100, were employed. Use of a more highly informative prior which may affect likelihood and lead to different results is not justifiable in the absence of any prior evidence. In our preliminary analysis, we found multiple modifications by palliative care status on covariates’ effects across all outcomes. Between seven and nine covariates had varying degrees of significant interaction terms with palliative care status. For simplicity, we estimated the effects and variations among palliative care decedents directly and highlighted the modifications where they were important and were statistically supported by the estimated interactions (not presented in the manuscript).
The spatial models were computed using Integrated Nested Laplace Approximation (INLA) methods (Schrödle & Held, 2011). Data preparation was conducted in SAS Enterprise Guide version 6.1 (SAS Institute, 2013) through SAPHaRI (Centre for Epidemiology and Evidence, 2017), and analyses were performed using INLA package (Schrödle & Held, 2011) in R environment version 3.3.0 (R Core Team, 2018).
Results
Descriptive Analysis
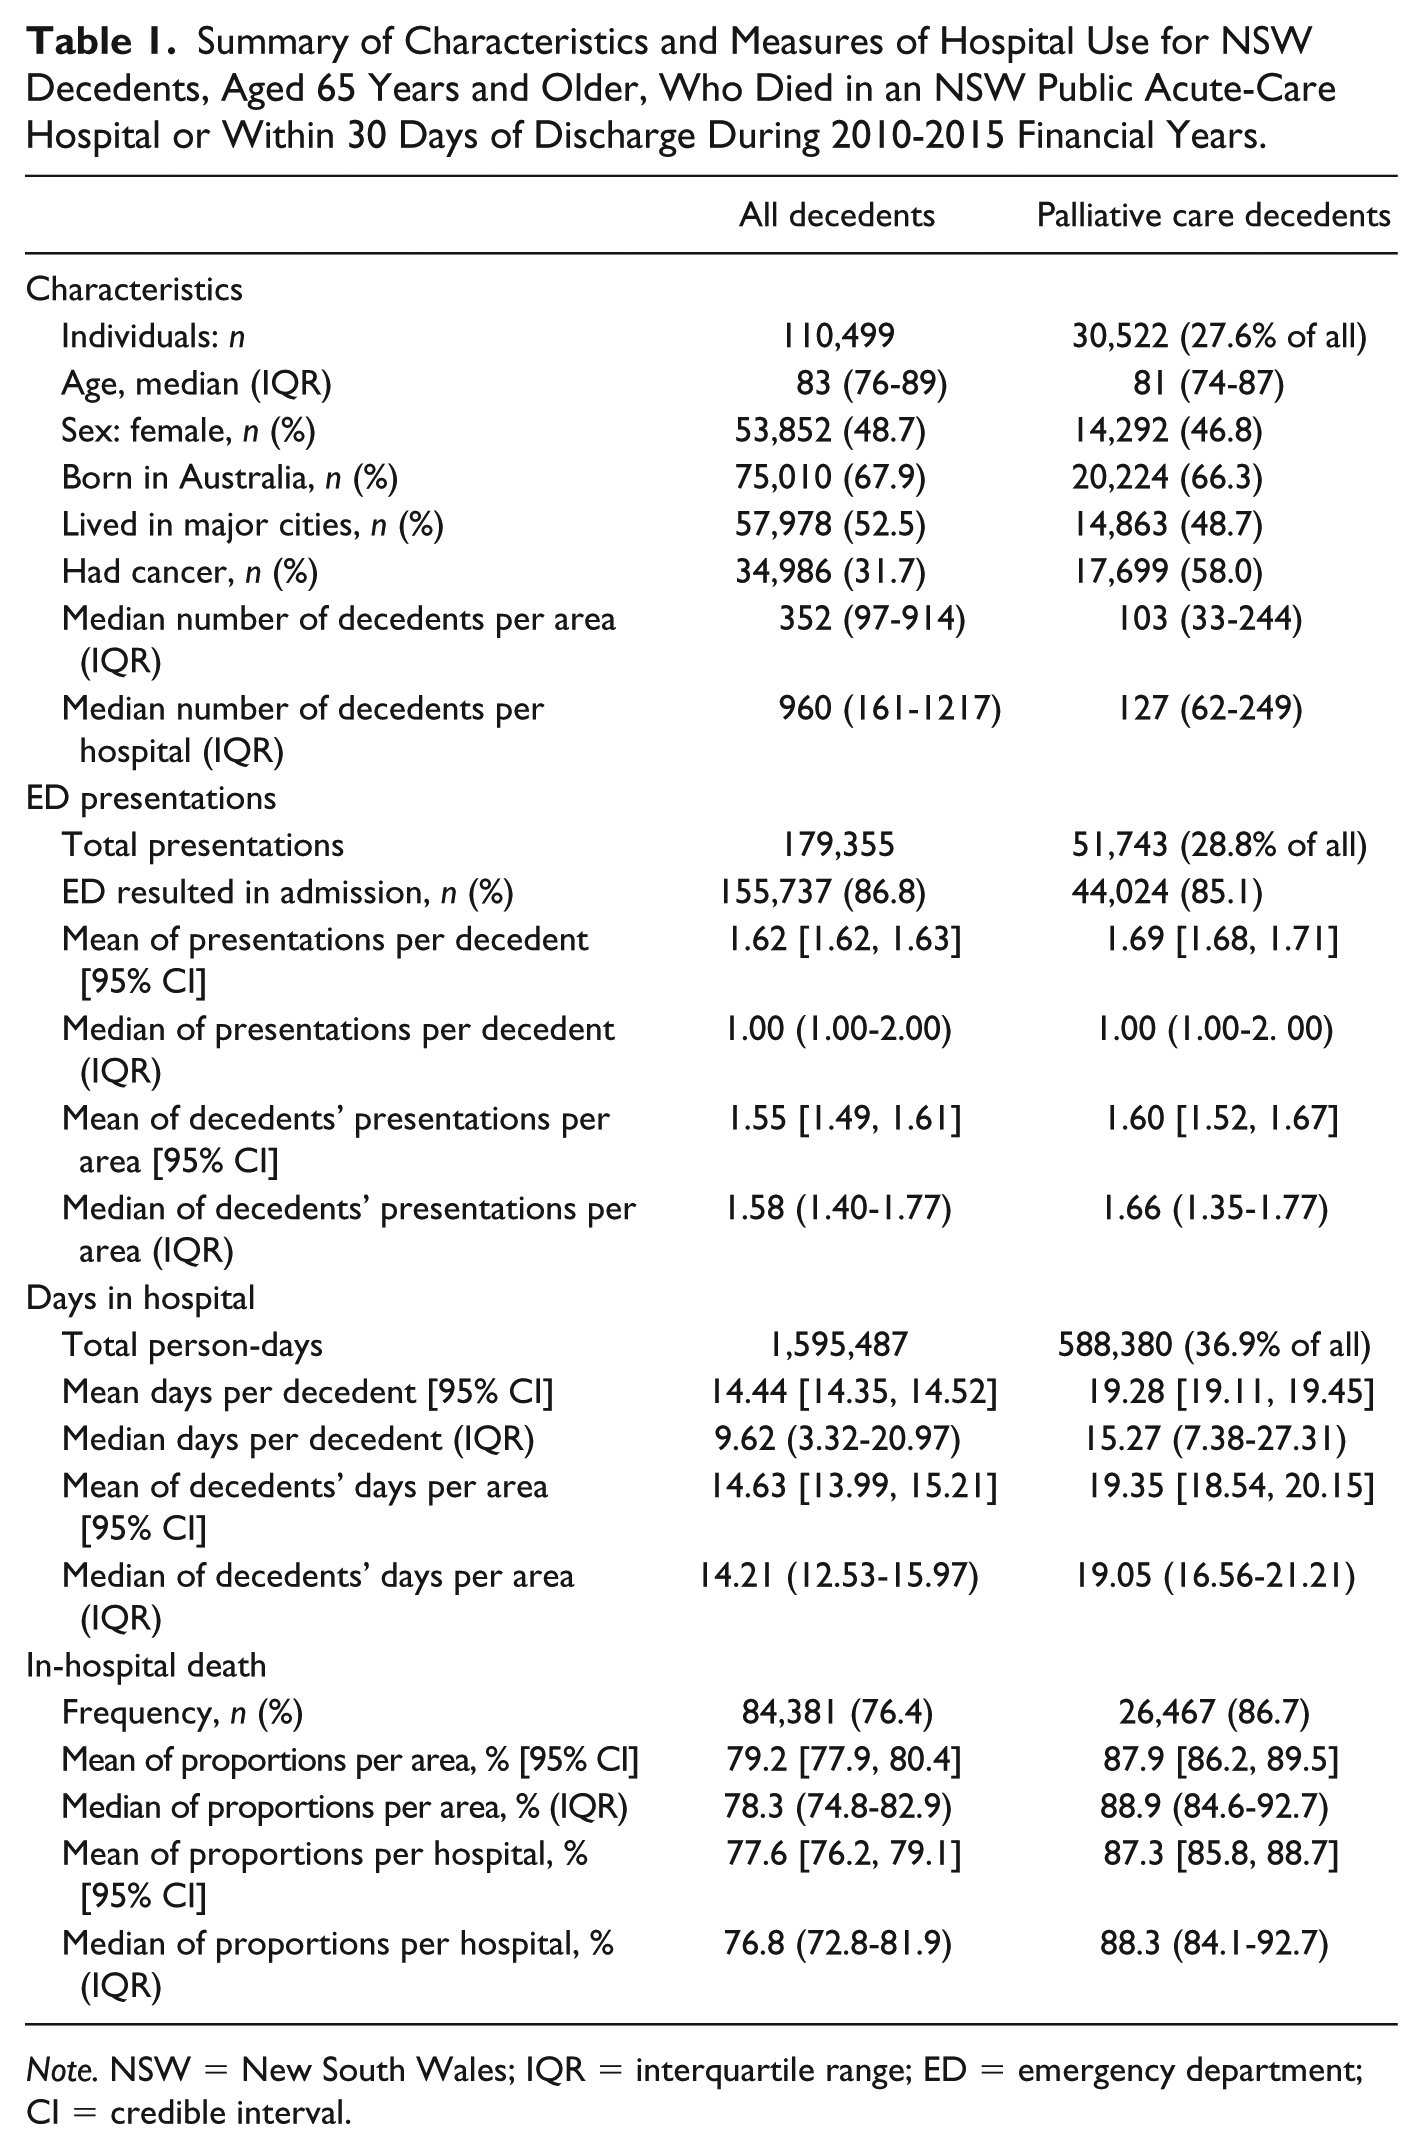
Over a 6-year (2010-2015) period, 110,499 NSW residents aged 65 years or older died in NSW public acute-care hospitals (76%) or within 30 days of discharge (24%). Half (49%) were female and median age at death was 83 years (interquartile range [IQR], 76-89). Two thirds were born in Australia, one half lived in major cities, and one third had cancer (Table 1). Twenty-eight percent of decedents received palliative care in hospital. The median age at death was slightly lower for palliative care decedents (81 years; IQR, 74-87), more than half of whom had cancer. Within the last 3 months of life, NSW decedents had 179,355 ED presentations and spent more than 1.5 million person-days in hospital, averaging 1.6 ED presentations and 14.4 days for each individual. Palliative care decedents had 1.7 ED presentations, spent 19.3 days in hospital, and were more likely to die in hospital (87%). Approximately nine in 10 decedents who presented to ED were hospitalized. Summary statistics were stratified by characteristics of decedents, the area they lived, and the hospital to which they were last admitted and are reported in the Supplemental Appendix (Tables 4 and 5).
Summary of Characteristics and Measures of Hospital Use for NSW Decedents, Aged 65 Years and Older, Who Died in an NSW Public Acute-Care Hospital or Within 30 Days of Discharge During 2010-2015 Financial Years.
Note. NSW = New South Wales; IQR = interquartile range; ED = emergency department; CI = credible interval.
Contributing Factors
Compared with females, males had higher hospital use (ED presentations for both cohorts, days in hospital for palliative care decedents) but a similar in-hospital death rate. ED presentations and in-hospital death decreased with age in both cohorts (Table 2). Days in hospital were higher for older decedents; this effect was not observed among palliative care decedents. Compared with Australian-born decedents, those who were born overseas, and particularly in Asia, spent fewer days in hospital but more often died there. The effect of ethnicity did not persist across outcomes and was less evident among palliative care decedents.
Effect of Characteristics of Individuals, Areas Where They Lived, and Hospitals to Which They Were Last Admitted on Measures of Hospital Use for NSW Decedents, Aged 65 Years and Older, Who Died in an NSW Public Acute-Care Hospital or Within 30 Days of Discharge During 2010-2015 Financial Years.

Note. Mean ratios, odds ratios, and related 95% CIs were adjusted for all decedent, areal, and hospital factors where appropriate and obtained using Bayesian spatial models with negative binomial (ED presentations), log-normal (days in hospital), and logistic (in-hospital death) link functions. NSW = New South Wales; ED = emergency department; CI = credible interval; SEIFA = Socio-Economic Indices for Areas; ARIA+ = Accessibility/Remoteness Index Australia plus; GIRS = Geographically-Adjusted Index of Relative Supply.
Estimates of factors were obtained from the second best model, as the best model excluded areal factors.
95% CI does not include 1.
Effects of hospitals factors and “distance to hospital last admitted” were only analyzed for in-hospital death measure.
Compared with decedents with cancer only, those who had multimorbidities, including cancer, had higher hospital use and in-hospital death rate. Decedents without any chronic conditions had fewer ED presentations and days in hospital, but had increased odds of in-hospital death. Those who received palliative care in hospital had a slightly higher number of ED presentations, spent twice as many days in hospital, and had one and a half excess odds of in-hospital death than those who did not.
Decedents from deprived areas had more ED presentations and were more likely to die in hospital compared with those residing in advantaged areas. Those who resided outside of major cities spent fewer days in hospital, but were more likely to die there. Areal service supply measured by general practitioner supply and aged care beds had minimal or inconclusive effects on hospital use at the end of life. In-hospital death rate increased with the decedents’ distance from the hospital where they were last admitted. However, this effect did not persist among palliative care decedents.
Among all decedents, smaller hospital size was associated with decreased in-hospital death, except for the very small community hospitals without surgery. Hospital locality (rural/urban) and availability of palliative care unit in the facility had no effect on place of death for both cohorts.
Trend Analysis
Over the study period, mean ED presentations increased by 13%—from 1.5 to 1.7 per decedent (Figure 1). The increase was larger for palliative care decedents (20%)—from 1.5 to 1.8. However, the average number of days in hospital decreased for all and for palliative care decedents by approximately 12% (14.9-13.1 days) and 9% (20.3-18.5 days), respectively. The proportion of in-hospital deaths dropped by 8% for all (78%-72%), but remained steady at 87% for palliative care decedents.

Crude and adjusted trends of measures of hospital use by NSW decedents, aged 65 years and older, who died in an NSW public acute-care hospital or within 30 days of discharge during 2010-2015 financial years.
Areal Variation Analysis
For all decedents, the crude median number of ED presentations per decedent varied between 1.4 and 1.8 (IQR), across LGAs (Table 1); less than a fifth was explained by contributing factors. A similar pattern was evident for palliative care decedents (Table 3). Adjusted ED presentation ratios (vs. the NSW average) varied between 0.29 and 1.50 across NSW LGAs; 58 and 29 LGAs (57% of all LGAs) had a higher or lower number of ED presentations by decedents, respectively (Figure 2).
Areal and Interhospital Variation in Measures of Hospital Use and Contribution of Influencing Factors for NSW Decedents, Aged 65 Years and Older, Who Died in an NSW Public Acute-Care Hospital or Within 30 Days of Discharge During 2010-2015 Financial Years.

Note. ED = emergency department; CI = credible interval, and was calculated using a two-tailed chi-square distribution; MR = median mean/odds ratio, and was calculated as
Variance reductions are the proportional difference (decrease) in the estimated areal and interhospital variations between the extended models and the reference model (crude variations).
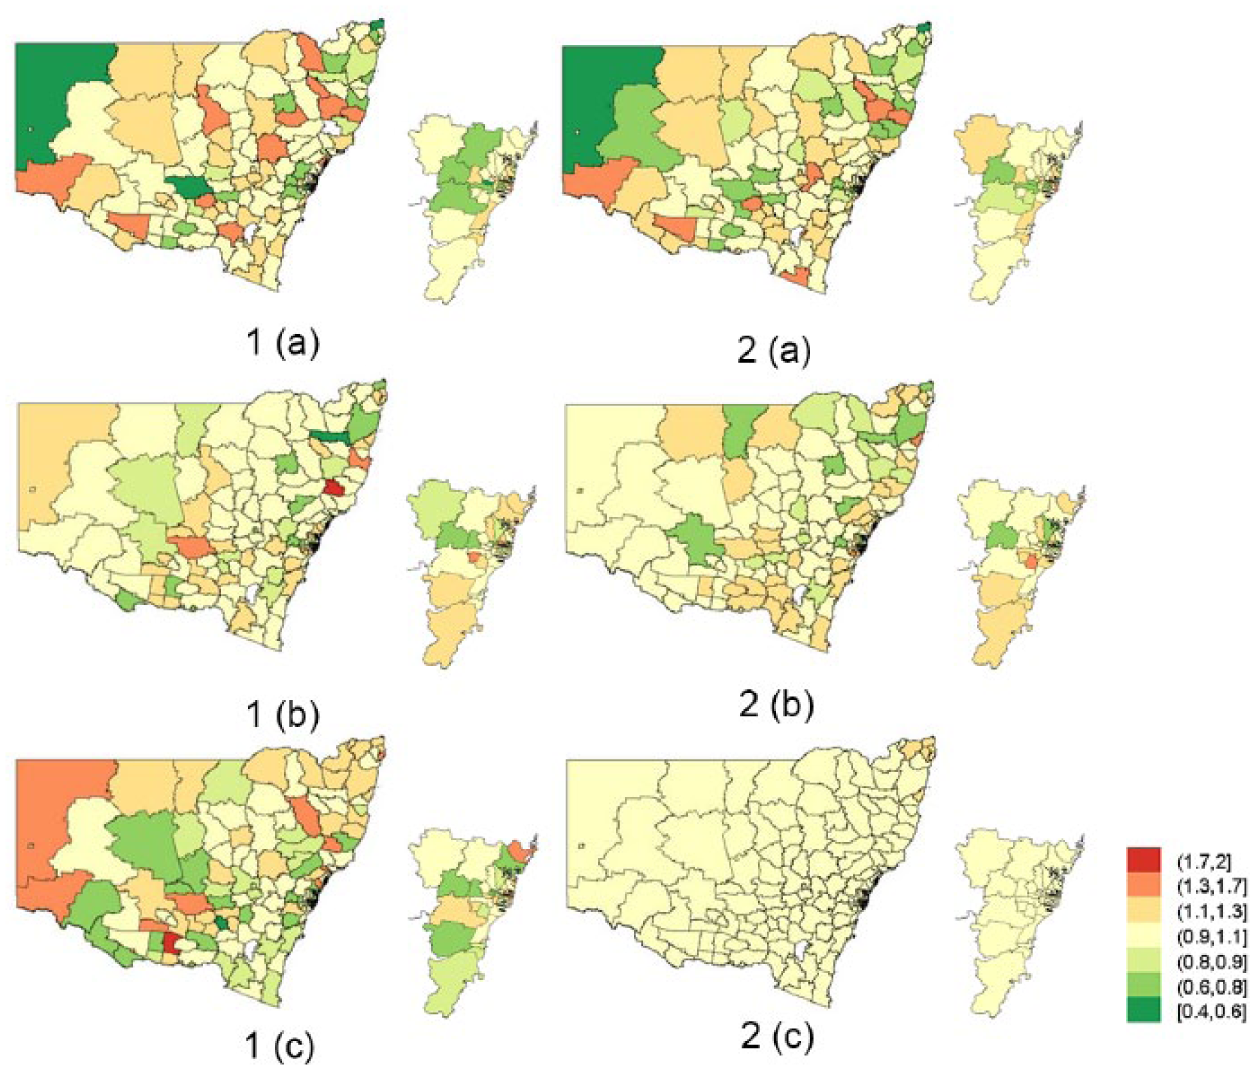
Relative measures of hospital use for each LGA in NSW by (1) all decedents, (2) in-hospital palliative care decedents, aged 65 years and older, who died in an NSW public acute-care hospital or within 30 days of discharge during 2010-2015 financial years.
Across LGAs, days spent in hospital varied between 13 and 16 days (IQR) among all decedents (Table 1). Three quarters of the variance were explained by contributing factors, mostly by decedents’ characteristics (Table 3). Adjusted days in hospital ratios ranged between 0.54 and 1.77; 30 and 21 LGAs (33% of all LGAs) had more or fewer decedent days in hospital, respectively, than the NSW average (Figure 2). The corresponding variation among palliative care decedents was smaller and mostly remained unexplained by examined factors.
As summarized in Table 1, the proportion of in-hospital death varied between 75% and 83% (IQR) across LGAs and slightly more widely across hospitals (IQR, 73%-82%). The additional inclusion of interhospital variations and associated hospital factors explained most of areal variations, leaving only a 13% (MR = 1.13) unexplained gap in odds across LGAs (Table 3), compared with the gap of 24% (MR = 1.24) when only adjusting for decedent and areal factors. The adjusted in-hospital death odds ratios varied between 0.49 and 1.70; five and 22 LGAs (18% of all LGAs) had higher or lower odds than the NSW average, respectively (Figure 2). Interhospital variation largely explained the areal variation among palliative care decedents.
The relationship between outcomes across LGAs was weak (Supplemental Appendix—Table 6). In LGAs where decedents had more ED presentations, decedents tended to have fewer days in hospital and in-hospital deaths.
Discussion
Main Findings
This large study identified that within the last 3 months of life, NSW decedents with a hospital admission within 30 days of death, on average, had 1.6 ED presentations, spent 14 days in hospital, and three in four died in hospital. Compared with all decedents, those who received in-hospital palliative care had more hospital use and higher odds of in-hospital death. Over the 6-year period, ED presentations increased, whereas days in hospital decreased for both cohorts. In-hospital death noticeably decreased among all decedents; however, the rate among palliative care patients remained stable. Decedents’ demographics and their health status were associated with hospital use; primary care and aged care supply had no or minimal influence, contrary to other areal factors. Only one sixth of areal variation in ED presentations was explained by contributing factors. Areal variation in days in hospital and in-hospital death was largely explained by confounders. There was a 17% to 25% difference in hospital use by decedents across NSW areas; the difference was 4% to 22% among palliative care decedents. Between 18% and 57% of patients’ areas of residence had hospital use that differed from the average. There was a weak association between measures of hospital use within areas.
Hospital Use at the End of Life
Globally, use of health care services and associated costs exponentially increase as death approaches (Langton et al., 2014). Our hospital use estimates are comparable to other Australian and overseas studies that used similar cohorts, measures, and time period before death (Goldsbury et al., 2015; Reich, Signorell, & Busato, 2013). We identified a noticeable increase in the adjusted number of ED presentations over a 6-year time span, consistent with the trend observed among all older people (Australian Institute of Health and Welfare, 2017b) and the trajectory in previous years (Reeve et al., 2017). The observed decreasing trend in days in hospital and in-hospital death could be cost- or performance-driven (NSW Health, 2015). More frequent and earlier transition to less resource-intensive care providers or settings may also be influential (Reeve et al., 2017; Wright et al., 2017).
We acknowledge that people with complex chronic conditions nearing death have needs that might be best met by multidisciplinary teams at hospitals (Tran, Falster, Girosi, & Jorm, 2016). The large proportion of ED presentations resulting in hospitalization in NSW and elsewhere may reflect appropriate ED encounters (Spilsbury et al., 2017). Having said that, the load on EDs could be eased by outpatient services and the integration of hospital geriatric care resources with community services (Butler, Frank, & Counsell, 2015; Delgado-Guay et al., 2015). Established outreach services supported by hospital specialist teams could empower carers at home and in aged care facilities to respond to nonacute needs. Place of care in the community could be maintained and unnecessary ED presentations reduced.
Palliative Care and Hospital Use
Underutilization of palliative care and its late initiation can jeopardize its benefits for the health care system and patients, including the realization of out-of-hospital death (Burge et al., 2015; NSW Ministry of Health, 2012). A recent study reported that for those who received palliative care in NSW hospitals, care was initiated 8 days before death, and for only one in seven decedents, care commenced in admissions before their terminal admission (Assareh, Stubbs, Trinh, Greenaway, et al., 2018). We observed higher hospital use by palliative care patients. This could have been boosted by, first, the level of care required by this cohort who often had cancer and multiple other chronic and severe conditions, and, second, an insufficient or ineffective response to their needs in hospital (e.g., late palliative care) as well as the community (e.g., lack of services or access to services). Higher hospital use and in-hospital death for palliative care decedents, as also observed in France, warrant evaluation of palliative care implementation and effectiveness (Poulalhon et al., 2017). The use of standardized assessment tools, such as NECPAL (Necesidades Paliativas [palliative needs]; Gómez-Batiste et al., 2016) and CriSTAL (Criteria for Screening and Triaging Appropriate Alternative Care; Cardona-Morrell & Hillman, 2015), can result in better communication and timely transition to palliative care. Such tools can support the de-escalation of aggressive treatments that have minimal gains and redirect care to less resource-intensive services and settings (Reyniers, Houttekier, Cohen, Pasman, & Deliens, 2014). However, all of these need to occur within the context of patient preference.
Influence of Individual Characteristics
Hospital use varies by individual characteristics. We observed that the very elderly experience fewer ED presentations and in-hospital deaths, comparable to other studies (Bardsley et al., 2016; Goldsbury et al., 2015; Panczak et al., 2017), but more days in hospital. Expectation of death among the very elderly and care provided by aged care facilities contribute to decreased hospital use (Black et al., 2016; Ireland, 2017). Varying time to death interval (6-12 months vs. 3 months before death), measure of hospital use (e.g., number of admissions vs. length of stay), cohort (all population vs. those with hospital admission within 30 days of death), and settings with different primary and community care provision would likely yield differences in findings. Other individual characteristics and circumstances such as social support, living arrangement, communication and language barriers, and cultural attitudes determine place of care and death (Calanzani, Koffman, & Higginson, 2013; Goldsbury et al., 2015; Taylor, Ensor, & Stanley, 2011); these may have been indirectly accounted for by the characteristics we examined.
Influence of Areal and Care Provider Factors
Despite the well-expanded public health care system in Australia and other developed countries, people experience varying quality of care and health outcomes depending on their place of residence. Across NSW LGAs, we found considerable geographic variations in measures of hospital use by decedents, yet were unable to fully explain their causes. The effect of remoteness of residential area on ED presentations and hospitalization at the end of life was inconclusive, although longer last stay and higher in-hospital death among nonmetropolitan individuals have been reported (Goldsbury et al., 2015; Rosenwax et al., 2011; Spilsbury et al., 2017). This is in line with our finding of excess in-hospital death, with distance to usual place of residence possibly caused by an inability to return home or a lack of support, ability, or willingness to transition to closer alternative settings. Lower health literacy and a lack of additional financial resources to utilize community-based care services may contribute to the excess ED presentations and in-hospital deaths among those from more deprived areas (Goldsbury et al., 2015; Spilsbury et al., 2017).
Our observed ranges in adjusted relative ED presentations and days in hospital across NSW LGAs were substantial and comparable to the variation in end-of-life cost ratios across Swiss localities (Panczak et al., 2017). It is concerning that the number of ED presentations was significantly different from the average for decedents from half of NSW LGAs, and one third had a significantly different number of days in hospital than average, after accounting for individual characteristics and health status. We found that neither level of general practitioner availability nor aged care bed supply was associated with hospital use at end of life, comparable to a recent Swiss study (Panczak et al., 2017). This suggests that the availability of the examined alternative services may not influence hospital utilization at the end of life, and local and targeted interventions might need to be considered. Efforts are warranted to (a) enhance integration and continuity of care between acute- and community-based care resources (Bakitas et al., 2009; Brumley et al., 2007; Butler et al., 2015), in particular expansion of community palliative care at the local level (Chiang, Kao, & Lai, 2015; Wright et al., 2017), and (b) facilitate access and increase use by removing potential individual-level barriers in awareness, communication, and financial burden (Bakitas et al., 2009; Brumley et al., 2007; Zhang, Wright, Huskamp, & et al, 2009).
Our analysis of individuals with hospital admission within their last 30 days of life revealed that the hospital which the patient was admitted to had a distinct impact on place of death, far more than the areal factors of patient’s residence. This is consistent with U.K. findings of the considerable influence of the hospital predominantly used by an individual on the number of admissions, bed days, and in-hospital death, compared with health service supply factors (Bardsley et al., 2016). Individual hospital characteristics may also influence place of death (Assareh, Stubbs, Trinh, Muruganantham, et al., 2018), as reflected in a persistent hospital-specific relative rate of in-hospital death for all decedents, including palliative care decedents. Studying decedents’ journeys across hospitals and community services will provide additional insight into the interplay between care providers and services used at end of life (Assareh, Achat, Levesque, & Leeder, 2016). Compared with small hospitals, larger hospitals may admit and transfer in patients with more complex illnesses in their last days of life. Our case-mix adjustment may have underestimated patient severity in larger hospital, which could have contributed to their excess in-hospital deaths.
Variation Across Areas
In our analysis of hospital use during the last 3 months of life, the extent of areal variation differed across the three outcomes—ED presentations, days spent in hospital, and in-hospital death—and the contribution of examined factors varied for each. In summary, ED presentations mostly remained unexplained, intuitively reflecting lack of use of local alternative services by those in need, independent of their health status. It is also important to consider patients’ and carers’ choices in presenting to ED instead of using other services and the basis for their choices. However, how long an individual spent in hospital was mostly driven by clinical factors and their health status, more than where they lived or characteristics of local community alternatives. Although out-of-hospital death is often desired by patients and the health system, the health status of dying patients and hospital characteristics, including proximity to patients’ residential area, had a major influence on place of death. The greater variation across hospitals compared with patients’ areas of residence points to the significance of hospital-specific characteristics (e.g., peer groups and unmeasured factors such as local policies and practices) in reducing in-hospital death. Substantial and unexplained variations exist in acute care service use across NSW LGAs. These reinforce the importance of hospitals recognizing individual preferences and engaging with family and community care providers to facilitate desired location of care and death and reduce nonbeneficial care. An in-depth study of areas with deviated hospital service use can aid our understanding of system factors on delivery of end-of-life care that maintains the efficiency of the health care system and meets decedents’ needs and desires.
Limitations and Strength
Our study had a number of limitations. As it was based on administrative data, it lacked information on disease severity, functional abilities, and individual needs and preferences, which limit the findings to a condition-based approach rather than a needs-based one (Murtagh et al., 2014). Inclusion of individuals’ use of community-based services, including primary care and aged care, as well as other areal factors such as referral patterns would complement our analysis. Analysis at finer geographical units would better assess areal differences and minimize ecological fallacy. Our design was not population-based, lacking examination of characteristics of those who were not hospitalized within the last month of life and not capturing interstate hospital use. We partially addressed the absence of cause of death data by accumulating diagnoses information across hospital admissions (Assareh, Achat, Stubbs, et al., 2016), which has been found relevant in studying hospitalization measures (Bardsley et al., 2016). Hospital use measures and the 3 months to death period were chosen intuitively (Rosenwax et al., 2011). We selected outcomes that were among recommended measures for intensity of care at the end of life (Luta et al., 2015) and our time period to death corresponds to the period with excess service use (Rosenwax et al., 2011), both of which make country-wide and overseas comparisons possible. A sensitivity analysis performed over 12 months produced results comparable to shorter periods (Panczak et al., 2017). Our study benefited from large cohorts from population-based record-linked data sets to quantify variations in hospital use across a large jurisdiction in Australia while accounting for individual, areal, and hospital differences. Our findings are relevant to developed and developing nations with an aging population where government-funded primary and acute care settings aim to improve access, efficiency in use, and sustainability of the health care systems. Our findings help to better understand disparities in health care due to contributing factors, including the geographic area in which decedents and subgroups may be clustered, and will inform local efforts and targeted interventions.
Conclusion
There are considerable variations in health service use measures at the end of life across NSW. These were partially explained by individual characteristics and health status. Although the effects of areal measures of socioeconomic status and remoteness were moderate, primary care and aged care supply did not influence hospital use. Our findings suggest inadequate capacity or interaction between acute settings and community-based services at localities across NSW and potential autonomous operation at individual hospitals. The observed disparities can inform local efforts to strengthen access and use of community care services, which will enhance continuity and transition of care between hospital and community services. Further investigations should incorporate additional individual-level data, such as preferences, social support, and use of community care, to better account for the causes of observed variations in hospital use at the end of life and to support palliative care services.
Supplemental Material
Appendix_20180717 – Supplemental Material for Variation in Hospital Use at the End of Life Among New South Wales Residents Who Died in Hospital or Soon After Discharge
Supplemental Material, Appendix_20180717 for Variation in Hospital Use at the End of Life Among New South Wales Residents Who Died in Hospital or Soon After Discharge by Hassan Assareh, Joanne M. Stubbs, Lieu T. T. Trinh, Poorani Muruganantham, Bin Jalaludin and Helen M. Achat in Journal of Aging and Health
Footnotes
Acknowledgements
The authors wish to thank Deanna Pagnini, Australian Institute of Health and Welfare, for her support in using the GIRS indicator.
Declaration of Conflicting Interests
The authors declared no potential conflicts of interest with respect to the research, authorship, and/or publication of this article.
Funding
The authors received no financial support for the research, authorship, and/or publication of this article.
Ethical Approval
Ethical approval was obtained from the NSW Population and Health Services Research Ethics Committee (HREC/16/CIPHS/37).
Supplemental Material
Supplemental material for this article is available online.

References
Supplementary Material
Please find the following supplemental material available below.
For Open Access articles published under a Creative Commons License, all supplemental material carries the same license as the article it is associated with.
For non-Open Access articles published, all supplemental material carries a non-exclusive license, and permission requests for re-use of supplemental material or any part of supplemental material shall be sent directly to the copyright owner as specified in the copyright notice associated with the article.
