
Abstract
Introduction
Population-representative studies suggest that contrary to intuition, major experiences of lifetime discrimination are higher among those with more education. This is true not just for minority groups but also on average in multiracial samples (Kessler, Mickelson, & Williams, 1999; Luo, Xu, Granberg, & Wentworth, 2012). Recent findings indicate that educational attainment itself has genetic roots (Lee & et al, 2018; Okbay et al., 2016). Importantly, genetic measures based on these results are strongly pleiotropic: They impact a range of life course and health outcomes (Krapohl et al., 2017; Marioni et al., 2016). If they also influence experienced discrimination, they may confound its apparent connections to such factors. Moreover, if genetic effects were direct, controls for education—common in social science studies—would not eliminate such confounding. Yet, no population-representative studies have queried these patterns. The current study used data from the 2010 wave of the U.S. Health and Retirement Study (HRS) to fill these gaps. Due to delimitations in genetic data collection, analysis was conducted only among Black and (separately) White participants.
Major Discrimination, Race, and Education
Reports of major discrimination experiences are highly prevalent. In one of the first population-representative studies on the topic, drawing upon the first wave of the Midlife Development in the United States (MIDUS) survey, Kessler and colleagues (1999) reported lifetime prevalences ranging from a high of 16% for not being hired for a job to a low of 2% for being forced to leave a neighborhood because of discrimination. A full one third of respondents reported at least one major experience in their lifetime. Mental as well as physical health consequences of such incidents are well established (Assari & Lankarani, 2018; Lewis, Cogburn, & Williams, 2015; Luo et al., 2012; Paradies, 2006).
As noted, a curious and consistent finding has been greater reports of these experiences among those with more education. For ethnic or other minorities, more exposure to objective events than socioeconomic peers in majority groups may partly explain the pattern. An early study, for instance, found that Black male high school graduates were 70% more likely to experience involuntary unemployment than Whites with similar attributes (Wilson, 1996). Moreover, this disparity was wider among those with more education (Pager & Shepherd, 2008). “Status inconsistency” may also play a role in shaping discrimination perceptions. Sociological theory has long emphasized that individuals may occupy contradictory positions on different dimensions of a social hierarchy at the same time (Hughes, 1944; Lenski, 1954). Such structural positions could induce conflicting expectations about social treatment, interactional difficulties, and consequent emotional distress (Dressler, 1988). Highly educated minority women and men encountering worse social treatment than their class-based expectations, then, may be more likely to code such events as discrimination.
Minority experiences, however, do little to explain why the pattern also emerges in population-representative samples in general. Such findings have consistently appeared in the literature—ranging from Kessler et al.’s (1999) original report to a more recent one based on the 2006 and 2008 HRS waves (Luo et al., 2012). Recent findings on the genetic antecedents of education suggest they may be more endogenous to the individual than previously known. The next section lays out these arguments.
Genes, Education, and Discrimination
The fact that educational attainment is shaped by various dimensions of a person’s life ecology is beyond dispute (Brückner & Mayer, 2004; Hu & Kuh, 2002; Zhou & Kim, 2006). However, evidence is also accumulating on its genetic roots. Overall, genes seem to account for at least 20% of the variation across individuals (Okbay et al., 2016; Rietveld & et al, 2013). These effects are best conceptualized as polygenic—reflecting the aggregate effect of many different genes. In a recent genome-wide association study (GWAS), for instance, the Social Science Genetic Association Consortium (SSGAC) identified 74 loci linked to years of schooling completed. The out-of-sample mean predictive power of a polygenic score (PGS) constructed from all measured single nucleotide polymorphisms (SNPs) was 3.2% (p = 1.18 × 10−39). As explained below, the score made available by HRS was based on this study. A newer analysis of approximately 1.1 million individuals identified 1,271 independent genome-wide-significant SNPs, and the corresponding PGS explained 11% of the variance in educational attainment (Lee et al., 2018).
Variants of the education PGS are also known to be strongly pleiotropic—impacting a range of factors beyond education itself. If they also covary with discrimination, they may confound apparent effects of such experiences on these outcomes—and/or vice versa. For instance, they have been shown to influence health outcomes including longevity (Marioni et al., 2016), impaired neurobiological profiles (Lin et al., 2018), Alzheimer’s disease (Zhu et al., 2018), and smoking (Wedow et al., 2018). These genetic scores also seem to impact factors that may influence discrimination experiences and perceptions—including personality traits from the neuroticism and openness domains (Mõttus, Realo, Vainik, Allik, & Esko, 2017), conduct disorders, inattention/hyperactivity, and emotional problems in childhood (Hannigan et al., 2018; Krapohl et al., 2017). Similarly, they predict supposedly “environmental” factors in childhood that may influence educational outcomes (and hence exposure to objective discrimination)—including parental smacking, childhood household income, and maternal education (Krapohl et al., 2017). Scholars have termed this last pattern, wherein nurture itself has a nature component, “gene-environment correlation” (Butcher & Plomin, 2008; Kong et al., 2018). Yet, their linkages with discrimination itself remain unexplored.
Genes underlying educational attainment could positively influence discrimination reports in three ways. First, the literature has long indicated that those with more education may become socialized into “liberal” cultural scripts—which in turn could entail greater sensitization to discrimination issues (Hello et al., 2004; Kukathas, 2001; Paterson, 2009). By driving a person into such trajectories, then, genes might also enhance perceptions of discrimination. In other words, education could be a (proxy for a) mediator of indirect genetic effects on discrimination.
Second, genetic influence could be direct, bypassing education. Specifically, it could induce inconsistencies between one’s innate sense of self-worth and treatment by society. The “threatened egotism” model in social psychology, for instance, proposes that the motivation to maintain and enhance favorable views of self—with regard to one’s competencies and social status or acceptance—may trigger aggression when contradicted by social treatment (Baumeister, Smart, & Boden, 1996; Zhang & Baumeister, 2006). Similarly, work based on Festinger’s (1957) theory of cognitive dissonance suggests that for those with positive perceptions of self, incongruence arising from negative social treatment or appraisals might become psychologically salient (Douglass, Conlin, Duffy, & Allan, 2017; Goldsmith, Sedo, Darity, & Hamilton, 2004). In turn, such subjective responses may trigger coding of these encounters as discrimination. Educational attainment, moreover, requires and rewards traits such as conscientiousness, agreeableness, and sense of mastery (Herd, 2010; Shiner, Masten, & Roberts, 2003). If these dispositions derive from the genetic factors above, then individuals with such endowments—regardless of their actual educational level or social stratum—may have a high sense of self-worth. Their higher discrimination reports, from this perspective, would not be surprising.
Third, these frameworks also suggest mechanisms beyond socialization for indirect genetic effects through education. Genetically rooted competencies may lead to educational achievements that trigger positive social appraisals and fuller development of innate capabilities. The process may become self-reinforcing and further enhance one’s sense of self-worth. Such individuals may more frequently encounter situations where their favorable self-images are questioned or challenged by others (Neal & Cappella, 2014).
Beyond yielding fundamental insights into life course processes underlying discrimination, parsing these direct and indirect effects is important for analytic reasons. As noted, social science studies of discrimination regularly control basic demographic variables such as education. If genetic effects are only routed through this factor, leaving them out of analyses may not bias findings. However, direct genetic influences may well confound previously established linkages of discrimination with health and life course factors. Conventional approaches to effect decomposition, however, have been heavily critiqued in recent years (VanderWeele, 2015). In particular, mediation estimates based on them may be incorrect when treatment–mediator interaction is present. Genes, it is argued, could have such interactions with educational attainment. Among those with less education and socioeconomic resources, but a high genetically rooted sense of worth, greater exposure to objective discrimination may be co-present with more sensitivity to negative social appraisals. Their discrimination reports, then, may be particularly high. Especially in such situations, methodologists strongly advocate counterfactually based analysis (VanderWeele, 2015). The current study deployed these newer approaches.
The analysis was organized around three study questions: (a) Do established genetic antecedents of educational attainment also predict major discrimination experiences? (b) Does education itself mediate the linkage? and (c) Do genes directly influence discrimination, “bypassing” education? Figure 1 depicts the full posited structure of linkages.
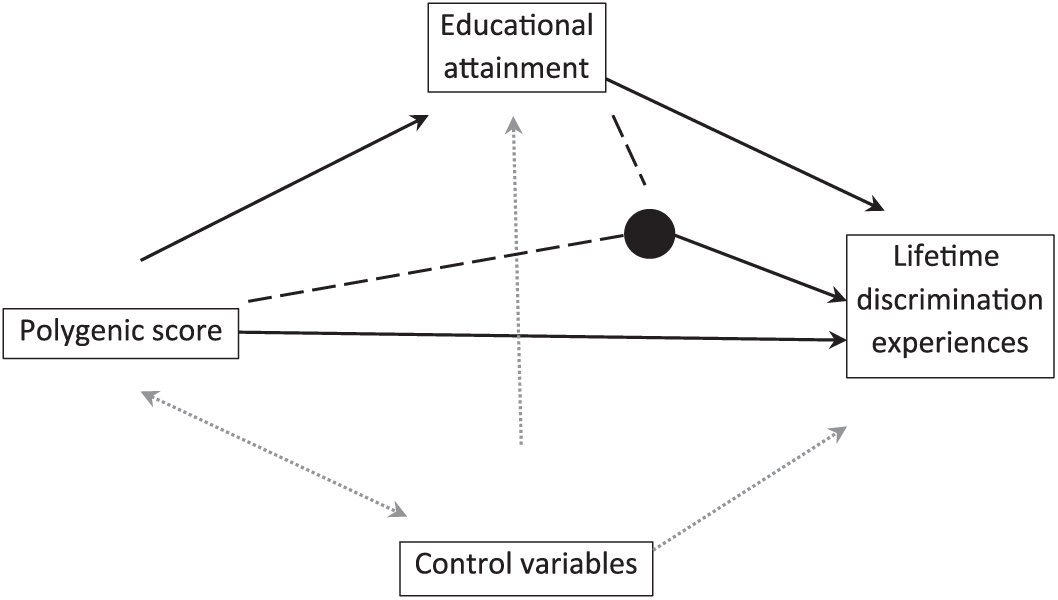
Posited structure of linkages.
Data
HRS is an ongoing longitudinal survey representative of the U.S. population aged over 50 years, conducted every 2 years since 1992. Overall response rate is about 87%. HRS uses multistage sampling of households with an oversample of Blacks and Hispanics (Sonnega et al., 2014). Genetic data collection began in 2006. Due to the addition of a large “refreshment sample,” the 2010 wave had the largest sample size for these data and the greatest overlap with discrimination measures. To further optimize statistical power, participants aged 50 years and younger were retained in the analysis below. HRS genetic data were available for African and (separately) European ancestry groups (see below). Models were therefore run separately for Blacks and Whites—feasible due to the large sample size. In the analytic data for this study, these ethnicities fully matched the corresponding ancestry groups. Subsample missingness and consequent selection problems were handled through inverse probability weights (IPWs; see section “Analytic Approach”).
Measures
Major Discrimination
A random half sample was assigned to as an Enhanced Face-to-Face Interview (EFTF) in 2010. The module included a leave-behind questionnaire on psychosocial topics. Seven dichotomous yes/no items in this instrument queried major discrimination experiences. The questions originated in the MIDUS survey (Kessler et al., 1999) and were based largely on the results of previous qualitative studies of discrimination (Essed, 1991; Feagin, 1991). As Kessler et al. (1999) report, and these items “were designed to assess perceived discrimination of any type rather than only on the basis of gender, race-ethnicity, or social class.” To be specific, participants were asked whether they had ever unfairly been: (a) dismissed from a job; (b) not hired for a job; (c) denied a promotion; (d) prevented from moving into a neighborhood because the landlord or a realtor refused to sell or rent them a house or apartment; (e) denied a bank loan; (f) stopped, searched, questioned, physically threatened, or abused by the police; and (g) denied health care or treatment. In addition, a simple count of all seven items was created to tap one’s cumulative discrimination burden.
Genetic Measures
For each phenotype, the PGS made available by HRS was based on a replicated and externally validated GWAS. DNA data collection was through the Oragene DNA Collection Kit. Genotyping was conducted by the Center for Inherited Disease Research in 2011, 2012, and 2015. Scores were calculated using the PGSIce and PLINK software packages. Each such measure was standardized within ancestry group.
As noted, SNP weights for the educational attainment PGS came from a study by the Social Science Genetic Association Consortium (SSGAC) (Okbay et al., 2016; Ware, Schmitz, Gard, & Faul, 2018). The meta-analysis included 293,723 individuals in the discovery sample and 111,349 in replication. The corresponding European ancestry score in this study contained 1,309,267 SNPs that overlapped between the HRS genetic database and the GWAS meta-analysis. For the African ancestry group, the PGS contained 1,304,335 SNPs. Linkages with education were confirmed in the 2010 wave—among Black, standardized ordinary least squares (OLS) coefficient = 0.13, p < .01, R2 = .05, as well as White participants (coefficient = 0.24, p < .001, R2 = .08).
Educational Attainment
A participant’s self-reported years of education were capped at 17.
Control Variables
Controls were limited to factors known not to be “posttreatment” (Pearl, 2009). In other words, adjustments were avoided for factors that could have been influenced by the genetic scores—or on the causal pathway from education to discrimination. Thus, for instance, childhood experiences were not included. As explained above, recent findings suggest that these may, to an extent, be genetically endogenous (Krapohl et al., 2017). Similarly, studies examining genetic causation of transgenerational educational mobility have controlled parental education (Belsky et al., 2018). The fact that strategy was avoided here because the posited mediator was educational attainment—regardless of class background. Moreover, parental education could be vulnerable to gene-environment correlation and hence be posttreatment—in the causal though not temporal sense. In preliminary analysis of the 2010 HRS data, paternal education was associated with the participant’s own education PGS—at least among Whites (standardized coefficient = 0.15, p < .001). The connection with maternal education is already known (Krapohl et al., 2017) and was also confirmed in the HRS White subsample (coefficient = 0.12, p < .001). In other words, these parental attributes seemed to endogenize education-linked genetic propensities common to both generations (Kong et al., 2018; Krapohl et al., 2017). Including them as controls, then, would also have netted out the heritable part of the participant’s total genetic effect.
Among viable controls, a participant’s age (in years) was entered linearly as a continuous variable. Gender was indexed by a dichotomous measure for being a woman. Population-stratification—systematic differentials in allele frequencies across subgroups due to distinct histories—is a known confounder of gene-trait associations (Conley, 2016). To adjust for this factor, models included 10 ancestry-group-specific genetic principal components (PCs) provided by HRS (Ware et al., 2018).
Analytic Approach
All models were race-specific. Gender separate investigation was avoided, because such splitting lowered sample sizes below tractability among Blacks. Analysis was in two stages. First, as the section above indicates, individual discrimination items were in part qualitatively distinct exposures, tapping experiences in specific domains of life (Table 1). Their linkages with education as well as genes may potentially have varied. Accordingly, a first set of logistic regression models separately regressed each dichotomous indicator on the education PGS and controls (Table 2). For these seven outcomes, p-values were adjusted for multiple testing within each ethnic group, through standard Bonferroni corrections. In addition, negative binomial models tested genetic effects on one’s total count of lifetime experiences.
Descriptive Statistics for Variables Used in Analyses.
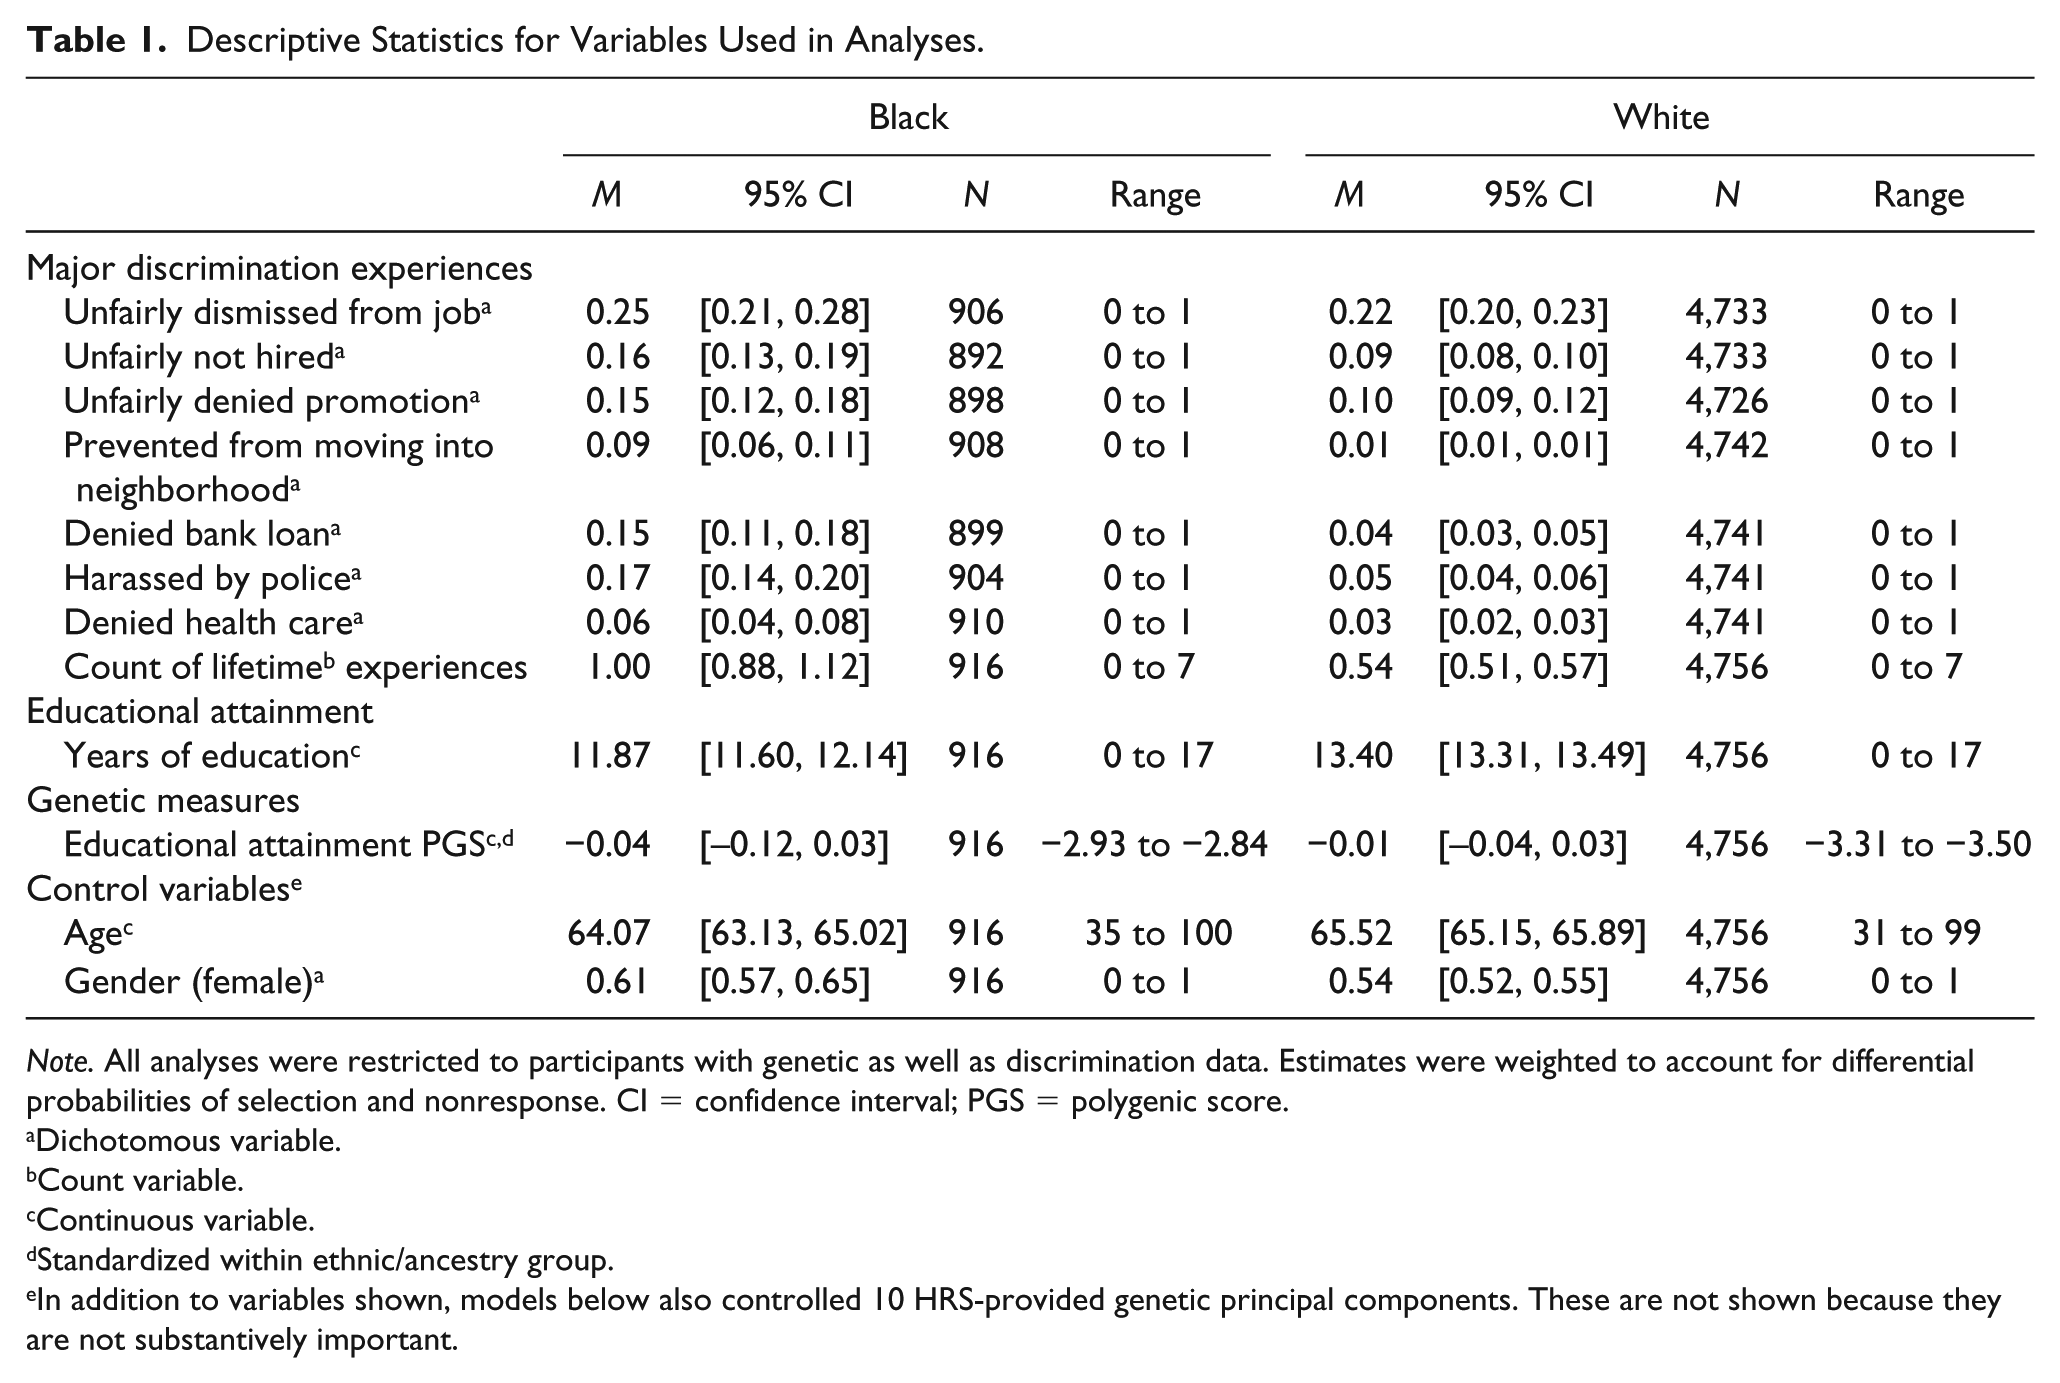
Note. All analyses were restricted to participants with genetic as well as discrimination data. Estimates were weighted to account for differential probabilities of selection and nonresponse. CI = confidence interval; PGS = polygenic score.
Dichotomous variable.
Count variable.
Continuous variable.
Standardized within ethnic/ancestry group.
In addition to variables shown, models below also controlled 10 HRS-provided genetic principal components. These are not shown because they are not substantively important.
Associations of Polygenic Scores With Self-Reports of Lifetime Discrimination: Coefficients (95% Confidence Intervals).
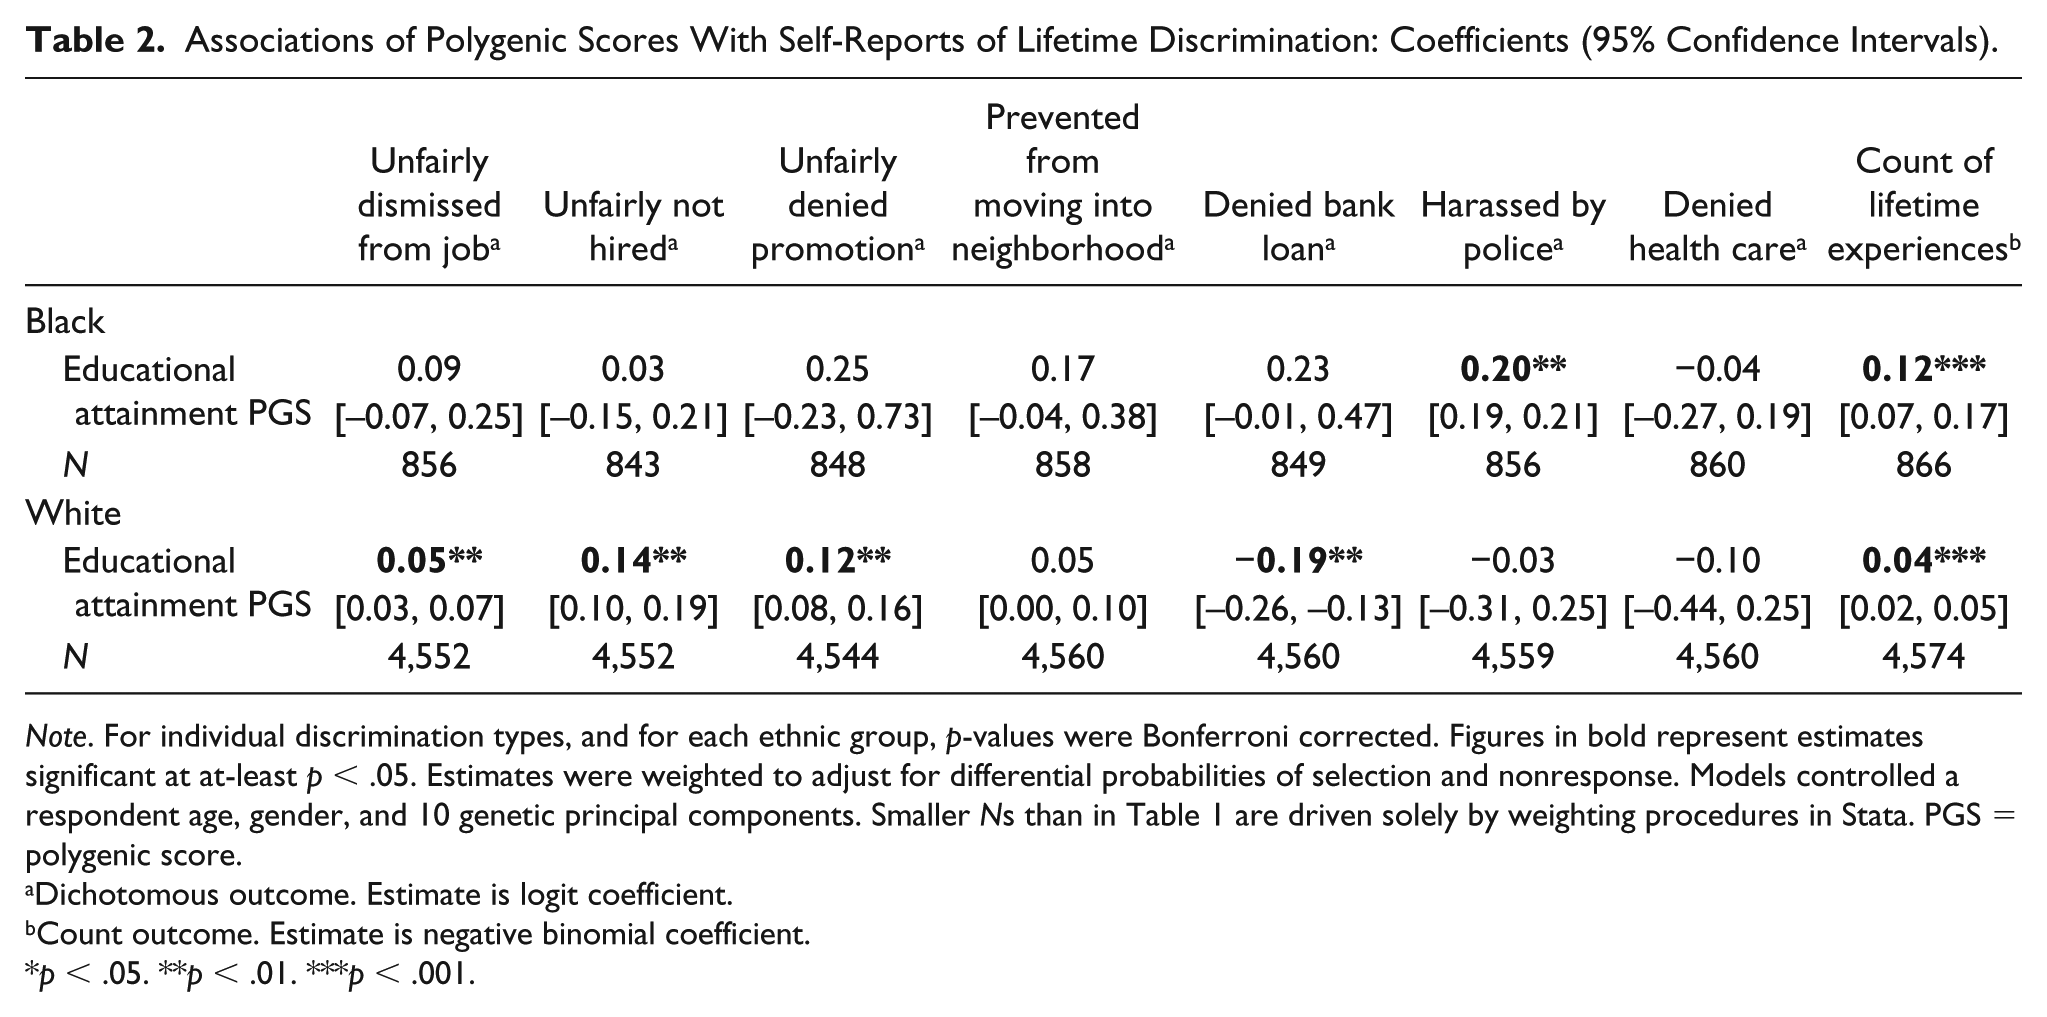
Note. For individual discrimination types, and for each ethnic group, p-values were Bonferroni corrected. Figures in bold represent estimates significant at at-least p < .05. Estimates were weighted to adjust for differential probabilities of selection and nonresponse. Models controlled a respondent age, gender, and 10 genetic principal components. Smaller Ns than in Table 1 are driven solely by weighting procedures in Stata. PGS = polygenic score.
Dichotomous outcome. Estimate is logit coefficient.
Count outcome. Estimate is negative binomial coefficient.
p < .05. **p < .01. ***p < .001.
The second stage examined indirect and direct genetic effects on this overall count (Figure 1). As in Table 2, a negative binomial distribution was specified for the outcome. Mediation analysis of cross-sectional data is often dubious, given uncertain ordering of variables. Such a sequencing, however, seemed plausible in this case. The genetic score was necessarily antecedent to both education and experienced discrimination. In addition, given the random assignment of genes from parental genotypes at conception, its effects on these two factors were not vulnerable to confounding by a participant’s other attributes or experiences (Lawlor et al., 2008). Moreover, the discrimination items tapped situations typically encountered in adulthood. Educational attainment, which is generally completed earlier in the life course, arguably predated such events.
As noted, mediation analysis was through counterfactually based methods. The rationale behind these approaches is extensively discussed elsewhere (Valeri & VanderWeele, 2013; VanderWeele, 2015, 2016). The following argument, which draws upon Muthén and Asparouhov (2015), is therefore kept brief. Conventional approaches to calculating direct and indirect effects—whether the “difference method” involving nested regression models, or the product-of-coefficients procedure in structural equation modeling—may provide valid estimates when (a) the outcome is continuous and (b) there is no interaction between the “treatment” (in this case, genetic) and the mediator (education). For binary but rare outcomes (and in the absence of such interaction), these estimates still approximately coincide. For binary outcomes that are not rare, as well as count dependent variables, they can easily diverge (VanderWeele, 2015). For the models shown in Tables 3 and 4, to recall, the outcome was one’s total count of major discrimination experiences. Moreover, an interaction was posited above between the genetic “treatment” and the mediator (education). Counterfactually based analysis—which does provide valid estimates under such conditions—was therefore the only viable approach. (It is noted that interpreting these effects as causal requires more stringent “sequential ignorability” assumptions that are unlikely to be met in most observational studies. For an overview, see VanderWeele, 2016.)
Mediation of Genetic Effects by Education: Coefficients (95% Confidence Intervals).

Note. Figures in bold represent estimates significant at at-least p < .05. All models adjusted for a participant’s age, gender, and 10 genetic principal components. Estimates were weighted to adjust for differential probabilities of selection and nonresponse. PGS = polygenic score; OLS = ordinary least squares.
Count variable. Estimates are negative binomial coefficients.
Continuous variable. Estimates are OLS coefficients.
p < .05. **p < .01. ***p < .001.
Mediation Models With Treatment–Mediator Interactions: Coefficients (95% Confidence Intervals).
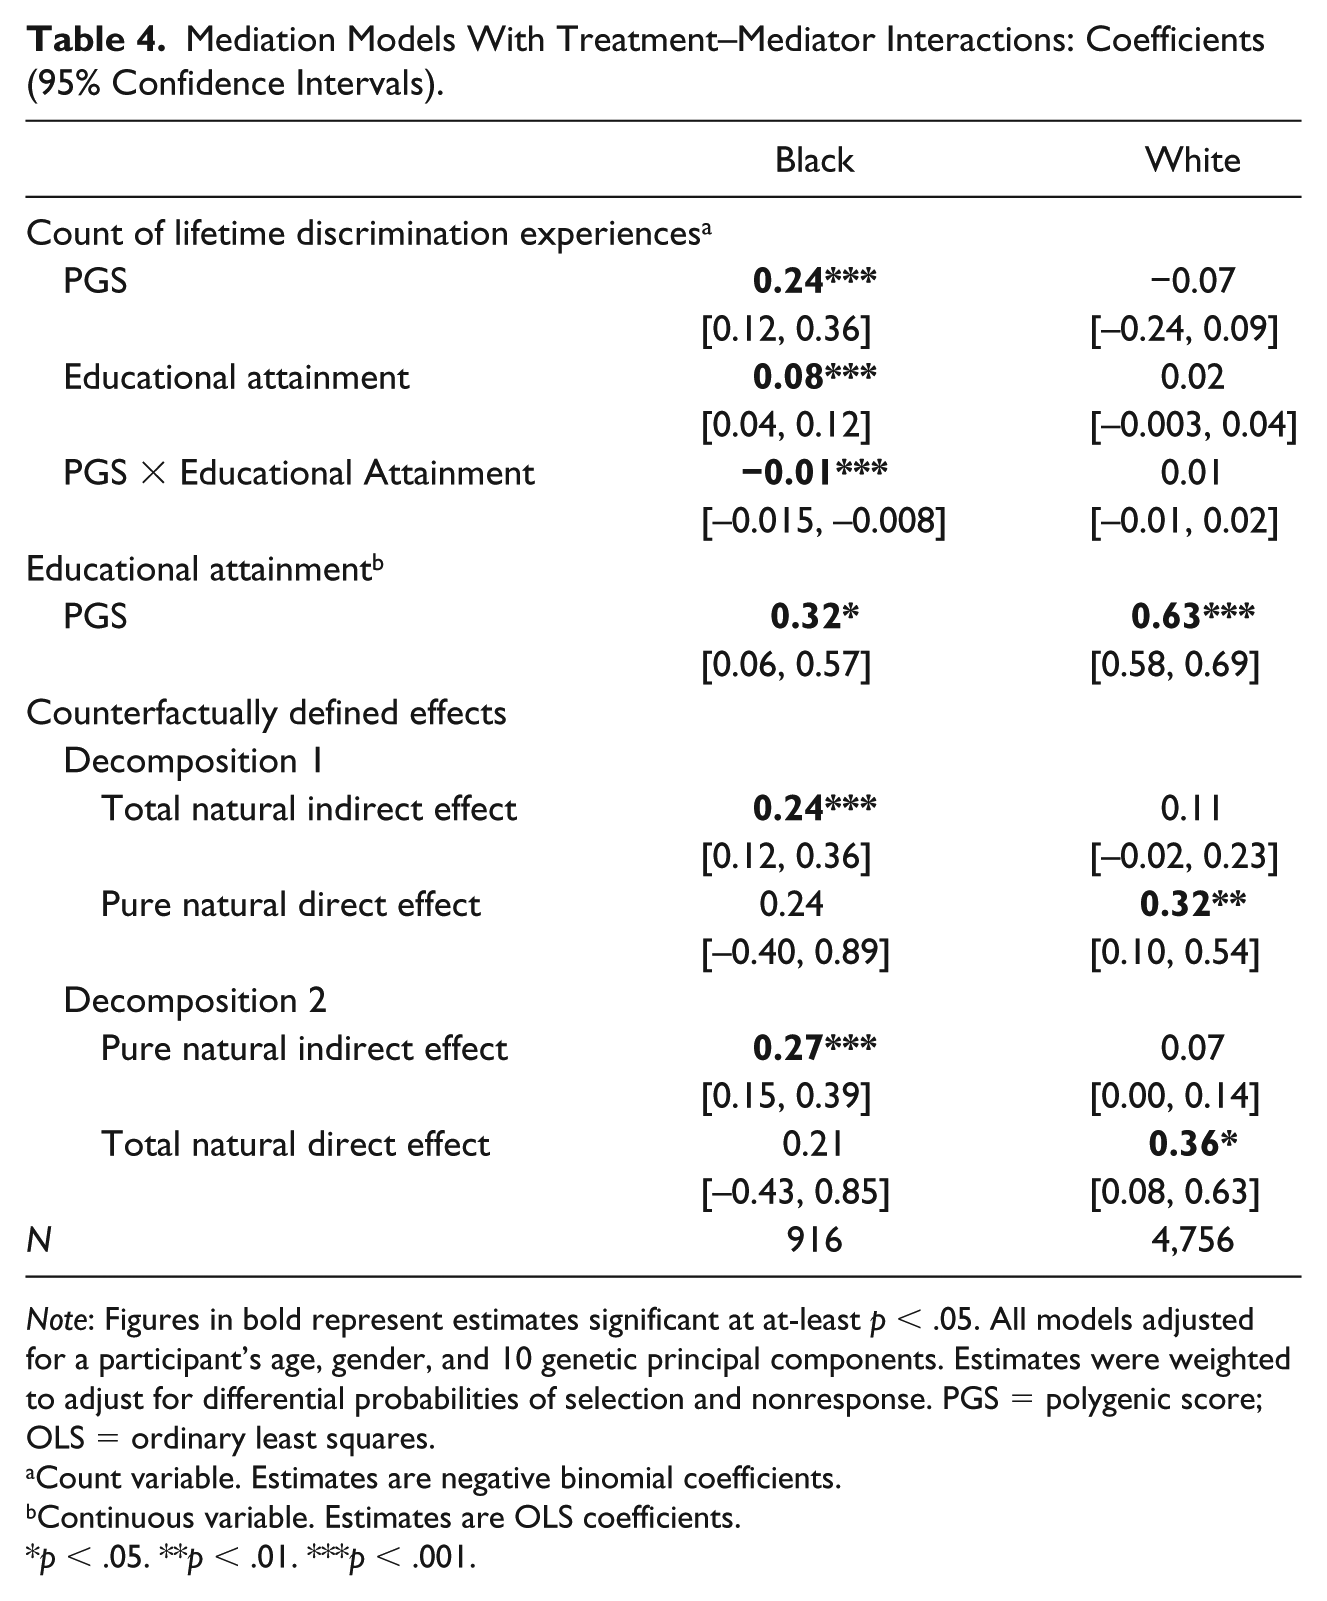
Note: Figures in bold represent estimates significant at at-least p < .05. All models adjusted for a participant’s age, gender, and 10 genetic principal components. Estimates were weighted to adjust for differential probabilities of selection and nonresponse. PGS = polygenic score; OLS = ordinary least squares.
Count variable. Estimates are negative binomial coefficients.
Continuous variable. Estimates are OLS coefficients.
p < .05. **p < .01. ***p < .001.
For a subject i, let the genetic variable G take the values g at the treatment condition and g* at the control condition. The effect of the treatment is then Yi(g) – Yi(g*). It is, of course, not identified given that a subject only experiences one of the two states (i.e., has a fixed value of the PGS). The average or expected effect E(Y(g) – Y(g*)), however, is identifiable. Furthermore, let M denote the educational mediator and C the covariates additively included in the model. The counterfactual approach then allows two possible decompositions of the average genetic effect—either into (a) the pure natural direct effect (PNDE) and the total natural indirect effect (TNIE); or (b) the total natural direct effect (TNDE) and the pure natural indirect effect (PNIE) (Muthén & Asparouhov, 2015; Valeri, 2012).
In the first decomposition, the direct effect or PNDE expresses the effect that would be realized if the genetic “treatment” were given (G changed from g* to g), but the mediator kept at the level it would have taken in the absence of such treatment (M(g*))

Thus, the difference in E(Y)—the expected change in discrimination experiences—is due only to the variation in G. The indirect effect (or the mediation estimate) in this decomposition is given by

That is, G is kept at the treatment condition, and the variation in the outcome is solely due to the change in the educational mediator M from what it “would have been” in the control condition to its hypothetical state in the treatment condition.
In the second decomposition, the direct effect TNDE “holds” M to what it would have been at the treatment condition g instead of—as it was for the PNDE—at the control condition g*. Again, only G changes from g* to g

The corresponding indirect effect (or the mediation estimate), the PNIE, is the change in E(Y) when only M changes from one state to another, with genetic treatment “blocked”

Both sets of estimates are provided in the results (Tables 3 and 4).
One problem remained. Nonprobability data can induce severe bias in estimates—not just of prevalence but also, through “collider bias,” of associations (Munafò, Tilling, Taylor, Evans, & Smith, 2018). Briefly, a collider is a variable that is itself caused by two other variables, one that is (or is associated with) the treatment and another that is (or is associated with) the outcome (Elwert & Winship, 2014). If study participation can be represented by such a measure, investigating linkages within the corresponding sample is equivalent to conditioning on the collider (Pearl, 2009). Although the 2010 HRS wave yielded the largest N, it also had high genetic missingness: 28.33% among Whites and 33.64% among Blacks. IPW has been suggested as one solution to potential collider bias due to such missingness (Munafò et al., 2018). Accordingly, logistic regression models were first run, with genetic missingness as the dependent variable. Covariates included participants’ demographic and health attributes—age, ethnicity, gender, years of education, self-rated health, and number of health conditions diagnosed over the lifetime. Based on predicted probabilities from these models, stabilized IPWs were created (Weuve et al., 2012). Substantive analysis was then weighted by the cumulative product of these IPWs and HRS-provided cross-sectional weights. The latter were designed specifically for the 2010 EFTF subsample to whom the discrimination items were administered (Smith et al., 2017). They incorporated a nonresponse adjustment based on age, sex, race/ethnicity, and geography. The American Community Survey and the Current Population Survey were used for poststratification correction (Ofstedal, Weir, Chen, & Wagner, 2011).
First stage analysis was with the Stata 15 statistical package (Stata Corp, 2017). Testing of direct and indirect effects was done in Mplus Version 8 (Muthén & Muthén, 1998-2017). Standard errors were adjusted for clustering (sampling individuals within primary sampling units).
Results
Genes and Major Discrimination Experiences
From Table 2, for most discrimination types, genetic associations among Black participants failed to reach significance—arguably due to smaller sample sizes. Two positive genetic effects did appear, however, on being harassed by the police (logit coefficient = 0.20, p < .01) and the overall count (negative binomial coefficient = 0.12, p < .001).
Among Whites, three of the seven experiences were positively associated with the education PGS. These included having been unfairly: dismissed from a job (coefficient = 0.05, p < .01), not hired for one (coefficient = 0.14, p < .01), and denied promotion (coefficient = 0.12, p < .01). The same was true of the total count of experiences (0.04, p < .001). Only one outcome—unfair denial of a bank loan—was negatively linked to the genetic score (coefficient = −0.19, p < .01), consistent with class-based lowering of exposure.
Mediation of Genetic Effects by Education
From Table 3, a first set of mediation models ignored possible treatment–mediator interaction. Among Black participants, both the PGS (negative binomial coefficient = 0.10, p < .01) and years of education (coefficient = 0.08, p < .001) were associated with one’s lifetime discrimination count. Per design, the genetic score also influenced education (OLS coefficient = 0.32, p < .05). Similar among White participants, educational attainment had a positive association with the discrimination score (coefficient = 0.02, p < .001), and was influenced by one’s genes (coefficient = 0.63, p < .001).
As the outcome was a count variable, these standard estimates were for the log rate (where the rate was the mean of the discrimination score). In contrast, the counterfactually based estimates below were for the rate itself. Moreover, all the parameters of the model were involved in the latter estimation, such that indirect effects were not simply products of paths (Muthén & Asparouhov, 2015; VanderWeele, 2016).
Among Blacks, only indirect effects reached significance. This was true of the TNIE (coefficient = 0.31) and the PNIE (coefficient = 0.28) (p < .001 for both). As above, nonsignificance of the direct effects may well have been due to a small sample size rather than absent genetic influence. Among Whites, for whom sample size was not an issue, both direct and indirect effects were significant. The former, however, was higher in magnitude. In the first decomposition, the TNIE (coefficient = 0.07, p < .05) was less than half the PNDE (coefficient = 0.17, p < .001). Similarly, in the alternate decomposition, the PNIE (coefficient = 0.07, p < .05) was lower than the TNDE (coefficient = 0.17, p < .001).
Moderated Mediation
From Table 4, next, analysis tested whether estimates changed when treatment–mediator interaction was specified. An interaction was found only among Blacks. The genetic “main effects” of both discrimination (coefficient = 0.24, p < .001) and education (coefficient = 0.08, p < .001) were robust. The interaction term itself was negative, but small in magnitude (coefficient = −0.01, p < .001)—consistent with a slight buffering of the genetic effect among Black participants with more education. Finally, the gene-education association itself remained unchanged from Table 3 (coefficient = 0.32, p < .05). Among Whites, neither the main effects nor the interaction term was significant, and the gene-education linkage was the same as in Table 3 (coefficient = 0.63, p < .001).
The presence of an interaction only changed counterfactually defined effects mildly among Blacks. As in Table 3, only indirect effects reached significance—with the TNIE now slightly lower (0.24, p < .001) than the PNIE (0.27, p < .001). Among Whites, in contrast, only direct effects were found, and the PNDE (0.32, p < .01) was almost the same as the TNDE (0.36, p < .05).
Discussion
This study began by noting that recently established genetic antecedents of education may also influence major experiences of lifetime discrimination. Moreover, such impact could be indirect—that is, routed through education—and/or direct. Parsing these effects, it was argued, is important for both theoretical and analytic reasons. Accordingly, three questions were explored: (a) Do established genetic antecedents of educational attainment also predict major discrimination experiences? (b) Does education itself mediate the linkage? and (3) Do genes directly influence discrimination, “bypassing” education?
The answer to the first question was “yes.” Among Black as well as White participants, the education PGS was associated with one’s cumulative discrimination burden, as indexed by the total count of lifetime experiences (Table 2). In separate analysis, this genetic score also positively influenced socioeconomic status, as indicated by current household assets. Net of age, gender, and genetic PCs, and each standard deviation increase in the PGS was associated with an extra US$116,740 among Whites and US$27,940 among Blacks. (Although it is tempting to infer weaker “returns to genetic potential” among Blacks, this would be premature, given that the PGSs themselves were race-specific.) Moreover, household assets themselves were negatively linked to one’s lifetime discrimination count, at least among Whites (negative binomial coefficient = −10.23, p < .001). It seems, then, that the positive genetic effect on their discrimination reports was in spite of the fact that greater financial success—due partly to the same genes—was also associated with lower exposure to objective events. Influences on perceptions seemed the only explanation. Only with one discrimination type—being denied a bank loan—did class-based exposures seem to dominate among Whites. Those with “better” genetic endowments were also less likely to report this experience.
Counterfactual analysis also indicated for both ethnicities, and the answer to the second study question was “yes” (Table 3). Indeed, among Black participants, only indirect genetic effects reached significance. To recall, two mechanisms were proposed for such indirect influences. First, genetically driven educational trajectories may socialize a person into more “liberal” cultural scripts—and hence induce greater sensitization to discrimination issues. Second, cognitive or other competencies rooted in genes may lead to educational achievements that trigger positive social appraisals, and enhance one’s sense of self-worth. Social challenges to such self-images may be coded as discrimination. Data were insufficient for adjudication between these mechanisms. The multiplicative analysis in Table 4 also indicated that among Black participants, genetic effects were slightly stronger for those with less education. The pattern was arguably consistent with speculations above that for those with such education levels but a high genetically rooted sense of worth, greater sensitivity to negative social appraisals may be co-present with more exposure to objective events. As direct self-esteem measures were lacking in HRS, however, these arguments remained tentative.
Finally, the direct genetic effects among Whites also had analytic implications (Table 3). In the absence of a significant interaction for these participants in Table 4, and given their greater statistical precision, inference was based on the former results. As argued, social science studies of discrimination regularly control basic demographic variables such as education. Indirect genetic influence channeled only through this factor may therefore not confound previous estimates of discrimination’s links with other factors. The same is not true, however, of direct effects. It was also noted that the education PGS is already known to be strongly pleiotropic—influencing multiple health dimensions as well as early life experiences that could potentially channel a person into exposure trajectories. Whether such multifinality also induces bias in the latter’s linkages with discrimination remains unexplored.
Limitations
This study had several limitations. First, it only explored pathways beginning with genes. The greater part of education attainment, however, seems to be environmentally rather than genetically rooted. In the mediation results, moreover, education itself remained positively and significantly associated with one’s lifetime discrimination count even with genes controlled (Table 3). The analysis above, then, only provided insights into part of this counterintuitive linkage. Moreover, the PGS itself only indexed additive effects of common genetic variants, weighted with SNP weights from external consortia-based GWAS (Ware et al., 2018). Empirical influences, however, may also involve interactions between SNPs—both within (dominance) and/or across loci (epistasis) (van den Berg et al., 2016). These interactions may be a major reason “SNP heritability” is uniformly and substantially lower than “twin heritability” (Cheesman et al., 2017). Next, the sample size among Blacks was small for the EFTF half sample administered the discrimination measures. Null results may well reflect low statistical power rather than absent empirical linkages. Nor were genetic data available for Hispanic or other ethnicities. Inferences, therefore, may not generalize to all older U.S. adults. Among the two included groups, to recall, inverse probability weights were used to address any collider bias due to genetic missingness. However, models for these weights may well have excluded factors crucial to such selection. In addition, IPWs do not adjust for data “missing not at random” (MNAR)—a possibility that cannot empirically be ruled out (Perkins et al., 2018). Next, controls were limited to factors known not to be “posttreatment.” Those that could have been influenced by the genetic scores—or potentially on the causal pathway from education to discrimination—were not included. The genetic effects were not susceptible to consequent omitted variable bias, given random assignment of genes from parental genotypes at conception (Lawlor et al., 2008). However, such bias could have affected education-discrimination associations. Estimates involving these linkages—including the indirect effects—in Tables 3 and 4 should therefore not be interpreted as causal. Discrimination items were also retrospective and possibly tapped events long past. The types of experiences they queried were arguably sharp “shocks” in the life trajectory and less susceptible to biased recall. Current affect or life situations, however, may have influenced responses. Race-variations in responses may also have been due to corresponding differences in sociocultural factors. Moreover, the HRS measures may have missed major race-specific forms of discrimination. Results should therefore be interpreted with caution.
Conclusion
Data from a nationally representative study of older U.S. adults suggested that major discrimination experiences over the life course are partly rooted in one’s own genes. Findings generally supported effects on perceptions, rather than on exposure to objective discrimination events. Counterfactual analysis indicated both indirect genetic influences routed through education, and direct ones possibly indicating conflict between one’s innate sense of self-worth and treatment by society. The latter also suggested potential genetic confounding of previously estimated linkages between discrimination and health or life course factors. Such patterns await exploration.
Footnotes
Acknowledgements
The HRS (Health and Retirement Study) was sponsored by the National Institute on Aging (grant number NIA U01AG009740) and was conducted by the University of Michigan. The author thanks the editor and two anonymous reviewers for their thorough and insightful comments.
Declaration of Conflicting Interests
The author declared no potential conflicts of interest with respect to the research, authorship, and/or publication of this article.
Funding
The author received no financial support for the research, authorship, and/or publication of this article.