
Abstract
Introduction
Social isolation, defined as “an objective and quantifiable reflection of reduced social network size and paucity of social contact” (Steptoe, Shankar, Demakakos, & Wardle, 2013, pp. 5797), is a significant threat to the quality of life and health of older adults (Cornwell & Waite, 2009; Klinenberg, 2016). Social isolation has been associated with an array of negative consequences, including premature mortality (Holt-Lunstad, Smith, Baker, Harris, & Stephenson, 2015; Steptoe et al., 2013), poor physical health (Cornwell & Waite, 2009), poor self-rated mental health, depressive symptoms, psychological distress (Cornwell & Waite, 2009; Klinenberg, 2016; Taylor, Taylor, Nguyen, & Chatters, 2016), cognitive decline (Shankar, Hamer, McMunn, & Steptoe, 2013), and Medicare spending (Shaw et al., 2017). Social isolation is common in later life due to declines in physical health and functioning and to shrinking networks (Klinenberg, 2016). Between 10% and 20% of older adults experience social isolation (Chatters, Taylor, Nicklett, & Taylor, 2018; Cudjoe et al., 2018; Elder & Retrum, 2012; Ortiz, 2011). A recent nationally representative study reported that 24% of older adults, approximately 7.7 million people, were socially isolated, including 1.3 million (4%) who were severely isolated (Cudjoe et al., 2018). In addition, studies found that older adults experiencing isolation are more likely to be men and non-Hispanic White (Cudjoe et al., 2018; Taylor, Chatters, & Taylor, 2018) and have lower education and income (Cudjoe et al., 2018). Given the rapidly growing older population, social isolation has emerged as a growing public health epidemic (Klinenberg, 2016). Therefore, identifying risk factors that may expose older adults to social isolation is an important first step in mitigating this significant public health problem.
One potential risk factor that could increase social isolation in older age is driving cessation. Driving plays a vital role in older adults to maintain their preferred ways of life and is an important component of self-autonomy and independence (Curl, Stowe, Cooney & Proulx, 2014). Driving is also the primary mode of transportation used by older adults to meet friends and family, attend formal events, and travel to doctor/medical appointments, entertainment, and shopping (Curl et al., 2014; Davey, 2006; Pristavec, 2018). Driving is particularly important to older Americans, as the United States is known for being more car-dependent than most developed countries. Fully 85% of adults above the age of 60 years are current drivers and the majority of older adults’ travel is non–work related (Pristavec, 2018). However, many older adults eventually cease driving due to medical conditions (Dellinger, Sehgal, Sleet, & Barrett-Connor, 2001), functional impairments (Johnson, 2003), and decreased confidence in driving (Johnson, 1995). Driving cessation has also been linked to poor physical performance and functioning (Edwards, Lunsman, Perkins, Rebok, & Roth, 2009), elevated depressive symptoms (Ragland, Satariano, & MacLeod, 2005; Windsor, Anstey, Butterworth, Luszcz, & Andrews, 2007), and reduced engagement in social activities. Specifically, driving cessation has been associated with a lower frequency of going out for enjoyment (Lehning, Kim, Smith, & Choi, 2018; Marottoli et al., 2000), reduced engagement in paid work and volunteering (Curl et al., 2014; Marottoli et al., 2000), and a smaller network of friends (Mezuk & Rebok, 2008). Driving cessation may make it harder for older adults to maintain their current levels of social participation (Mezuk & Rebok, 2008). In addition, studies comparing social participation by driving status have reported that older adults with car access are more socially involved than nondrivers (Pristavec, 2018). It has been estimated that life expectancy beyond driving cessation was 7 years for men and 10 years for women, leaving a long period during which individuals are potentially at risk of increased social isolation and other adverse consequences that result from driving cessation (Foley, Heimovitz, Guralnik, & Brock, 2002).
However, previous studies on the relationship between driving cessation and social isolation have several limitations. First, with a few exceptions (Johnson, 1995), very few empirical studies have explicitly examined the relationship between driving cessation and social isolation, as many studies have focused the effect of driving cessation on social engagement and participation. Social isolation is conceptually different from social participation, in that whereas participation focuses on connections with network members and involvement in work and social activities (Curl et al., 2014; Marottoli et al., 2000), social isolation can be considered as the lack or absence of social engagement, in which socially isolated individuals have limited contact with their friends and family members (Chatters et al., 2018) and also infrequently participate in groups, clubs, or other social activities (Morrow-Howell & Gehlert, 2012; Taylor et al., 2018). In addition, social isolation frequently encompasses constructs not typically measured in social engagement, such as integration of relationships with network members, companionship, and presence of a confidant (Cornwell & Waite, 2009; Pohl, Cochrane, Schepp, & Woods, 2017; Taylor, Taylor, Nguyen, & Chatters, 2016). For example, older adults who regularly participate in organized activities may not have network members with whom they can talk about important things. Driving cessation could possibly affect older adults’ integrating relationships with family and friends, who may also need to adjust to older individuals’ changes in driving status. For example, a study on older couples found that spousal driving cessation reduces husbands’ or wives’ paid employment (Curl, Proulx, Stowe, & Cooney, 2015), which could potentially limit the economic resources and affect the spousal relationships. Therefore, previous study findings regarding social participation may not fully capture the effects that driving cessation may have on social isolation. Estimating the direct impact of driving cessation on social isolation can help pinpoint the magnitude of this impact and facilitate the development of risk stratification and prediction tools to identify older adults at the most risk of social isolation. In addition, many studies dichotomized social isolation into isolated versus not isolated, and less is known about older adults who are somewhat isolated. Some older adults may experience some level of reduction in social contacts and social activities as they grow older, yet others may experience more extreme isolation characterized with little or no social contacts and activities. Including the “somewhat isolated” category better captures the extent of social isolation and distinguishes subgroups of older adults with different social experiences.
The purpose of the current study is to examine the impact of driving cessation on social isolation among community-dwelling older adults. We hypothesized that nondrivers would be more likely to experience social isolation than active drivers and that incident reports of driving cessation would increase social isolation among previously active drivers. We analyzed 6 years of data from a longitudinal panel study and used a validated measure of social isolation.
Method
Study Sample
Data were obtained from Round 1 (2011) through Round 6 (2016) of the National Health and Aging Trends Study (NHATS), a nationally representative study of Medicare beneficiaries aged 65 and older. Baseline sample person interviews were conducted with 7,609 community-dwelling older adults, excluding nursing home residents. Annual follow-up interviews were conducted regardless of residential status. Among the 7,609 participants, 517 had never driven a car, 174 were not eligible to drive due to blindness or ambulation problems, and two had missing data on past-year driving status at baseline. Excluding these participants, our study sample included 6,916 eligible drivers at the Round 1 interview. In our study sample, 1,381 (20.0%) died and 2,503 (36.2%) dropped out due to other reasons during the 5 years of annual follow-up.
Measures
Driving status
NHATS participants responded whether they had driven during the past 12 months. Persons who drove in the past year were classified as drivers, whereas persons who did not drive in the past year were classified as nondrivers. Driving status was repeatedly assessed during each survey round. In most cases, once participants became nondrivers, they remained nondrivers during all subsequent survey rounds. There were 20 to 40 cases where previously reported nondrivers became drivers in a subsequent survey round. Due to the very low occurrences of transition from nondriver to driver, we assessed incidents of driving cessation based on the first time a person was classified as a nondriver.
Social isolation
Pohl et al. (2017) developed a social isolation measure based on the four social domains of network and integration in the general adult population: (a) marriage or partnership, (b) family and friends, (c) church participation, and (d) club participation (Berkman & Syme, 1979). One point was assigned for each of the following conditions (a) not married or living with a partner, (b) unable to name any family with whom participants talked most often about important things over the past year, (c) unable to name any friend with whom participants talked most often about important things over the past year, (d) no in-person visit with friends or family not living with them during the past month, (e) no attendance at religious services in the past month, and (f) no participation in clubs, classes, or other organized activities during the past month. These points were summed to create a composite social isolation score, ranging from 0 to 6. Given how the individual item was scored, the summary score measured the deficiency of network contacts and integrating relationships. Pohl et al. (2017) suggested cutoff points: scores of 0 or 1 represented “not isolated,” scores of 2 or 3 indicated “somewhat isolated,” and scores of 4 and above suggested “socially isolated.” We applied these cutoff points and created an ordinal variable of social isolation status.
Covariates
We included a number of potential confounders in the domains of sociodemographics, mental health, physical health, and physical functioning. Time-invariant sociodemographic covariates included gender (female or male), race/ethnicity (non-Hispanic White, non-Hispanic Black, Hispanic, or Other race), highest educational achievement (less than high school, high school or general educational development [GED], some college but no degree, or college graduate), and family income in 2011 (coded into quartiles for regression analysis). Time-varying sociodemographic covariates included age in 5-year interval and indicator of living alone. Given the established association of depression and social isolation (Taylor et al., 2018), we included an indicator of elevated depressive symptoms assessed using a score of 3 or higher on the two-item Patient Health Questionnaire (PHQ-2), a validated brief depression screener (Löwe, Kroenke, & Gräfe, 2005). Vision impairment is an important cause of driving cessation in older adults (Lyman, McGwin, & Sims, 2001) and has been linked to depression (Ragland et al., 2005; Windsor et al., 2007). We, therefore, included an indicator of poor vision, defined as blindness or difficulty seeing across the street and/or reading newspaper print, even with glasses. In addition, we included an indicator of dementia (no dementia, possible dementia, or probable dementia). NHATS researchers classified dementia status based on a self-reported diagnosis of dementia or Alzheimer’s disease, an AD8 Dementia Screening Interview, and cognitive tests (Kasper, Freedman, & Spillman, 2013). To further measure physical health, we included a count of self-reported physician diagnoses of chronic conditions (hypertension, heart disease, arthritis, osteoporosis, diabetes, lung disease, stroke, and cancer). Another indicator of physical functioning was a count of limitations in activities of daily living (ADLs, including eating, bathing, toileting, and dressing) and instrumental activities of daily living (IADLs, including laundry, grocery shopping, preparing meals, banking, and taking medication). Activity limitation was defined as needing assistance carrying out the activity (must be for health- or functioning-related reasons for IADLs) or difficulty performing the activity alone.
Data Analysis
Baseline study population characteristics were described for the full sample and compared by social isolation status using chi-square or one-way analysis of variance (ANOVA). Baseline survey design factors of NHATS, including sampling weights, sampling unit, and strata, were used to generate nationally representative estimates applying Taylor linearization for variance estimation.
Our main analysis examining the impact of driving cessation on social isolation involved two statistical approaches: a mixed-effects ordered logistic regression model with the full study sample and a piecewise regression model with persons who reported an incident of driving cessation. Mixed-effects models can estimate both fixed and random effects, explicitly examine the impact of both time-invariant and time-varying covariates, and accommodate dependence of observations, such as in longitudinal panel data. We estimated a mixed-effects ordered logistic regression model to examine the relationship between time-varying driving status and social isolation status, coded as an ordinal variable with three categories. Although the proportional odds assumption was rejected based on a significant chi-square test, this assumption is easily affected by large sample size and inclusion of continuous predictors (Harrell, 2015; O’Connell, 2006). Ordered logistic regression could still be useful despite violation of the proportional odds assumption (Harrell, 2015) and is more straightforward to interpret than multinomial logistic regression. We estimated a piecewise regression to examine the immediate change in the social isolation score after a report of an incident of driving cessation. Whereas a mixed-effects ordered logistic regression model shows the longitudinal association of driving status and social isolation at multiple time points, piecewise regression demonstrates the short-term impact of incidents of driving cessation on social isolation. Piecewise regression partitions the observations into two time periods and fits a separate line segment to each period. In our study, two regression line segments were separated at the time of incident report of driving cessation. By examining the intercept change of the two regression lines, we were able to determine change in social isolation score in the round when driving cessation was first reported relative to the last round when the participant was an active driver. Participants were said to have experienced incidents of driving cessation if they were active drivers at baseline (Round 1) but later became nondrivers during a subsequent survey round. The timing of incidents of driving cessation captured the first time that participants became nondrivers. Among the 6,916 eligible drivers included in our study, 4,080 were always drivers, 1,405 were nondrivers at baseline, and 1,431 experienced incidents of driving cessation during the 5 years of follow-up. Due to the clustering of data within individuals, we estimated the piecewise regression model for the 1,431 persons who experienced driving cessation during the study period in a linear mixed-effects model using all six rounds of data. Piecewise regression estimated in a linear mixed-effects model was previously applied in a study that examined the impact of retirement on health outcomes among older adults (Xue, Head, & McMunn, 2017).
Both models described above were estimated adjusting for all the covariates described previously and weighted for NHATS complex survey design. We computed scaled weights and robust standard errors and accounted for sampling strata using methods detailed by Heeringa, West, and Berglund (2017). All analyses were conducted in Stata 15.1 SE (StataCorp, 2017, College Station, TX).
Results
Table 1 presents weighted sample characteristics stratified by social isolation status at baseline. In our study population, 20.3% were classified as not socially isolated, 58.3% were somewhat socially isolated, and 21.3% were socially isolated. Compared with persons not socially isolated, older adults who were somewhat isolated or isolated tended to be older and male, and they tended to have lower educational levels and income. In addition, the proportion of older adults who lived alone, had elevated depressive symptoms, poor vision, and possible or probable dementia increased monotonically as social isolation classification moved from not isolated to socially isolated. Older adults who were socially isolated had the highest number of ADL and IADL limitations and chronic diseases. The proportion of active drivers decreased monotonically with social isolation classification: 95.7% of not isolated older adults drove in the past year, compared with 87.7% of somewhat isolated older adults and 65.0% of socially isolated older adults.
Sample Characteristics by Social Isolation Status at Baseline.
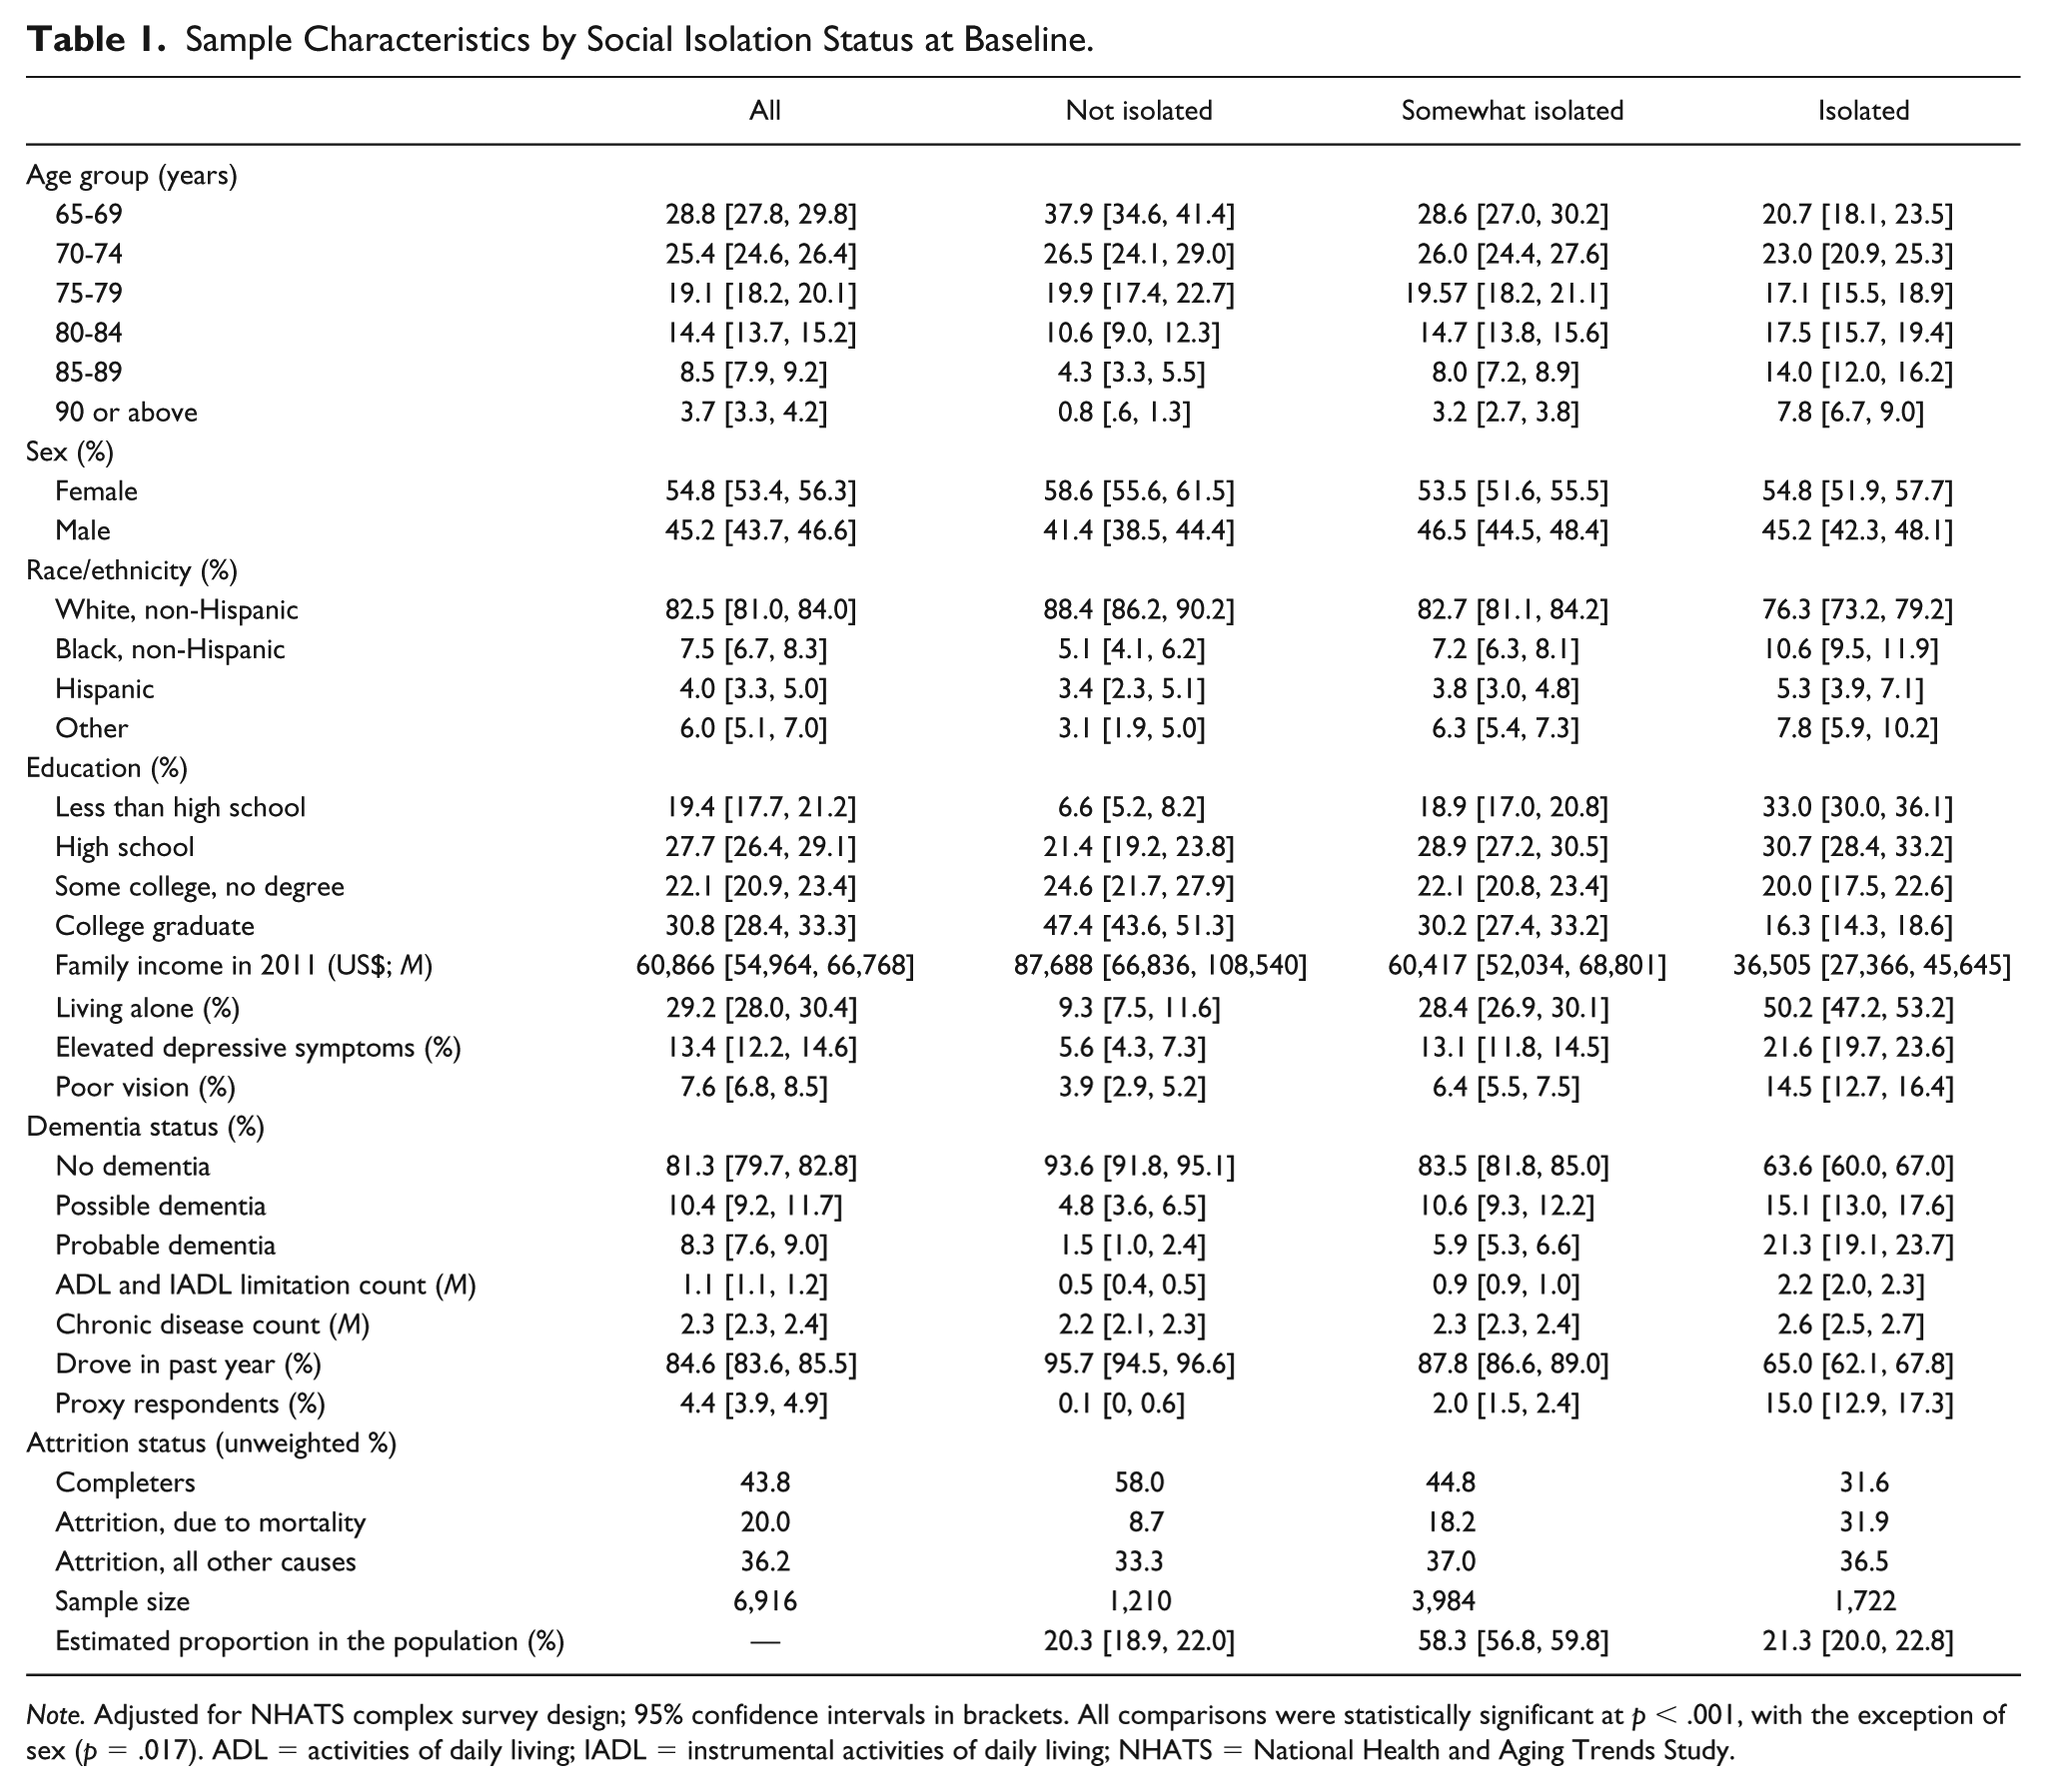
Note. Adjusted for NHATS complex survey design; 95% confidence intervals in brackets. All comparisons were statistically significant at p < .001, with the exception of sex (p = .017). ADL = activities of daily living; IADL = instrumental activities of daily living; NHATS = National Health and Aging Trends Study.
Table 2 presents the results from mixed-effects ordered logistic regression predicting social isolation. Compared with active drivers, nondrivers had twice the odds of being in a higher social isolation category (odds ratio [OR] = 2.1, 95% confidence interval [CI] = [1.7, 2.6], p < .001) after adjusting for covariates. The risks of social isolation differed by sociodemographic characteristics, mental health status, physical health, and functioning. Compared with persons in the 65- to 69-year age group, those in the 85- to 89-year age group (OR = 1.40, 95% CI = [1.36, 2.89], p < .001) and 90+ age group (OR = 1.99, 95% CI = [2.12, 3.04], p < .001) were more likely to be in a higher social isolation category. Men had more than twice the odds of being in a higher social isolation category than women (OR = 2.54, 95% CI = [2.12, 3.04]). The odds of social isolation decreased as education level increased (ORs ranged from 0.51 to 0.20, p < .001 for all, using “less than high school” as the reference group) and as family income levels moved from the first to the fourth quartile (ORs ranged from 0.46 to 0.10, p < .001 for all, using the first quartile as the reference group). In addition, living alone (OR = 3.95, 95% CI = [3.26, 4.80], p < .001), having elevated depressive symptoms (OR = 1.54, 95% CI = [1.36, 1.74], p < .001), and having possible (OR = 1.39, 95% CI = [1.19, 1.62], p <. 001) or probable dementia (OR = 1.51, 95% CI = [1.20, 1.90], p < .001) were associated with greater risk of being in a higher social isolation category. One more ADL/IADL limitation was associated with 0.17 increase in the odds of being in a higher social isolation category (OR = 1.17, 95% CI = [1.12, 1.21], p < .001). Risk of social isolation did not differ significantly by race/ethnicity, vision impairment status, or chronic disease count.
Odds Ratio for Social Isolation Status in Mixed-Effects Ordered Logistic Regression.
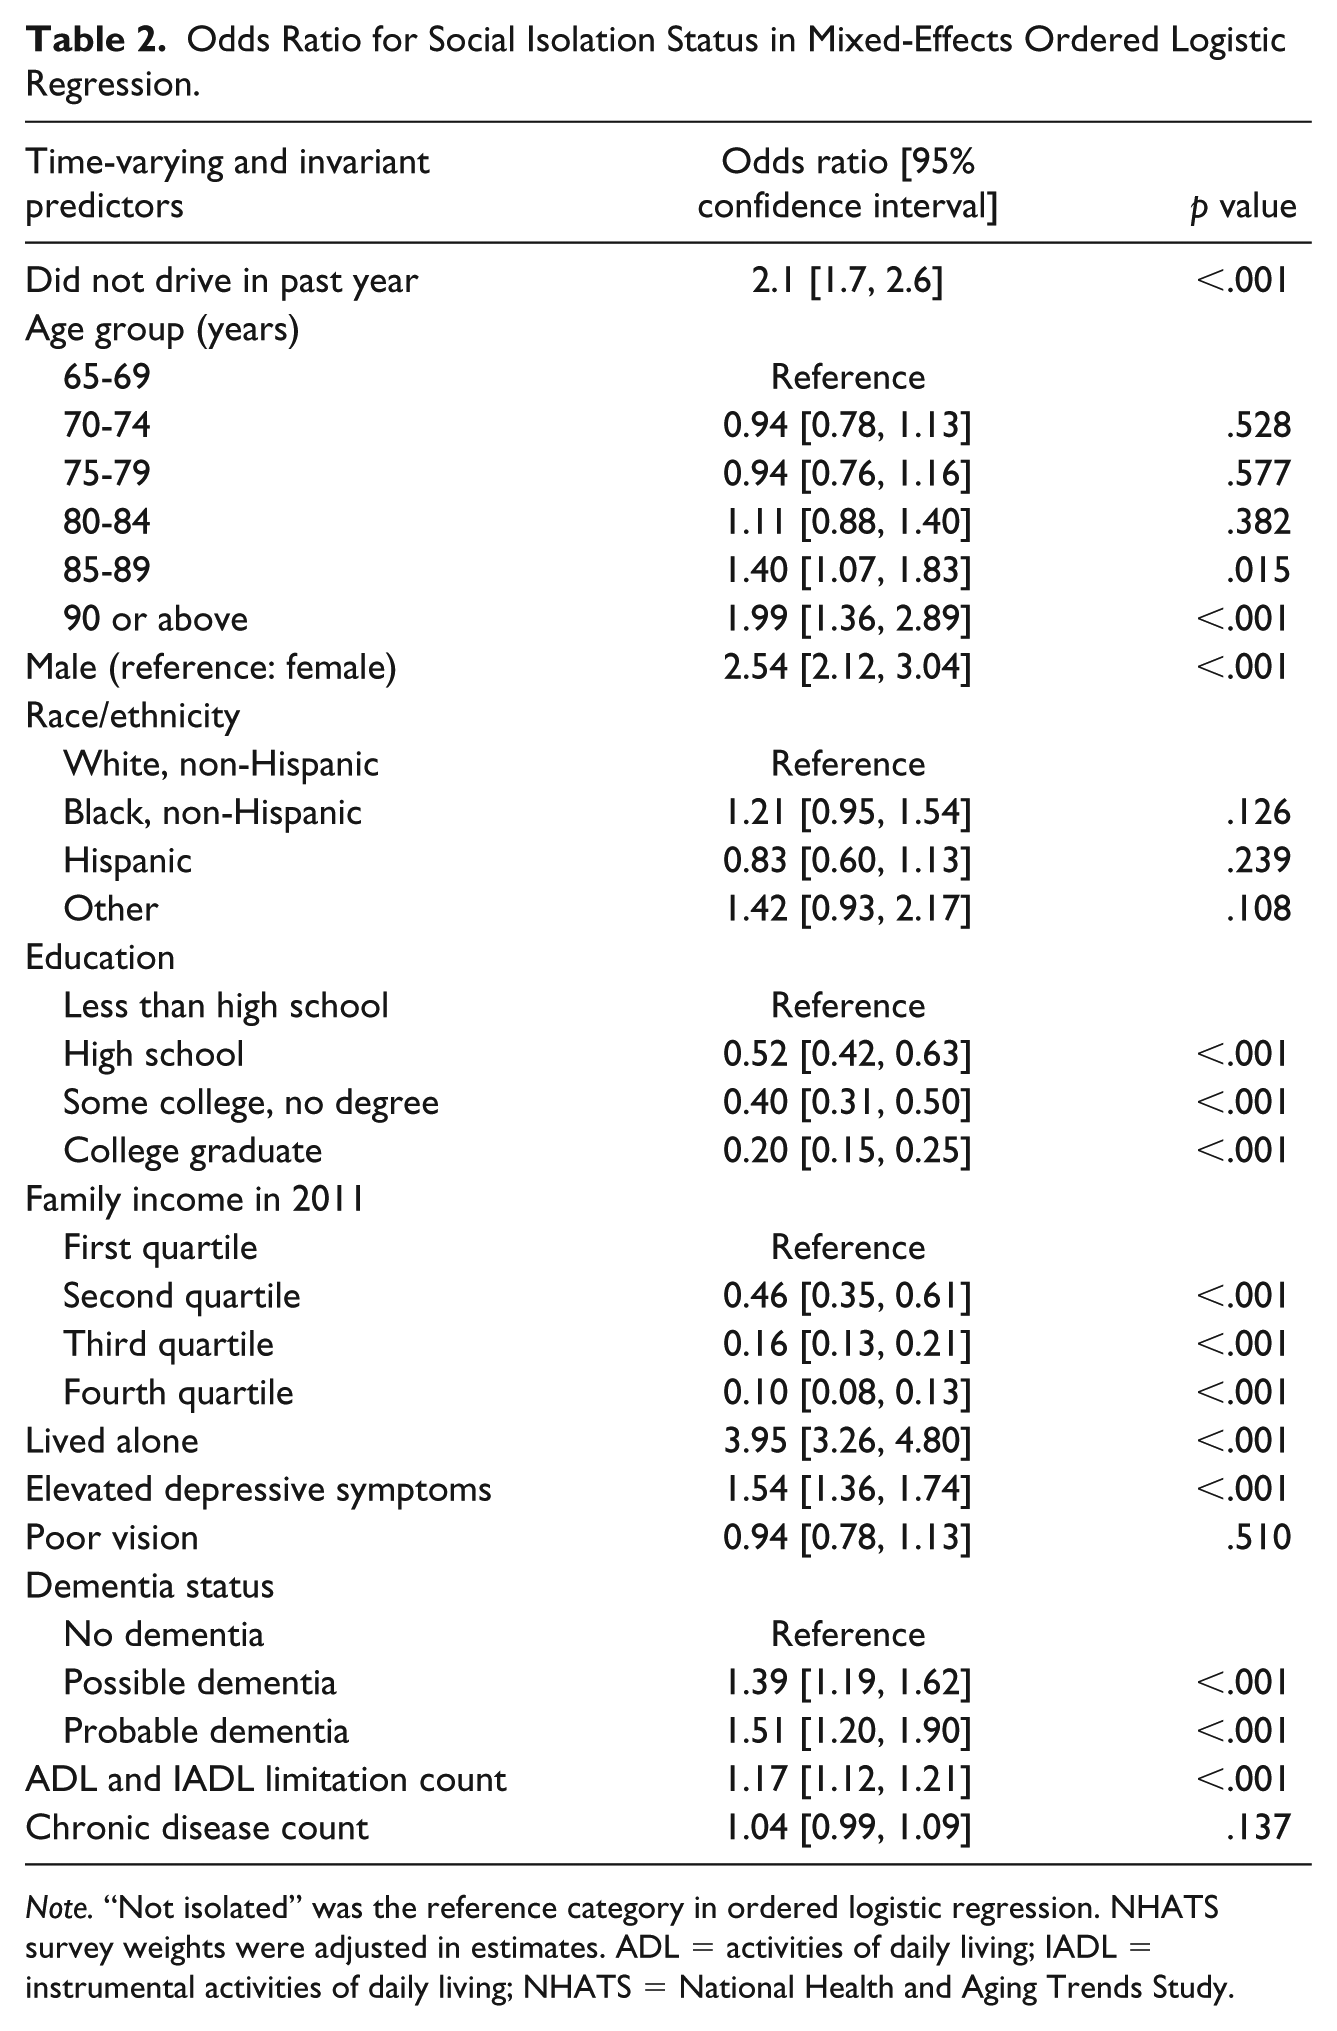
Note. “Not isolated” was the reference category in ordered logistic regression. NHATS survey weights were adjusted in estimates. ADL = activities of daily living; IADL = instrumental activities of daily living; NHATS = National Health and Aging Trends Study.
Table 3 presents the results from the piecewise regression. In the round in which participants reported incidents of driving cessation, social isolation scores (range = 0-6) increased by 0.08 points (95% CI = [0.01, 0.14], p = .024) from the round immediately before driving cessation, after adjusting for covariates.
Unstandardized Coefficients From Piecewise Regression Predicting Social Isolation Score Among Older Adults With Experience of Driving Cessation.
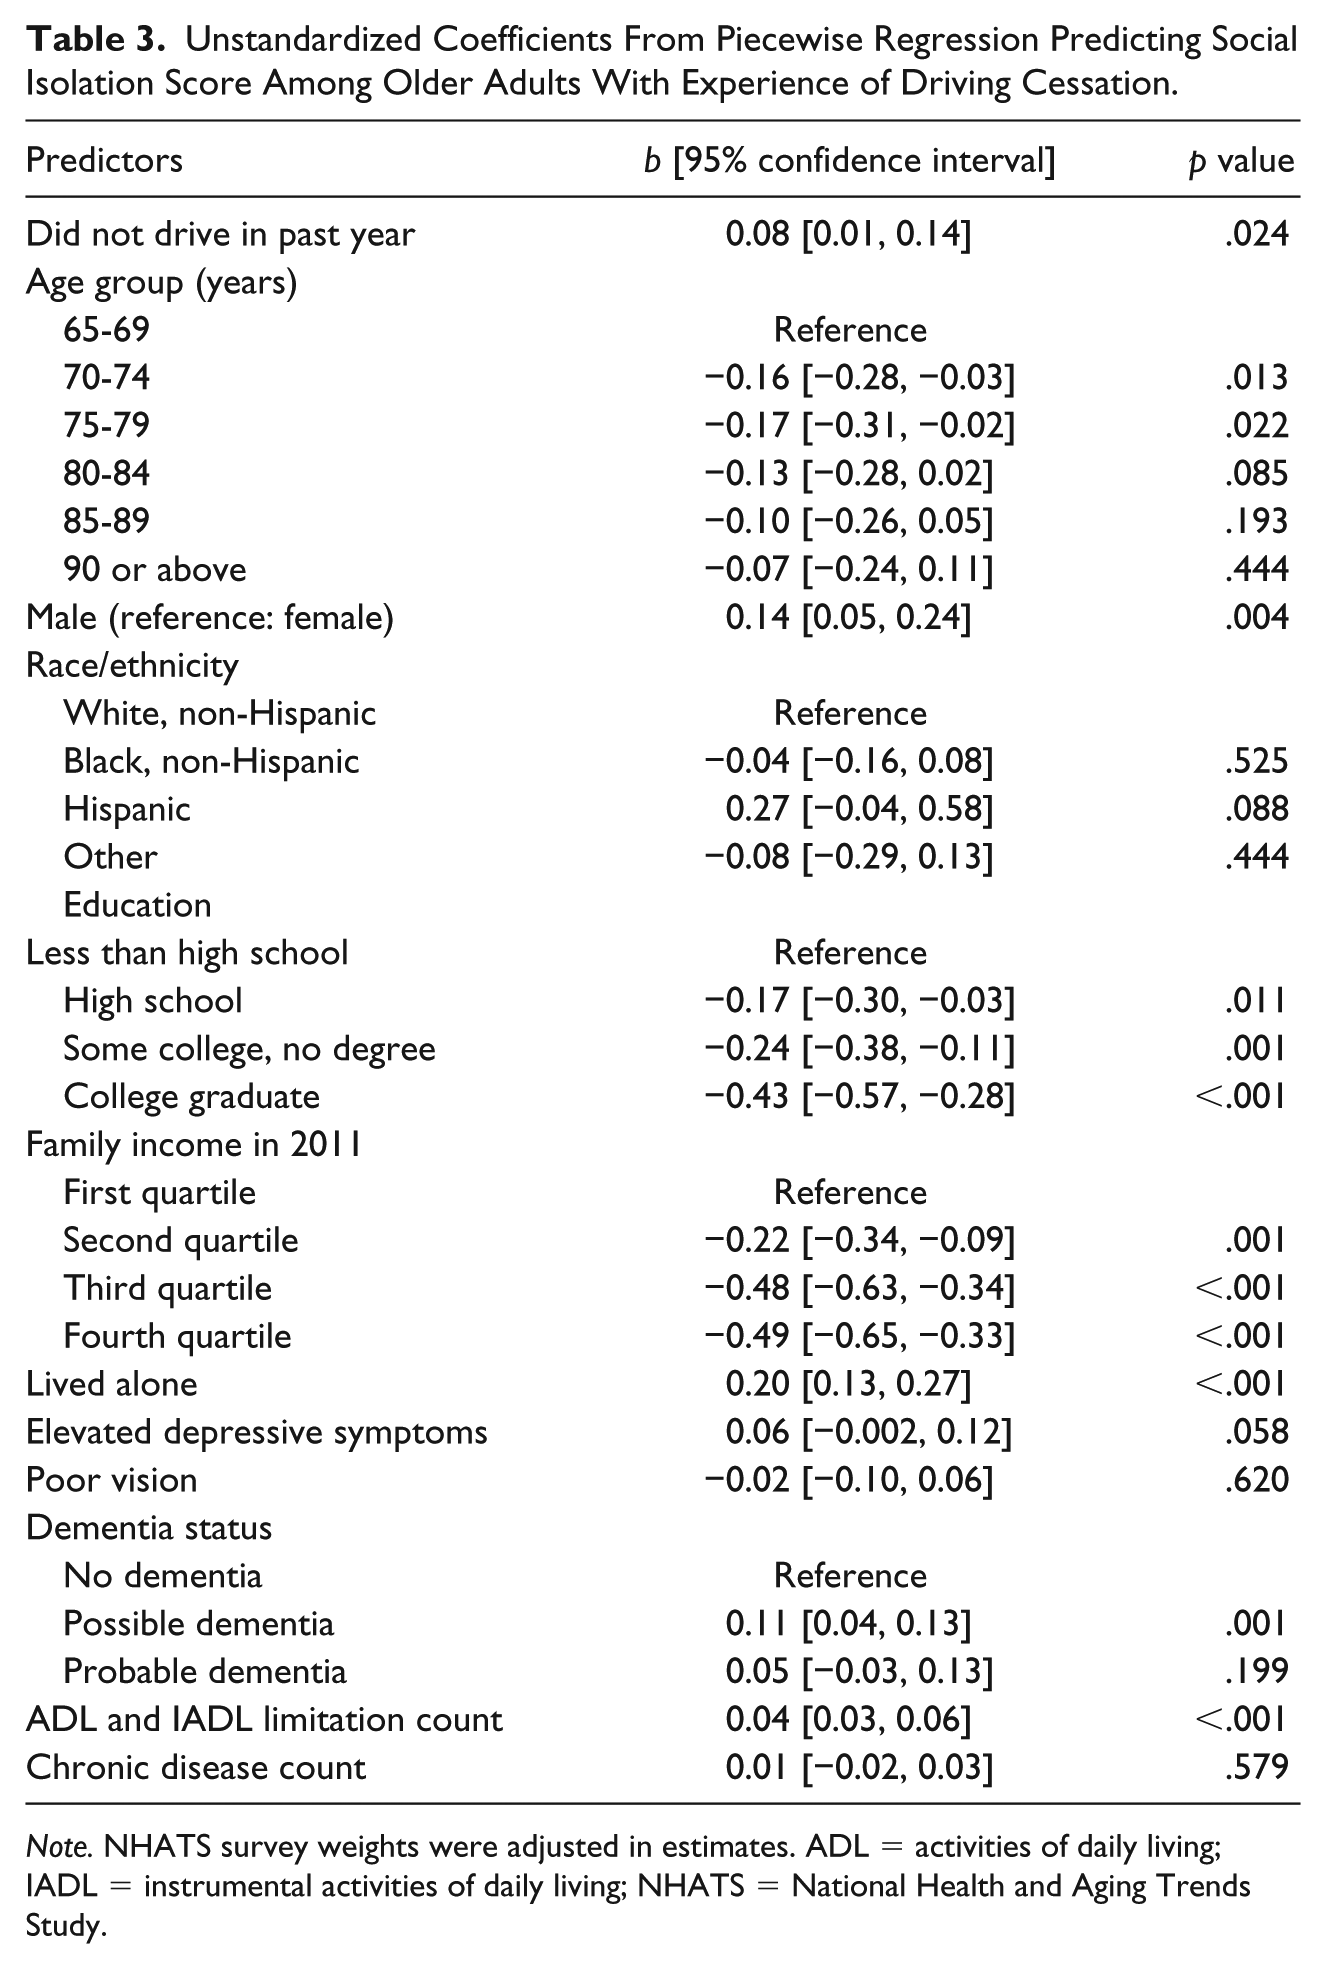
Note. NHATS survey weights were adjusted in estimates. ADL = activities of daily living; IADL = instrumental activities of daily living; NHATS = National Health and Aging Trends Study.
Discussion
The present study is one of the first to examine driving cessation and social isolation using a longitudinal design. Our main hypothesis was supported by the findings regarding the adverse impact of driving cessation on social isolation in the short and long term. In piecewise regression, social isolation scores increased significantly in the round where driving cessation was reported, compared with that in the previous round among persons with experiences of incident driving cessation, suggesting driving cessation had immediate effects on social isolation. In mixed-effects ordered logistic regression, past-year nondrivers had persistently higher risks of social isolation compared with drivers during the 6 years of the study period, suggesting a longer term association.
These findings are in line with previous studies that linked driving cessation to reduced social contact and participation in organized activities (Curl et al., 2014; Lehning et al., 2018; Marottoli et al., 2000; Mezuk & Rebok, 2008). These studies found that driving cessation was associated with reductions in some aspects of social contact and social activities. These included attending religious services and participating in organized activities (Marottoli et al., 2000), social activities (Lehning et al., 2018), and frequency of contacts with family and friends (Curl et al., 2014; Mezuk & Rebok, 2008). We extended the literature by using a validated social isolation measure that captured different aspects of social relations and social participation. Our estimates of social isolation were in line with those reported from previous studies. Using the classification from Pohl et al. (2017), 21.3% of our study population were classified as socially isolated, which is similar to the 22%, 23%, and 24% of socially isolated older adults reported by Pohl et al. (2017), Cudjoe et al. (2018), and Chatters et al. (2018), respectively. Similar to these studies, we measured social isolation based on the participants’ social network and participation in social activities. Our estimate of social isolation was higher than the estimate Ortiz (2011) provided, in which 17% of older adults were socially isolated. Ortiz (2011) classified participants as being socially isolated if they lived alone and were not proficient in speaking English, had a disability, or lived in a geographic area with less than 20 individuals per square mile. The difference in how social isolation was operationalized could explain the difference in the prevalence estimates of social isolation.
Adults aged 85 or older had a higher risk of social isolation than those aged 65 to 69 years, even adjusting for other socioeconomic, health, and functioning factors. Advanced age has been linked to smaller social networks (Ajrouch, Antonucci, & Janevic, 2001), which limits contact with family and friends. Older men had a higher risk of social isolation than women, which is consistent with the findings reported by Mezuk and Rebok (2008). Older adults with higher levels of education and income were less likely to experience social isolation, suggesting that such older adults may have more social resources that buffer the influence of driving cessation. In addition, older adults who live alone may have smaller family and friend networks and less participation in social activities and thus are more prone to social isolation. Future studies should examine sociodemographic differences in how older adults adapt to late-life changes such as driving cessation to inform the development of tailored interventions for combating social isolation.
Social isolation risk also differed by depressive symptoms and functioning status. Elevated depressive symptoms were associated with a higher likelihood of isolation, which is similar to the findings of Curl et al. (2014). It is possible that depressive symptoms reduced both older adults’ desire to contact network members and their confidence in attending social activities. The mechanism between depression and social isolation associated with driving cessation needs to be further examined in future studies. In addition, cognitive impairments predicted isolation, implying that older adults with reduced social contact and social participation tend to receive less mental stimulation, resulting in impaired cognitive functioning (Evans et al., 2018). Therefore, preventive efforts need to focus on mental and cognitive health given the significant influence these factors have on isolation in older adults. Functional limitations were associated with higher likelihood of isolation in older adults, consistent with the findings of Curl et al. (2014). Because functional limitations can be a major barrier to independent living and can limit older adults’ ability to participate in social activities (Elder & Retrum, 2012), interventions could focus on their adaptation to functional limitations.
We did not find significant racial and ethnic differences in social isolation in the multivariable model. However, mixed findings on racial and ethnic differences have been reported (Curl et al., 2014; Lehning et al., 2018; Marottoli et al., 2000). The number of chronic conditions failed to predict isolation in the current study, suggesting that disease pathology without functional impairment and disabilities may have little direct impact on social isolation. Another possible explanation is limitation in our measurement of chronic diseases. Comorbidity is a complex phenomenon (Diederichs, Berger, & Bartels, 2010), and a simple count of chronic conditions may not fully capture the extent of the burden of comorbidities. Future studies using a more sophisticated comorbidity measure may reveal different patterns regarding the relationship between chronic conditions and social isolation.
Limitations
This study has several limitations. All measures were self-reported and subject to recall bias and reporting errors. The social isolation measure by Pohl et al. (2017) did not consider details regarding the frequency of contact with family and friends and participation in social activities, which are important domains in measuring social isolation. We did not examine the impact of driving cessation on individual indicators of social isolation and future studies should begin examining the impact of driving cessation on each of these indicators of social isolation. Driving cessation may affect certain aspects of social relations and participation more than others. Moreover, we did not account for alternative forms of transportation. Some older adults may have accommodated well after driving cessation by using public transportation or riding with family and friends, taxis, and ridesharing services. Pristavec (2018) notes driving mobility encompasses both frequency of driving and receiving rides from others, a more complete measure of driving status.
Implications
Given the adverse impact of driving cessation on social connections, mental health (Klinenberg, 2016), and cognitive outcomes (Shankar et al., 2013), older adults contemplating or going through driving cessation are prime candidates for prevention. Older adults are generally not very confident in finding alternative transportation options after driving cessation (Lum, Brown, Juarez-Colunga, & Betz, 2015). These older adults could receive education and counseling during their primary care or ophthalmologist visits. Although driving cessation was rarely discussed during health care visits, older adults have expressed a desire for physician involvement in driving safety discussions, and most are open to discussing driving cessation with their physicians (Lum et al., 2015). Caregiver education on driving cessation may also be important, as older adults often relied on family as a key source of information when making important life transition decisions (Lum et al., 2015). In addition to education and prevention efforts aimed at preparing older adults for the psychosocial consequences of driving cessation, our study pointed to the importance of implementing strategies that may help older adults cope with reduced social contact after driving cessation. For example, use of technology and social media could help older adults digitally connect to and maintain contact with their loved ones. Alternative transportation options that are accessible and affordable may help older adults adapt to driving cessation without experiencing an adverse impact on social connections and participation. Increasingly popular rideshare platforms such as Lyft and Uber have already begun to collaborate with aging service providers such as senior centers and meals-on-wheels to provide affordable and accessible transportation to older adults who have stopped driving. The rising of driverless technology is yet another potential way for compensating inability to drive, which can enable older adults to maintain mobility “independence” and social connections. Given unequal access to technology advancements, technology gap and strategies to reduce the gap remain important areas for future research. At the policy level, alternative transportation services should pay special attention to older adults that are particularly vulnerable for social isolation, such as the oldest old, men, and lower socioeconomic groups.
Conclusion
Driving cessation, a major life change for many older adults, increases the risk of social isolation. Older adults going through driving cessation are primary candidates for prevention efforts aimed at reducing social isolation. Future research could examine the extent to which alternative transportation—among them public transportation, rides from friends and family, and increasingly popular rideshare services—protect older adults from becoming socially isolated following driving cessation.
Footnotes
Author’s Note
Harry Taylor is now affiliated with Duke University, Durham, NC.
Declaration of Conflicting Interests
The authors declared no potential conflicts of interest with respect to the research, authorship, and/or publication of this article.
Funding
The authors disclosed receipt of the following financial support for the research, authorship, and/or publication of this article: This work was supported by a grant from the National Institutes of Health, University of Michigan Older Americans Independence Center Research Education Core (Grant AG024824) to Xiaoling Xiang and a grant from National Institute on Aging (5T32AG000029-42) to Harry Taylor.