



Abstract
Introduction
Research shows that aging can follow different trajectories such as pathological, normative, or healthy aging (Rowe & Kahn, 2015; World Health Organization, 2015). Which trajectory occurs depends significantly on a person’s adaptive capacity to stress (Baltes & Baltes, 1990; World Health Organization, 2015). It is well documented that older age is related to the likely occurrence of stressors that can significantly and negatively affect the course of aging, such as the loss of a significant other or a serious physical issue (Infurna & Luthar, 2017; Windle, 2012). Therefore, in the face of the expected pronounced increase of people reaching older ages (Cosco et al., 2017), it is of upmost importance to study factors that support favorably aging trajectories in the face of such common stressors (Windle, 2012).
Resilience is a major, yet understudied, factor in older age that influences how aging is affected by stress (Pruchno et al., 2015; Windle, 2012). In general, a resilient person is defined as doing well despite expectations when confronted with a stressor by having access to contextually meaningful protective resources (Ungar, 2011). Resilient individuals have been found to meet daily living tasks (Hardy et al., 2004) or cultural expectations (Ungar, 2011), show high life satisfaction (Fredrickson et al., 2003), low depression (Maercker et al., 2016), low anxiety (Bonanno et al., 2012), or low psychological distress (Pietrzak & Cook, 2013) in the face of stressful life events such as disasters, childhood maltreatment, significant loss, war, or cancer. Hence, being resilient in the face of stress can be indicated by multiple dimensions of life such as psychological health and functionality that can be differentially impacted by a stressor (Infurna & Luthar, 2017).
However, past research has shown that there is more than one trajectory in the context of stress that is associated with being resilient (Bonanno, 2004; Carver, 1998). An individual can resist a stressor with only a short-term minimal negative impact and is thus able to show good health and functionality shortly after the experience. Further, recovery is also seen as resilience which is characterized by pronounced negative consequences at first and followed by a return to good health and functionality over time. These two trajectories are mostly found in longitudinal studies of resilience (Bonanno et al., 2012; Hobfoll et al., 2009; Norris et al., 2009). Recent research proposes a third resilience-related process that could lead to an improved aging trajectory than before a stressful experience (Carver, 1998; Pruchno et al., 2015). Accordingly, stress can result in an improved resilience to future stress and higher well-being (Höltge et al., 2018). Thus, the following unfavorable and favorable aging trajectories are possible in the context of stress in higher age: (1) chronic high symptomatology, (2) worse off, (3) recovery, (4) minimal impact/resistance, and (5) better off.
In the present study, it was the first aim to identify trajectories of daily functionality and depression in the context of common stressors of higher age, that is, serious fall and significant loss, in a community sample of older Mexicans. Depression was chosen as a psychological outcome because it is the most common stress-associated disease today and likely to occur when losing the partner or being limited in daily life because of a serious physical condition (Iaboni & Flint, 2013; Lee & DeMaris, 2007). It is important to identify early predictors of unfavorable and favorable depression trajectories since depression can accelerate the biological aging process (Wolkowitz et al., 2010) and lead to a higher rate of nonsuicide mortality in the elderly (Schulz et al., 2002). Daily function, a central factor in the aging literature, is evaluated through a person’s ability to perform fundamental activities of daily life such as eating or moving which frequently decline with age (Bowling & Grundy, 1997; Devi, 2018). Stressful experiences such as living with a chronic disease and becoming a widow/widower have been found to accelerate functional decline (Monserud, 2019; Van den Brink et al., 2004). Depression and daily functionality are often found to strongly correlate in higher age (e.g., Bruce et al. (1994) and Russo et al. (2007)). However, stressful experiences must not affect different outcomes in the same way (Cosco et al., 2017; Infurna & Luthar, 2017). Hence, by studying trajectories separately for depression and daily functionality, it was the second aim of this study to explore if individuals who are affected by this study’s stressful experiences show rather the same or different trajectories in these outcomes. Furthermore, the third aim of the study was to gain insight into the resources that might predict each outcome trajectory shortly before the actual event happened.
Resilience: A Socio-Ecological Perspective
The study of resilience has evolved from searching for the resilient personality that makes an individual resilient in any context to seeing resilience as a dynamic, multisystemic phenomenon (Masten, 2014; Ungar, 2018). The socio-ecological model of resilience (SERM) stresses that (Ungar, 2011, 2018) (1) the type of stressor and an individual’s age influence which resources are needed in order to be resilient (contextual specificity), (2) cultural and sociopolitical characteristics of a country influence the availability of resources and how individuals deal with stress (cultural relativity), and (3) resilience depends on individual as well as socio-ecological resources (=multi-systemic).
This study conceptualized contextual specificity by examining trajectories in the face of a psychosocial stressor (loss of the spouse) and a physical stressor (serious fall that needs medical treatment). Both increase in their prevalence with increasing age and have been found to negatively affect psychological well-being (e.g., heightened depression; Eggermont et al., 2012) as well as everyday functionality (e.g., lowered daily functionality; Lee & Carr, 2007). Furthermore, age influences not only the likelihood of certain stressors but also which resources are available and necessary in order to show resilience (Ungar, 2011).
This also relates to the influence of different cultures and countries. In order to broaden the knowledge on cultural relativity, this study focused on elderly Mexicans. Mexico is known to be a collectivistic country with 30% of the elderly having no education and 35% minor education, 40% living in poverty, 50% working, only 33% receiving pension, and 50% having access to health insurance (Parker & Wong, 2001; Wong et al, 2015). Mexico has also experienced a rapid aging process, and older adults are currently experiencing a mixed epidemiological regime where infectious and chronic conditions coexist. Rapid aging and a mixed regime result in a unique set of stressors and resources, and thus affect resilience.
Finally, the SERM stresses two significant characteristics of resources. First, while a strong focus is often placed on individual resources such as optimism, locus of control, cognition, or subjective health, relational/interpersonal (e.g., social support and relationship status) and contextual resources (e.g., education, employment, and health service accessibility) are as equally important to predict an individual’s trajectory in the context of adversity (Masten, 2014; Ungar, 2018). Second, while one resource can have similar resilience-enhancing effects in different contexts, other resources might make an individual resilient in one context but have no effect or even make more vulnerable in another stressful context.
Hence, a resilient study should include different stressors and resources that could show a higher significance in one context over another (Ungar, 2011). Further, a stressor can have varying effects on physiological and psychological outcomes (Ifurna & Luthar, 2017). This can result in the coexistence of favorable and unfavorable trajectories (Cosco et al., 2017; Pruchno et al., 2015). Finally, studies of resilience should include the following temporal elements (Bonanno et al., 2015): (a) status of a person before an event occurred (baseline), (b) a potentially stressful experience, and status of a person in the aftermath of this stressful experience in the (c) short and (d) long term; and predictors of the overall development. The present study was designed to address all these criteria.
Potential Predictors of Adversity Outcome Trajectories in Higher Age
Only few studies have explored internal and socio-ecological resources that could be important for a person’s resilience in older ages. For example, one longitudinal study identified self-efficacy, social support, physical health, and income as important resources for positive aging in higher age for persons with a past of severe adverse childhood experiences (Maercker et al., 2016). Further longitudinal studies give evidence that social support should be an important global resource in older age (Ifurna & Luthar, 2017; Netuveli et al., 2008). Cross-sectional studies reported that being male, not living alone, being socially active in the family, having social support, a partner, meaning in life, access to health care, high subjective health, higher income, good cognitive functioning, and a resilient personality can also support positive outcomes after stress in older ages (Hardy et al., 2004; Lamond et al., 2008; Pietrzak & Cook, 2013; Van Kessel, 2013; Windle et al., 2010). Of note, most of these studies have been conducted in westernized countries. The current analysis was designed to include as many of these resources as possible.
Method
Study Design
This longitudinal analysis uses data from the MHAS, Mexican Health and Aging Study (2019), which is a prospective panel study conducted in Mexico (Wong et al., 2015) with so far four waves of data (2001, 2003, 2012, and 2015). The MHAS includes a representative sample of community-dwelling older Mexican adults. It is the longest longitudinal aging study in Latin America and is part of the Health and Retirement sister studies, making it highly comparable to studies around the world. Data were collected by structured, face-to-face interviews. The MHAS is partly sponsored by the National Institutes of Health/National Institute on Aging (grant number NIH R01AG018016) and the INEGI in Mexico. Data files and documentation are for public use and available at www.MHASweb.org.
Data from the first three waves were used: a baseline measurement of the trajectory indicators (depression and daily disability) before the events happened (2001), a short-term follow-up (2003), and a long-term follow-up (2012). Resources assessed in 2001 were used as predictors (see Appendix A for correlation table). Figure 1 shows the conceptual model of the study, which variables were assessed at which wave, and how they were used for the analysis. Conceptual model of the study. Note. C = number of latent trajectories. The number of latent trajectories is based on depression or daily disability at 2001, 2003, and 2012. The stressful experiences (loss and fall) happened between 2001 and 2003. All predictors that are used for the analysis were assessed in 2001.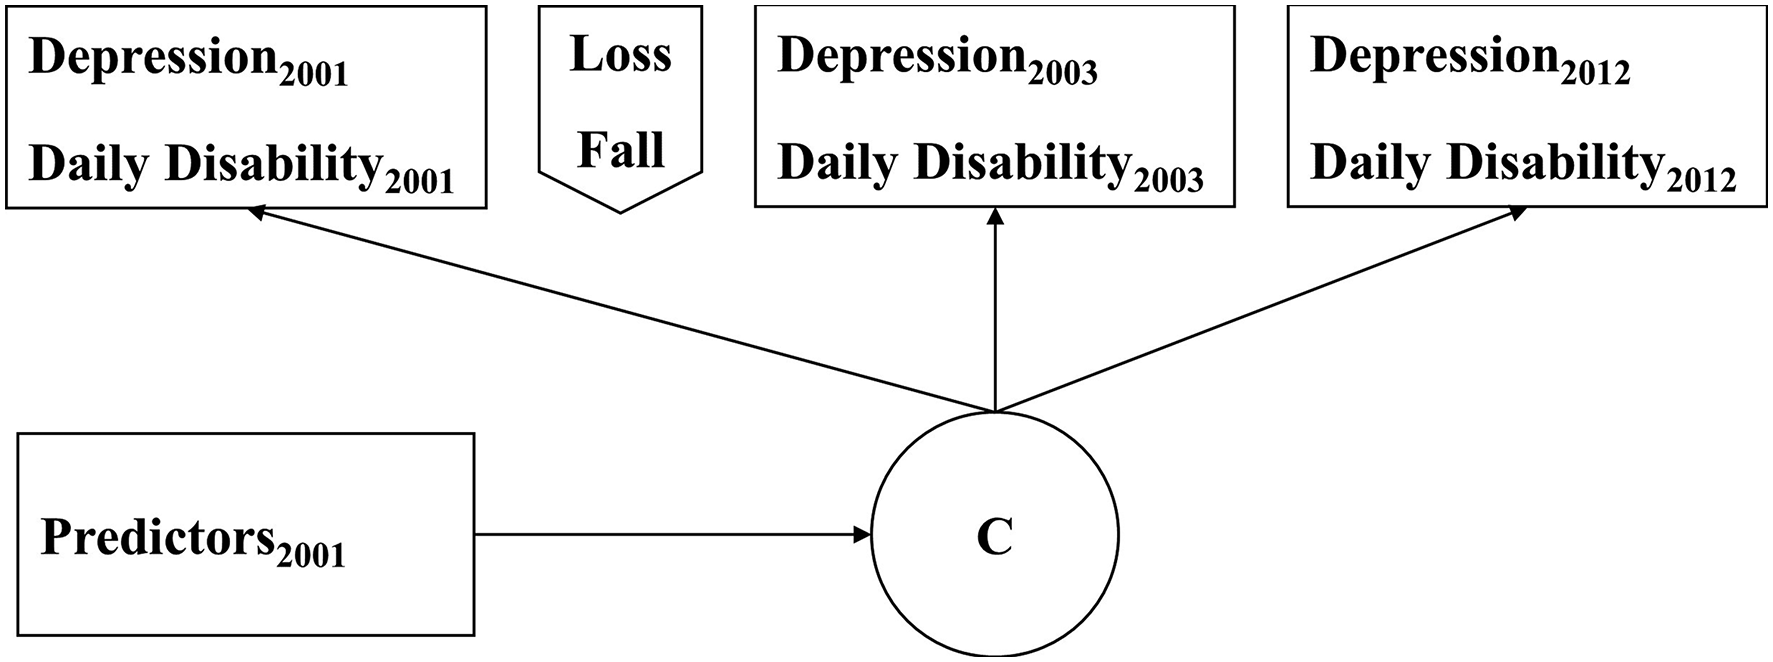
Trajectory Indicators
Depression was assessed via a shortened version of the Center for Epidemiologic Studies—depression scale (Kohout et al., 1993) which uses nine of the original 20 items and a dichotomous answer format (yes/no). The sum-score ranges 0–9, and higher scores indicate a higher level of depression. Cronbach’s alpha ranged from .8 to .81 for both samples. Daily disability was indicated by difficulties with any of 21 daily activities such as walking, lifting, dressing, eating, or cooking because of a health problem. This list is based on the Katz Index of Independence in Activities of Daily Living and the Lawton and Brody Index for Instrumental Activities of Daily Living (Spector & Fleishman, 1998). Participants rate each activity by indicating if they cannot do the activity at all (coded as 2), have difficulties in performing it (coded as 1), or if they have no problems in performing it (coded as 0), which results in a range of 0–42. A higher sum-score indicates a higher daily disability.
Predictors of Trajectory Occurrence
Sociodemographic variables were sex, age, education (no vs any), relationship status (single vs partner, only in the model for the fall sample), and work status (no work vs work). The variable both events (no vs yes) was included to control for persons who have experienced both stressors. Social support was indicated by three variables. First, by the size of the family network, which was the sum of the number of alive parents, siblings, and children. Second, received social support was indicated by an index that encompassed if the participant received financial or nonfinancial help from children (yes = 1, no = 0) and if the participant had neighbors or friends that would help with daily activities if needed (yes/no). Higher sum-scores indicate higher received social support. Third, if the person had good friends in the neighborhood (yes/no). Giving support was indicated by the following index: giving financial (yes/no) and nonfinancial (yes/no) support to parents as well as giving financial (yes/no) and nonfinancial (yes/no) support to children. Higher sum-scores indicate higher given support. Religion was indicated by a binary variable reflecting the importance of religion in life (not important vs important). Health-related predictors were indicated by two variables. First, if the participant had access to medical attention via different Mexican health services (yes/no). Second, by subjective health, which was assessed by asking the participant: “Would you say your health is (1) excellent–(5) poor?” Locus of control was indicated by a sum-score based on eight items with a four-point Likert scale adapted from Rotter (1966). The scale ranged from (1) disagree to (4) agree. Scores of negatively worded items were reversed to derive the sum score. Higher sum-scores indicate a higher sense of control of life. Cronbach’s alpha ranged from .73 to .77 for both samples. Cognition was assessed in the MHAS 2001 via five different tasks: verbal learning, verbal recall, visuospatial abilities, visual scanning, and visual memory. The total cognition score ranges from 0 to 80, and higher scores indicate better cognitive abilities (for a description of the measures see: Mejía-Arango et al. (2015). Net worth is indicated by an index (Wong & Gonzalez-Gonzalez, 2010) that consists of the sum of the reported gross value of all assets of an individual (e.g., houses/apartments, capital and other assets, and real estate) subtracted by all debts (e.g., houses/apartments, businesses, vehicles, and real estate).
Inclusion Criteria
Participants of the MHAS were selected for the present analysis if they were at least age 50 in 2001 and had experienced one of the following stressors between 2001 and 2003: a serious fall that needed medical treatment (fall sample, indicated by self-report in 2003) or the loss of the spouse (loss sample, indicated by a change in relationship status from married in 2001 to widowed in 2003). Hence, no dropout was possible between 2001 and 2003. Using 50 years of age considers different definitions of aging, limits survivor effects (Pruchno et al., 2010), and midlife marks a recognizable incline in risk factors (World Health Organization, 2015).
Sample Characteristics.
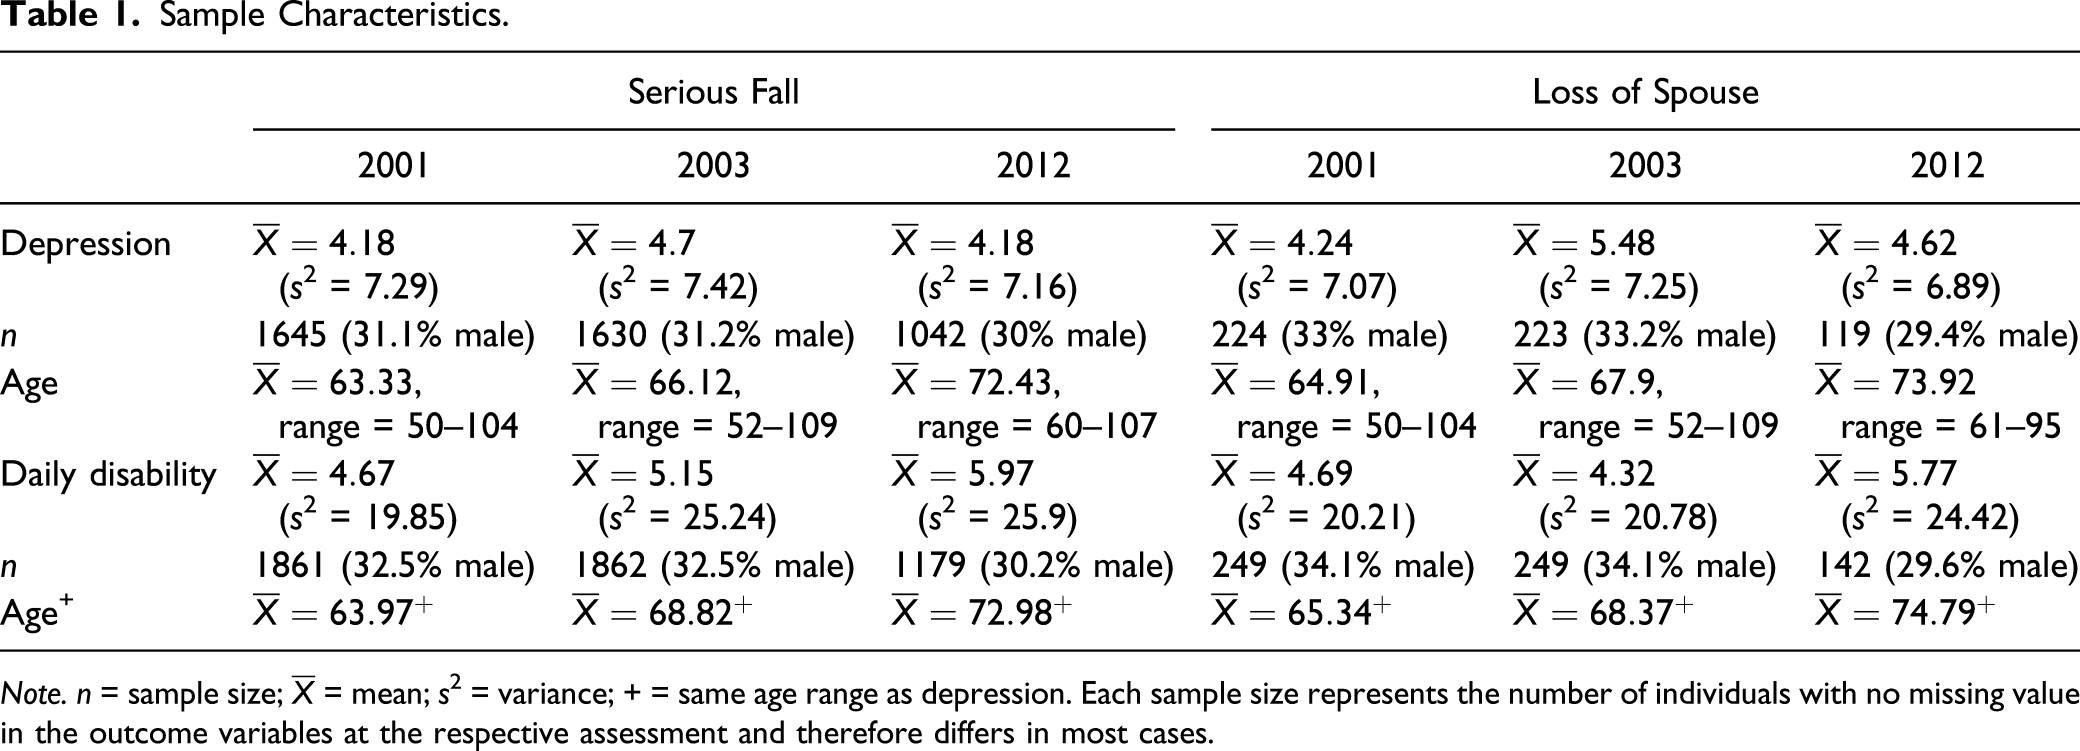
Note. n = sample size;
Data Analysis
The data were analyzed using Mplus 8 (Muthén & Muthén, 2017).
Model Fit
To identify the number of latent trajectories in each sample and trajectory indicator, latent class growth analysis (LCGA) was applied (Jung & Wickrama, 2008). LCGA results in distinct homogeneous classes of individuals who follow a similar trajectory over time and are characterized by class-specific intercepts and slopes. LCGA is an iterative and inductive method, that is, models with an increasing number of latent trajectories are tested for model fit. Models with up to five trajectories were tested (Bonanno et al., 2012; Carver, 1998).
The selection of the final model is commonly based on statistical indicators (Nylund et al., 2007). A statistical indicator of relative model fit is the bootstrap log-likelihood ratio difference test (Geiser, 2013). A significant result on this test indicates that a model with n-trajectories is a better fit to the data in comparison to a model with n − 1 trajectories. Model fit can also be assessed using the information criteria (IC) of Akaike information criterion, Bayesian information criterion (BIC) and the sample size–adjusted Bayesian information criterion (SSA-BIC), and the log-likelihood (LL). Lower values for the IC and LL indicate better model fit. Nevertheless, even though statistical indicators might favor a certain model, substantive theory and model parsimony can still determine the selection of a different model (Bauer & Curran, 2003; Lubke & Neale, 2006). Four models were identified since two stressors (serious fall and loss of spouse) and two trajectory indicators (depression and daily disability) per stressor were analyzed.
The LCGA results in a variable that indicates the most likely trajectory membership per person for each model. Hence, Spearman correlations were used to investigate if a person rather follows the same or different trajectories in the indicators over time separately for each stressor.
Prediction of Trajectories
To analyze how the resources were able to predict the trajectories, the modified Bolck–Croon–Hagenaars procedure (Bakk & Vermunt, 2016) was used for continuous variables and the DCAT procedure for binary variables (Lanza et al., 2013).
Missing Values and Sensitivity Analysis
Full information maximum likelihood estimation for missing values is automatically applied by Mplus when using mixture models assuming that scores are missing at random (MAR; Muthén et al., 2011). It was likely that some participants might have been deceased between the second wave and the third wave, leading to nonignorable dropout and scores not missing at random (NMAR). Thus, Muthén–Roy modeling was used for sensitivity analysis which uses a second latent class variable in model estimation that represents dropout at the third assessment (Muthén et al., 2011). It is recommended to compare the model estimation results of MAR and NMAR. If both result in the same best fitting model via BIC, then the results of MAR can be trusted, and the dropout and missing values have no significant effect on the results.
Results
Sample Characteristics
Sample characteristics can be found in Table 1. Overall, 1862 of the 2029 individuals who experienced a serious fall between 2001 and 2003 were 50 years and older in 2001. Also, 249 of the 263 individuals who lost their spouse between 2001 and 2003 were 50 years and older in 2001. Of these, 46 individuals experienced both events. On average, 32.6% were male in the fall sample, and 34.1% were male in the loss sample. Most dropouts between 2003 and 2012 were due to the death of the participants since 2003 (fall sample: 492 deceased from the overall dropout of 683 which is 26.42% of initial sample; loss sample: 64 deceased from the overall dropout of 107 which is 25.7% of initial sample). On average, depression follows the same trend over time across both stressor samples: it increases from 2001 to 2003 (fall sample: 49.9% show increase and 36.4% show decrease; loss sample: 58.2% show increase and 28.% show decrease) and declines from 2003 to 2012 (fall sample: 37.1% show increase and 48.3% show decrease; loss sample: 31.3% show increase and 54.8% show decrease). For most members of the fall sample, daily disability shows an increase from 2001 to 2003 (44.9% show increase and 39.5% show decrease) and also an increase from 2003 to 2012 (55.5% show increase and 33% show decrease). In the case of loss of the spouse, daily disability shows a decline between 2001 and 2003 (37.8% show increase and 47.8% show decrease) and increases from 2003 to 2012 (54.2% show increase and 26.8% show decrease). This shows that depression and daily disability must not show the same trend over time.
Model Selection
Please see the online Supplementary Table S1 for the fit indices for both MAR and NMAR models. Within the fall sample, all individuals provided sufficient data for daily disability for at least two waves and 1689 for depression (=9.29% showed missing values for depression). Within the loss sample, all participants provided sufficient data for daily disability and 227 for depression (=8.83% showed missing values for depression).
Serious Fall
Four trajectories were selected for both indicators (see Figure 2). In the case of depression, the BIC and SSA-BIC favored the four-trajectory solution, while the other fit indices favored models with more trajectories. For daily disability, the statistical fit indices did not result in a final model. Therefore, also a model with six trajectories was analyzed. The additional fifth and sixth trajectories posed similar trajectories to the ones of the four-trajectory solution only with steeper slopes. Thus, the selection in the case of daily disability was based on model parsimony. The NMAR results did not contradict the MAR results. Identified trajectories for the fall sample. (a) Trajectories for depression and (b) trajectories for daily disability. Note. Higher scores on Y-axis indicate higher depression/daily disability scores at the respective assessment.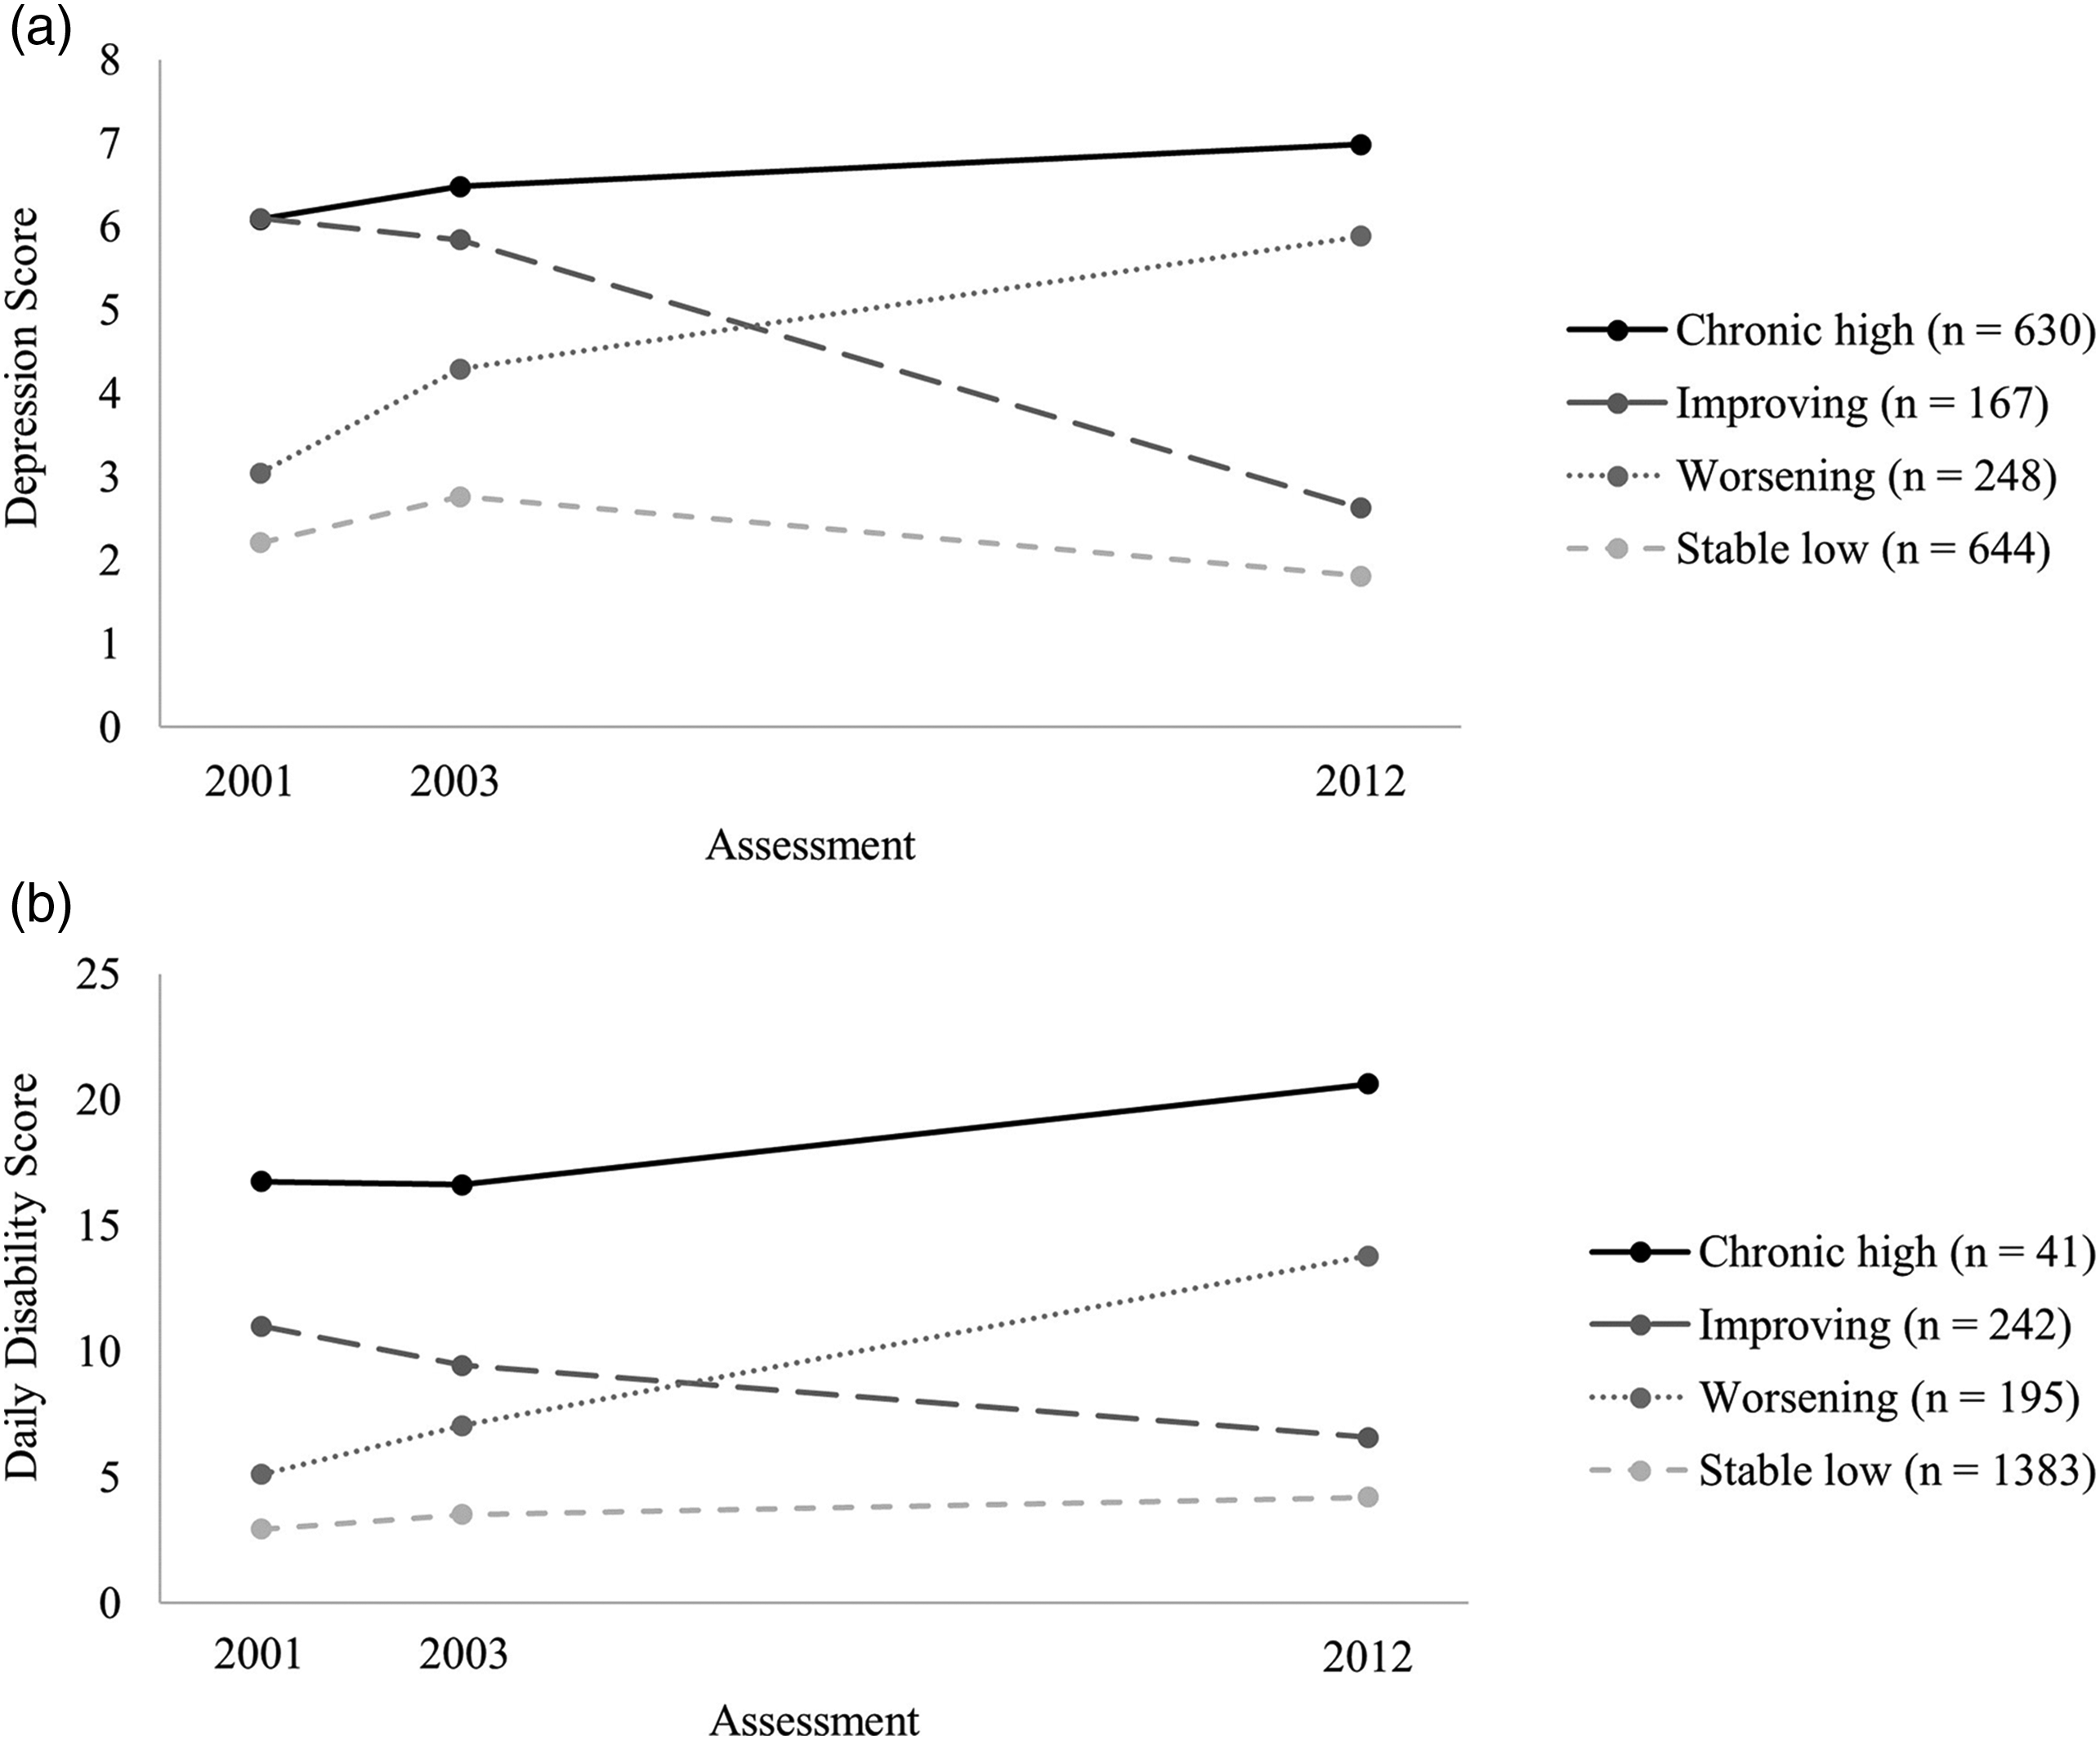
A three-trajectory model was selected for outcomes (see Figure 3). In the case of depression, all fit indices except the BIC favored the three-trajectory solution. In the case of daily disability, the indices showed the same pattern just like for the fall sample. Due to model parsimony and comparability between models, the three-trajectory solution was selected. The NMAR results supported the selection in the case of daily disability but not for depression. The Muthén–Roy modeling suggested a solution with two trajectories for depression: participants with a low dropout tendency rather belonged to the improving trajectory and dropouts rather belonged to the worsening trajectory (see below). Since both trajectories are also present in the three-trajectory solution using the MAR approach, the MAR approach was chosen for further analysis since it also included a theoretically plausible third trajectory. Identified trajectories for the loss sample. (a) Trajectories for depression and (b) trajectories for daily disability. Note. Higher scores on Y-axis indicate higher depression/daily disability scores at the respective assessment.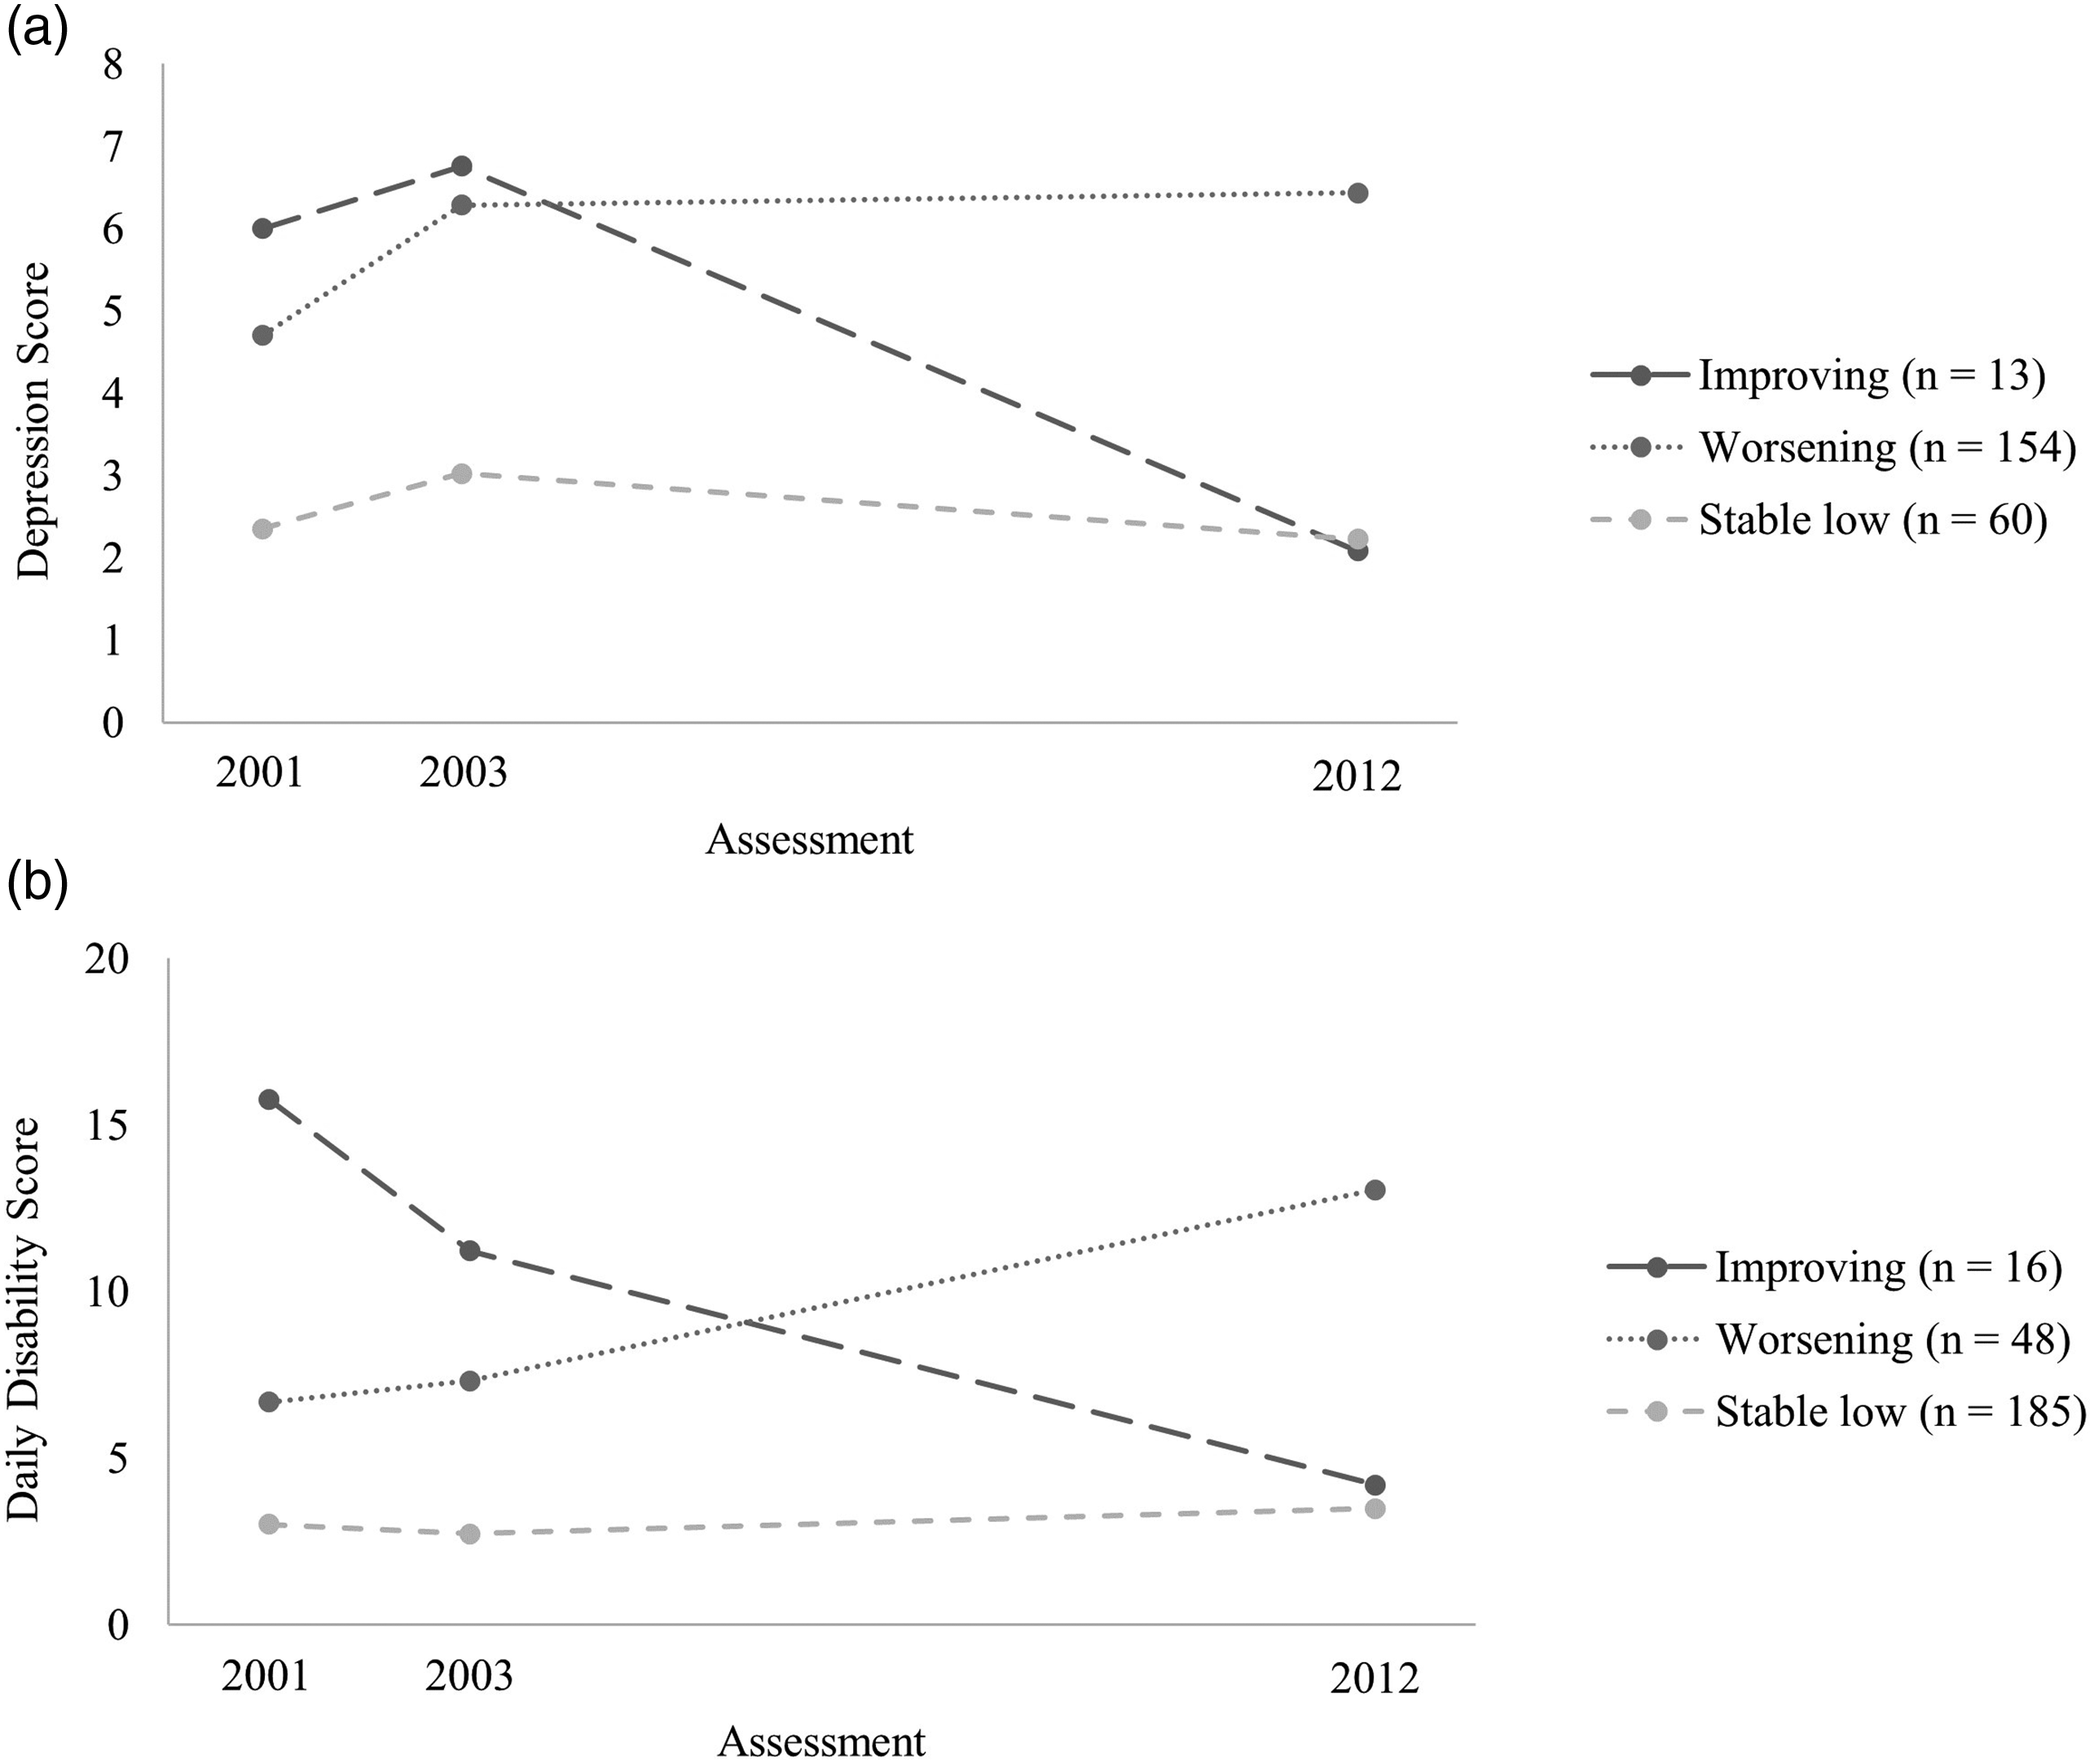
Trajectories
Model Characteristics.
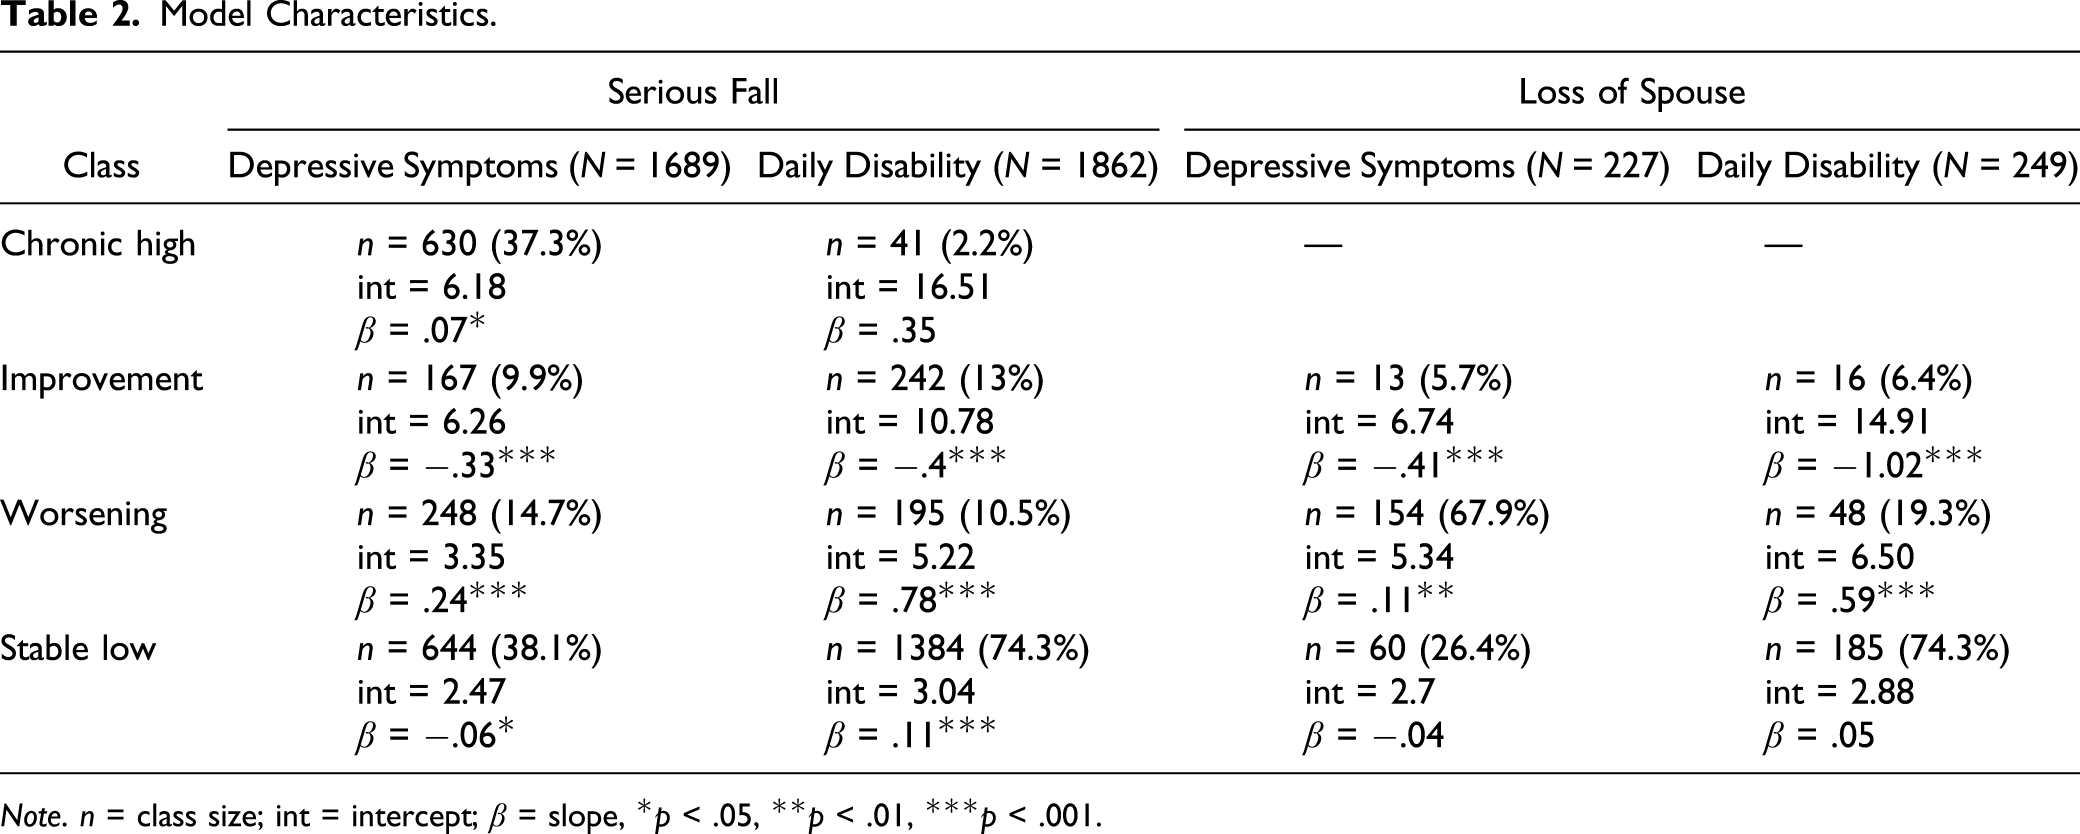
Note. n = class size; int = intercept; β = slope, *p < .05, **p < .01, ***p < .001.
The stable low trajectory characterizes persons who are the least negatively impacted by the stressors and usually show the lowest scores on the indicators at all waves. For both depression models, this trajectory is characterized by a slight increase between the first wave and the second wave, and it decreases relatively back to baseline between the second wave and the third wave. In the case of daily disability, this trajectory shows a small increase over time in the fall sample, and a small decrease first followed by a small increase in loss sample. This is the most common trajectory in three out of the four models (except for the depression model of the loss sample).
The worsening trajectory characterizes persons who experience a steady pronounced increase in depression or daily disability over time. Individuals with this trajectory usually start with the second lowest score at baseline and increase to the second highest or highest score at the third wave. This is the most common trajectory in the case of depression within the loss sample but is otherwise second or third place.
The improving trajectory starts with the second highest or highest score at baseline and decreases below its baseline either to the second lowest or lowest score at the third wave. This trajectory is characterized by a steady pronounced decrease over time for both daily disability models and for depression in the fall sample. Only the loss sample shows an increase in depression at first followed by a step decline. This is the smallest class in three out of four models, except for daily disability in the fall sample.
The chronic high trajectory was found for the fall sample only and is characterized by the highest scores of the indicators at all waves with some increase over time. This trajectory was the least common for daily disability and the second most common for depression.
The online Supplementary Tables S2 (serious fall) and S3 (loss) show that the frequency of unfavorable trajectories (worsening and chronic high) is higher for depression than for daily disability in both samples. In the fall sample, while 52% showed one of the two unfavorable trajectories for depression, only 13% showed them for daily disability. In the loss sample, while 68% showed the worsening trajectory for depression, only 21% showed this trajectory for daily disability. Also, the participants rather belonged to different trajectories comparing depression and daily disability: serious fall (r = −.20, p < .01) and loss (r = −.28, p < .01). However, participants who showed a stable low trajectory tended to show this for both depression and daily disability (33.7% in the fall sample and 24.2% in the loss sample).
Serious Fall: Predictors
Depression
The variables friends, health service, religion, family network, give support, and locus of control showed the least predictive power (see Supplementary Table S4). The results further indicate that the trajectories chronic high and improving on the one side and the trajectories worsening and stable low on the other side were comparable in relationship status, work status, and subjective health. Participants following either the chronic high or improving trajectories were rather single, unemployed, and showed the lowest subjective health at the first assessment. Further predictors of the chronic high trajectory were higher age as well as lower cognition and net worth, which was comparable to the net worth of the worsening trajectory. The improving trajectory was further predicted by higher scores in giving support, net worth, and cognition, which was comparable to the cognition score of the stable low group. The worsening trajectory was further predicted by a lower cognition. The stable low group was additionally predicted by a high net worth.
Daily Disability
The variables friends, health service, locus of control, religion, relationship status, and receiving support were least able to differentiate between the trajectories (see Supplementary Table S5). The chronic high trajectory was predicted by a high age, low subjective health, cognition, and giving support, as well as unemployment. The improving trajectory was predicted by being rather female and younger age, having a large family network, giving support, and a higher cognition. The worsening trajectory was predicted by unemployment, higher age, small family network, lower subjective health, low cognition, and net worth. The stable low trajectory was predicted by having an education, rather being in a relationship, and working, younger age, giving support, and a high subjective health, cognition, and net worth at the first assessment.
Loss of Spouse: Predictors
Most tests did not result in significant differences between the three identified trajectories, especially in the case of depression. Thus, the following results are rather descriptive.
Depression
The variables with the least predictive power were friends, religion, and locus of control (see Supplementary Table S6). Improving trajectory was predicted by younger age, larger family network, low subjective health which was comparable to the subjective health of the worsening trajectory, and a high cognition and net worth which were both comparable to the stable low trajectory. The worsening trajectory was further predicted by being unemployed, higher age which was comparable to the stable low group, and a low cognition and net worth. Further predictors of the stable low trajectory were being employed and a high subjective health.
Daily Disability
The variables with the least predictive power were sex, education, friends, religion, receiving support, and locus of control (see Supplementary Table S7). The improving trajectory was predicted by being unemployed, having low health service comparable to the stable low trajectory, higher age, low in giving support, low subjective health comparable to the worsening trajectory, low cognition, and a low net worth comparable to the worsening trajectory. The worsening trajectory was further predicted by rather having health service, younger age comparable to the stable low trajectory, giving support, and high cognition comparable to the stable low trajectory. The stable low trajectory was further predicted by a high subjective health and net worth.
Discussion
In the face of the expected pronounced increase of people reaching older ages, this study’s aim was to identify unfavorable and favorable aging trajectories in the context of two common stressors of later life (a serious fall that needs medical treatment and loss of the spouse) within elderly Mexicans. Also, this study investigated individual as well as socio-ecological resources that might predict these trajectories relatively shortly before the actual events happened. Using data from the MHAS and a SERM, a longitudinal analysis spanning a period of 11 years (2001, 2003, and 2012) was conducted. Psychological (depression) and functional (daily disability) trajectory indicators were separately examined for each stressor to investigate if the stressors affect an individual differently in these indicators over time.
The trajectories that were found for both stressors and trajectory indicators were a stable low depression and daily disability (resistance), a worsening, and an improvement over time. The group that had a serious fall between 2001 and 2003 showed a fourth trajectory in both indicators: chronic high symptoms of depression and daily disability. Further, cognition, net worth, and subjective health were predictive of most trajectories while also trajectory and stressor-specific predictors were found. Finally, the study showed that individuals who tend to show resistance in depression also tend to show resistance in daily disability over time and vice versa, while the other individuals rather showed different trajectories such as a worsening depression and stable daily disability.
Trajectories
Overall, the four identified trajectories in this study are comparable to previously identified trajectories in longitudinal studies of resilience (Bonanno & Diminich, 2013; Bonanno et al., 2012; Hobfoll et al., 2009; Norris et al., 2009). The stable low trajectory is related to minimal impact resilience or resistance (Bonanno, 2004). However, while both stable low trajectories for depression show a return to baseline at the third assessment, daily disability shows a somewhat small increase over time. This might be due to the common decreases in physiological functionality with increasing age (Payette et al., 2011). This trajectory was most common in three out of four models, which gives further evidence that resilience is rather the norm than the exception (Bonanno & Diminich, 2013; Masten, 2014). This trajectory would describe individuals who were healthy agers at baseline.
The worsening trajectory is characterized by a steady increase in symptoms over time. Hence, it might represent vulnerable individuals who are likely to experience pathological aging in response to stress. This was the most common trajectory in the loss sample in the case of depression which contrasts results of previous studies in other cultural contexts (Bonanno et al., 2004; Sasson & Umberson, 2014), pointing to potential culture-specific effects of stressors. Thus, even though the loss of the spouse is considered as one of the most stressful life events overall (Holmes & Rahe, 1967), cultural values such as collectivism might further increase its negative effects on mental health. Familismo, the reliance on family to overcome adversity, and other cultural factors characteristic of Mexican individuals probably contribute to the findings (Villalobos & Bridges, 2016). Future studies including more detailed information on cultural factors in Mexico and comparing individualistic and collectivistic countries are needed to test this assumption.
The improvement trajectory starts off with a rather high symptomatology at baseline and improves to a comparable status to the stable low trajectory at the last wave. Past research has termed this trajectory recovery which would indicate that someone is strongly negatively affected by a stressor in the short term and able to return to baseline in the long term (Bonanno, 2004; Bonanno & Diminich, 2013). However, the actual course of this trajectory might be better explained in light of recent research on the potential positive effects of stress such as stealing or posttraumatic growth (Höltge et al., 2018). This research shows that individuals who experience a significant stressor can be better off afterward. This could also be the case for individuals whose pre-event characteristics might be the cause for the event, such that a high daily disability that might indicate a poor physical condition has led to a serious fall. Therefore, this trajectory might show the potential of stressful experiences to lead to a better aging status.
The chronic high trajectory was characterized by a stable high symptomatology over time (Bonanno & Diminich, 2013; Norris et al., 2009). In the case of this study, it also showed an increase over time. This trajectory was not identified in the loss group which might be due to its sample size. However, this result could indicate that either a person might be prepared to lose the spouse and has the appropriate resources to adapt to it or this stressor leads to inevitable changes in multiple domains. Thus, persons who might already show a disadvantageous aging status at baseline change for better or worse over time in response to significant loss.
The analysis also found that the participants seemed to show more favorable aging trajectories (i.e., stable low and improvement) for the functional outcome than the psychological outcome in both samples. This indicates that resilience is more likely to occur in accomplishing activities of daily living than in mental health. This is a significant addition to the few studies that have shown that resilience might be more likely to appear in functional, external outcomes than internal, biological, or psychological outcomes (Brody et al., 2013).
It was a further aim of this study to explore if individuals show the same or different trajectories for depression and daily disability. Most of the previous research on the relationship between depression and daily disability in higher age has focused on linear relationships without considering the existence of distinct trajectories first and then looking if an individual shows the same trajectory in both outcomes. Those studies have often found that they are highly and positively associated with each other (Bruce et al., 1994; Russo et al., 2007). However, this study found almost all possible trajectory combinations for both stressful experiences such as an improving depression and worsening disability, and combinations of different trajectories tended to be more likely than similar trajectories. Only individuals who showed a stable low trajectory of their depression also seemed to show the same pattern in their disability and vice versa. Therefore, being resilient in one domain seems to make it more likely to also be resilient in another domain. Further studies using biopsychosocial indicators of aging are needed to replicate and expand these findings. This also points to the existence of resources that might be protective across different stressors and well-being indicators.
Predictors of Trajectory Occurrence
Several resilient resources were assessed at the first wave to predict which aging trajectory would occur in the context of the selected stressors. Overall, the results show the complexity of resilience. Some global resilient resources were identified that were predictive in most contexts, while many context-specific predictors and patterns emerged. An individual’s cognition, net worth, and subjective health at the first wave seemed to be rather global predictors of which aging trajectory would occur. Stable low and improvement trajectories were characterized by a high cognition and net worth, while chronic high and worsening trajectories showed lower scores across most contexts. Only the improvement trajectory was predicted by the least cognition and net worth in the case of daily disability in the loss sample. Subjective health showed a similar pattern to cognition and net worth in the context of daily disability in the fall sample so that the favorable trajectories showed high and the unfavorable trajectories low subjective health. However, the improvement trajectory was similar to an unfavorable trajectory in the other contexts. Also, family network, locus of control, religiousness, availability of health service, and having good friends did not provide predictive power in any context. Altogether, these results show evidence for the existence of global as well as context-specific resilient resources (Ungar, 2011), as well as the necessity to take a multisystemic perspective on resilient processes (Masten, 2014; Ungar, 2018).
Implications
The study shows that daily functionality and depression can follow different trajectories in the context of significant stress in later life. Thereby, it supports a shift from the common rather deficit-focused perspective on higher age to a life period with opportunities and even a time for further improvement in the face of significant stress.
The finding that significant stress in higher age could lead to an improved status in the long term than before the event provides additional opportunities for how older individuals can deal with their stressful experiences and how they should be supported in this process. Traditionally, health care has a deficit-oriented approach to the impact of stressful experiences by trying to limit the negative consequences as far as possible (Zoellner & Maercker, 2006). However, increasing research shows that by adding a salutogenetic perspective, people can find new strength or meaning, or might have a more supportive social network than before the event which can make them more resilient to subsequent stressors (Höltge et al., 2018).
While it is important to show that later life can follow different trajectories in the face of stress, it is of equal importance to find factors that increase the possibility for the more favorable trajectories before the actual events occur in order to design meaningful preventative measures. While the study found several context-specific associations, it also found cognition, net worth, and subjective health as being the resources with the most predictive power for most trajectories. Hence, public health measures should be installed that support cognitive abilities and lead to a beneficial evaluation of one’s subjective health, as well as providing sufficient financial resources for everyday life in higher age.
Finally, the knowledge that losing the partner or having a serious physical accident must not lead to detrimental long-term outcomes and that being resilient in one domain is likely associated with being resilient in other domains might help individuals to face such stressful experiences with more confidence. However, the study also showed that individuals, policy makers, and healthcare professional alike must be attentive to the differing impacts such experiences can have on a person’s life. The results imply that comprehensive screening procedures should be conducted to identify vulnerable and resilient life domains to apply context-appropriate interventions when somebody will be or was already confronted with a significant stressor. Further, the finding that mental health might generally be more prone to long-term negative effects than physical functionality irrespective of the experienced stressor could affect how limited societal resources should be distributed for health care in higher age.
Limitations
Even though it was an advantage of this study to investigate the effect of two stressors, the sample sizes differed significantly between the groups. Also, the low sample size of the loss sample might have led to the contrasting results in the sensitivity analysis of depression and the missing chronic high trajectory which is an expected trajectory in the context of resilience and aging. Nevertheless, past studies with a similar analytical approach and sample size have also not found such a trajectory (Bonanno et al., 2012). Thus, future longitudinal research with higher and equal sample sizes for different stressor samples at all waves is warranted to replicate the findings. Also, it was a rather unexpected finding that the indicators for social support showed a rather weak predictive power since social support is known as a key resilient resource in stressful situations (Ifurna & Luthar, 2017; Netuveli et al., 2008). Thus, future research is asked to use more sensitive measures for social support to provide further evidence of these findings. Finally, the socio-ecological model of resilience places a high importance on the influence of culture on an individual’s resilience (Ungar, 2011). Even though this study was the first of its kind to study resilience in elderly Mexicans, future research is asked to design a similar study which incorporates different cultures for direct comparisons.
Conclusion
The present study was able to show favorable and unfavorable aging trajectories in the context of two common stressors of later life (serious fall and spousal loss) in elderly Mexicans. In most cases, individuals simultaneously showed a stable low trajectory of depression and daily disability, but most widows showed a worsening of their depressive symptoms over time which might point to culture-specific effects. Besides this higher likelihood of co-occurring stable low trajectories, individuals rather showed different trajectories between these indicators which points to domain-specific effects of stressful experiences. Also, the study shows that a potential pathway to a better aging status might exist in the experience of such stressors for some individuals. Overall, favorable trajectories were more likely for functionality than for mental health. The study further extends previous research on resilience in older age by showing that cognition, net worth, and subjective health might be global resources for different stressful contexts and could predict the occurrence of the trajectories before the stressful event happened. Nevertheless, the study points to the necessity to account for context-specific resources in stressful circumstances.
Supplemental Material
Table_S1 – Supplemental Material for A Longitudinal Study on Multidimensional Resilience to Physical and Psychosocial Stress in Elderly Mexicans
Supplemental Material, Table_S1 for A Longitudinal Study on Multidimensional Resilience to Physical and Psychosocial Stress in Elderly Mexicans by Jan Höltge, Rafael Samper-Ternent, Carmen García-Peña and Luis Miguel Gutiérrez-Robledo in Journal of Aging and Health
Supplemental Material
Table_S2 – Supplemental Material for A Longitudinal Study on Multidimensional Resilience to Physical and Psychosocial Stress in Elderly Mexicans
Supplemental Material, Table_S2 for A Longitudinal Study on Multidimensional Resilience to Physical and Psychosocial Stress in Elderly Mexicans by Jan Höltge, Rafael Samper-Ternent, Carmen García-Peña and Luis Miguel Gutiérrez-Robledo in Journal of Aging and Health
Supplemental Material
Table_S3 – Supplemental Material for A Longitudinal Study on Multidimensional Resilience to Physical and Psychosocial Stress in Elderly Mexicans
Supplemental Material, Table_S3 for A Longitudinal Study on Multidimensional Resilience to Physical and Psychosocial Stress in Elderly Mexicans by Jan Höltge, Rafael Samper-Ternent, Carmen García-Peña and Luis Miguel Gutiérrez-Robledo in Journal of Aging and Health
Supplemental Material
Table_S4 – Supplemental Material for A Longitudinal Study on Multidimensional Resilience to Physical and Psychosocial Stress in Elderly Mexicans
Supplemental Material, Table_S4 for A Longitudinal Study on Multidimensional Resilience to Physical and Psychosocial Stress in Elderly Mexicans by Jan Höltge, Rafael Samper-Ternent, Carmen García-Peña and Luis Miguel Gutiérrez-Robledo in Journal of Aging and Health
Supplemental Material
Table_S5 – Supplemental Material for A Longitudinal Study on Multidimensional Resilience to Physical and Psychosocial Stress in Elderly Mexicans
Supplemental Material, Table_S5 for A Longitudinal Study on Multidimensional Resilience to Physical and Psychosocial Stress in Elderly Mexicans by Jan Höltge, Rafael Samper-Ternent, Carmen García-Peña and Luis Miguel Gutiérrez-Robledo in Journal of Aging and Health
Supplemental Material
Table_S6 – Supplemental Material for A Longitudinal Study on Multidimensional Resilience to Physical and Psychosocial Stress in Elderly Mexicans
Supplemental Material, Table_S6 for A Longitudinal Study on Multidimensional Resilience to Physical and Psychosocial Stress in Elderly Mexicans by Jan Höltge, Rafael Samper-Ternent, Carmen García-Peña and Luis Miguel Gutiérrez-Robledo in Journal of Aging and Health
Supplemental Material
Table_S7 – Supplemental Material for A Longitudinal Study on Multidimensional Resilience to Physical and Psychosocial Stress in Elderly Mexicans
Supplemental Material, Table_S7 for A Longitudinal Study on Multidimensional Resilience to Physical and Psychosocial Stress in Elderly Mexicans by Jan Höltge, Rafael Samper-Ternent, Carmen García-Peña and Luis Miguel Gutiérrez-Robledo in Journal of Aging and Health
Footnotes
Declaration of Conflicting Interests
The author(s) declared no potential conflicts of interest with respect to the research, authorship, and/or publication of this article.
Funding
The author(s) disclosed receipt of the following financial support for the research, authorship, and/or publication of this article: JH's position was funded by the Swiss National Science Foundation (P2ZHP1_184004).

Supplemental Material
Supplemental material for this article is available online.
Appendix A. Correlation Table
Note. * = p < .05. DD = daily disability, Depr = depression, BE = both events, Edu = education, RS = relationship status, WS = work status, FN = family network, FiN = friends in neighborhood, ReSu = received support, GiSu = giving support, HS = health service, subjective health, LoC = locus of control, Rel = religion, Cog = cognition.
DD 2003
DD 2012
Depr 2001
Depr 2003
Depr 2012
BE
Sex
Age
Edu
RS
WS
FN
FiN
ReSu
GiSu
HS
SH
LoC
Rel
Cog
Net worth
DD 2001
.38*
.29*
.35*
.23*
.24*
.04
.09*
.24*
−.11*
−.06*
−.23*
−.06*
.16*
.11*
−.04
−.01
−.37*
−.04
−.08*
−.26*
−.07*
DD 2003
.31*
.21*
.35*
.24*
.05*
.11*
.27*
−.11*
−.04*
−.24*
−.06*
−.04
.04
−.12*
.03
−.25*
−.04
−.03
−.28*
−.06*
DD 2012
.18*
.19*
.41*
.01
.11*
.20*
−.07*
−.05
−.13*
.01
−.02
.06*
−.01
−.01
−.20*
−.01
−.06*
−.16*
−.06*
Depr 2001
.34*
.32*
.06*
.18*
.06*
−.15*
−.12*
−.15*
.04
.01
.10*
−.03
−.02
−.42*
−.08*
−.10*
−.16*
−.11*
Depr 2003
.37*
.11*
.13*
.07*
−.11*
−.10*
−.13*
.07*
−.02
.06*
−.07*
−.08*
−.31*
−.09*
−.06*
−.16*
−.11*
Depr 2012
.08*
.14*
.06*
−.14*
−.05
−.09*
.03
−.05
.04
−.03
−.07*
−.26*
−.12*
−.10*
−.18*
−.14*
BE
.02
.09*
.00
−.01
−.09*
−.03
.00
.04
−.03
.03
−.02
−.07*
−.06*
−.07*
.00
Sex
−.03
−.05*
−.23*
−.33*
−.01
−.02
.08*
.00
.07*
−.13*
−.01
−.23*
.00
.03
Age
−.22*
−.24*
−.34*
−.24*
−.13*
.05*
−.32*
−.04
−.13*
−.03
−.02
−.44*
−.06*
Edu
.05*
.08*
.02
.04
.00
.18*
.17*
.13*
.07*
.03
.39*
.12*
RS
.12*
.19*
.11*
−.03
.13*
−.02
.07*
−.02
.05*
.15*
.10*
WS
.08*
.07*
−.12*
.09*
−.11*
.20*
.08*
.09*
.28*
.02
FN
.01
.15*
.15*
.01
−.03
−.04
−.04
.07*
.02
FiN
.08*
.09*
.02
−.01
−.03
.01
.04
.00
ReSu
.19*
.05*
−.10*
−.04
−.08*
−.03
.04
GiSu
.12*
.07*
.02
−.05
.28*
.11*
HS
.06*
.00
−.01
.19*
.05*
SH
.08*
.07*
.22*
.10*
LoC
.00
.12*
.07*
Rel
.01
.03
Cog
.17*
References
Supplementary Material
Please find the following supplemental material available below.
For Open Access articles published under a Creative Commons License, all supplemental material carries the same license as the article it is associated with.
For non-Open Access articles published, all supplemental material carries a non-exclusive license, and permission requests for re-use of supplemental material or any part of supplemental material shall be sent directly to the copyright owner as specified in the copyright notice associated with the article.
