



Abstract
Increased life expectancy and a rapidly growing aging population have the potential to place significant stress on both aging services organizations and healthcare systems. Although most individuals prefer to live independently in their homes, they may need regular evaluation and outside support to age in place safely. Aging in place enables older people to maintain independence, autonomy, and connection to social support and helps to avoid or prolong the need for high-cost institutional care (Wiles et al., 2012). Efforts to age in place have been hindered by older adults’ experiences with unmet or under-identified needs, specifically, inadequate informal assistance from family/friend caregivers (Davey et al., 2013; Kaye et al., 2010) or formal services provided by community health agencies (Casado et al., 2011; Pass et al., 2019). Individuals with advanced age, high level of disability, multiple difficulties with basic and instrumental activities of daily living (ADLs), cognitive impairment, and low socioeconomic status are more likely to experience unmet needs in their daily routine (Davey et al., 2013).
Compared to other industrialized counties, the United States (U.S.) spends a higher percentage of gross domestic product on care for older adults (Anderson & Hussey, 2000; Sawyer & Cox, 2018). A recent report from the Organization for Economic Cooperation and Development (OECD) revealed that the United States spends more on health care than any other country, spending nearly twice as much as the average OECD country (i.e., comprised 36 high-income member countries; Tikkanen & Abrams, 2020). Nonetheless, Americans experience worse health outcomes and lower life expectancy at birth than the OECD average. Compared to peer nations, the United States had the highest chronic disease burden and fewer physicians per capita (Tikkanen & Abrams, 2020). While some preventive measures (e.g., breast cancer screening and flu vaccination) in the United States outperform peer nations, preventable hospitalizations and avoidable deaths are highest in the United States.
In the United States, long-term services and supports (LTSS) are available through a patchwork system that assist individuals with functional limitations and chronic illnesses to perform daily ADLs and are attributed to individuals’ ability to live independently. Typically, this system includes support from family and friends and use of private resources to spend down for Medicaid eligibility. With the increasing out-of-pocket cost for LTSS (American Medical Association, 2018) and Medicaid being the primary LTSS payer for individuals who meet functional limitation and financial criteria (Reaves & Musumeci, 2015), there is a gap in supportive assistance services for individuals who require some level of assistance but are not yet Medicaid eligible. That is, the cost burden associated with LTSS leaves the oldest and sickest least likely to have sufficient income to afford LTSS (Johnson & Wang, 2019). Individuals who perceive a need for assistance but do not meet functional and financial eligibility criteria tend to be overlooked.
Nonmedical factors or social determinants of health (SDoH) like individuals’ behaviors, supports, and environment encountered outside the healthcare setting are directly and substantially related to community health outcomes (Hood et al., 2016). Thus, nonclinical community-based agencies that support individuals’ efforts to age in place also provide a unique contribution to the LTSS system. These agencies can accelerate health improvement through a range of strategies, such as increasing access to healthy foods, social interaction, adequate education, and affordable quality housing (Thornton et al., 2016). These efforts contribute to individuals’ health and well-being.
LTSS in Nonurban Settings
There are additional challenges with receiving adequate LTSS among underserved or hard-to-reach populations, including individuals living in rural and/or remote areas. Individuals residing in rural areas are disproportionately older, poorer, and less healthy (Hash et al., 2015) than individuals living in urban areas. Rural-dwelling individuals are also typically characterized as being independent, maintaining close relationships with family and friends (Cohen, 2013), and, thus, often hesitant to ask for or accept help from others (Carson & Mattingly, 2018). In rural regions of the United States, issues with accessing LTSS, continuity of care, and efficiency of healthcare delivery (Menec et al., 2015) can also exacerbate health disparities. Rural-dwelling individuals had a greater risk of chronic disease and disability (Coburn et al., 2016), were less likely to receive services and had increased risk of mortality (Hoffman & Holmes, 2017; Weaver & Roberto, 2019) than urban-dwelling individuals.
While there is no standard definition for what constitutes “rural,” government agencies have moved beyond the basic binary classification. For example, counties are designated as metropolitan (urban), micropolitan (rural), or neither (rural) by the Office of Management and Budget (Myers et al., 2016). However, the National Center for Health Statistics (NCHS) classifies counties using a 6-point urban–rural continuum indicating the most urban (large central metropolitan, large fringe metropolitan, medium metropolitan, and small metropolitan) to the most rural (micropolitan and noncore; Ingram & Franco, 2014). Going beyond the binary classification reveals nuances within the “rural” or “urban” categorization, which in turn can inform community-based strategies to meet the needs of older residents. This is particularly important because a disproportionate share of the aging population growth is occurring in nonurban areas (Lang, 2013). To meet the SDoH needs among underserved populations, including low-income older adults in nonurban areas, it is imperative to examine how the community and social environment influences individuals’ actual and perceived health.
Study Purpose
To identify health needs and service delivery gaps among a geographically expansive and economically diverse 8-county region across Eastern Washington and North Central Idaho, a needs assessment was conducted to assist community-based agencies working to support aging residents living in rural-leaning counties according to the NCHS guidelines (i.e., small metropolitan, micropolitan, and noncore). The community survey was adapted from a previously implemented, federally funded standardized survey (see Bittinger, 2015). Using cross-sectional survey data, the purpose of this study was to answer the following research questions (RQs): RQ1: How do older adults’ functional health needs, social needs, and health service use differ by county classification (i.e., small metropolitan, micropolitan, and noncore)? RQ2: Are there distinguishable groups of older adults based on enabling and need-based characteristics? RQ3: How do groups differ by sociodeomographic variables? RQ4: How do groups differ on functional health needs, social needs, and health service use?
Methods
Data for this study are based on a community survey designed to evaluate individual and household characteristics and needs related to employment, transportation, financial circumstances, healthcare access, health conditions, food security, and housing stability. Selected households were drawn randomly from USPS records based on a sample frame of 8419 across this 8-county region, including hard to reach populations, which enhances the generalizability and representativeness of conclusions regarding collective needs. Both online and printed survey options were provided, and after a maximum of four contact attempts, 2487 households completed the survey, yielding a response rate of 32% (providing a calculated sample error of ±1%, indicating high reliability of population estimates (see Burley, 2019 for more information). One adult in each household was asked directly about income, employment, community engagement, health conditions, and other needs. On average, respondents were 59 years old (SD = 17; range 18–98) and the majority identified as white/Caucasian (n = 2237, 91.3%). More than half were female (57.4%) and nearly one in five respondents reported a household income less than 25,000 (n = 426; 18.2%), demonstrating financial need.
Sample
The study sample for the present analysis consisted of 1280 adults aged 60 years and older (51% of the overall random sample). We focused on respondents with a minimum age of 60 years because this is the typical minimum age of eligibility for home- and community-based services through the Older Americans Act (Administration on Aging, 2017).
Variables
Variables selected for this analysis were based on the literature related to aging in place and the healthcare utilization framework first proposed by Andersen (1995). The framework posits that predisposing characteristics (e.g., demographic characteristics, social structures, and health beliefs), enabling resources (e.g., personal/family and community), and need-based factors (both perceived and evaluated) influence health behavior and use of health services, which ultimately influence health outcomes (Andersen, 1995). Predisposing characteristics included sex (binary) and age (continuous). Enabling resources included income, education level, rurality, and living situation (continuous). Income was measured at five levels, from less than 25,000 to more than 100,000. Education level was measured by six categories including no response, less than high school, high school graduation/GRE, vocational/technical school, two-year degree, and four-year degree or more. We used NCHS county classification to reflect increasingly rural areas of residence (small metropolitan = 1, micropolitan = 2, and noncore = 3). Respondents indicated the number of persons in the household at specific ages, which we computed into a living situation variable, excluding respondent; this variable served as a proxy for potential caregiver. Respondents reported information at the individual-level, except for household-level income.
We included several functional health and social need-based factors in our analyses. Functional health needs included number of chronic conditions and number ADL limitations. Without the inclusion of a validated scale in the community needs assessment survey, we created a socioemotional engagement index as an indicator of social need. This was computed based on responses to individual-level frequency (never = 0, daily = 1, weekly = 2, monthly = 3, a few times a year = 4, and annually = 5) of engaging in nine specific socioemotional activities (range 0–45). The specific activities were going to a movie, sporting event, concert, or museum; volunteering for a community organization; participating in community events; attending religious services; following what local government is doing (through newspapers, TV, etc.); going to a library; going to a place to exercise; visiting public parks and trails; and taking time off other than scheduled days off. Higher scores indicated greater levels of socioemotional engagement.
Respondents also indicated household-level of need for SDoH services. We created a sum score to show the total number of reported SDoH needs (range 0–15). There was no validated scale included that captured SDoH needs, so we also created a SDoH needs index based on responses about the level of need (none = 0, slight = 1, moderate = 2, or strong = 3; range 0–45). Higher scores indicated greater need. The specific need categories included: mortgage/rental assistance, help with utility bills, legal help, getting enough food, affordable medical care, affordable dental care, mental health services/family counseling, drug/alcohol treatment and/or counseling, family violence advocacy/treatment/counseling, transportation, help finding a job/job training, access to library system, affordable housing, emergency housing, and caregiver support.
Respondents reported perceived quality of life in the community (QOL) and health service use at the individual or household level. Respondents were asked to rate overall QOL in their community, which was recoded to indicate poor/fair or excellent/good QOL. This single-item indicator has been included in various community needs assessments, including the Canada’s most extensive community-driven data project (Community Foundations of Canada, n.d.). As for health service use, respondents reported whether they experienced access issues with health care over the past 12 months, which we coded to indicate yes or no (binary). Specific aspects of healthcare access included being unable to get in to see a physician due to at least one reason (e.g., inability to pay for services, no transportation/too far, and no insurance), experiencing barrier(s) to see a primary care physician, having visited the emergency department (ED) for nonemergency care, or having experienced an unplanned hospitalization.
As secondary outcomes of interest (i.e., post hoc analyses), we examined specific SDoH-related social and health service needs (described above), as well as nutritional assistance received. Reported nutritional assistance included meals on wheels, senior center meals, SNAP benefits church meals, foodbank/pantry, or reliance on friends/family. We coded variables as a binary indicator of reported need/assistance.
Data Analysis
We conducted descriptive analyses to characterize the study sample. To understand differences by county classification (i.e., small metropolitan, micropolitan, and noncore) in functional health needs, social needs, and health service use, we conducted a series of one-way ANOVAs for continuous outcomes and chi-square analyses for categorical outcomes (RQ1).
Next, we conducted two-step cluster analysis, which is an exploratory tool to identify natural groupings with a dataset. The two-step cluster analysis procedure handles categorical and continuous variables and maximizes distance between clusters (heterogeneity) while rewarding parsimonious, simple groupings (Sarstedt & Mooi, 2019). The analysis yielded three clusters based on enabling (living situation), functional health need (ADLs), and social need (socioemotional engagement index) variables (RQ2). According to Andersen (1995) healthcare utilization framework, need is a predominant factor associated with health outcomes. We considered living situation as a proxy indicator for having a possible caregiver, thereby highlighting another potential context of need. Thus, the particular measures that inform cluster development were derived from minimally intrusive questions. Using minimally intrusive questions is critical, especially when working with individuals living in rural areas, as there are unique privacy and confidentiality concerns (Carson & Mattingly, 2018). Although using information about income would be preferable, individuals are more likely to provide invalid responses (e.g., “do not know” or “prefer not to answer”) to questions about income (Bee & Mitchell, 2017). We selected these need-based measures because residents are more likely to provide forthcoming information about their current situation. Furthermore, we intentionally included individual-level variables to inform risk profiles rather than environmental context (i.e., rural classification) in an effort to identify high risk or vulnerable populations in need of targeted intervention, regardless of geographic setting.
Based on group membership from cluster analysis, we conducted a series of one-way ANOVA for continuous outcomes and chi-square analyses for categorical outcomes to examine how groups differed by sociodemographic variables (RQ3) and level of functional health needs, social needs, and health service use (RQ4). We used IBM SPSS Statistics version 23 to conduct analyses. This study was determined as exempt by the institutional review board.
Results
Sample Characteristics
Descriptive Characteristics of Community Residents 60 Years and Older (N = 1280).
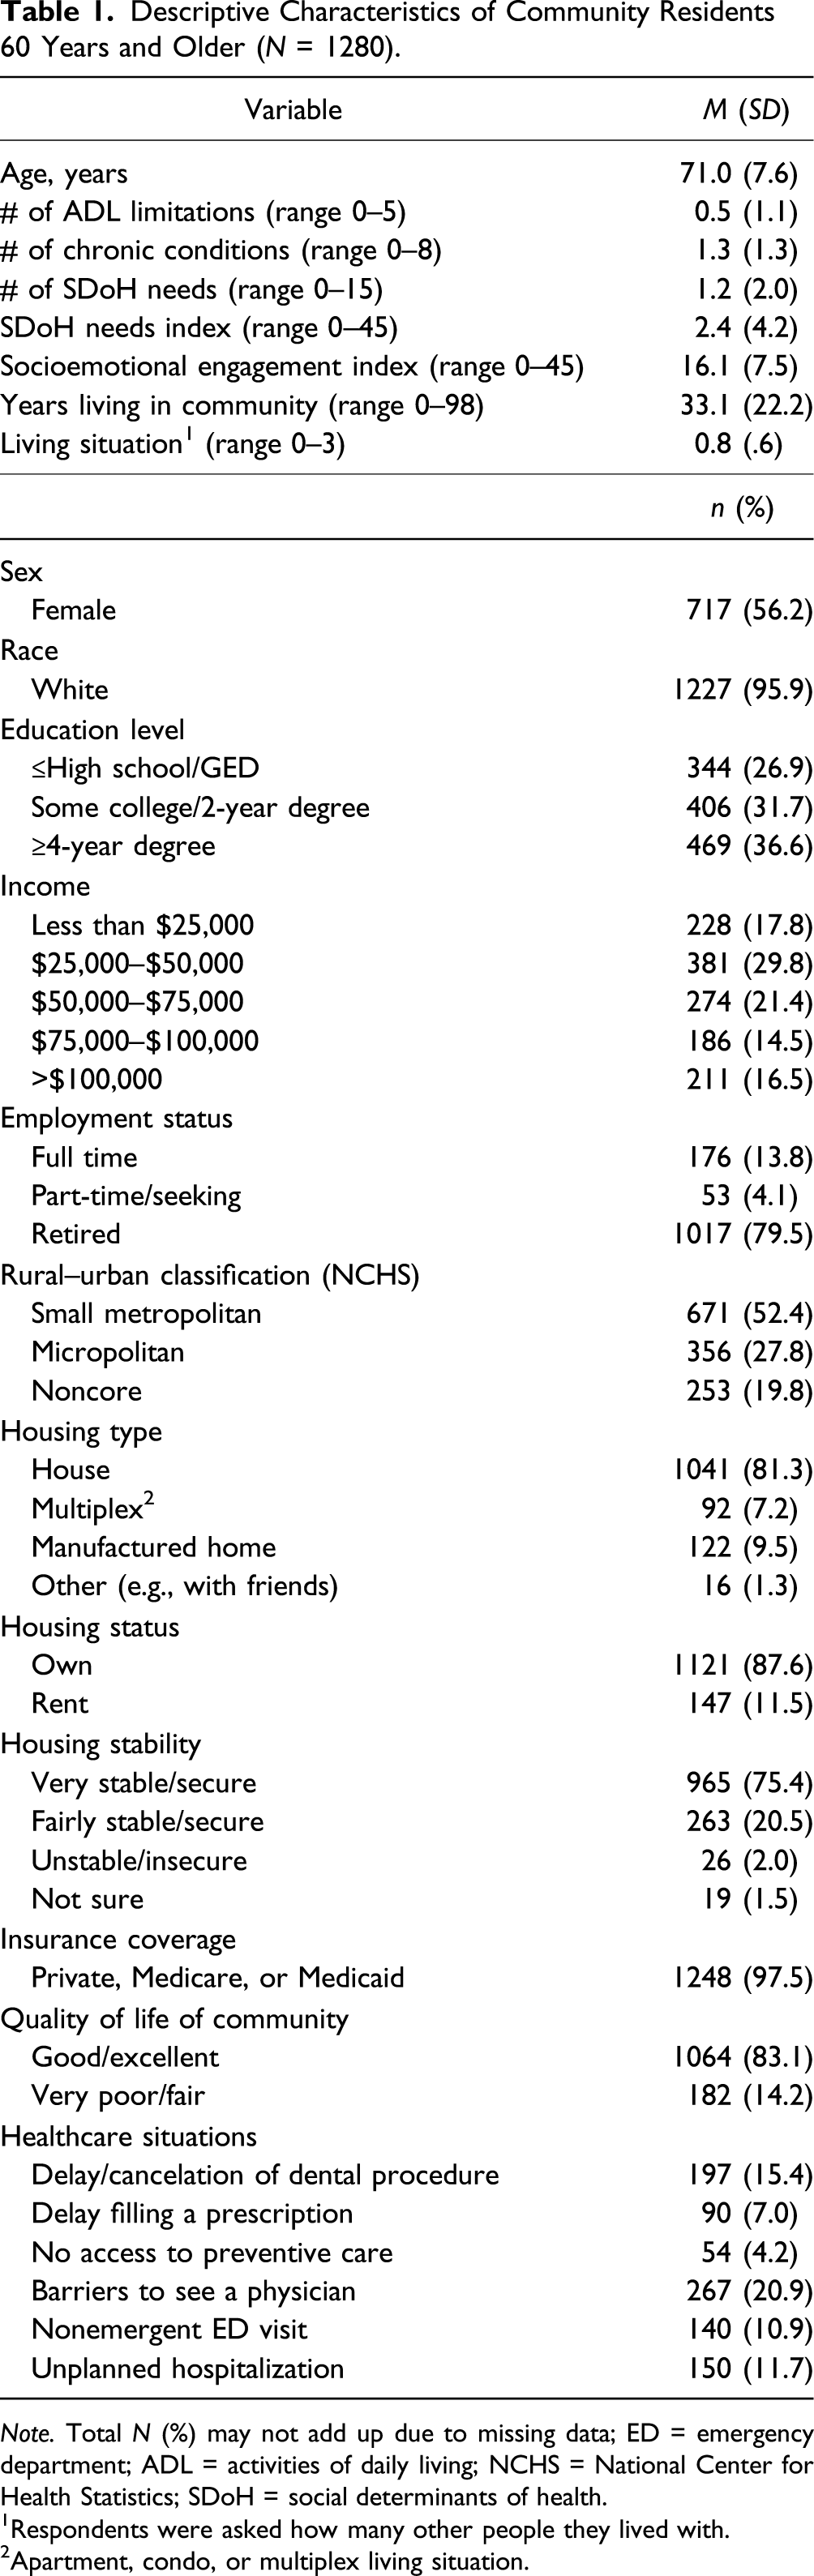
Note. Total N (%) may not add up due to missing data; ED = emergency department; ADL = activities of daily living; NCHS = National Center for Health Statistics; SDoH = social determinants of health.
Respondents were asked how many other people they lived with.
Apartment, condo, or multiplex living situation.
Although all respondents resided in rural-leaning counties, we conducted a series of analyses to identify differences by county classification (i.e., small metropolitan, micropolitan, and noncore) in functional health needs, social needs, and health service use to answer our first RQ. Individuals in small metropolitan counties were older than individuals in micropolitan or noncore counties (F = 6.043 and p = .002). There were differences in the level of education (X2 = 40.01 and p < .001), with individuals in noncore counties were more likely to indicate their highest level of education as high school/GED or less than individuals in micropolitan or small metropolitan counties. Similarly, there were differences by income (X2 = 45.63, p < .001) indicating that individuals in noncore counties were more likely to have an income of less than $25,000 (and less likely to report higher income brackets) than individuals in small metropolitan or micropolitan counties. As for the socioemotional engagement index, individuals in noncore counties had lower socioemotional engagement than individuals in small metropolitan and micropolitan counties (F = 7.61, p ≤ .002). Individuals in small metropolitan counties had more functional health conditions than individuals in micropolitan counties (F = 4.529, p = .011). Individuals in small metropolitan counties were more likely to access nonemergency ER care than individuals in micropolitan and noncore counties (X2 = 13.79, p = .001). However, individuals in noncore counties were more likely to indicate being unable to access preventative care than individuals in small metropolitan areas (X2 = 6.57, p = .037) (Full results are available upon request from the first author.)
Cluster Membership
Sociodemographic Characteristics that Distinguish Cluster Membership.
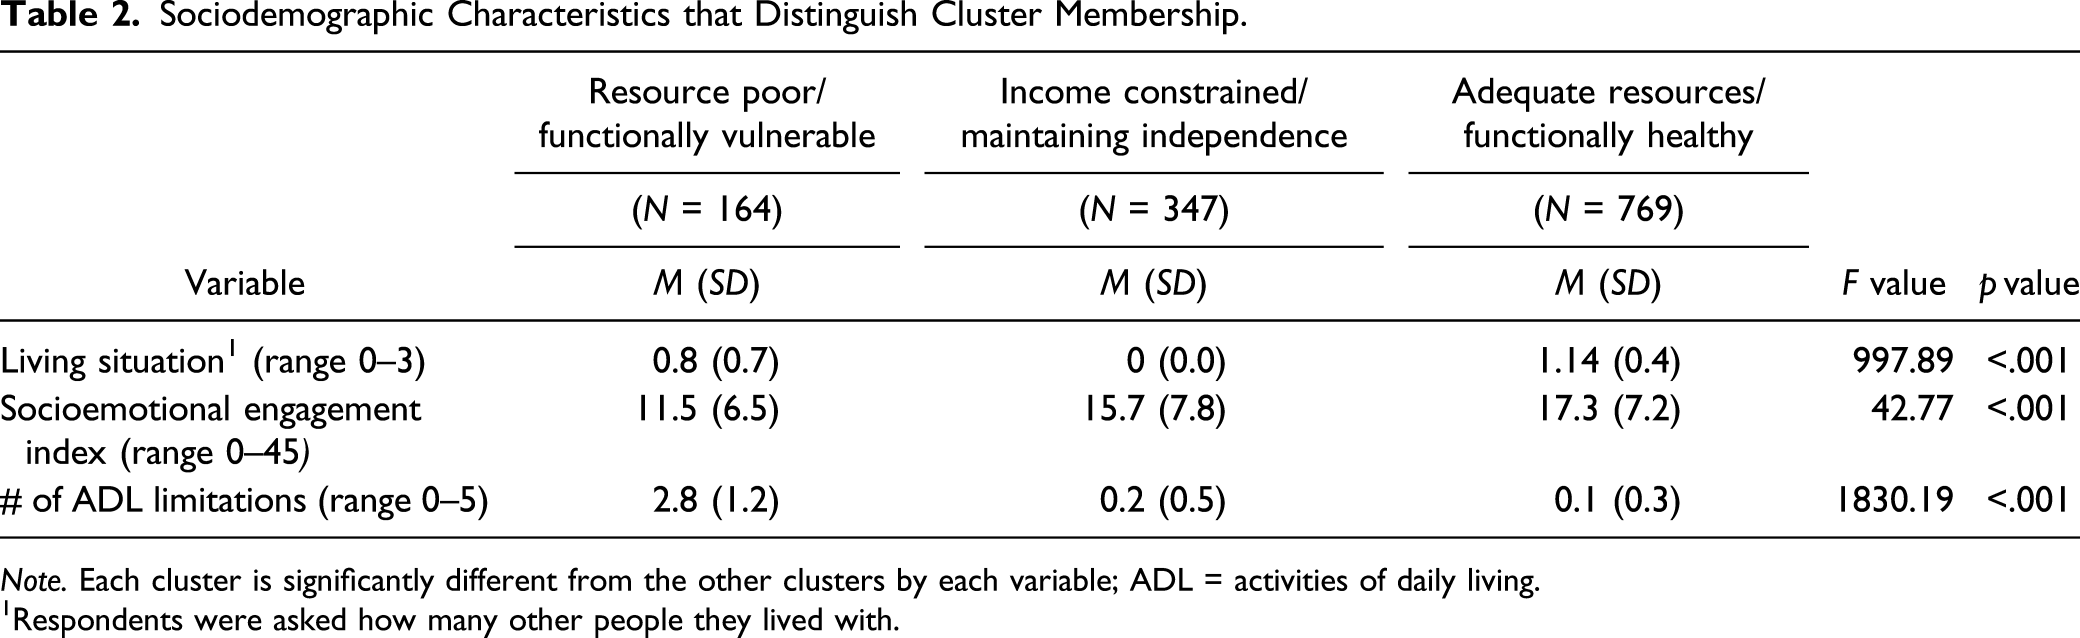
Note. Each cluster is significantly different from the other clusters by each variable; ADL = activities of daily living.
Respondents were asked how many other people they lived with.
Group members in Cluster 2 (27%) were income constrained/maintaining independence (i.e., moderate risk). They had few functional limitations, but were living entirely alone, with no potential caregiver and reported modest socioemotional engagement.
Group members in Cluster 3 (60%) were considered adequate resources/functionally healthy (i.e. low risk). This group had the fewest functional limitations, were typically living with others (i.e., a potential caregiver), and reported high socioemotional engagement.
Group Differences in Sociodemographic Variables.
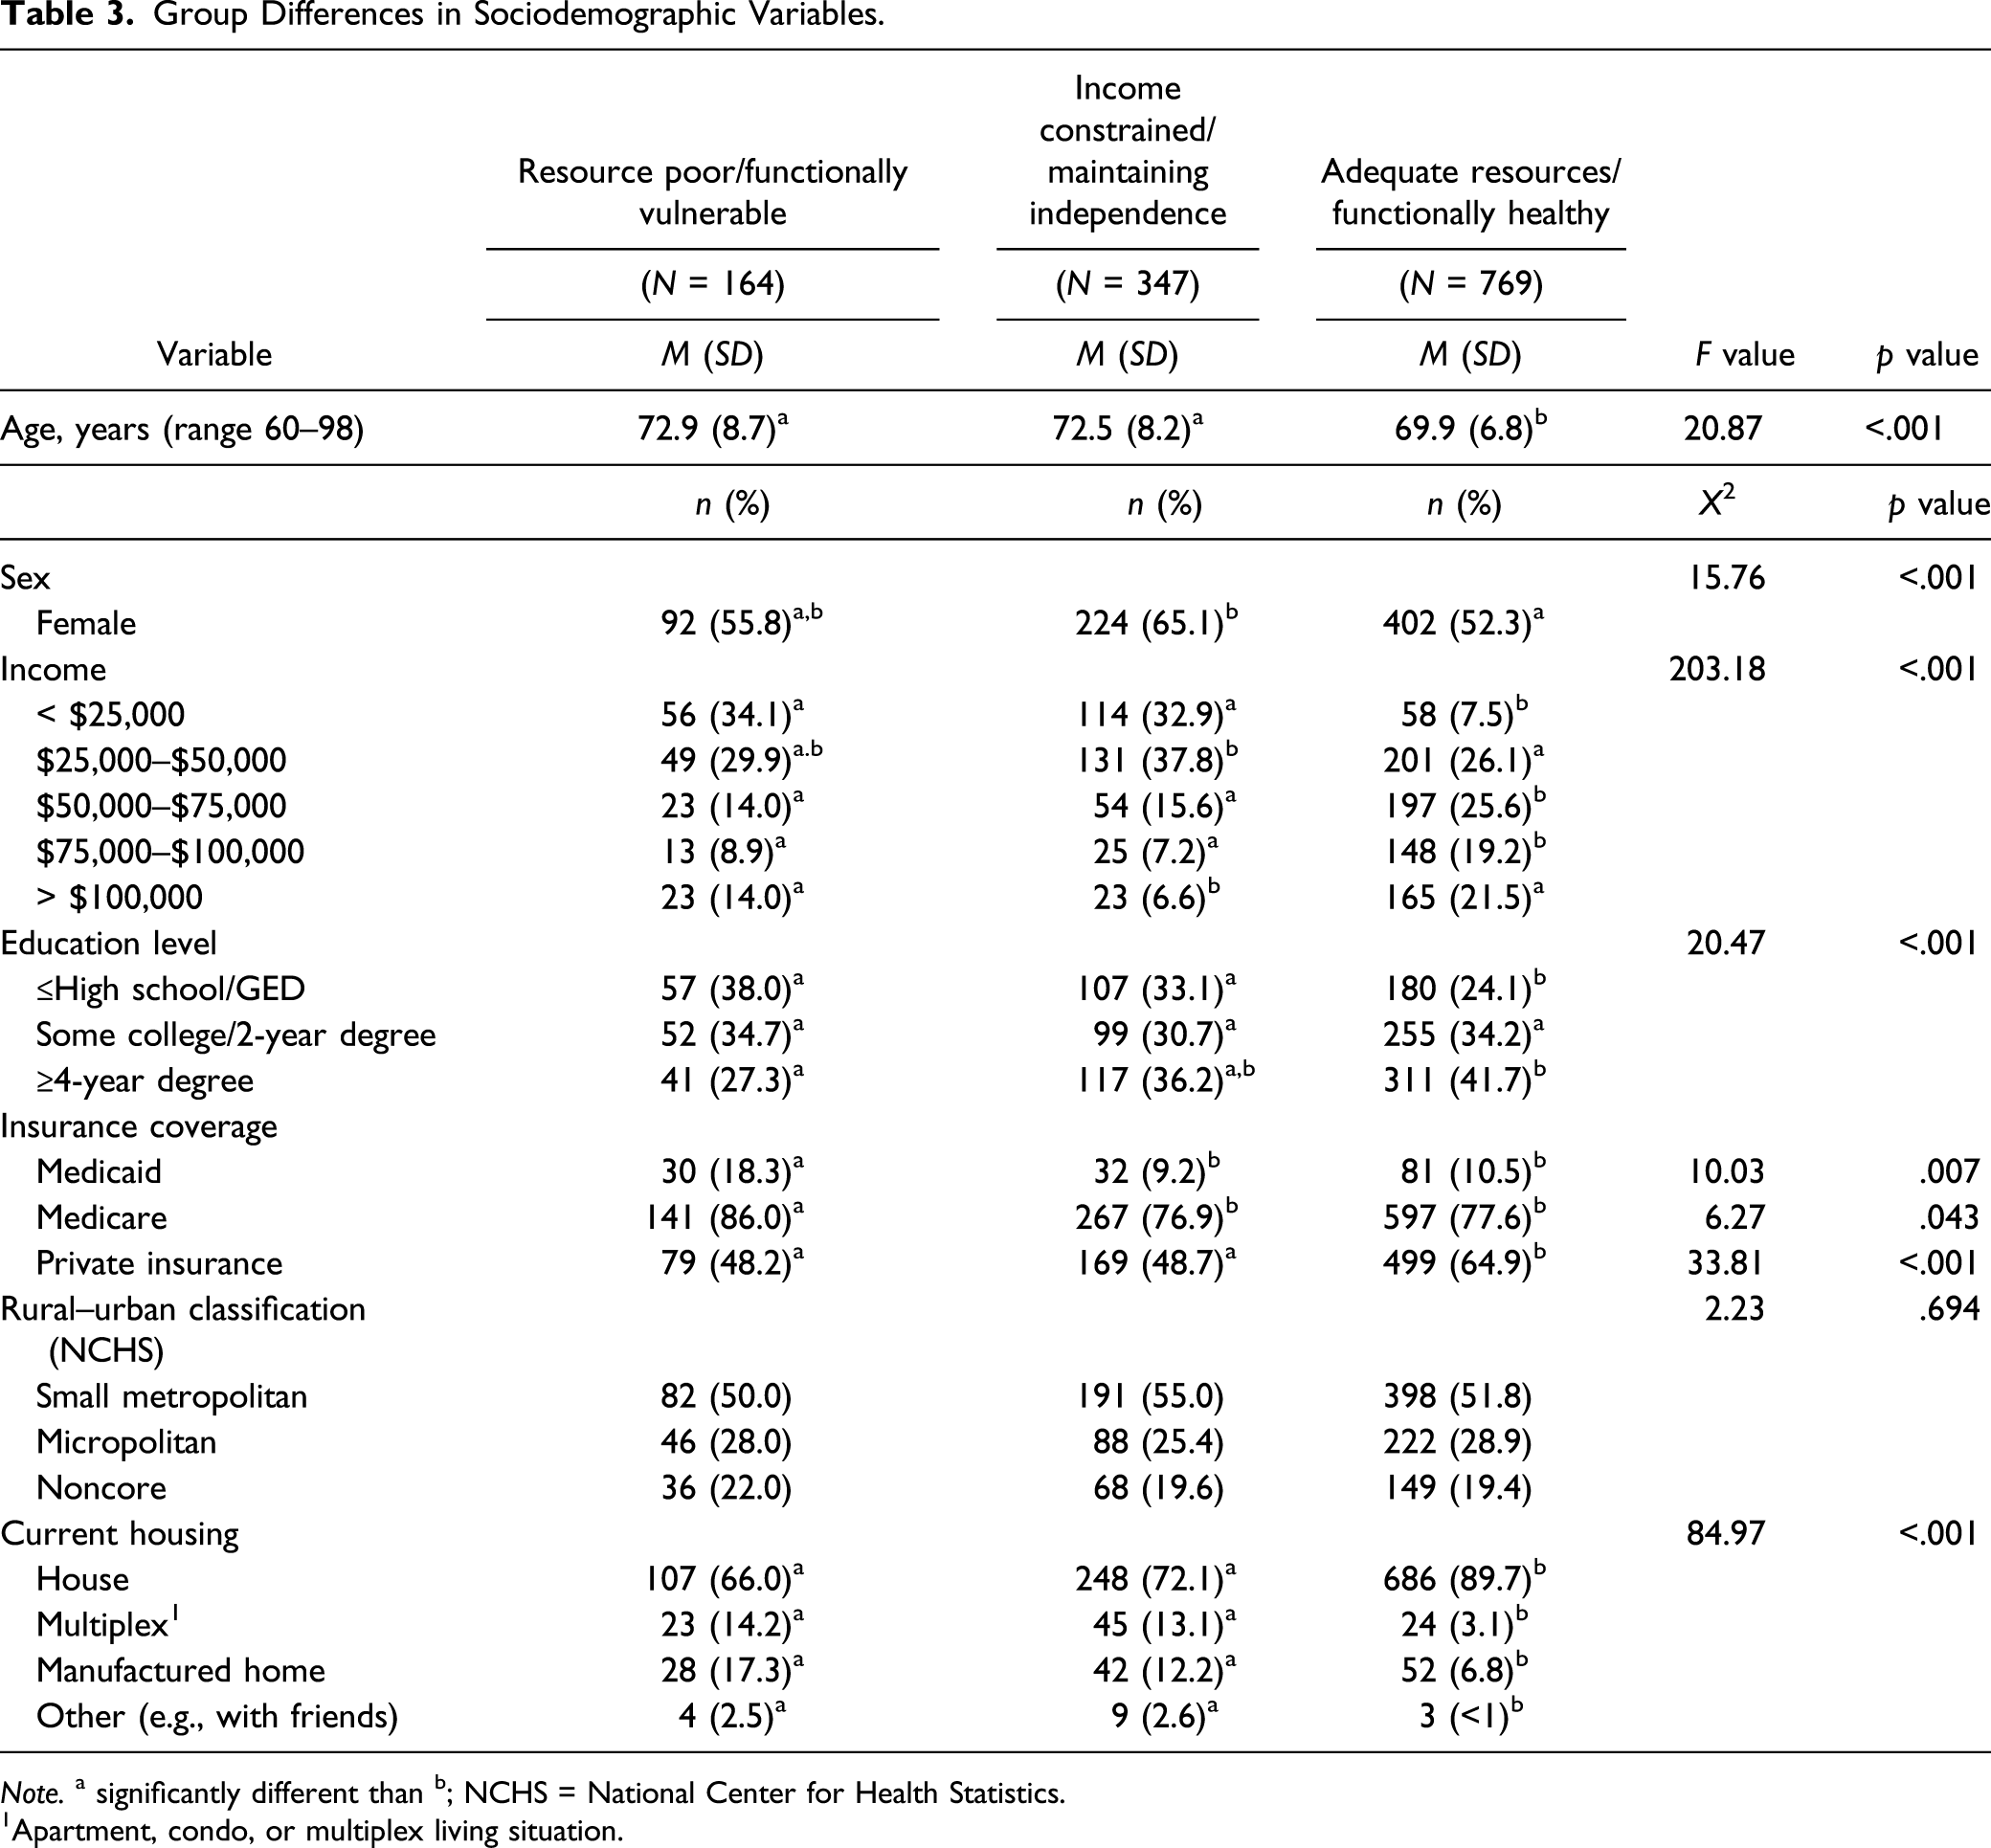
Note. a significantly different than b; NCHS = National Center for Health Statistics.
Apartment, condo, or multiplex living situation.
We examined how groups differ on their social needs, health, and health service use to answer our fourth RQ. We found that groups differed significantly on the number of chronic conditions, number of SDoH needs, and the SDoH needs index. The resource poor/functionally vulnerable group indicated the greatest number of health/social needs and number of chronic conditions and has the highest need index compared to the adequate resources/functionally healthy and income constrained/maintaining independence groups.
Group Differences in Functional Health Needs, Social Needs, and Health Service Use.
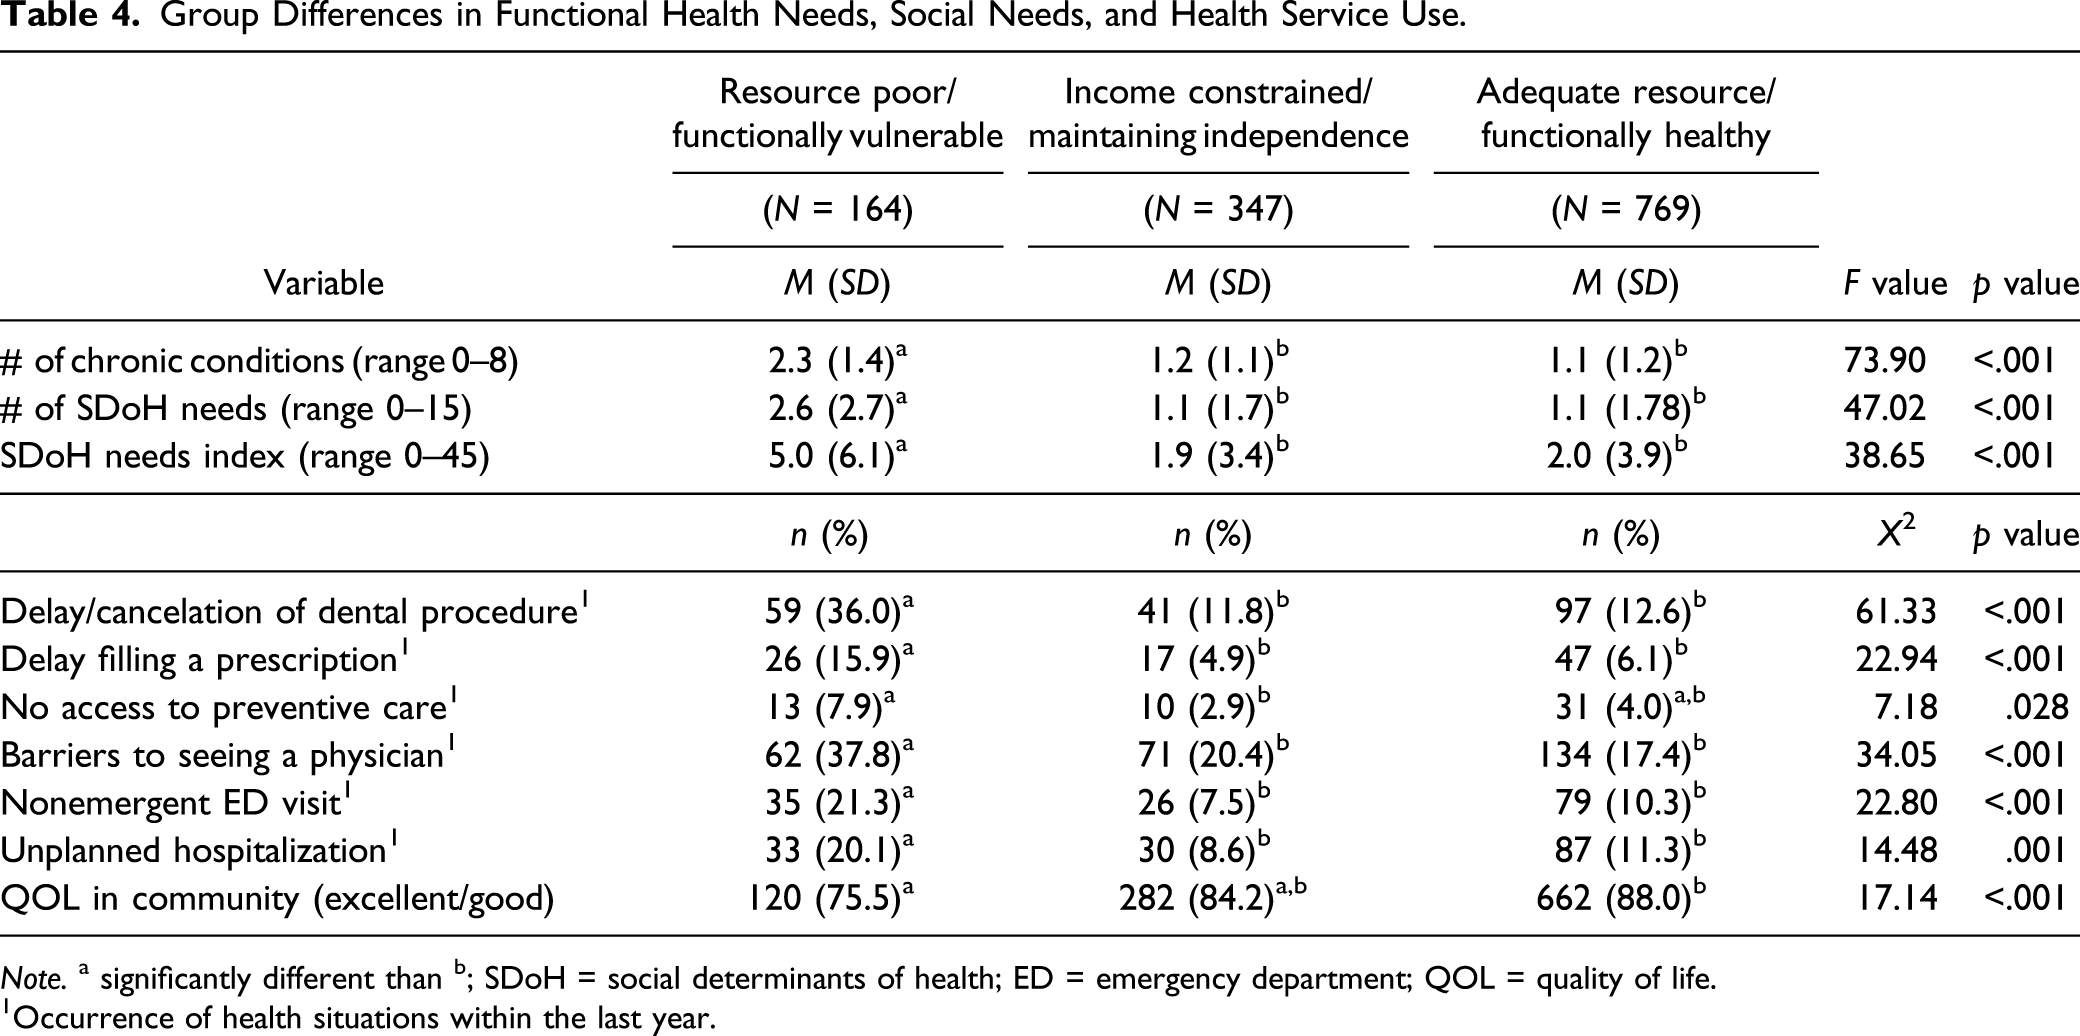
Note. a significantly different than b; SDoH = social determinants of health; ED = emergency department; QOL = quality of life.
Occurrence of health situations within the last year.
Group Differences in SDoH Needs and Nutritional Assistance.
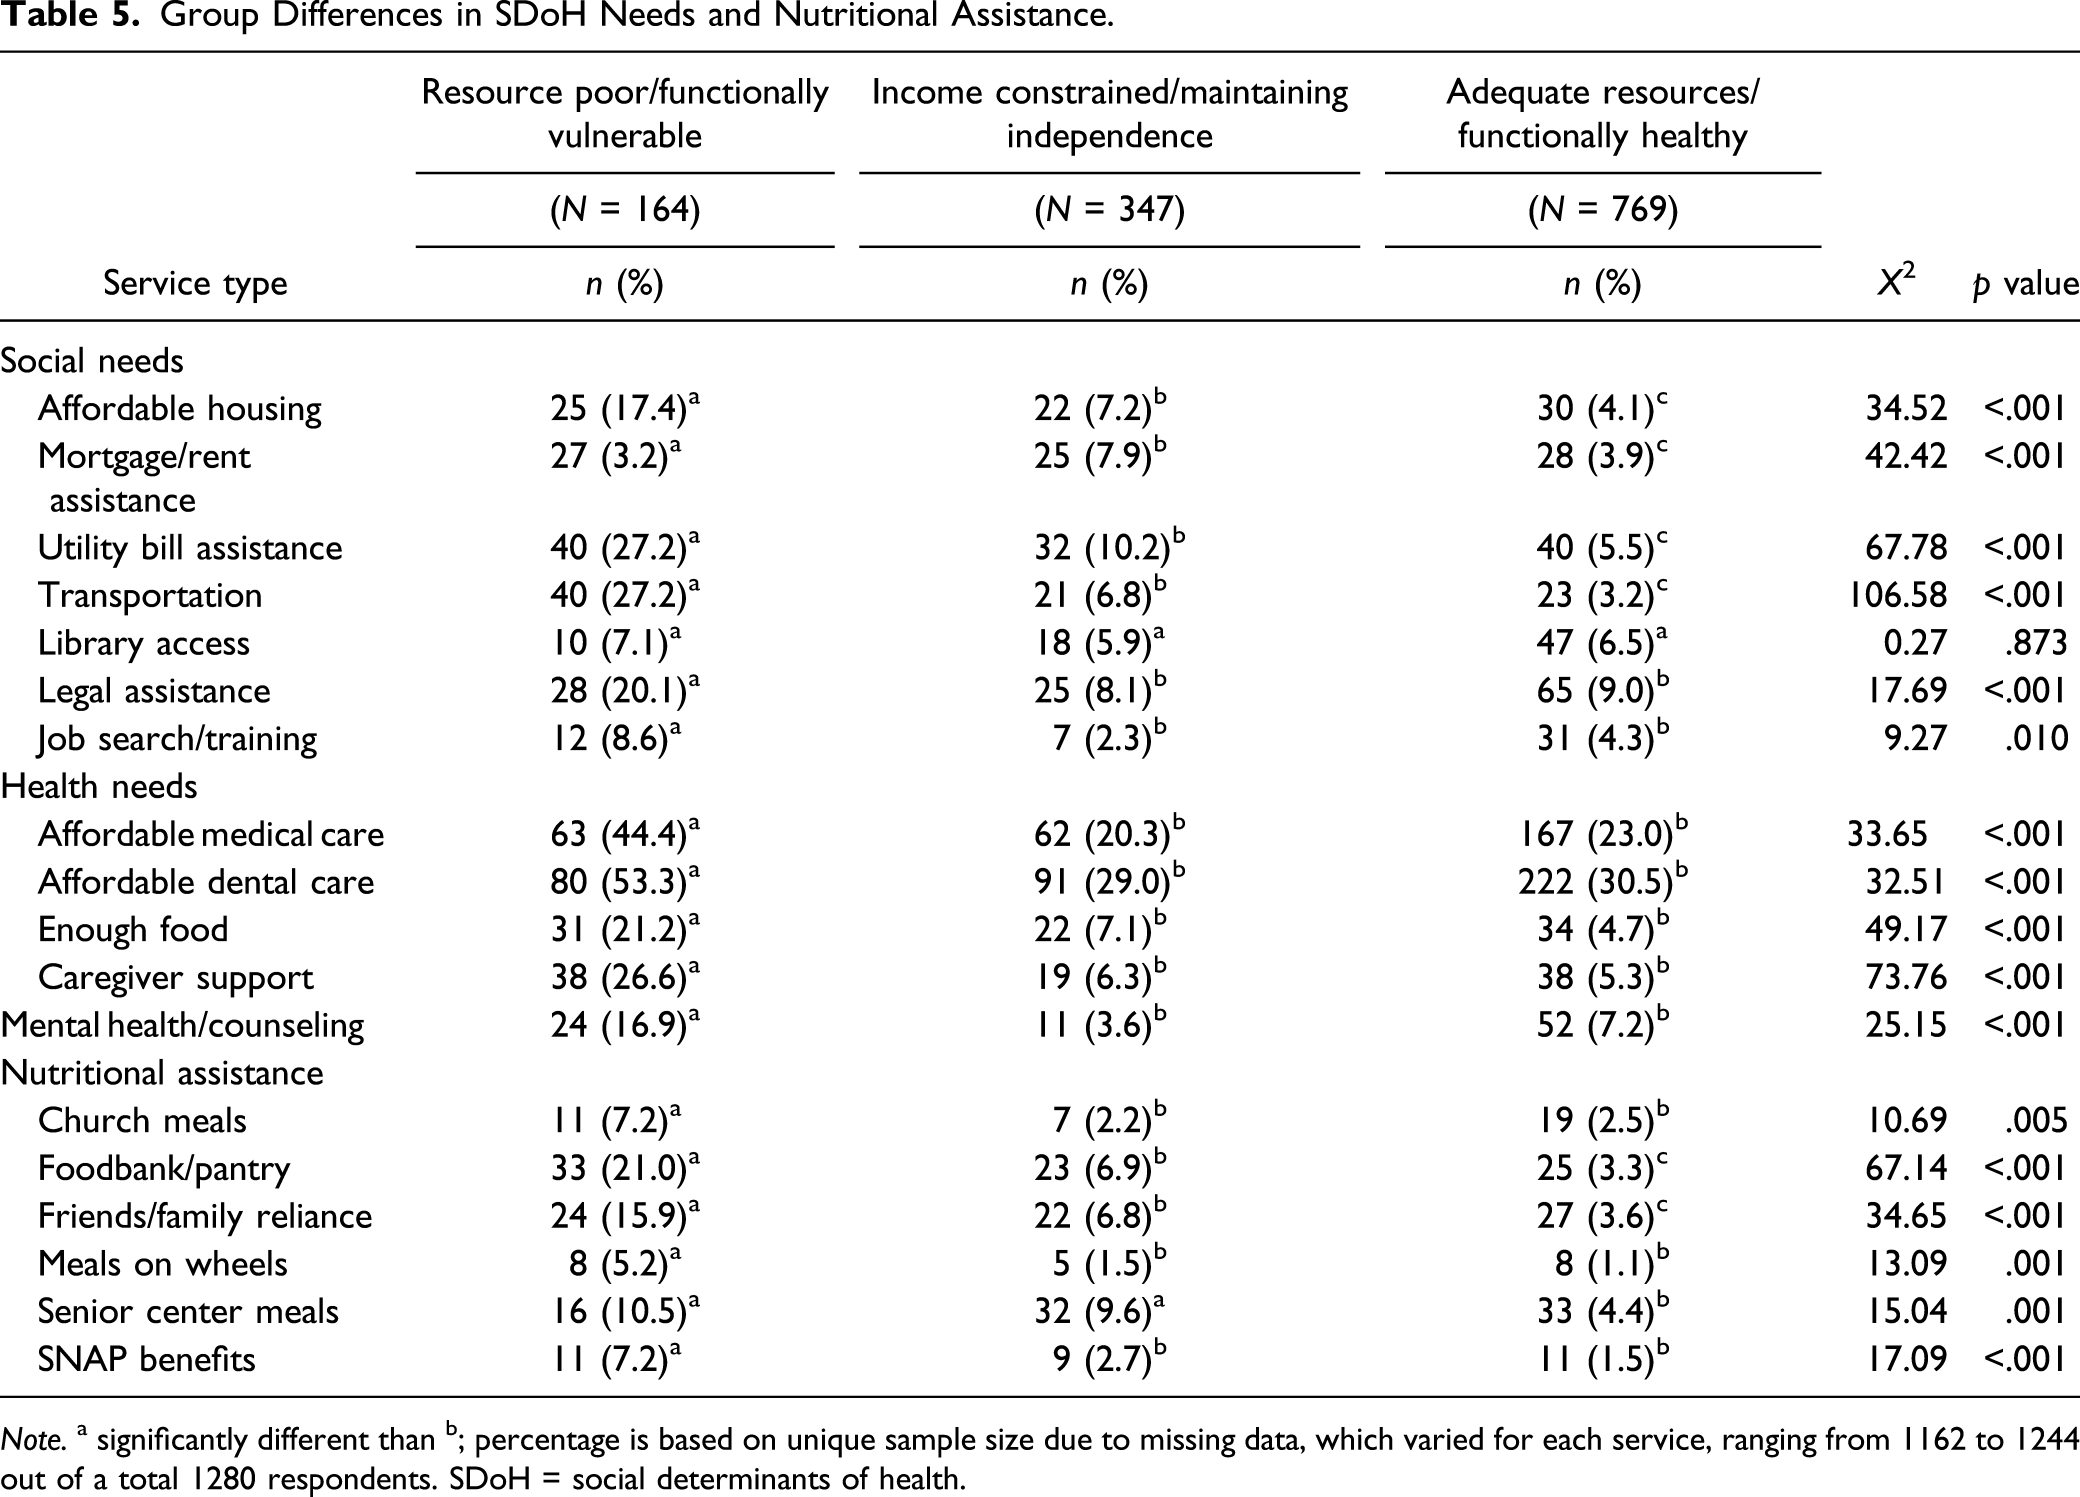
Note. a significantly different than b; percentage is based on unique sample size due to missing data, which varied for each service, ranging from 1162 to 1244 out of a total 1280 respondents. SDoH = social determinants of health.
Discussion
To understand community-driven efforts to support aging in place across eight rural-leaning counties, we conducted analyses on survey data from respondents who were aged 60 years and older. Overall, the sample was predominately white, older, female, and college educated. The majority of respondents were retired and reported a stable/secure housing situation and excellent/good QOL in the community. The overall study sample was a relatively healthy population, reporting few functional health limitations, about one chronic condition, one SDoH need, and less than one ADL limitation. Although individuals may underreport their income (e.g., Bee & Mitchell, 2017), one in five respondents reported a household income less than 25,000. This is nearly double the national poverty rate for adults between the ages of 18–64 years and 65 years and older (Semega et al., 2019). Regarding living situation, the average respondent lived with 0.8 other people; according to the Pew Research Center, the average person who is 60 years and older lives with 2.1 people (Ausubel, 2020). Similarly, we know that the likelihood of living alone increases with age, and among our sample of respondents aged 60 years and older, more than one-third lived alone; this is higher than the national average (26%; Ausubel, 2020). These findings demonstrate the cumulative disadvantage of individuals who were resource poor, whether financially, socially, or both, which increases risk of experiencing adverse healthcare situations. This also raises concern about the risks associated with having unmet care needs (Pass et al., 2019; Weaver & Roberto, 2019) and experiencing social isolation; the deleterious effects of loneliness (Hawkley et al., 2019) include decline in functional status (Shankar et al., 2017).
Moving beyond the average, cluster analysis revealed three distinct subpopulations of residents with low, moderate, or high risk for having functional, social, and health needs. Aptly named, the resource poor/functionally vulnerable group was comprised individuals reporting the most serious financial constraints and functional challenges. Their likelihood of experiencing various health situations was greater than that of individuals in the income constrained/maintaining independence or adequate resources/functionally healthy groups. More specifically, the resource poor/functionally vulnerable group was significantly more likely to report having functional limitations and social and health needs, and they were more likely to report using nutritional assistance. All three groups differed significantly from each other for several social needs (i.e., affordable housing, mortgage/rent assistance, utility bill assistance, and transportation) and regarding nutritional assistance (i.e., foodbank pantry and friends/family reliance), demonstrating clear differentiation in risk profiles.
Likelihood of experiencing interruptions in health services also differed by risk profile. Resource poor/functionally vulnerable respondents were more likely to delay or cancel a dental procedure, delay filling a prescription, experience barriers to seeing a physician, visit the ED for a nonemergent issue, and have an unplanned hospital visit because usual care was not available than members of the other groups. In general, few respondents (4.2%) reported that they were unable to access to preventive care; however, there was a significant difference between resource poor/functionally vulnerable and income constrained/maintaining independence respondents. Helping this group access regular, preventive care would be another cost saving opportunity (Musich et al., 2016). Overall, the majority of respondents reported good/excellent QOL in the community, still a significant difference was found between resource poor/functionally vulnerable respondents less likely to report good/excellent QOL than adequate resources/functionally healthy members.
We derive two key implications from these findings. First, it is essential to look beyond averages in the total population to understand subpopulations at risk of adverse healthcare experiences while aging in place. For example, the overall sample reported much better outcomes on various health indicators (e.g., number of chronic conditions, ADL limitations, and SDoH needs; severity of SDoH needs index; and socioemotional engagement index) than the resource poor/functionally vulnerable group in this study. There were significant differences by group membership in functional limitations, SDoH needs, use of nutritional assistance, and risk of adverse healthcare experiences including barriers to accessing primary care, ED visit for nonemergent issues, and unplanned hospitalizations. When considering household economic circumstances, resource poor/functionally vulnerable respondents were significantly more likely to report being in a lower income bracket, more likely to have Medicaid, and less likely to have private insurance than their healthier counterparts. Medicaid is the primary payer for LTSS for individuals who meet functional and financial criteria (Reaves & Musumeci, 2015). However, older adults proactively seeking help for ongoing care needs may not qualify for Medicaid-funded LTSS if their functional and financial needs are not dire enough. In one study, individuals who met financial, but not functional, eligibility standards for assistance were at an increased risk of mortality (Weaver & Roberto, 2019). Thus, ensuring services and supports are available for individuals who are proactive in addressing care needs before they become severe (i.e., anticipating future care needs) is an important cost saving measure.
The second implication considers the importance of addressing SDoH as a clinical prevention measure and the suitability for community-based organizations to serve in a preventative role. Individuals with fewer resources and household supports (i.e., resource poor/functionally vulnerable) were more likely to report costly and acute care encounters than their more fortunate counterparts. The resource poor/functionally vulnerable group was also more likely to experience SDoH needs and rely on nutritional assistance, such as food banks. Community-based service organizations are well-positioned to identify and address both social and emerging health needs through regular engagement with community residents. Findings point to the value of identifying residents at risk or near risk, so community agencies and healthcare providers can engage with older adults early to prevent avoidable health concerns and support efforts to age in place.
Future Directions
To prevent or delay adverse health outcomes, it may be more cost-effective to encourage community-based efforts from social service agencies, rather than solely relying on clinical interventions. This study demonstrates the value of identifying distinct subpopulations of older adults that experience greater health and social risks. However, it is not feasible or sustainable to ask individuals to answer a 49-item survey to assess risk, like the survey from which the data come. Rather, it would be more appropriate to distill the survey down to a brief screening assessment and implement at various sites in the community. Based on study findings, we suggest developing a three-factor short screener to pilot in conjunction with community-based agencies. A screener tool would allow nonclinicians to quickly capture informative data (i.e., living situation, ADL limitations and extent of socioemotional engagement) to distinguish subpopulations of risk. Adding questions about Medicaid and Medicare insurance coverage could also serve as a proxy to identify low income, older, or health-compromised individuals. Senior centers, libraries, and churches may be an appropriate screening site for older adults seeking connection and support.
There are some limitations to address in future iterations of this type of research. Regarding study design, a random sample of households received the survey and one individual responded. Questions asked about both individual- and household-level need, making it difficult to attribute need to the individual or the household. To account for this, we excluded responses from individuals younger than 60 years and assumed that household-level need captured individual-level need. The survey included several nonvalidated scales that we used to generate indices (i.e., socioemotional engagement and SDoH needs) foundation to our study. The community survey was not representative of the United States population of older adults in terms of race and ethnicity, thus limiting generalizability of findings. However, findings are relevant for underserved aging populations in nonurban areas and offer insight about identifying high-risk populations and targeting appropriate, accessible, and affordable services and supports. Ensuring racial and ethnic representation is necessary to determine whether findings are replicable and to further understand cultural nuances (e.g., expectations for family support/structure). This study represents a point in time recall of events, rather than longitudinal accounting of risk factors. Findings suggest associations, not causal relationships between need, service use, and adverse healthcare situations. We cannot state with certainty the direction of relationships uncovered. Thus, future research is warranted to examine the complex interplay among individuals’ health and SDoH needs, attitudes about, access to, use of community-based services, and long-term outcomes; this would illuminate potential barriers to using existing local support services and investigate residents’ readiness and willingness to accept help.
Conclusion
Identifying and comparing subpopulations of older adults reinforces the importance of looking beyond average health outcomes to design and deliver individualized services and supports that address SDoH needs, which affect a wide range of health risks and outcomes. We identified three risk profiles (adequate resources/functionally healthy, income constrained/maintaining independence, and resource poor/functionally vulnerable) with significantly different likelihood of experiencing adverse healthcare situations. These classifications can aid program planners and service providers in how they target and tailor more intensive services for older adults aging in place. Since community-based organizations are well positioned to intervene early with approaches that target social, economic, and environmental factors (Fraze et al., 2016; Marmot et al., 2008), efforts will promote health equity and contribute to individuals’ ability to age in place safely in their home and community. That is, low-cost community interventions (i.e., assessing residents for services in regularly attended locations) should be emphasized to extend the ability of older residents to live independently and reduce the need for high-cost interventions (e.g., emergency care and hospitalizations). Researchers need to collaborate with healthcare and social service providers to implement rigorous, evidence-based research and assess the effectiveness of interventions and programs supporting community living to demonstrate the system-wide “return on investment.” Health expenditures for individuals aged 55 years and older accounted for 56% of the total health spending in 2016 (Sawyer & Claxton, 2019), while older adults comprise only 29% of the total population. Thus, from societal and economic perspectives, it is vital that community service organizations and health providers work collaboratively to target services and supports that reduce risk, extend independence, reduce costs, and prevent avoidable adverse healthcare situations.
Footnotes
Declaration of Conflicting Interests
The authors declared no potential conflicts of interest with respect to the research, authorship, and/or publication of this article.
Funding
The authors disclosed receipt of the following financial support for the research of this article: This work was supported by the Lewis-Clark Valley Healthcare Foundation, with additional financial support from Idaho Community Foundation, Avista Foundation, and Premera Social Impact.
