
Abstract
Introduction
Frailty is a state of increased vulnerability to stressors, decreased physiological reserve, and resilience that increases morbidity, mortality, and disability in older adults (Fried et al., 2001, 2004). In addition, frailty is known to result in various negative health outcomes such as falls, institutionalization, depression, and lower quality of life (Buigues et al., 2015; Clegg et al., 2013; Fried et al., 2004). Frailty is distinct from aging. Aging is an inevitable natural phenomenon that can increase the possibility of frailty, while frailty has inter-individual variability and reversibility (Fried et al., 2004). In other words, even at the same biological age, their function, resilience, and side effects may appear differently (Johnston et al., 2015). Therefore, frailty is one of the challenging expressions and major threats of healthy aging, which decreases the independence and stability of older adults (Clegg et al., 2013). Predicting and preventing frailty in advance is of great importance for older adults’ health and quality of life.
According to a previously conducted systematic review, among community-dwelling people aged 65 years and older in the United States, Canada, Europe, and Australia, 10.7% were frail and 41.6% were pre-frail (Collard et al., 2012). In regard to Asian countries, 7.4% were frail and 48.1% were pre-frail in older Japanese adults aged ≥65 years (Kojima et al., 2017), and 7.8% were frail and 47% were pre-frail in older Korean adults aged 70–84 years (Won et al., 2020). It can be estimated that approximately 50% of older people are pre-frail or frail worldwide.
In early studies, frailty measures have mainly focused on physical aspects. However, many clinicians and researchers found that frailty is related to not only physical aspects but also other various factors such as sociodemographic factors (e.g., female sex, increased age, lower educational level, and income), lifestyle factors (e.g., physical activity, diet, and alcohol/smoking consumption), health-related factors (e.g., cognitive status, multimorbidity, and depression symptoms), and social factors (e.g., social environment and social support) (Feng et al., 2017; Khezrian et al., 2017; Oliveira et al., 2020; Woo et al., 2005). As a result, various measurements have been developed and adapted to comprehensively evaluate frailty (Khezrian et al., 2017). Therefore, it is important to identify the distinct factors related to frailty.
Among the associated factors to frailty, physical activity is a highly recommended intervention that prevents the risk factors of frailty. Physical activity is defined as every movement that involves muscle contraction, including that from minor daily activity (e.g., housework, gardening, and walking) to intensive planned activity (e.g., swimming, running, and strength training) for acquiring fitness or other health benefits (Carnethon et al., 2009). According to the report from the 2018 US Physical Activity Guidelines Advisory Committee, a total of 150 minutes of moderate-intensity physical activity per week for older individuals aged 65 years and over reduces mortality, heart metabolism, brain and emotional illness, and risk of falls and improves physical functioning (Department of Health and Human Services, 2018). However, one of the studies of physical activity reported that only 10% of women and 15% of men in older adults aged over 70 years were engaged in 150 min/week of moderate-intensity physical activity (Jefferis et al., 2014), and the US National Health and Nutrition Examination Survey showed that only 7.1% of the average age of 63 years were engaged in 150 min/week of moderate-intensity physical activity (Blodgett et al., 2015).
Considering that 50% of older adults are already in a frail state, it is important to determine how much frail older adults perform moderate-intensity physical activity and take health-related advantages from physical activity. A cross-sectional study of physical activity and frailty in adults aged over 50 years revealed that frailer participants had significantly more sedentary behavior and less moderate-intensity physical activity (Blodgett et al., 2015). From the preceding studies discussed above, it can be observed that frailty and physical activity are closely related and affect each other. However, it is difficult to determine the cause and effect relationship between the two concepts from a cross-sectional study. Therefore, it is worthwhile to determine how frailty affects the level of physical activity in older adults according to various time points for further suggestions.
Another point is that many studies and guidelines are likely to regard older adults as a homogeneous group (i.e., a group of individuals aged 65 years or more) when they propose findings or suggestions. There are several findings that physical activities are associated with delaying the onset and progression of frailty, improving the physical status of frail older adults aged 65–79 years (Liu & Fielding, 2011; Oliveira et al., 2020; Peterson et al., 2009). However, there must be a certain difference in the physical, societal, and cognitive abilities between adults in the 70s and 80s age groups. Despite the need for studies for individuals aged over 80 years in response to the global aging society, very little is known about the oldest-old population segment over the age of 80 years (Granic et al., 2019). Therefore, considering the different characteristics of the 70s and 80s, specific comparisons should be made by dividing the age group in older adults.
Considering the above points, this study aimed to investigate the reciprocal relationship between frailty and physical activity in adults aged over 70 years using a cross-lagged panel analysis (CLPA). Furthermore, by dividing the age group as middle-old (aged 70–79 years) and oldest-old (aged 80–84 years), we examined whether the level of physical activity affects frailty and, conversely, how much the frail state affects the level of physical activity using 2 year longitudinal secondary data.
Methods
Study Design
This study was a secondary data analysis study using the 1st and 3rd waves of the Korean Frailty and Aging Cohort Study (KFACS) to examine the reciprocal relationship between frailty and physical activity among community-dwelling older adults by age group. Based on the previous report (United Nations & Department of economic and social affairs, population division, 2015) that classified the oldest-old as an age of 80 years or older and that participants of KFACS were older adults aged 70 years or older, we classified the middle-old and the oldest-old as 70–79 years and 80–84 years, respectively. Figure 1 shows the research framework for this study. Research framework of this study. Note. Covariates were sex, age, education, basic livelihood recipient, depressive symptoms, and cognitive function; T1 = 2016; T2 = 2018.
Data Source and Study Sample
The data source for this study was KFACS, which is an ongoing longitudinal panel cohort study of community-dwelling residents aged 70–84 years. KFACS data were collected nationally by 10 study centers across different regions (urban, suburban, and rural areas) upon participants’ informed consent. Each center recruited participants using quota sampling stratified by age and sex. To minimize selection bias, participants were recruited from diverse settings. From the beginning of 2016, the KFACS collected information about demographics, frailty, health-related questionnaires, social function, and blood test results every 2 years. Detailed information about the KFACS is available from Won et al. (2020). The data are available for all researchers willing to use these data after the confirmation of the KFACS committee.
In this study, excluding missing data, data from 1092 participants were analyzed. Specifically, physical activity (International Physical Activity Questionnaire (IPAQ)) had 529 missing values, and frailty (FRAIL) had 327 missing values; therefore, we included 1092 participants who had either physical activity or frailty values among 1559 participants in 2016. We additionally analyzed the differences of baseline characteristics between the included sample (n = 1092) and excluded sample (n = 467), which showed no differences in age (p = .120), sex (p = .071), physical activity (p = .078), and frailty (p = .376) in 2016. This study was approved by the Institutional Review Board of Seoul National University (IRB: No. E2010/002-001).
Measures
Frailty
Frailty was measured using the FRAIL scale proposed by the International Association of Nutrition and Aging (Abellan van Kan et al., 2008). The FRAIL scale includes five components: fatigue, resistance, ambulation, illness, and weight loss. Total frailty scores (range: 0–5) were calculated by assigning 1 point to positive responses on each of the above five components and used in CLPA as a continuous variable. Participants with scores of 0, 1–2, and 3–5 were classified as robust, pre-frail, and frail, respectively (Jung et al., 2016).
Physical activity
Physical activity was measured using the IPAQ, which is an instrument developed by the International Consensus Group (ICG) and IPAQ Group (2002). The participants were asked to report the duration and frequencies of three physical activity categories: walking, moderate physical activity, and vigorous physical activity. The ICG provides a scoring protocol in a continuous variable or as categories (low, moderate, or high activity levels). For a continuous variable, the total amount of minutes spent a week for each physical activity category was calculated by multiplying the metabolic equivalent of task (MET) (MET mins a week) values of 3.3, 4, and 8 for walking, moderate physical activity, and vigorous physical activity questionnaire, respectively. For the category variable, physical activity levels were classified based on the proposed IPAQ scoring protocol (https://www.ipaq.ki.se/).
Covariates
Based on previous studies, sex, age, educational level, basic livelihood recipient, depression symptoms, and cognitive function were included as covariates (Feng et al., 2017; Jefferis et al., 2014; Khezrian et al., 2017). Depression symptoms were measured using the Korean version of the Short Form Geriatric Depression Scale (GDS-SF). The GDS-SF comprises 15 items with “yes” or “no.” The total score ranges from 0 to 15, with higher scores indicating more depression (Bae & Cho, 2004). Cognitive function was measured using the Mental State Examination in the Korean version of the Consortium to Establish a Registry for Alzheimer’s Disease (MMSE-KC). The MMSE-KC comprises 30 items, and the total score ranges from 0 to 30. Higher scores indicate better cognitive function (Lee et al., 2002).
Data Analysis
In this study, the chi-squared test and independent t-test were performed to examine the differences in general characteristics between the middle-old and oldest-old groups. In addition, CLPA with two waves of measurement was used to identify the reciprocal relationship between physical activity and frailty among the middle-old and oldest-old groups.
The CLPA is a useful quasi-experiment design using longitudinal panel data to infer precedence (Shingles, 1976). The CLPA includes multiple regression analyses, in which measurements at the next point in time are regressed on those at one point in time (Kenny, 2014). This helps reduce the parameter bias that can occur when using cross-sectional data (Selig and Preacher, 2009). In particular, using the reciprocal model, the CLPA examines the direction of inference (i.e., unidirectional or bidirectional) between two or more variables across time. A bidirectional relationship indicates that physical activity and frailty influence each other mutually. To control for variables may lead to spurious relationships, and we adjusted several covariates (e.g., sex, educational level, basic livelihood recipient, depressive symptoms, and cognitive function), which may influence physical activity and frailty.
Descriptive analyses, chi-square test, and independent t-test were conducted using the SPSS Statistics version 27.0 (IBM Corp, Armonk, NY, USA). The CLPA was performed using Mplus version 8.3 (Muthén & Muthén, Los Angeles, CA, USA). The parameters in the cross-lagged panel models were estimated using the robust maximum-likelihood estimation method to statistically adjust for nonnormality. In addition, we have applied full information maximum likelihood for handling missing values in the other variables, which is a default of MPLUS software.
Results
General Characteristics of the Participants
General Characteristics of the Participants by Time Point.
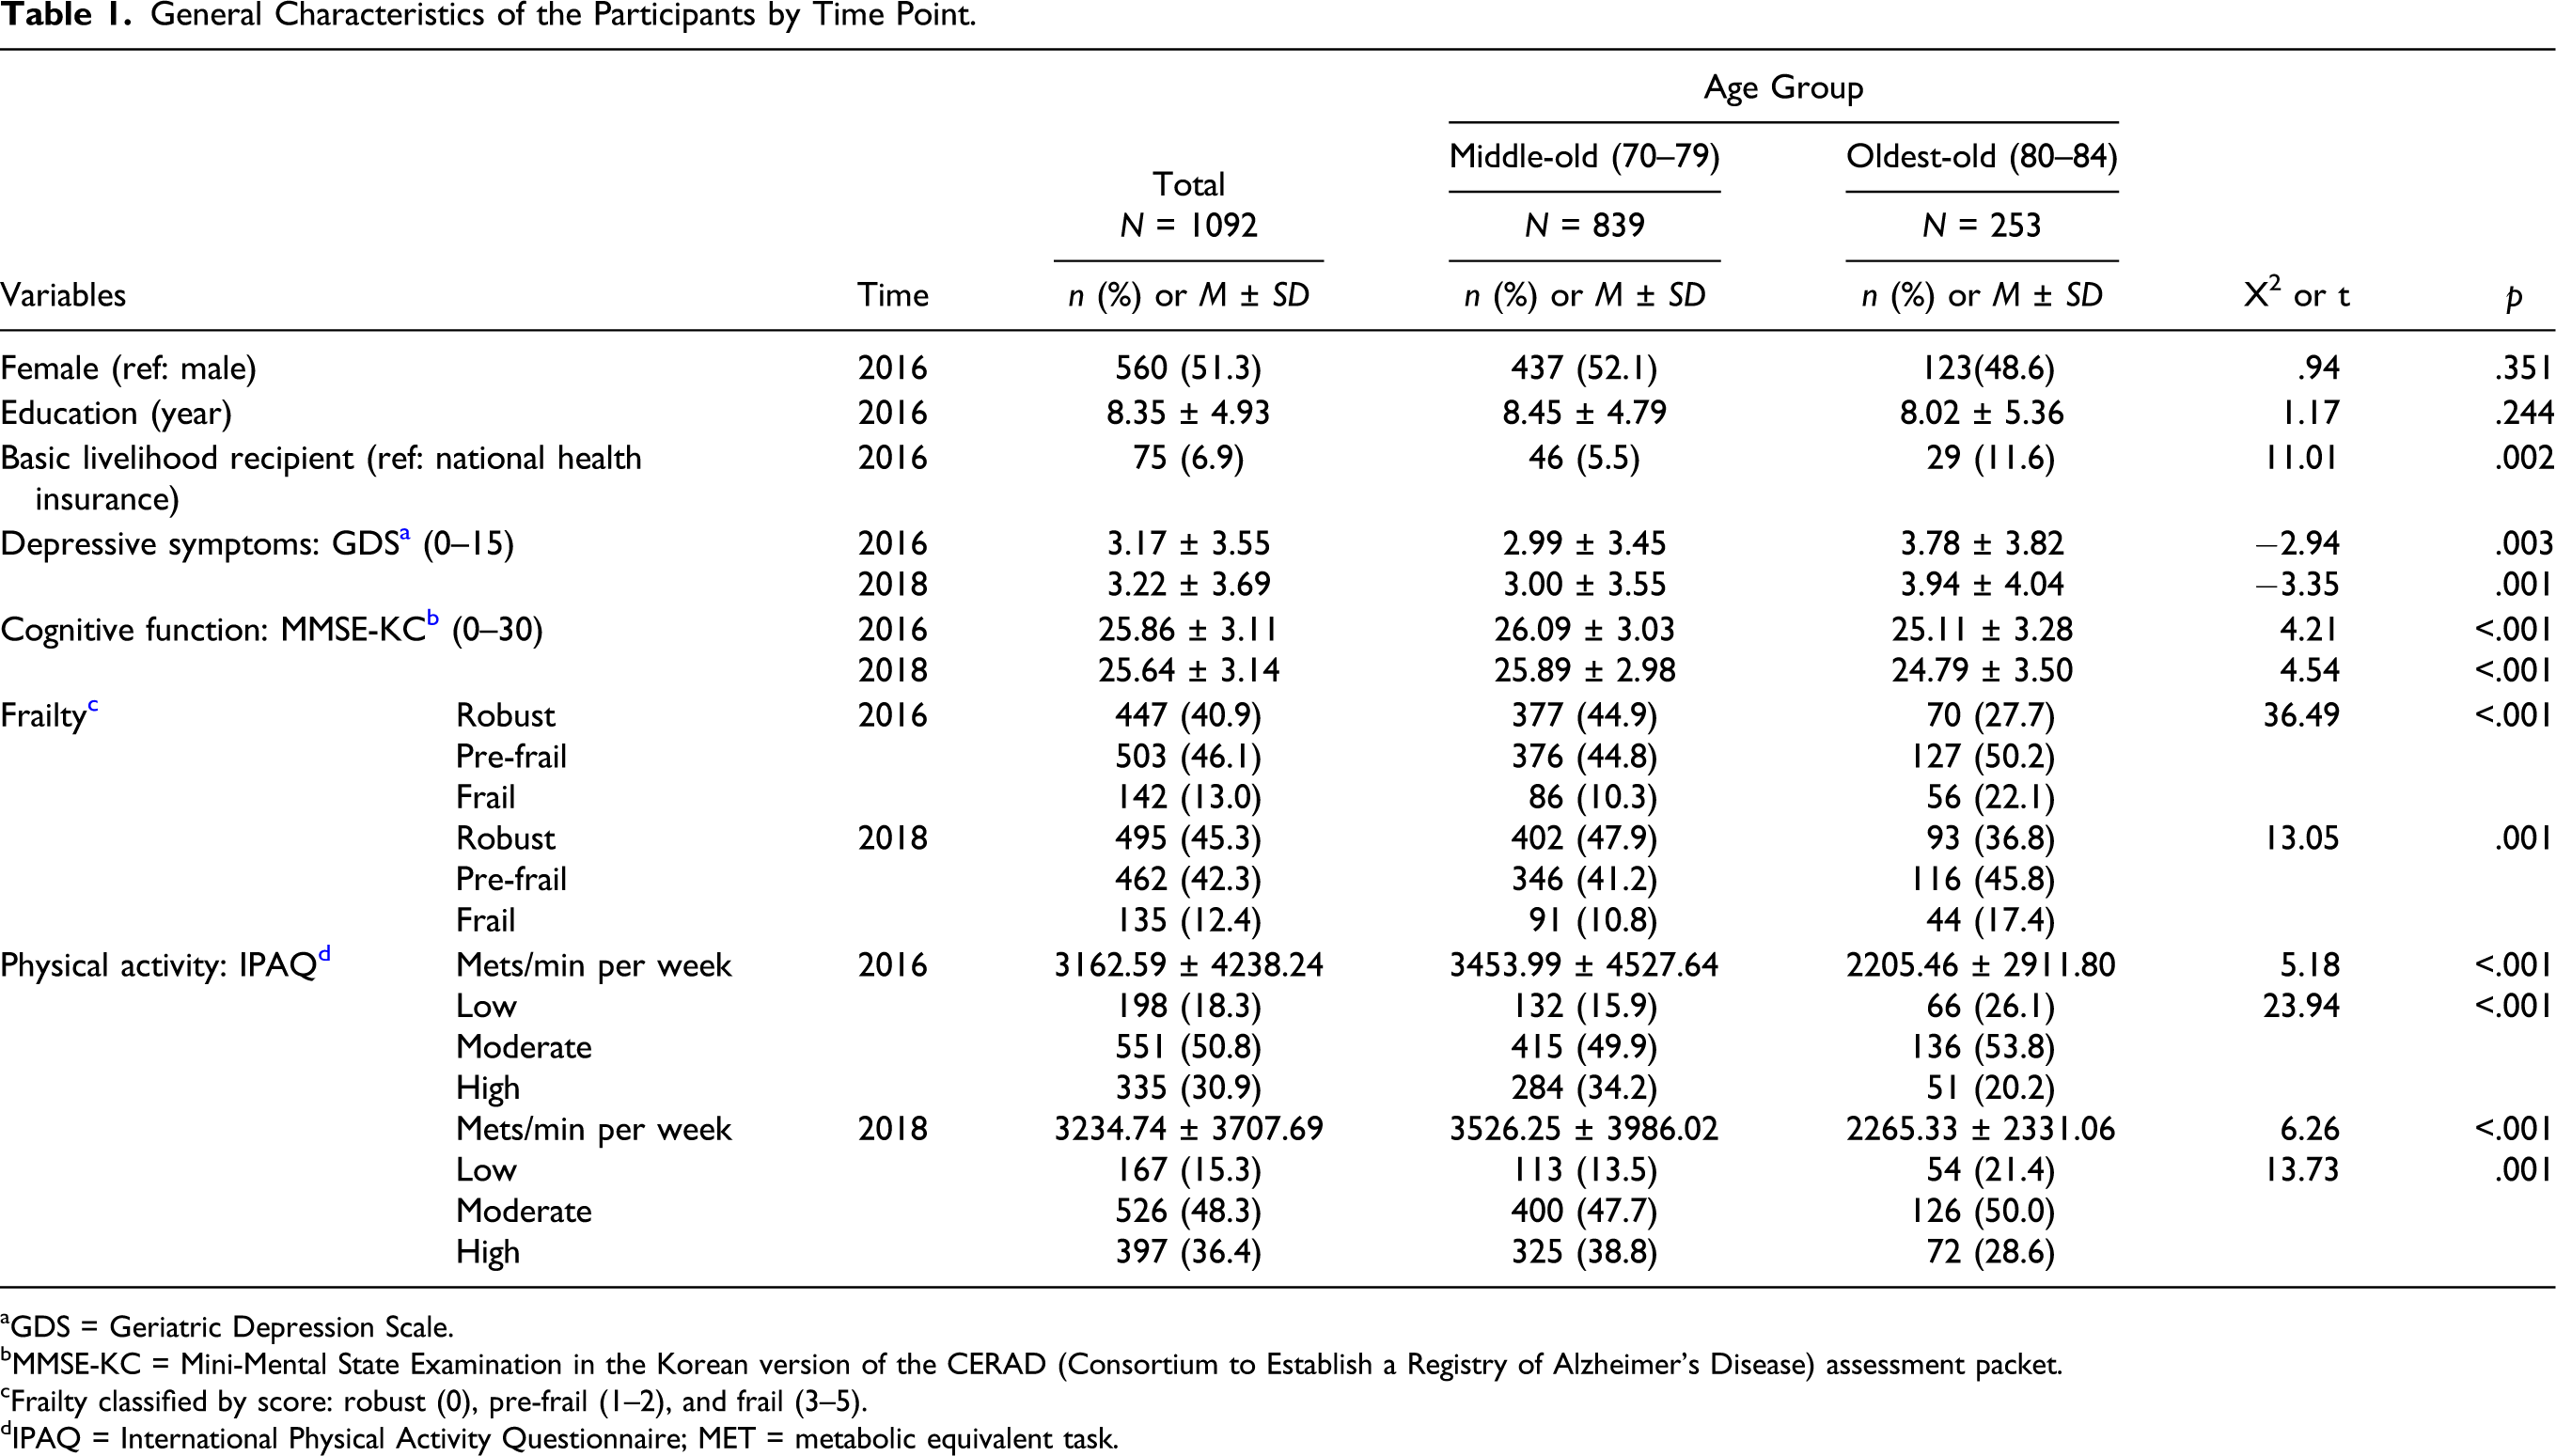
aGDS = Geriatric Depression Scale.
bMMSE-KC = Mini-Mental State Examination in the Korean version of the CERAD (Consortium to Establish a Registry of Alzheimer’s Disease) assessment packet.
cFrailty classified by score: robust (0), pre-frail (1–2), and frail (3–5).
dIPAQ = International Physical Activity Questionnaire; MET = metabolic equivalent task.
Cross-Lagged Panel Analysis Results
Cross-Lagged Panel Analysis Results.
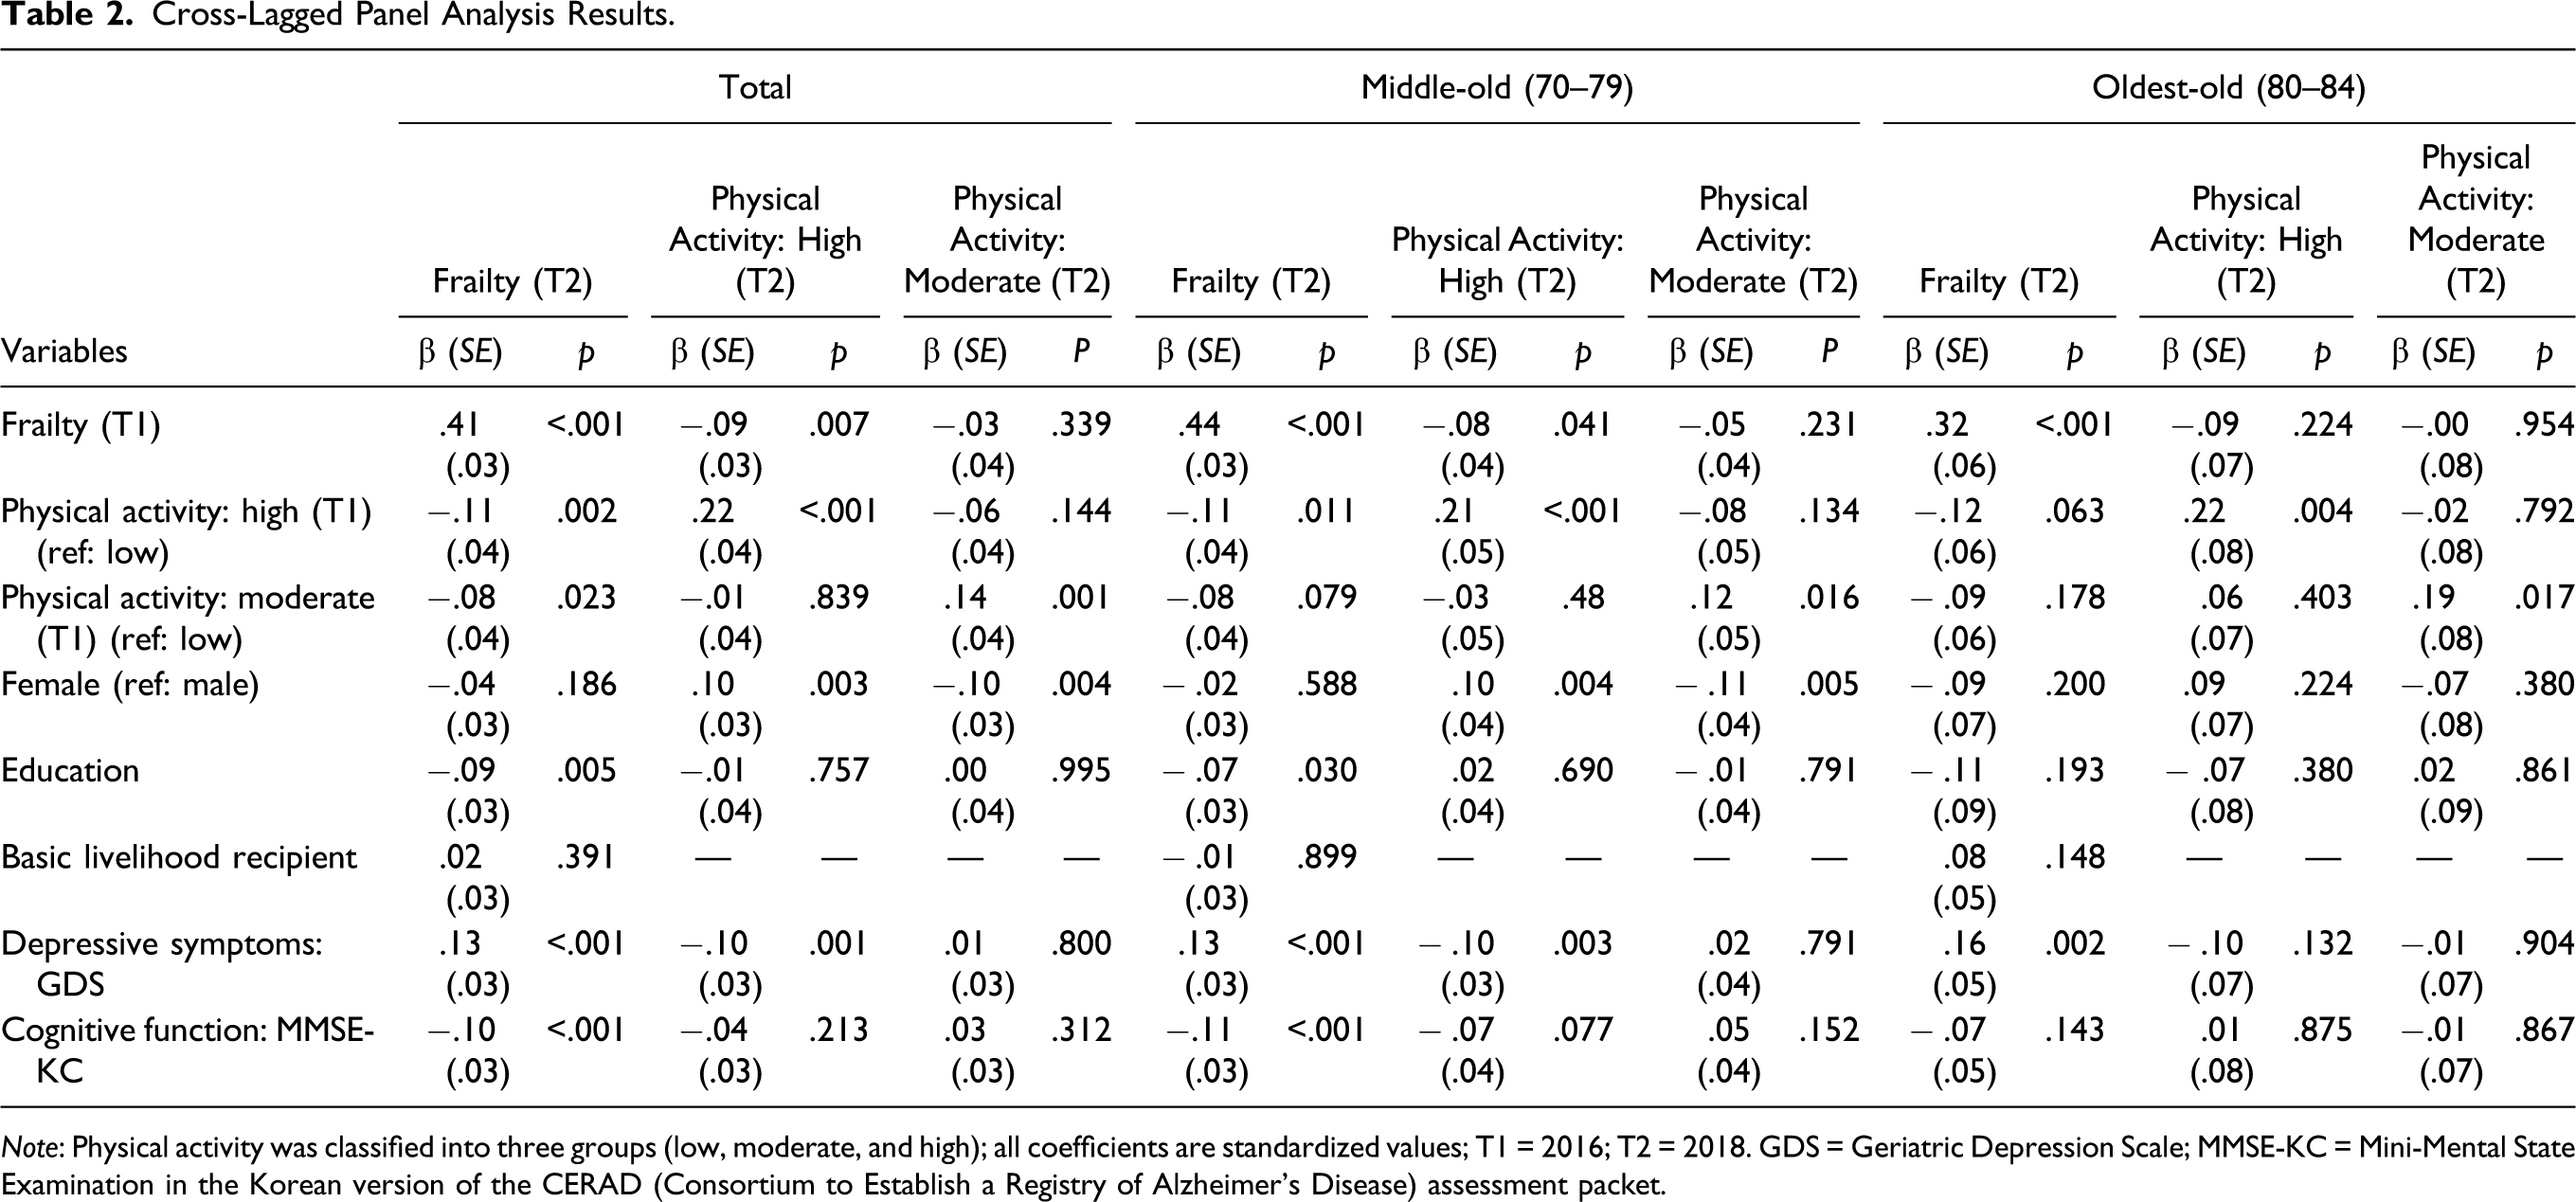
Note: Physical activity was classified into three groups (low, moderate, and high); all coefficients are standardized values; T1 = 2016; T2 = 2018. GDS = Geriatric Depression Scale; MMSE-KC = Mini-Mental State Examination in the Korean version of the CERAD (Consortium to Establish a Registry of Alzheimer’s Disease) assessment packet.
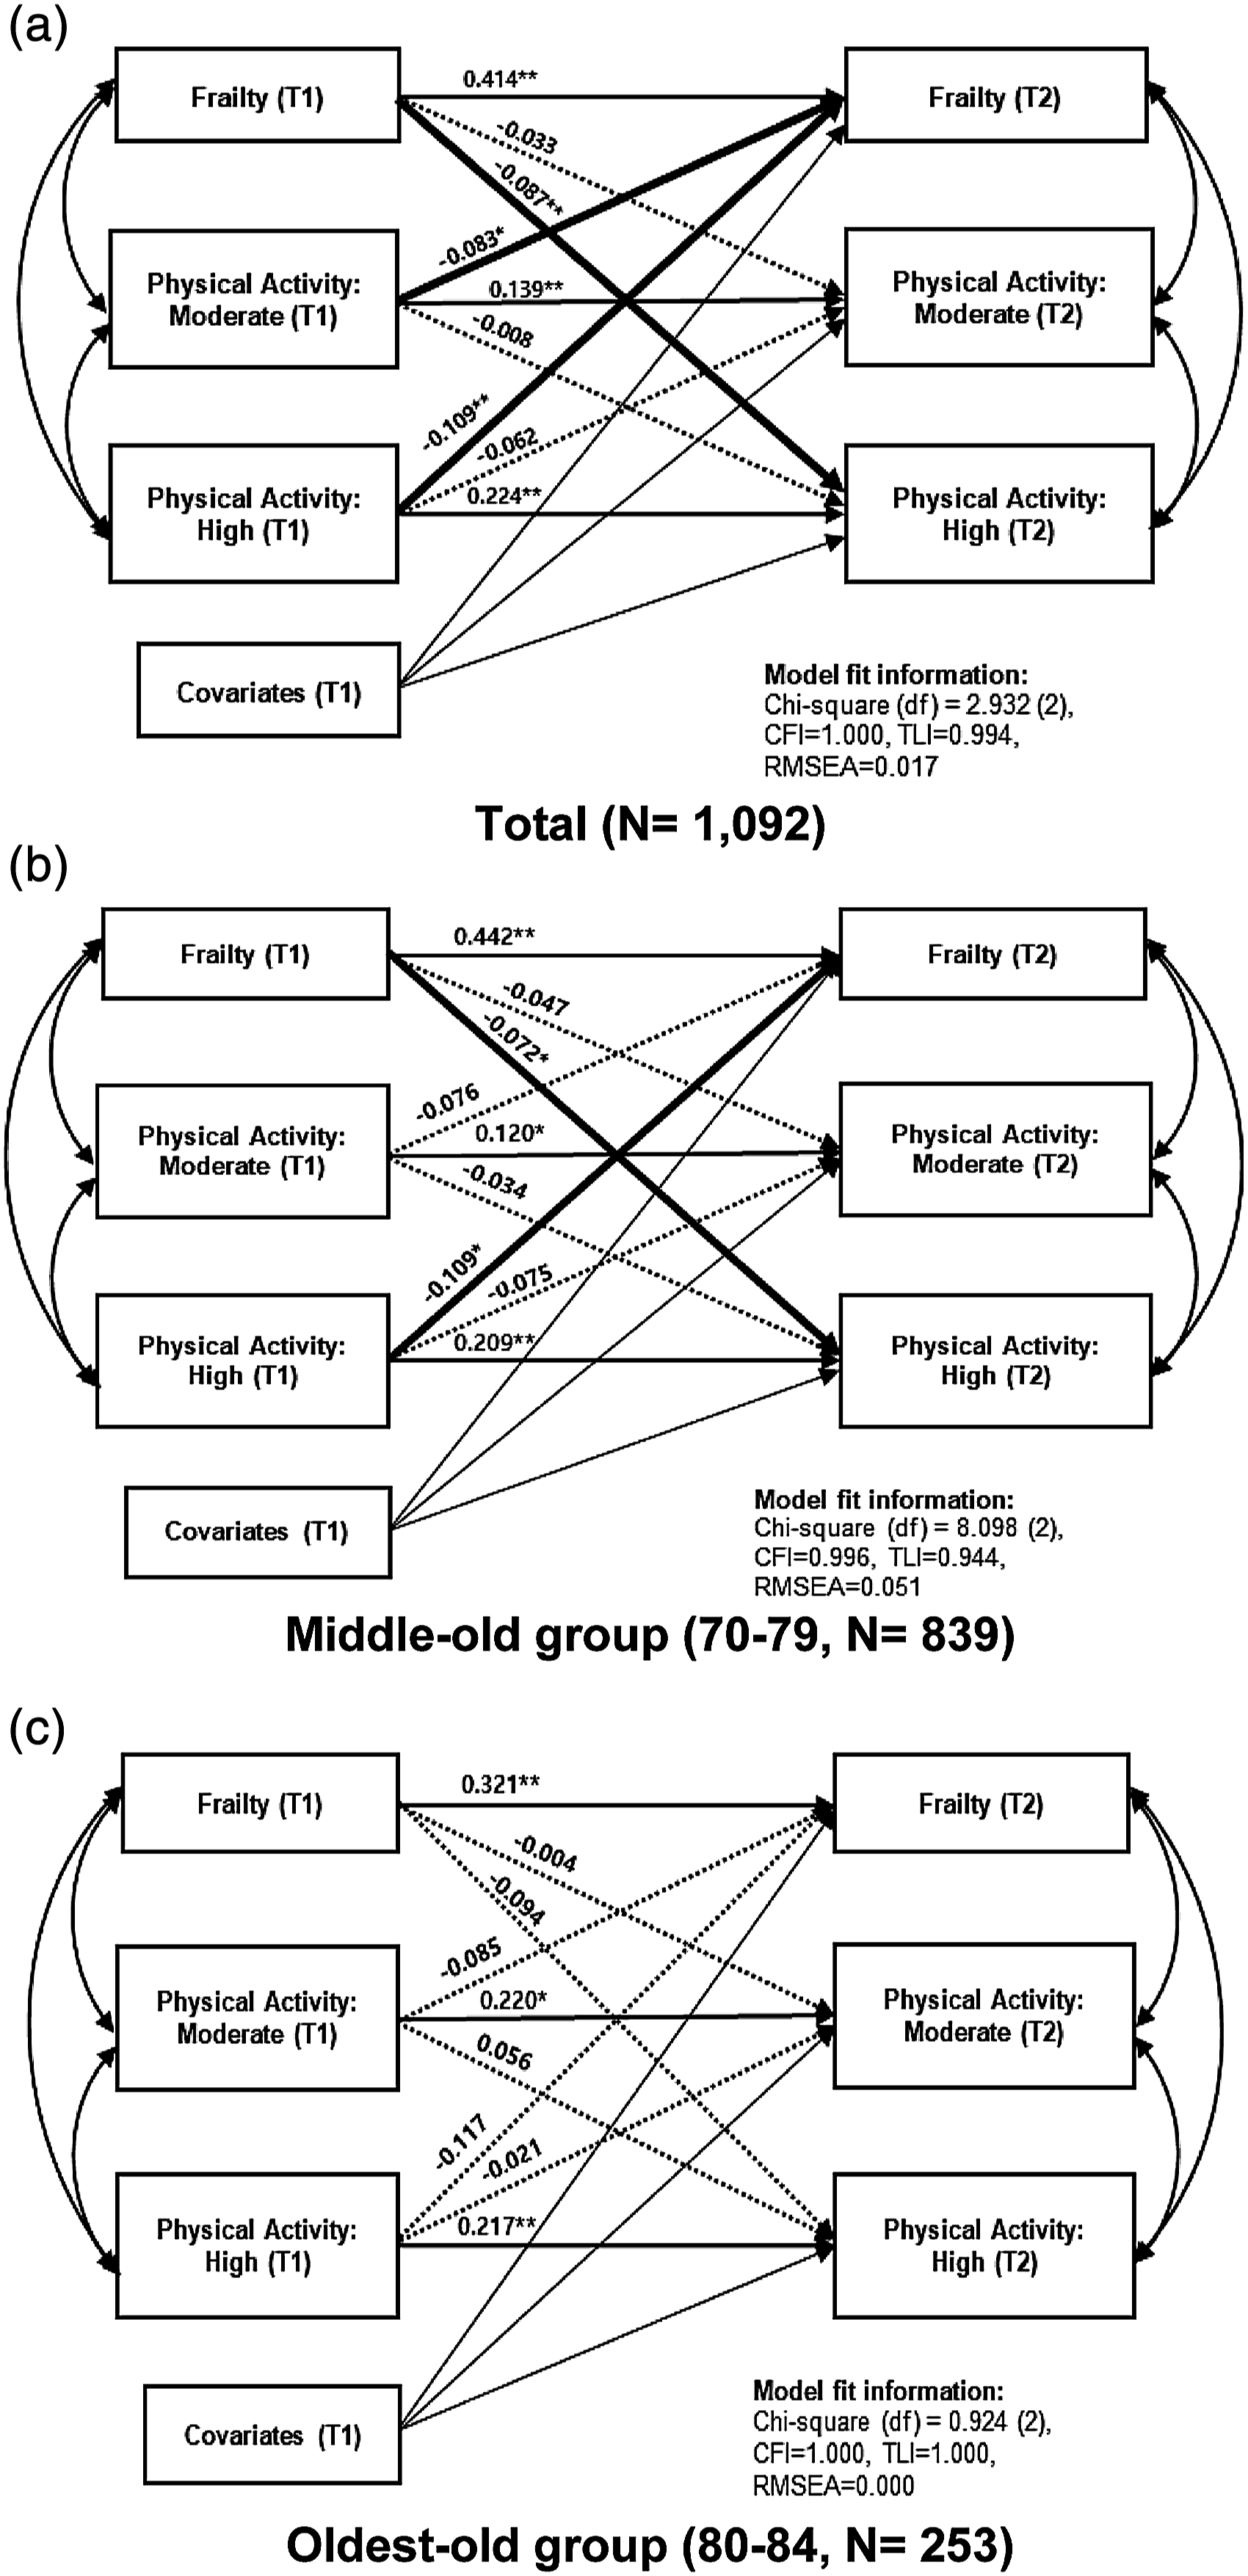
Cross-lagged panel analysis results. (a) Total (N = 1092); (b) middle-old group (70–79, N = 839); (c) oldest-old group (80–84, N = 253). Note. *p < .05, **p < .01; covariates include sex, education, basic livelihood recipient, depressive symptoms, and cognitive function; T1 = 2016; T2 = 2018; CFI = comparative fit index; TLI = Tucker–Lewis index; RMSEA = root mean square error of approximation; all coefficients are standardized values.
In the middle-old group, respondents with high physical activity were more likely to show lower frailty scores after 2 years than those with low physical activity (β = −.11, p = .011) after controlling for covariates. However, moderate levels of physical activity were not associated with frailty scores after 2 years (β = −.08, p = .079). Respondents who were frailer were less likely to report high physical activity after 2 years rather than low physical activity (β = −.08, p = .041). On the other hand, frailty scores had no significant effect on moderate levels of physical activity compared with those on low physical activity after 2 years (β = −.05, p = .231) after controlling for covariates.
In the oldest-old group, there was no statistically significant reciprocal relationship between frailty and any level of physical activity reference to low physical activity after 2 years (β = −.12, p = .063; β = −.09, p = .178). Similarly, frailty scores had no significant effects on both high and moderate levels of physical activities after 2 years (β = −.09, p = .224; β = −.00, p = .954). In addition, we attempted to compare the path coefficients between the two groups by using cross-group equality constraint for multigroup analysis. However, the results showed no significant differences, which indicate that comparing path coefficient directly by age groups is not recommended.
Discussion
In the present study, we examined the reciprocal relationships between frailty and physical activity by age groups of the middle-old (aged 70–79 years) and the oldest-old (aged 80–84 years) groups within a two-wave CLPA.
In the middle-old group, frailty and high physical activity had significant reciprocal relationships, while moderate levels of physical activity with frailty had no significant relationships in reference to low physical activity. In short, older adults who had a high level of physical activity were less likely to be frail, and the frail middle-old adults were less likely to have high physical activity after 2 years. In the oldest-old group, there was no statistically significant effect between frailty and any level of physical activity reference to low physical activity.
There are many findings and guidelines reporting that physical activity can prevent or delay frailty (Landi et al., 2010; Liu & Fielding., 2011; Oliveira et al., 2020; Peterson et al., 2009). Physical activity has several advantages on health in all age groups, and even health-related associations such as the World Health Organization (WHO) recommend physical activity for health (WHO, 2020). However, the relationship between physical activity and frailty differed by age groups in this study. In particular, in the group of middle-old adults, these previous findings and guidelines are indisputable. High physical activity and frailty had a reciprocal relationship; however, moderate levels of physical activity had no inferences with frailty reference to low physical activity. It is possible to conclude that older adults should perform more than moderate levels of physical activity to avoid frailty in the future. This conclusion can be supported by previous studies showing that low physical activity or lifestyle activities such as gardening, housework, or yard work had no significant associations with frailty compared to sedentary behavior in older adults aged 68–79 years (Peterson et al., 2009). In addition, the WHO (2020) suggested at least 75 minutes of vigorous-intensity aerobic physical activity throughout the week or an equivalent combination of moderate- and vigorous-intensity activity to acquire health benefits for older adults aged over 65 years. Furthermore, the guidelines from the Ministry of Health and Welfare of Korea (2013) suggested that older adults should engage not only in aerobic physical activity but also in muscle-strengthening and balance activities to prevent falls, which can lead to future frailty. Therefore, it is necessary to include high physical activity in an intervention that combines aerobic and other various activities for older adults.
On the other hand, as we assumed, frailty disabled high physical activity after 2 years. One of the cross-sectional studies showed that sedentary behavior and moderate-vigorous physical activities were significantly associated with frailty (Blodgett et al., 2015). Specifically, comparing frail and most frail older adults, most frail older adults showed approximately three times lower of 10,000 walking steps per day and two times lower of 150 minutes of moderate-vigorous physical activity per week than frail older adults (Blodgett et al., 2015). It can be concluded that as older adults get frailer, their level of physical activity decreases, and this lowered physical activity provokes a vicious cycle that makes frail older adults get frailer. Therefore, there is a need for specific physical activity guidelines for older adults who already have a frail status with low physical function.
For the oldest-old group in this study, there was no statistically significant effect between frailty and any level of physical activity reference to low physical activity. A previous study showed that 71.8% of the Portuguese older adults aged over 80 years were frail and 24.7% were pre-frail (Alves et al., 2020), and less than 4% of frail and most frail older adults performed 150 minutes of moderate-vigorous physical activity (Blodgett et al., 2015). It can be observed that the majority of the oldest-old already in a frail status, and they experience difficulty in performing an adequate level of physical activity that affects health benefits. On the other hand, it can be interpreted that even if the oldest-old has been performing sufficient physical activity for their age, the ceiling effect of physical activity caused no effect on frailty anymore. A previous study comprising participants with an average age of 78.9 years showed that 2 years of a structured, moderate-intensity physical activity program was not associated with a decreased risk of frailty in older adults (Trombetti et al., 2018). Several studies have concluded that physical activity seems to be effective for various factors that affect frailty; however, it is difficult to determine the most effective physical activity that affects frail older adults (De Labra et al., 2015; Silva et al., 2017). Further studies on the oldest-old population should be conducted to determine the effective physical activity for further health improvement.
From the covariates in this study, depressive symptoms were the only variable that predicted a significant relationship with frailty after 2 years in both age groups, which was the same as in previous studies (Ku et al., 2012; Penninx et al., 1999). The systematic reviews on depression and frailty support the present result that there are significant or concurrent relationships between these two concepts (Buigues et al., 2015). The study also found that 4%–16% of frail older adults aged over 60 years had serious depression, and this increased up to 35% in those aged 75 years and older (Buigues et al., 2015). Therefore, depressive symptoms should be managed as early as possible to reduce the onset of frailty in older adults.
This study has some limitations that all measures were collected by self-reporting tools, which can induce the subjective idea of participants. In particular, the IPAQ questionnaire used in the KFACS was mainly focused on lifestyle activities such as heavy lifting or cleaning house; therefore, measurement of various aspects of physical activity is required. Specific measurements for older adults that consider every kind of physical activity should be developed. Second, a 2 year period of longitudinal data might be too large to explain one’s reciprocal relationship between frailty and physical activity. Therefore, shorter time period follow-up with long-term longitudinal study is recommended to examine changes between changes in frailty and changes in physical activity levels. Third, covariates for social aspects were not included. Since the social aspects of frailty have recently received attention, further studies should include social aspects such as social support or the environment. Lastly, the sample size of the oldest-old group was relatively small to middle-old group in this study, and the age variation of the oldest-old group was ranged from 80 to 84 years. Thus, an additional study of relationship between frailty and physical activity is needed for the oldest-old population with a wide range of ages. In addition, since this study analyzed two age groups with CLPA separately, a multigroup analysis is recommended for further study to compare statistical significances of each path coefficient between two groups.
Conclusion
The present study showed a reciprocal relationship between frailty and high physical activity in the middle-old group (70–79 years). In the oldest-old group (80–84 years), there was no statistically significant effect between frailty and any level of physical activity reference to low physical activity. Therefore, further studies on the relationship between frailty and physical activity in the oldest-old population are required. In addition, there is a need for physical activity guidelines for the specific groups of older adults such as those who have a low physical ability and effective measurement of physical activity for older adults by age groups should be developed.
Footnotes
Declaration of Conflicting Interests
The author(s) declared no potential conflicts of interest with respect to the research, authorship, and/or publication of this article.
Funding
The author(s) disclosed receipt of the following financial support for the research, authorship, and/or publication of this article: This work was supported by “Overseas Training Expenses for Humanities and Social Sciences” through Seoul National University and a grant of the Korea Health Technology R&D Project through the Korean Health Industry Development Institute (KHIDI), funded by the Ministry of Health and Welfare, Republic of Korea (grant number: HI15C3153). Ah Ram Jang received a scholarship from the BK21 education program (Center for Human-Caring Nurse Leaders for the Future).