
Abstract
Introduction
Longitudinal aging research, particularly when conducted with national samples where representativeness is of concern, demands careful attention to initial recruitment of participants as well as to who stays in the study over time (retention) and who drops out (attrition). These tasks are important for maintaining sample representativeness over time, and they may also matter for evaluating whether attrition is biasing the longitudinal findings that are generated. This study describes a major effort to reinstate prior dropouts in the MIDUS (Midlife in the United States) national longitudinal study. MIDUS has become a major forum for multidisciplinary (biopsychosocial) research on aging, with more than 1400 publications generated across diverse fields (www.midus.wisc.edu). Engagement from the scientific community is high (20,000+ users).
The MIDUS reinstatement initiative relates to three issues in prior literatures on sample recruitment and maintenance over time. The first issue pertains to factors that predict probabilities of initial participation in longitudinal studies as well as likelihood of continuing with or dropping out over time. General patterns show that participation and retention tend to be higher among women as well as among married compared to single people, and among better-educated respondents (Akasaki et al., 2020; Groves & Couper, 1998; Jacobsen et al., 2020; Lillard & Panis, 1998; Powers et al., 2015; Radler & Ryff, 2010; Tolonen et al., 2006). In contrast, attrition tends to be higher among youngest and oldest members of the population as well as minorities (Cacioppo & Cacioppo, 2018; Goudy, 1985; Jacobsen et al., 2020; Radler & Ryff, 2010; Tolonen et al., 2006; Zabel, 1998). Attriters also tend to have poorer health than respondents (Akasaki et al., 2020; Banks et al., 2011; Gardiner et al., 2015; Jacobsen et al., 2020; Norris, 1985; Siegler & Botwinick, 1979; Streib, 1966). Health-related behaviors such as alcohol intake and smoking history (Akasaki et al., 2020; de Graaf et al., 2000; Gardiner et al., 2015; Powers et al., 2015; Winefield et al., 1990) have been consistently linked with attrition.
A second issue pertains to heightened interest in examining distinct types of nonresponse (due to mortality, refusal/withdrawal, or unable to contact), which increasing evidence suggests may be important to consider. That is, the reasons for attrition differ by age or other demographic factors (Badawi et al., 1999; de Graaf et al., 2000; Farmer et al., 1994; Goudy, 1985; Vink et al., 2004). Whether variations in type of nonresponse have differential effects on bias in the longitudinal samples (Akasaki et al., 2020; Hayward & Krause, 2016; Powers et al., 2015) or on associations among study variables (Saiepour et al., 2019) is important to address. Although most studies combine attriters across waves, there is also growing interest in whether the factors that affect attrition at one wave are similar to those in later waves (Spiers et al., 2018). With these ideas in mind, we sought to compare those who dropped out at different waves and for different reasons (death, withdrawal, and nonresponse) to both those who were and were not successfully reinstated as well as to the longitudinal sample. Such inquiry illuminates whether predictors of attrition are relatively consistent over time—that is, whether they remain predictors of subsequent attrition in later waves (Gardiner et al., 2015) or whether they may change possibly pointing to different obstacles to participation across waves.
A third issue is that the prior literature on longitudinal participation in cohort studies has given notably more emphasis to retention strategies than to efforts to reinstate dropouts. For example, Teague et al. (2018) reviewed over 140 longitudinal cohort studies and identified numerous retention strategies, broadly classified as barrier-reduction, community-building, follow-up/reminder, or tracing strategies. Meta-analyses showed that studies using barrier-reduction strategies (e.g., showing flexibility in data collection methods) retained 10% more of their sample overtime. The overall number of strategies employed was not, however, associated with retention. Reinstatement has received comparatively less research attention although participants who return are sometimes examined in reported findings. For example, Banks et al. (2011) included “returners” in analyses of whether attrition was biasing evidence of disease prevalence at baseline in the Health and Retirement Study (HRS) and the English Longitudinal Study of Aging (ELSA). They concluded it was not. They found small numbers of returning participants in both samples (2.6% for HRS and 1.3% for ELSA) and few variables were associated with return from attrition.
The need for reinstatement is particularly important in MIDUS, given that resources were unavailable at the 2nd and 3rd waves of data collection to find dropouts and bring as many as possible back into the study. More recent NIA funding, however, supported a substantial effort to reinstate dropouts lost at these prior waves. This initiative was pursued to improve the representativeness and long-term viability of the sample, but also to set the stage for new inquiries, open to the larger scientific community, to investigate whether various types of attrition may be biasing findings that are emerging from a wide array of longitudinal analyses. Interest in this question grew out of prior MIDUS findings, which showed that those who dropped out had combinations of vulnerability factors, such as poor health combined with low income (or being male, or of minority status) (Radler & Ryff, 2010). These joint baseline vulnerabilities possibly constitute “early warning markers” for subsequent health decline perhaps tied to intervening stress exposures. Thus, reinstating a substantial portion of dropouts to the study affords valuable opportunities to investigate these ideas via new survey assessments obtained from them about health and well-being as well as about intervening stress exposures. These objectives defined the MIDUS Retention Early Warning project, otherwise known as REW.
Taken together, the key aims of this report are to (1) describe efforts to bring a substantial portion of living dropouts back into the MIDUS study and (2) compare, using a limited subset of sociodemographic factors, successfully reinstated participants (REW completers) with those who did not return (REW non-completers) as well as with the longitudinal sample and different subgroups of attriters defined by when and for what reason they exited from the study. The overarching objective was to bring a more nuanced understanding of varieties of longitudinal participation in a major longitudinal study of aging, while also paving the way for numerous avenues of future science built on the reinstatement efforts that are detailed in the Discussion section.
Methods
Data and Sample
The MIDUS study began in 1995–1996 (MIDUS 1 or M1) with a national baseline sample of 7108 individuals (aged 25–74) who completed a computer-assisted telephone interview and self-administered questionnaires (SAQ). Two follow-up surveys were conducted in 2004–2005 (MIDUS 2 or M2) and 2013–2014 (MIDUS 3 or M3) and were completed by 4963 (SAQ = 4041) and 3294 (SAQ = 2732) longitudinal respondents, respectively. Detailed information about the sample disposition and reasons for attrition at both follow-up waves can be found in publicly available documentation (https://www.icpsr.umich.edu/web/ICPSR/series/203). In November 2019, the REW sample was fielded to bring back into the study a portion of those who had attrited. It was comprised of those individuals who completed M1 but did not complete M2 or M3 for any reason other than a confirmed death or permanent withdrawal from the study as requested by the respondent. Because individuals that dropped out of the study at M2 were not fielded at M3, the number of dropouts accumulated over the three waves of the study. A total of 2239 cases qualified for the REW project, 1314 dropouts at M2, and 925 at M3. 1
Procedures
Prior research has identified the most effective retention strategies for longitudinal research (reviewed in Teague et al., 2018), which guided our approach in the REW project. To maximize participation in REW, the mode of contact was changed from telephone to in-person interviews. Doing so allowed newly obtained or confirmed addresses to be visited, regardless of accuracy of telephone number, call screening, and non-answered calls. Interviewers attempted to conduct an in-home computer-assisted personal interview (CAPI), preceded wherever possible by an advance letter. The CAPI methodology obtains the highest response rates of any mode (Hox & De Leeuw, 1994); in-person procedures have also been found essential to achieve reasonable coverage of hard-to-reach populations, including the elderly or those in poor health and less likely to respond to survey requests (Dykema et al., 2008; Krysan et al., 1994). CAPI interviews were conducted in the respondents’ homes or at a mutually agreed upon private, neutral location such as a library study room. The average interview length for the REW CAPI was 139 minutes (SD = 36 minutes).
The University of Wisconsin Survey Center (UWSC) sent an advance letter to all sample members that reminded them of their past participation, informed them of the purposes of the current study, offered a pledge of confidentiality, and notified them that an interviewer would be contacting them to participate in the CAPI. Interviewers then attempted to call respondents to set an appointment for the interview and/or attempted doorstep visits to the most recent known address.
Sampling
The REW project used a stratified cluster sampling plan to field in-person interviews with respondents widely geographically distributed across the contiguous United States. This strategy allowed the UWSC to efficiently field this diverse sample while providing each potential respondent—that is, all living dropouts—a non-zero probability of being contacted. After filtering out 91 decedents discovered during pre-tracing, the REW sample was stratified into quintiles by population density. Within each stratum, clusters were created at the county level so that one cluster equaled one county.
The REW project completed CAPIs with 651 respondents for a simple response rate of 29.1%, with a mortality-adjusted response rate of 31.4% after removing decedents found during tracing and field operations (n = 165). We note that this level of participation was higher than was anticipated (∼20%) based on prior reinstatement efforts by the UWSC in other longitudinal studies.
Measures
MIDUS has an abundance of measures across numerous substantive domains. For this initial report about the reinstatement effort only a small subset of possible baseline measures were used. These included the usual sociodemographic factors that are typically considered in evaluating participation (e.g., age, gender, and marital status) as well as parental status, which constitutes a major demographic variable that has received less attention in prior participation studies. Note that race/ethnicity was not included because of substantial missing (13.7%) due to nonresponse to SAQ. Education was measured by years of educational attainment. Marital status was assessed by respondent’s report of current marital status at M1 (1 = married and 0 = others (never married, divorced, separated, or widowed)). Parental status was measured by the number of children at M1 (1 = having at least one child and 0 = childless).
In addition, two single-item assessments of health were included. Subjective physical/mental health was assessed at MIDUS 1 by a single question asking, “In general, would you say your physical/mental health is excellent, very good, good, fair, or poor?” The responses were coded so that a higher score indicates better physical health (1 = poor to 5 = excellent). Numerous studies have demonstrated the validity of this single item as a significant predictor of both morbidity and mortality (e.g., Idler & Benyamini, 1997). Many other mental and physical health assessments are available in the dataset, which constitute avenues for further research on factors that influence longitudinal participation. We return to these possibilities in the Discussion section.
Results
Longitudinal Participation Status
Longitudinal Participation Status in MIDUS: MIDUS 1, MIDUS 2, MIDUS 3, and REW.
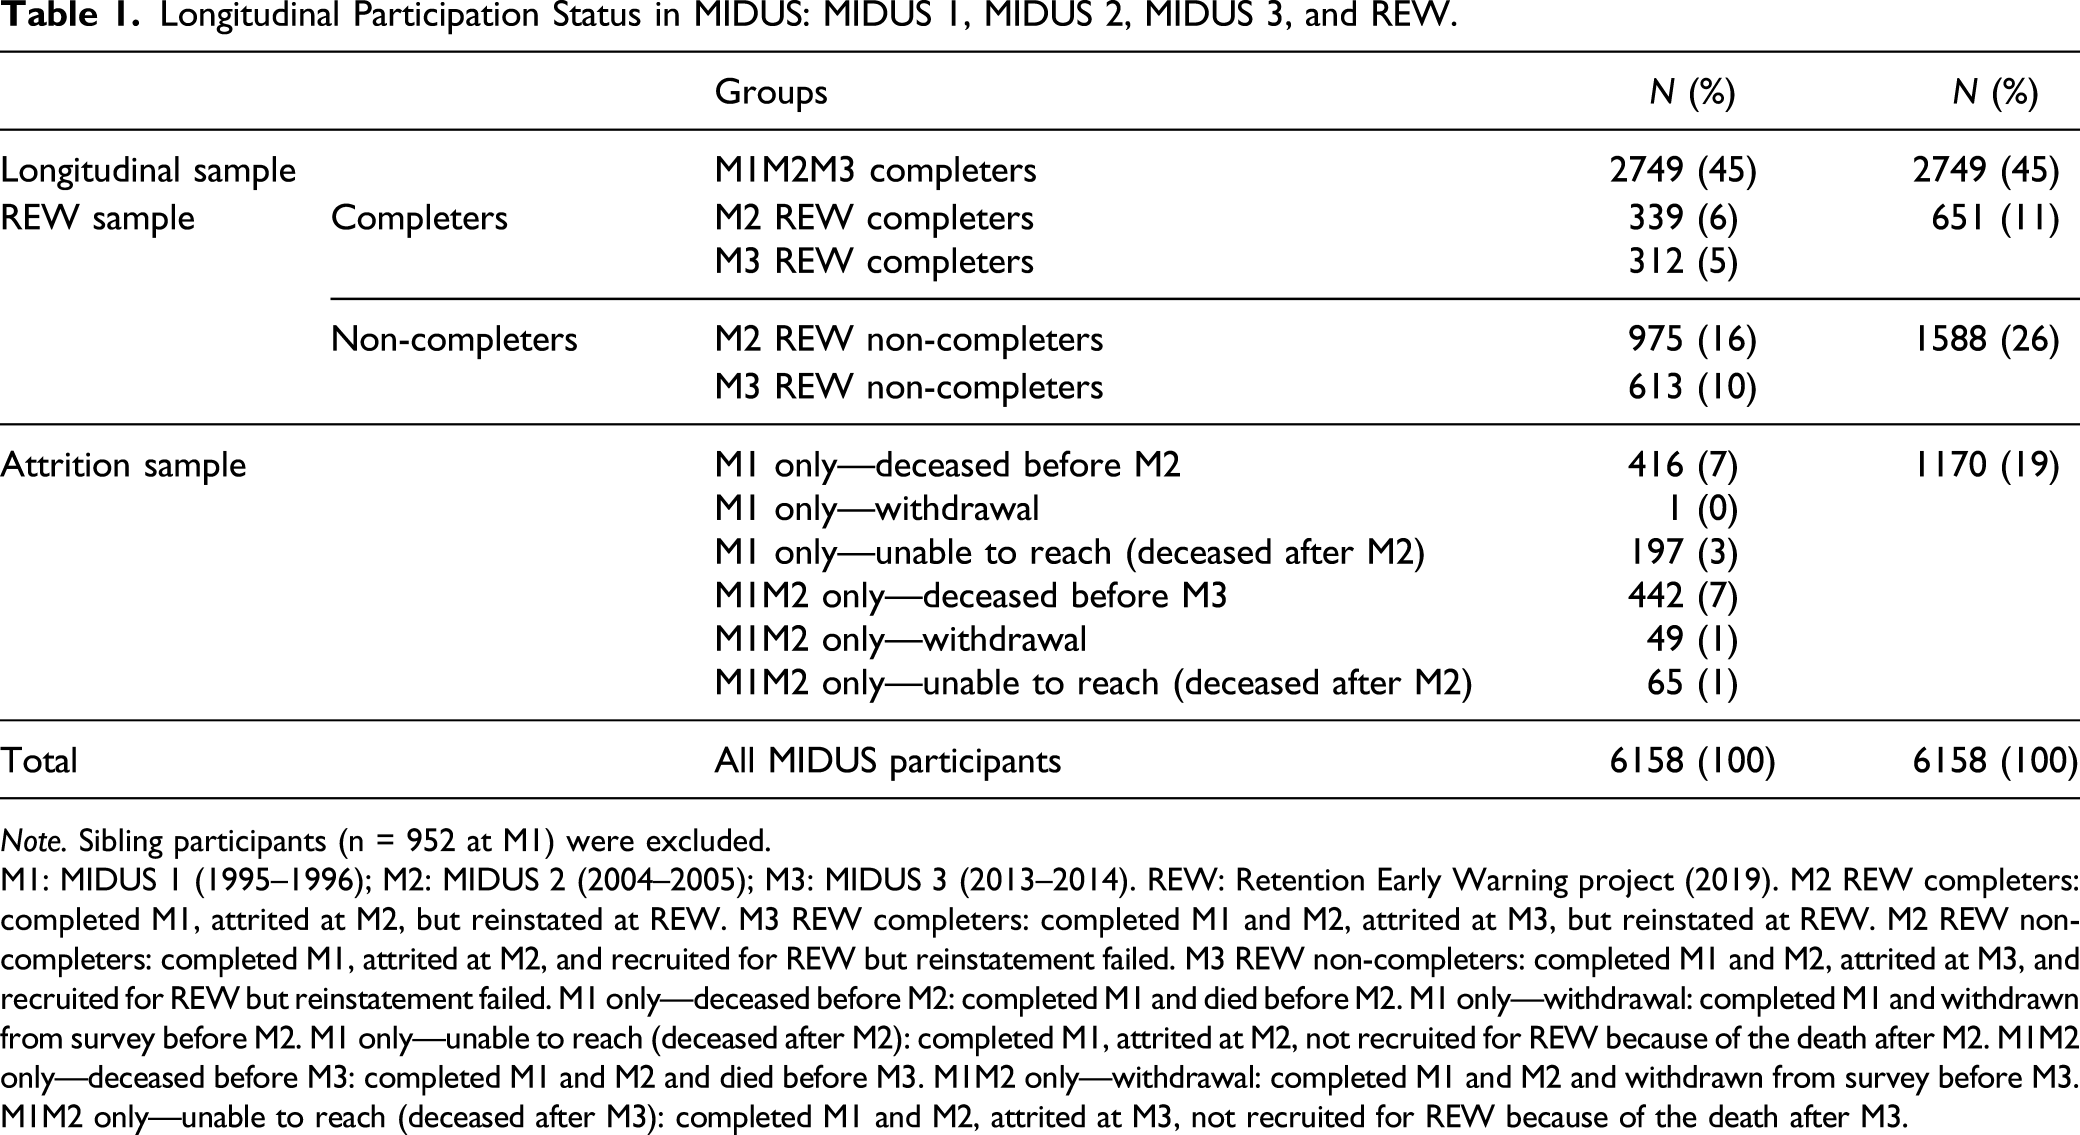
Note. Sibling participants (n = 952 at M1) were excluded.
M1: MIDUS 1 (1995–1996); M2: MIDUS 2 (2004–2005); M3: MIDUS 3 (2013–2014). REW: Retention Early Warning project (2019). M2 REW completers: completed M1, attrited at M2, but reinstated at REW. M3 REW completers: completed M1 and M2, attrited at M3, but reinstated at REW. M2 REW non-completers: completed M1, attrited at M2, and recruited for REW but reinstatement failed. M3 REW non-completers: completed M1 and M2, attrited at M3, and recruited for REW but reinstatement failed. M1 only—deceased before M2: completed M1 and died before M2. M1 only—withdrawal: completed M1 and withdrawn from survey before M2. M1 only—unable to reach (deceased after M2): completed M1, attrited at M2, not recruited for REW because of the death after M2. M1M2 only—deceased before M3: completed M1 and M2 and died before M3. M1M2 only—withdrawal: completed M1 and M2 and withdrawn from survey before M3. M1M2 only—unable to reach (deceased after M3): completed M1 and M2, attrited at M3, not recruited for REW because of the death after M3.
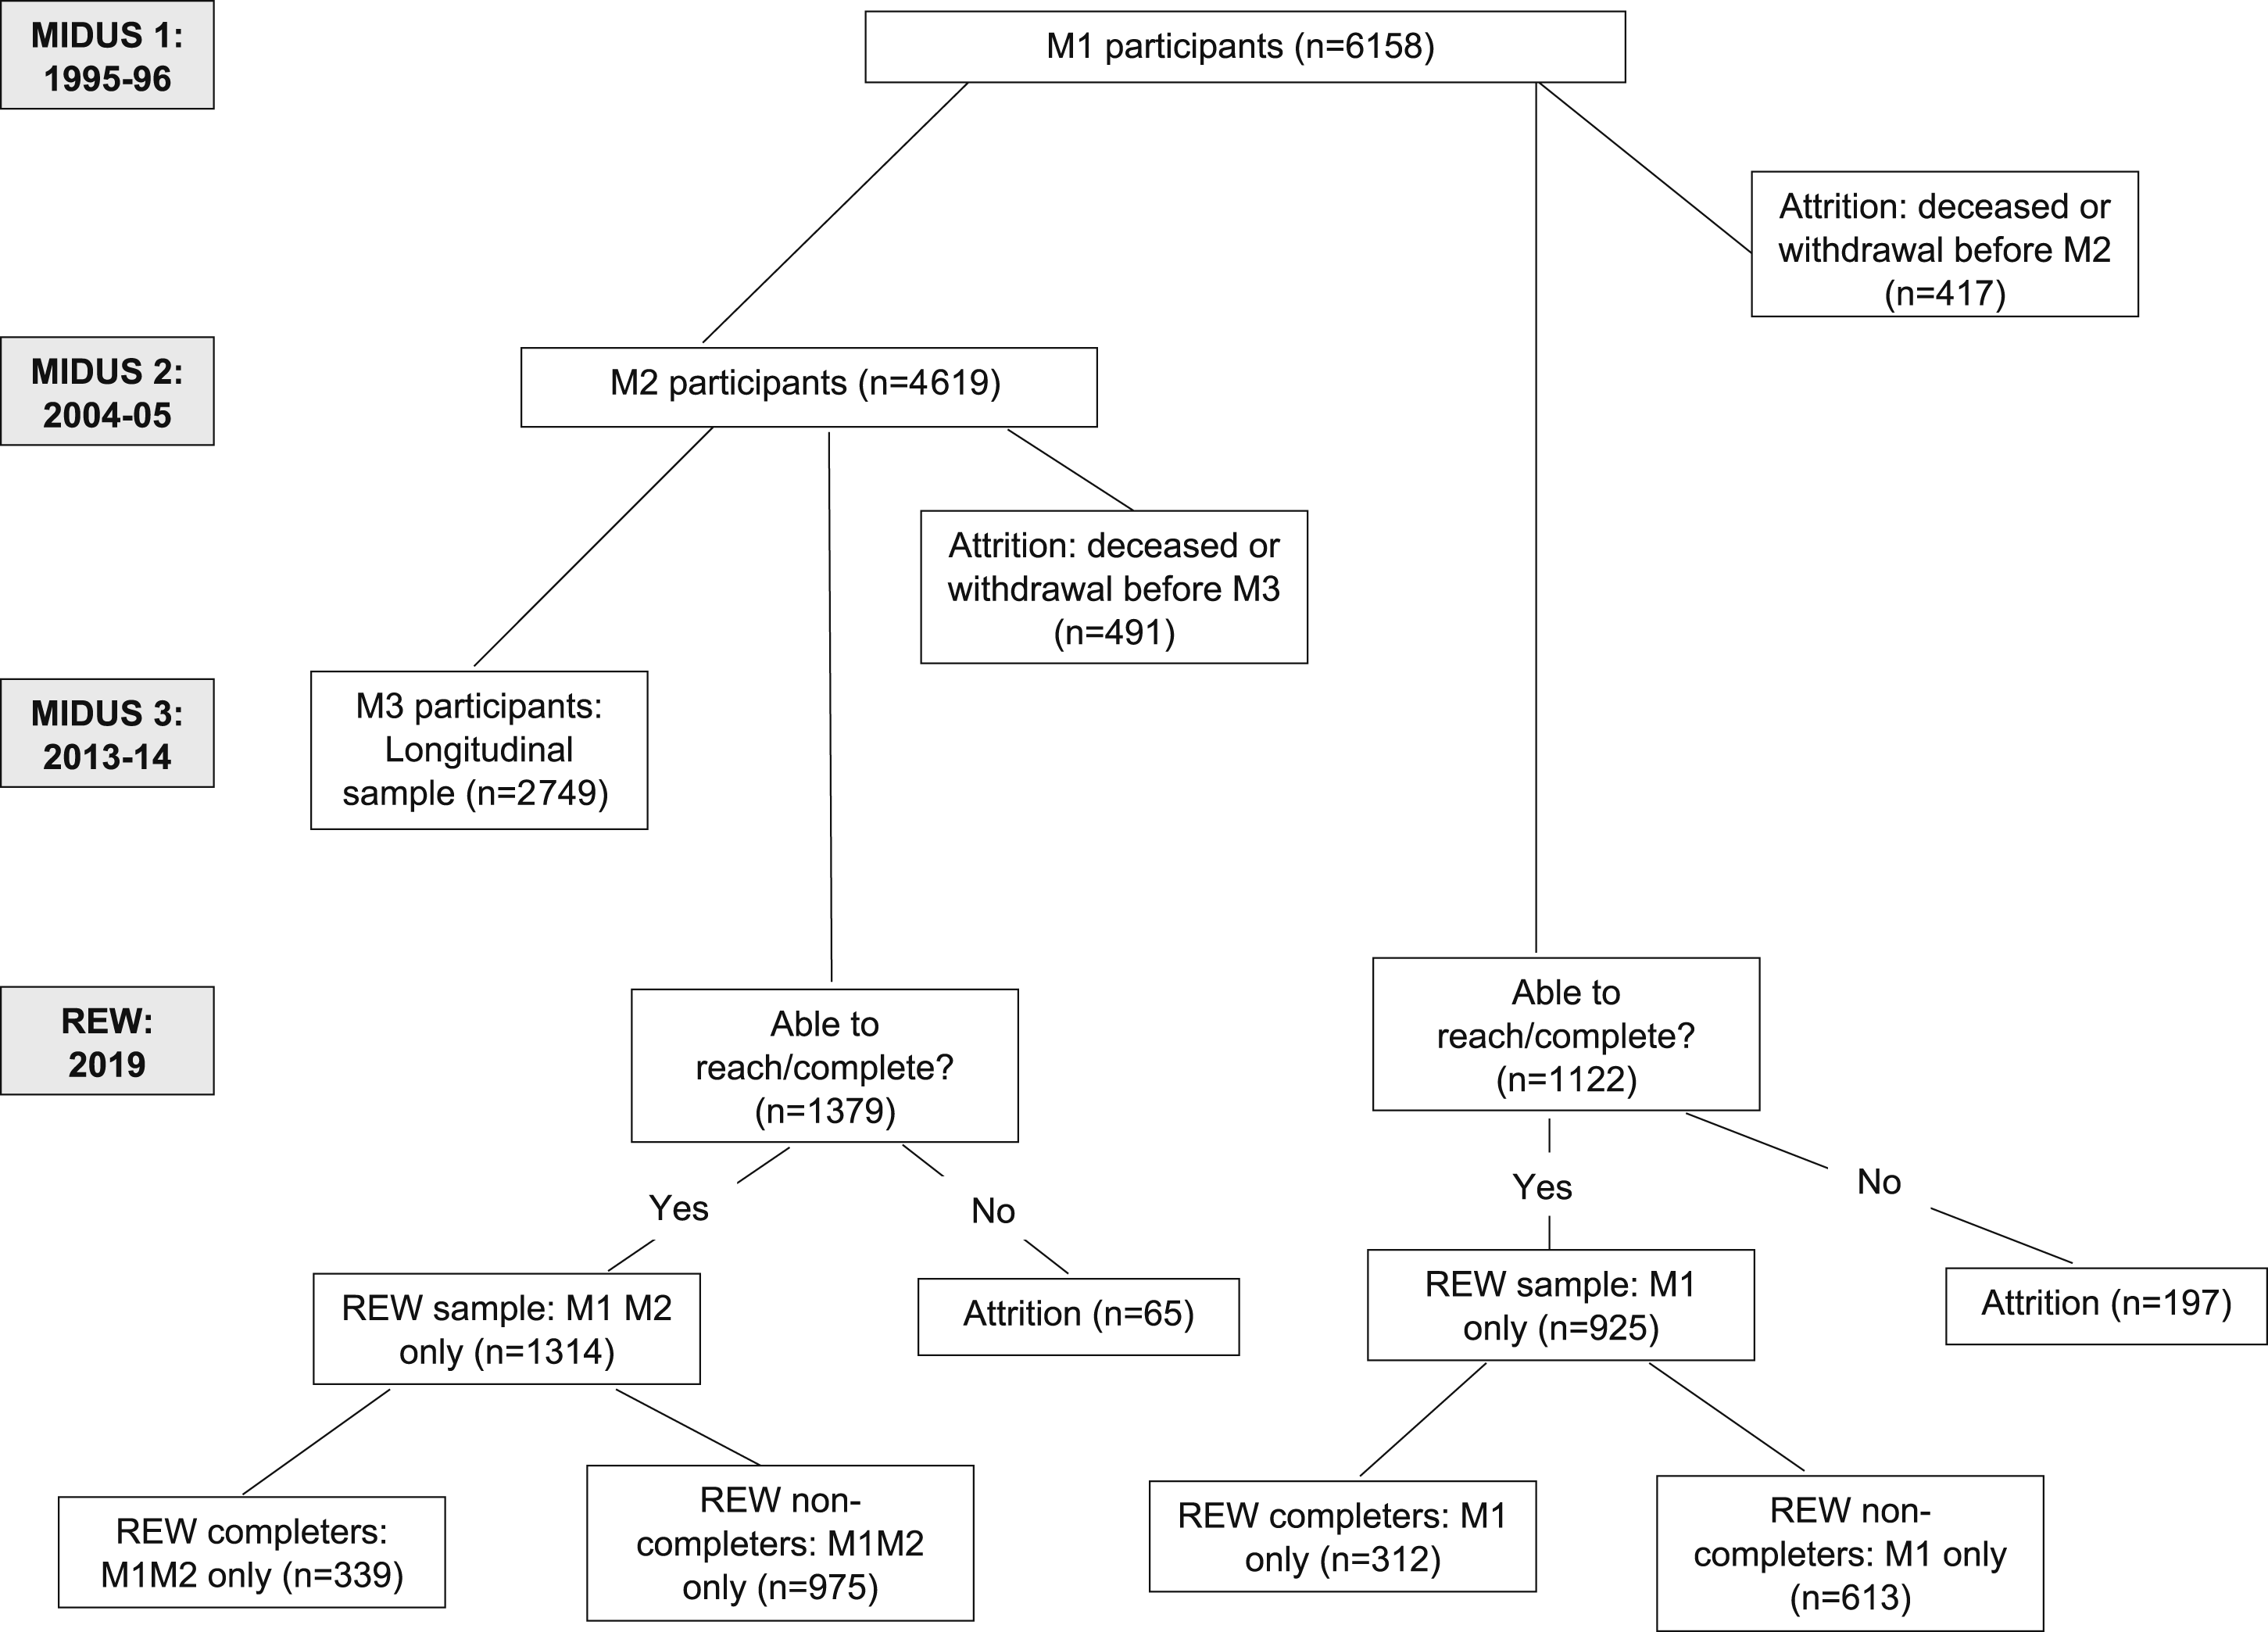
Longitudinal Participation Status: MIDUS 1 (1995–1996), MIDUS 2 (2004–2005), MIDUS 3 (2013–2014), and REW (2019). Note. REW: Retention Early Warning. M1: MIDUS 1, M2: MIDUS 2, M3: MIDUS 3. M1 only: completed M1 and attrited at M2. M1M2 only: completed M1 and M2 and attrited at M3.
Baseline Characteristics
Of 11 subgroups of participation status, 10 groups were included in the following analyses (withdrawal after M1 group was excluded due to small cell size, n = 1). The baseline demographic characteristics (age, gender, education, marital status, and parental status) and health measures (subjective physical and mental health) differed significantly across the groups (Supplemental Table 1). Post-hoc analysis via the Bonferroni test indicated that those who attrited due to death (after either M1 or M2) had the oldest average age among all groups at M1, while the REW samples (both REW completers and REW non-completers) were, on average, the youngest group at M1. The Longitudinal sample was older than the REW samples but younger than the Attrition sample at M1. The proportion of female participants at M1 ranged from 43% to 57% across the participation status groups. The Longitudinal sample had the highest average level of education at M1, followed by the REW samples. Notably, the early attriters, who were lost by M2 (due to death or inability to be contacted or complete the survey), had the lowest average education level at M1. The Longitudinal sample (i.e., those who completed all three waves) and the M3 REW sample (i.e., those who completed two waves (M1 and M2), attrited at M3, and were recruited for the REW project) were more likely to be married at M1 than both the M2 REW sample and M2 attriters (i.e., those who completed only M1). Participants in the Longitudinal sample were less likely to have children at M1 than the attriters who were lost due to death after M1 or M2. Those who attrited after M1, regardless of reason, reported the poorest physical health at M1. Finally, the Longitudinal sample reported better (subjective) mental health at M1 than the REW non-completers, the combined group of M2 attriters (all reasons), and M3 attriters due to death.
Predictors of Longitudinal Participation Status in Six Participation Groups
Results of multinomial logistic regression analysis predicting membership of MIDUS participation status groups revealed that similar patterns of significant predictors of longitudinal participation, compared to the Longitudinal sample, were found in the REW completers groups (M1 only and M1M2 only), the REW non-completers groups (M1 only and M1M2 only), the Attrition at M2 groups (M1 only due to death or M1 only due to non-death) and the Attrition at M3 due to death, and the Attrition at M3 due to non-death groups (M1M2 only due to inability to reach/complete or withdrawal) (Supplemental Table 2). Based on the similarity of subgroup patterns, a simplified set of six groups became the focus for subsequent analyses: Longitudinal sample (n = 2749), REW completers (n = 651), REW non-completers (n = 1588), Attrition at M2 (n = 613), Attrition at M3 due to death (n = 442), and Attrition at M3 due to non-death (n = 114).
Figures 2–8 illustrate mean values (or percentages) of the six participation status groups for specific demographic and health variables at M1. The results of the post-hoc analyses via the Bonferroni test are presented below the figure. Age at MIDUS 1 by participation status group (mean = 46.0, 95% CI = [45.6, 46.3], SD = 13.0). Results from post-hoc analyses are presented below the figures. M1: MIDUS 1 (1995–1996), M2: MIDUS 2 (2004–2005), M3: MIDUS 3 (2013–2014). REW: Retention Early Warning (2019). CI = confidence interval. Percent of female participants at MIDUS 1 by participation status group (mean = 51.1%, 95% CI = [49.9, 52.4]). Results from post-hoc analyses are presented below the figures. M1: MIDUS 1 (1995–1996), M2: MIDUS 2 (2004–2005), M3: MIDUS 3 (2013–2014). REW: Retention Early Warning (2019). CI = confidence interval. Educational attainment at MIDUS 1 by participation status group (mean = 13.8, 95% CI = [13.8, 13.9], SD = 2.6). Results from post-hoc analyses are presented below the figures. M1: MIDUS 1 (1995–1996), M2: MIDUS 2 (2004–2005), M3: MIDUS 3 (2013–2014). REW: Retention Early Warning (2019). CI = confidence interval. Marital status at MIDUS 1 by participation status group (mean = 64.6%, 95% CI = [63.4, 65.8]). Results from post-hoc analyses are presented below the figures. M1: MIDUS 1 (1995–1996), M2: MIDUS 2 (2004–2005), M3: MIDUS 3 (2013–2014). REW: Retention Early Warning (2019). CI = confidence interval. Parental status at MIDUS 1 by participation status group (mean = 81.1%, 95% CI = [80.2, 82.1]). Results from post-hoc analyses are presented below the figures. M1: MIDUS 1 (1995–1996), M2: MIDUS 2 (2004–2005), M3: MIDUS 3 (2013–2014). REW: Retention Early Warning (2019). CI = confidence interval. Subjective Physical Health at MIDUS 1 by participation status group (mean = 3.5, 95% CI = [3.50, 3.55], SD = 1.0). Results from post-hoc analyses are presented below the figures. M1: MIDUS 1 (1995–1996), M2: MIDUS 2 (2004–2005), M3: MIDUS 3 (2013–2014). REW: Retention Early Warning (2019). CI = confidence interval. Subjective Mental Health at MIDUS 1 by participation status group (mean = 3.8, 95% CI = [3.74, 3.79], SD = 1.0). Results from post-hoc analyses are presented below the figures. M1: MIDUS 1 (1995–1996), M2: MIDUS 2 (2004–2005), M3: MIDUS 3 (2013–2014). REW: Retention Early Warning (2019). CI = confidence interval.
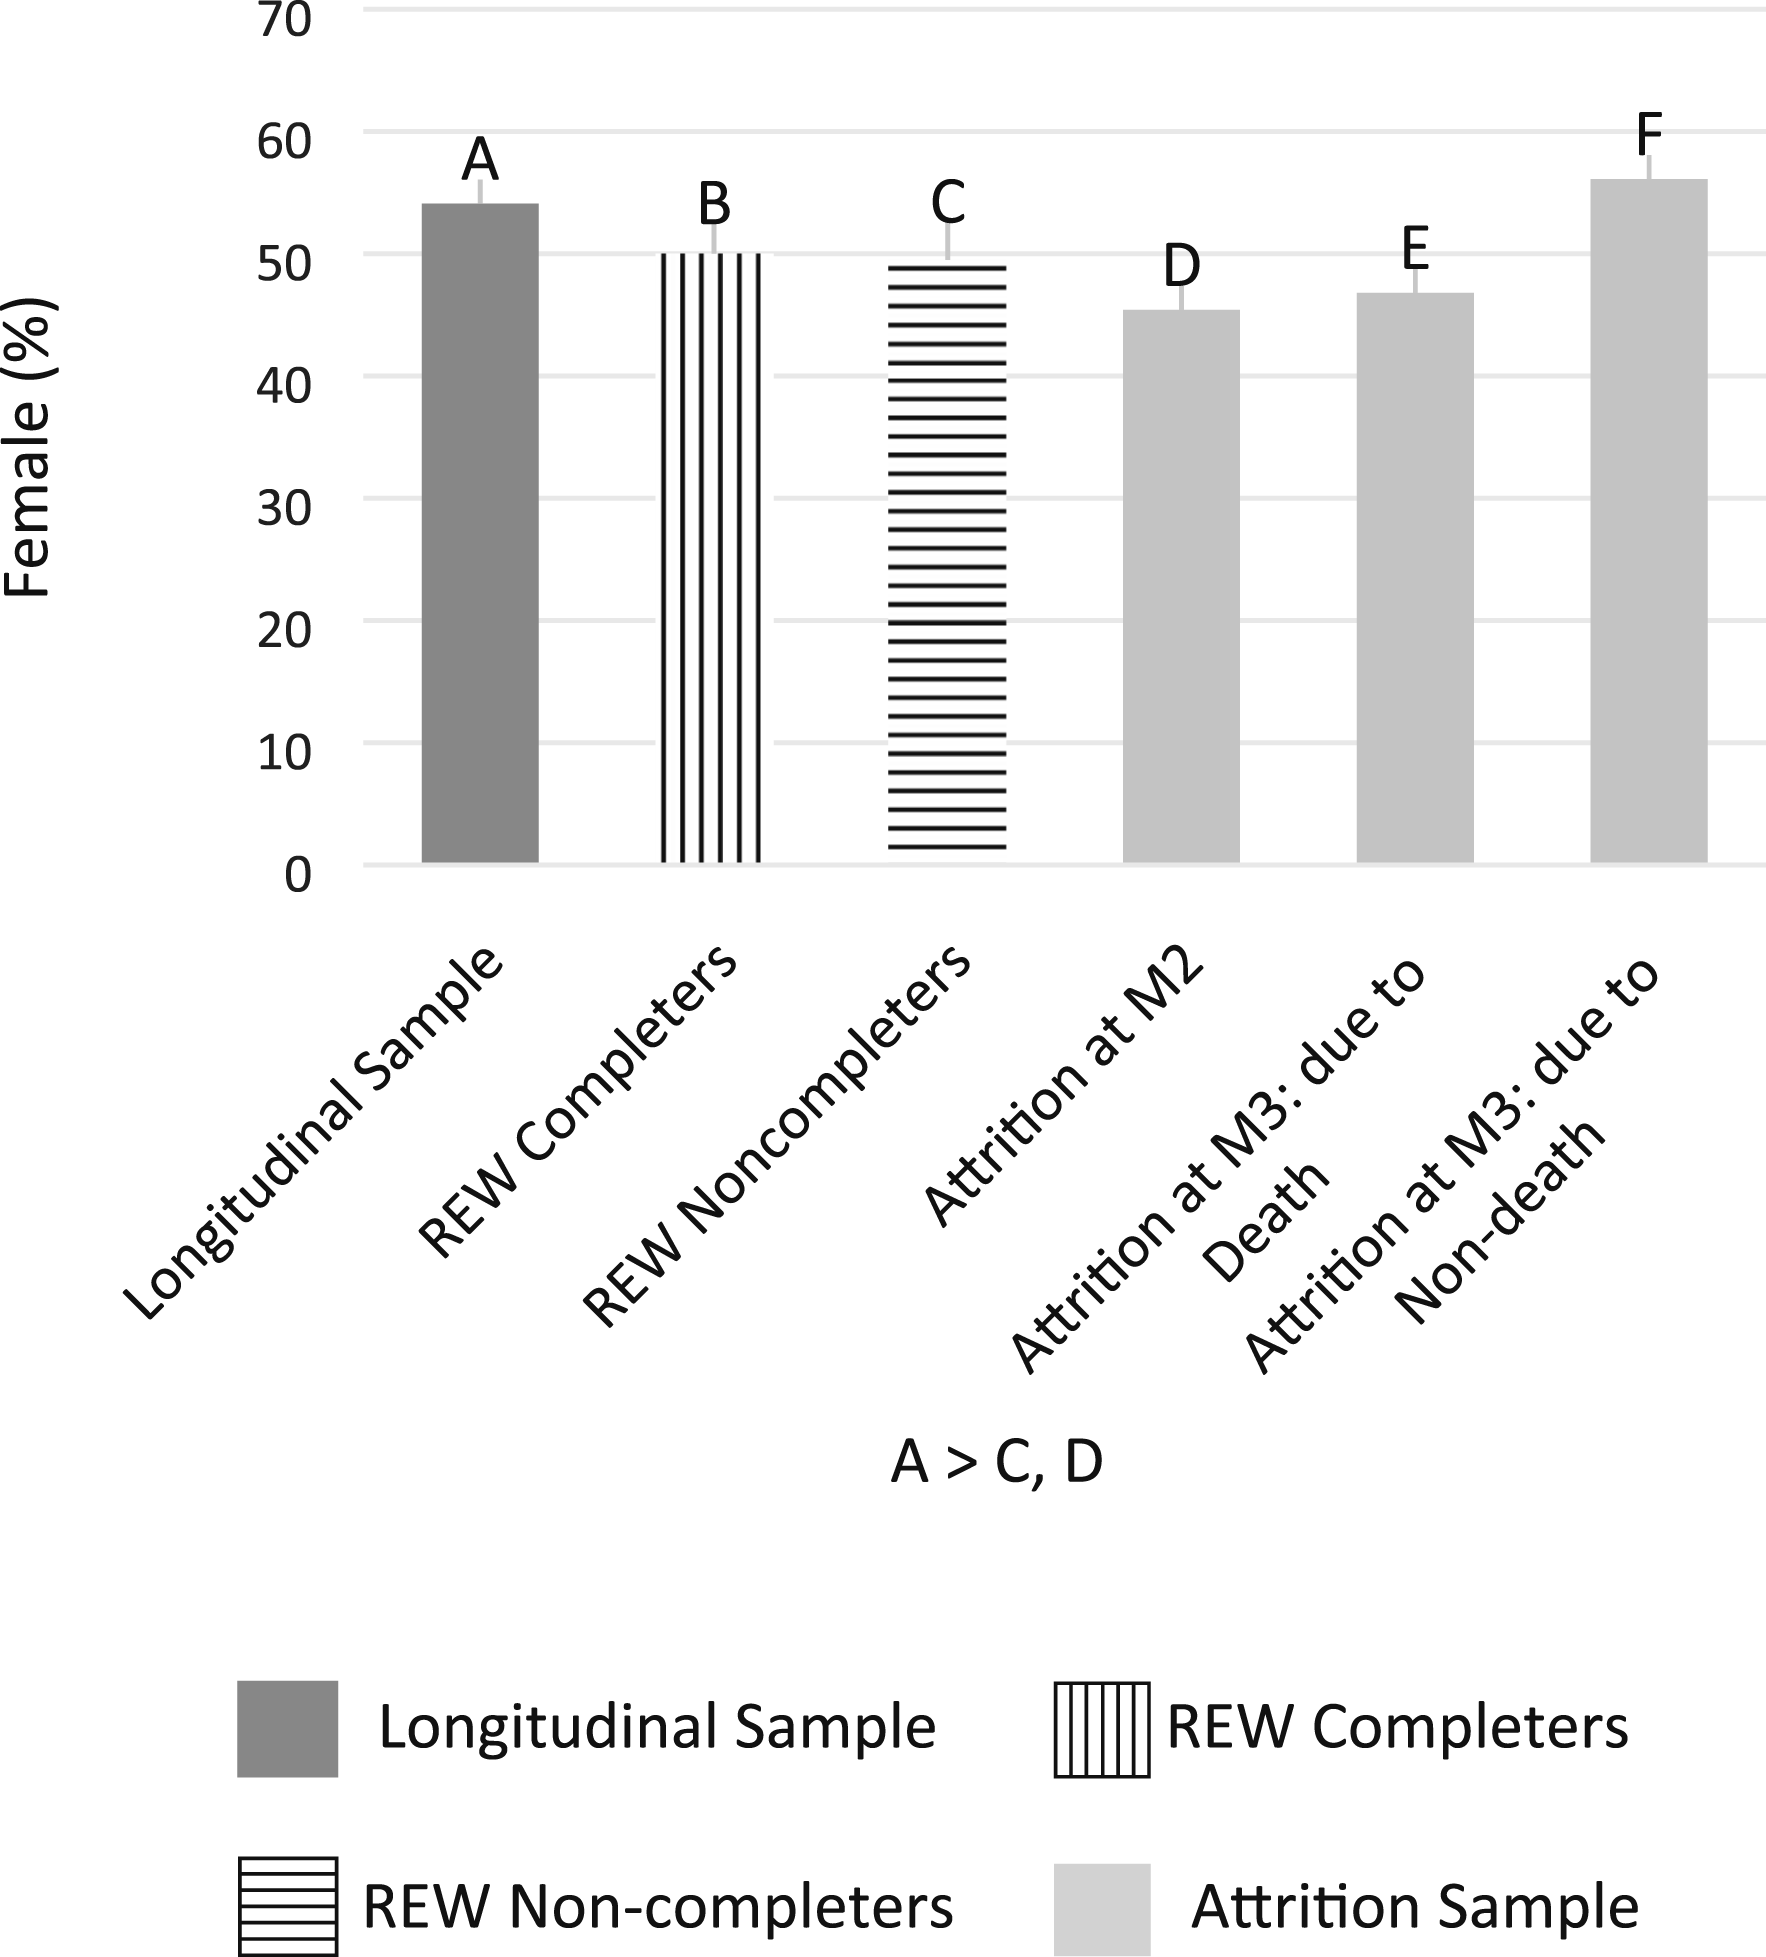
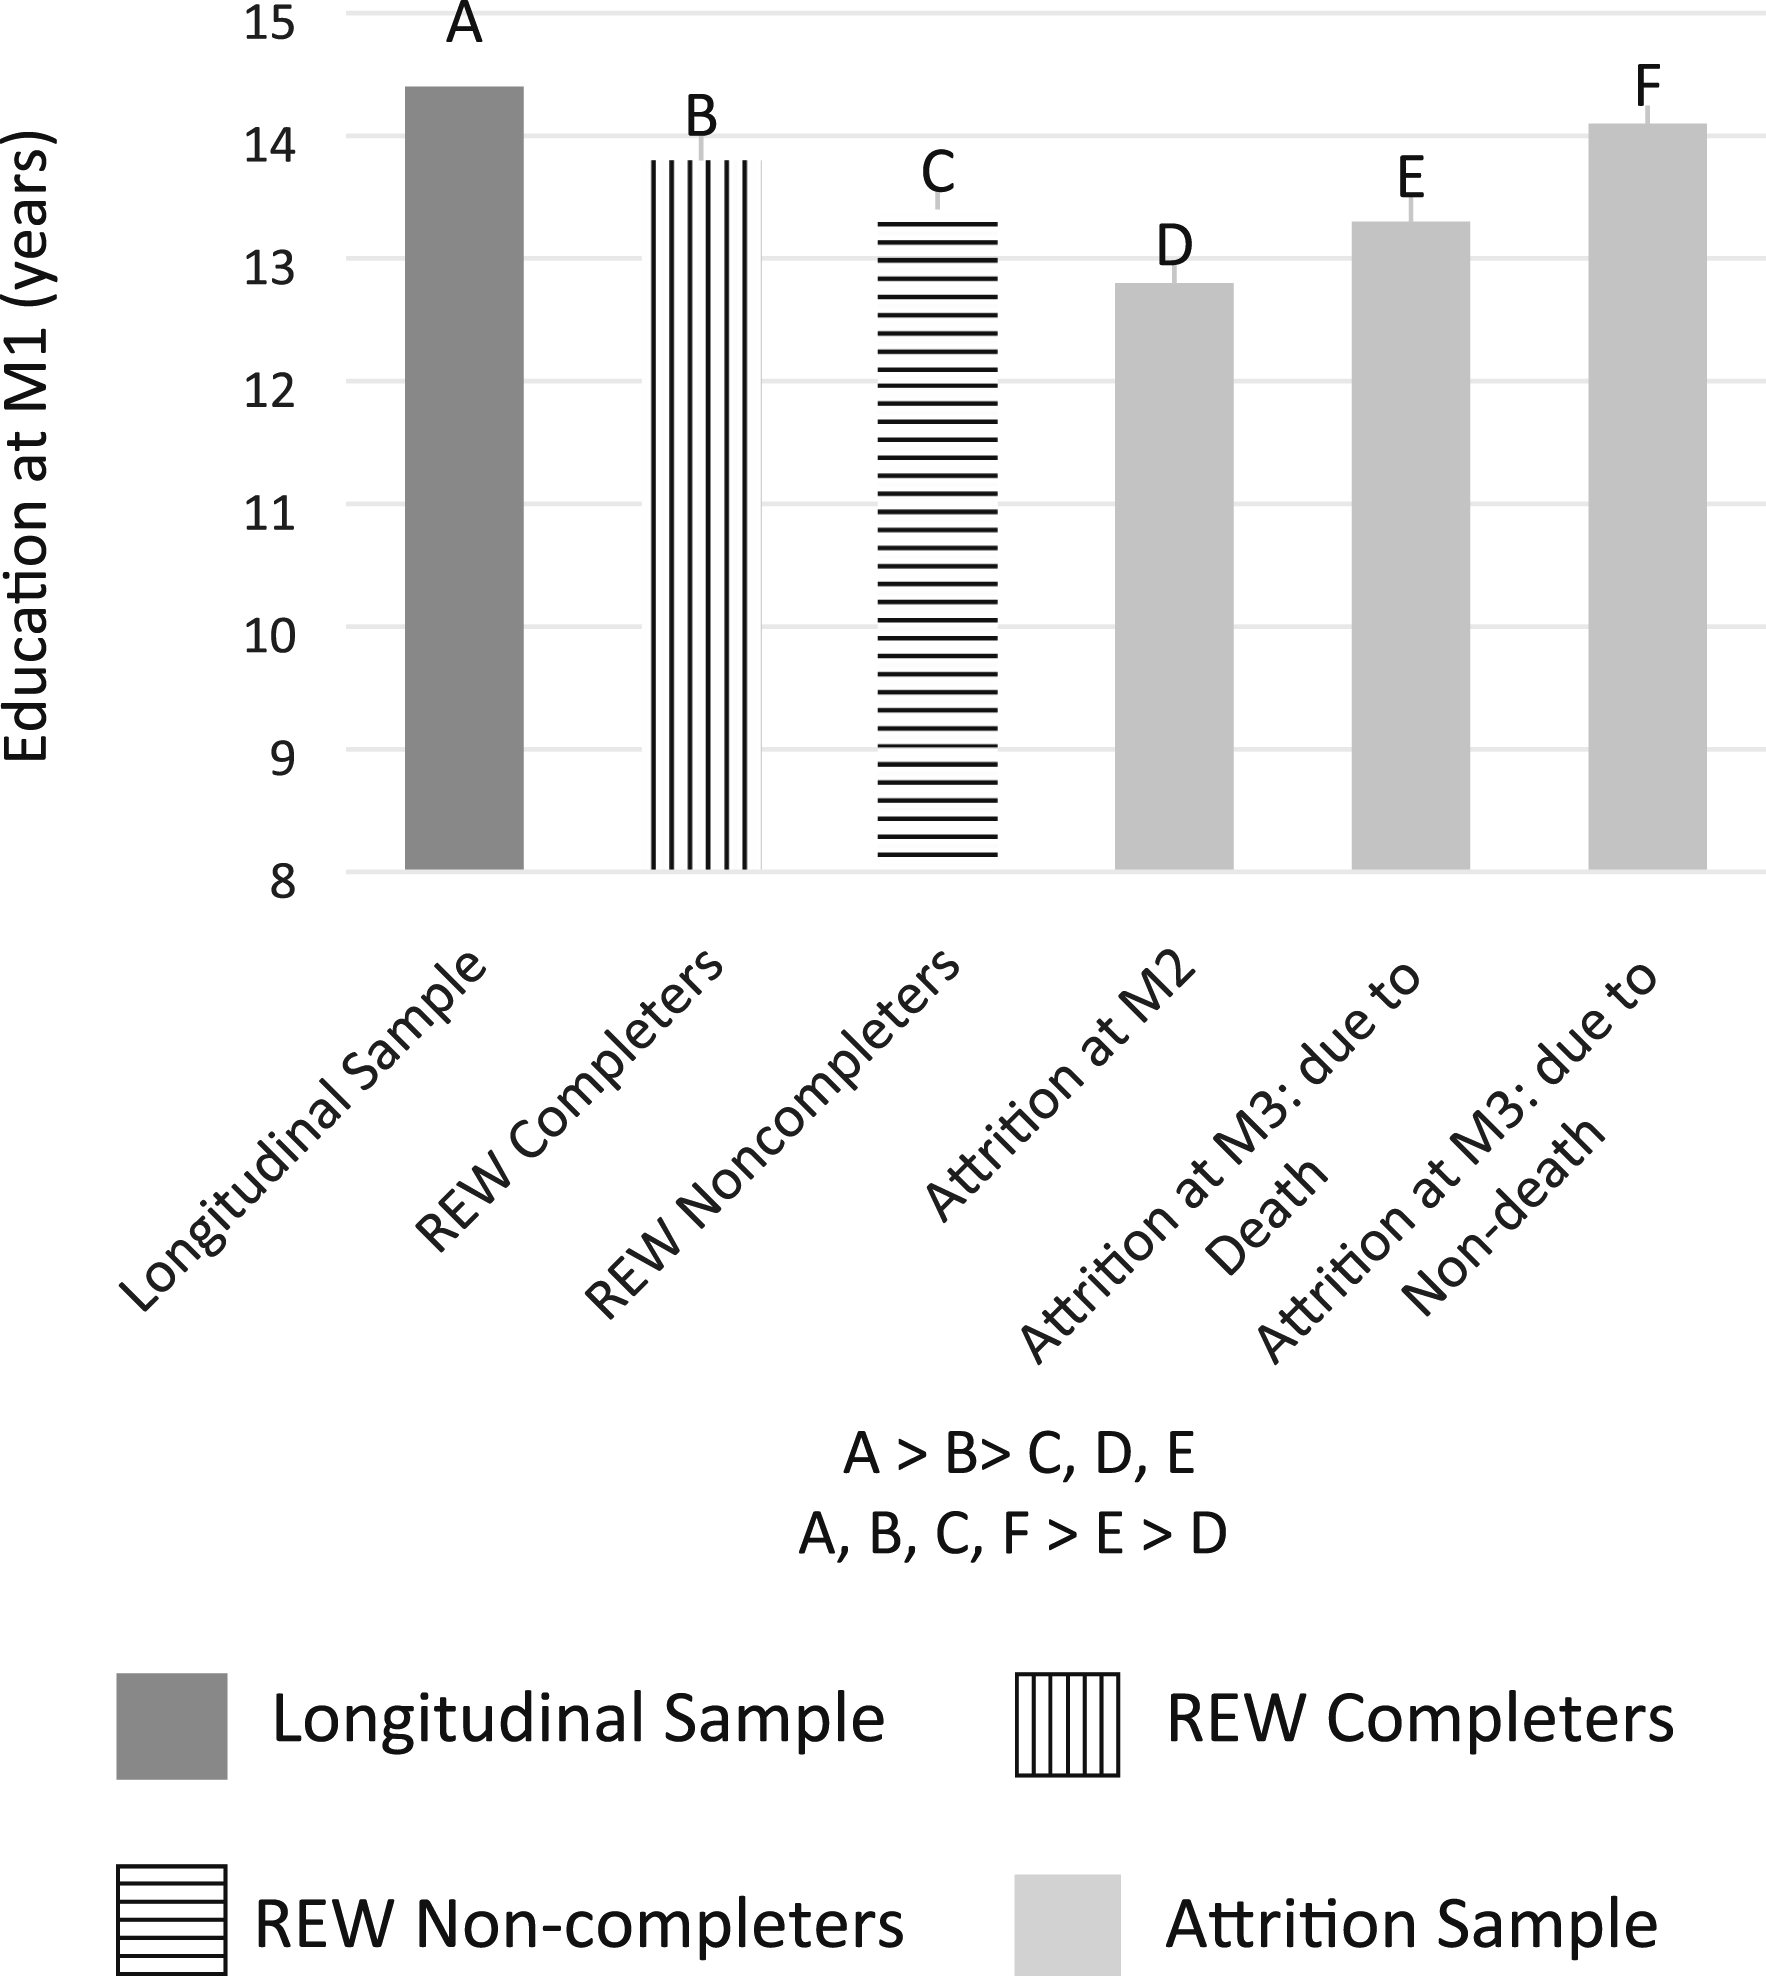
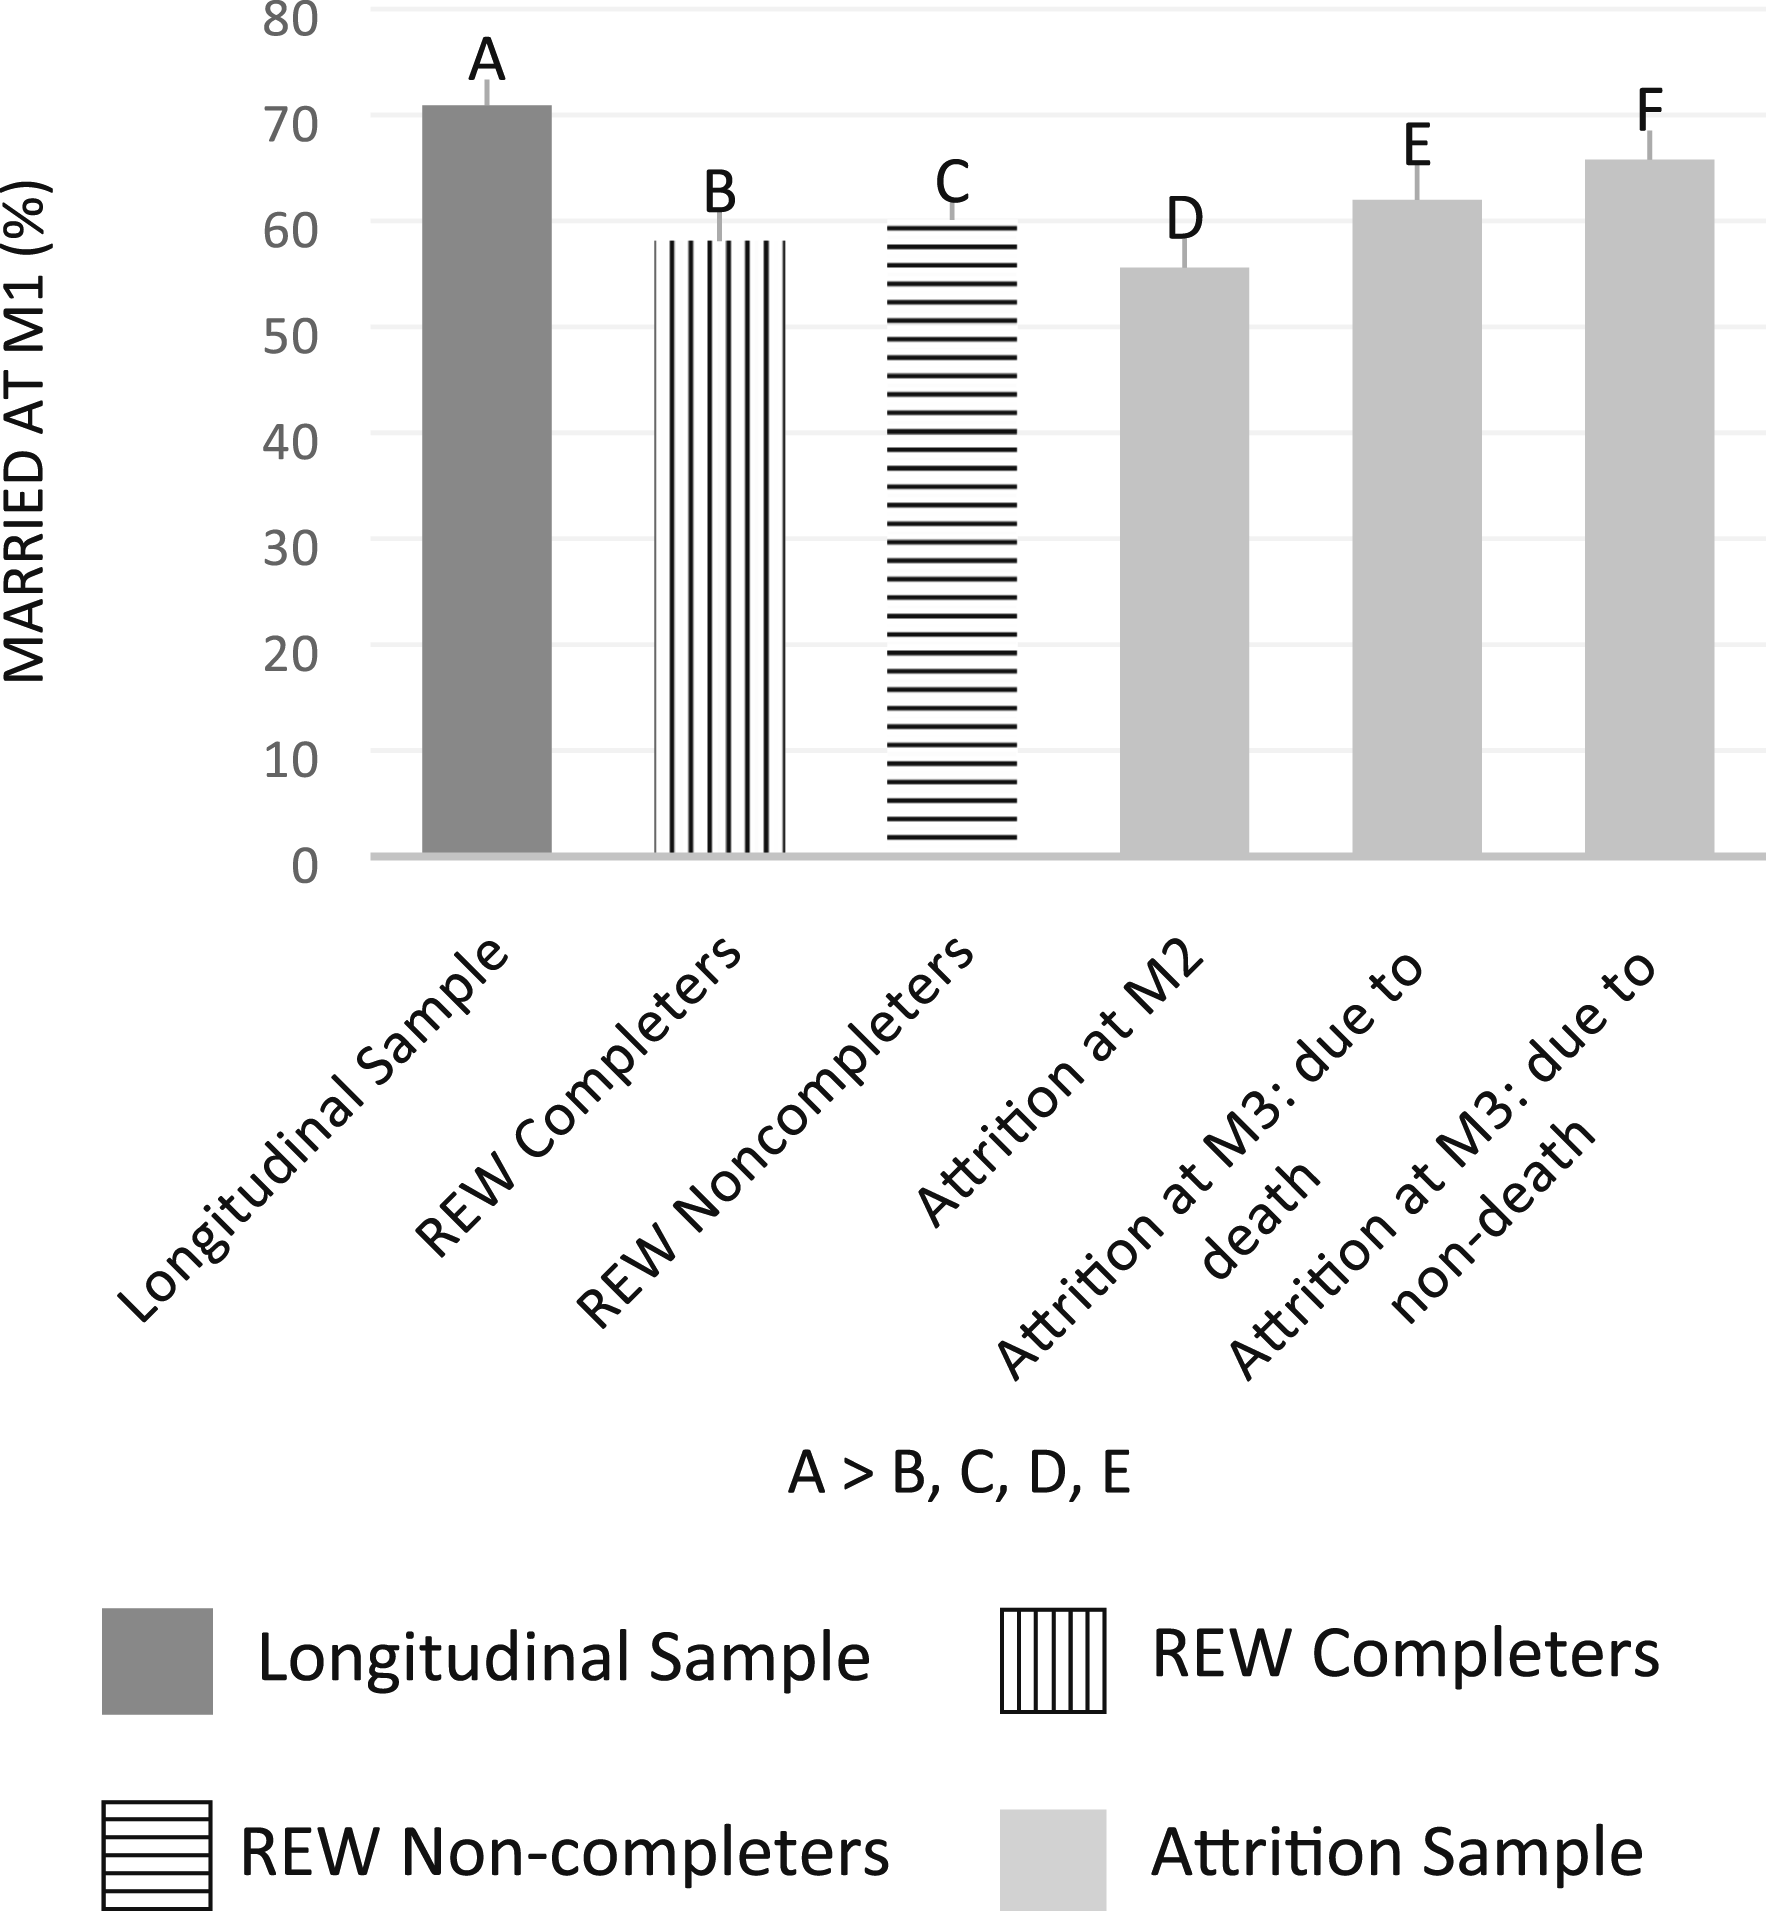
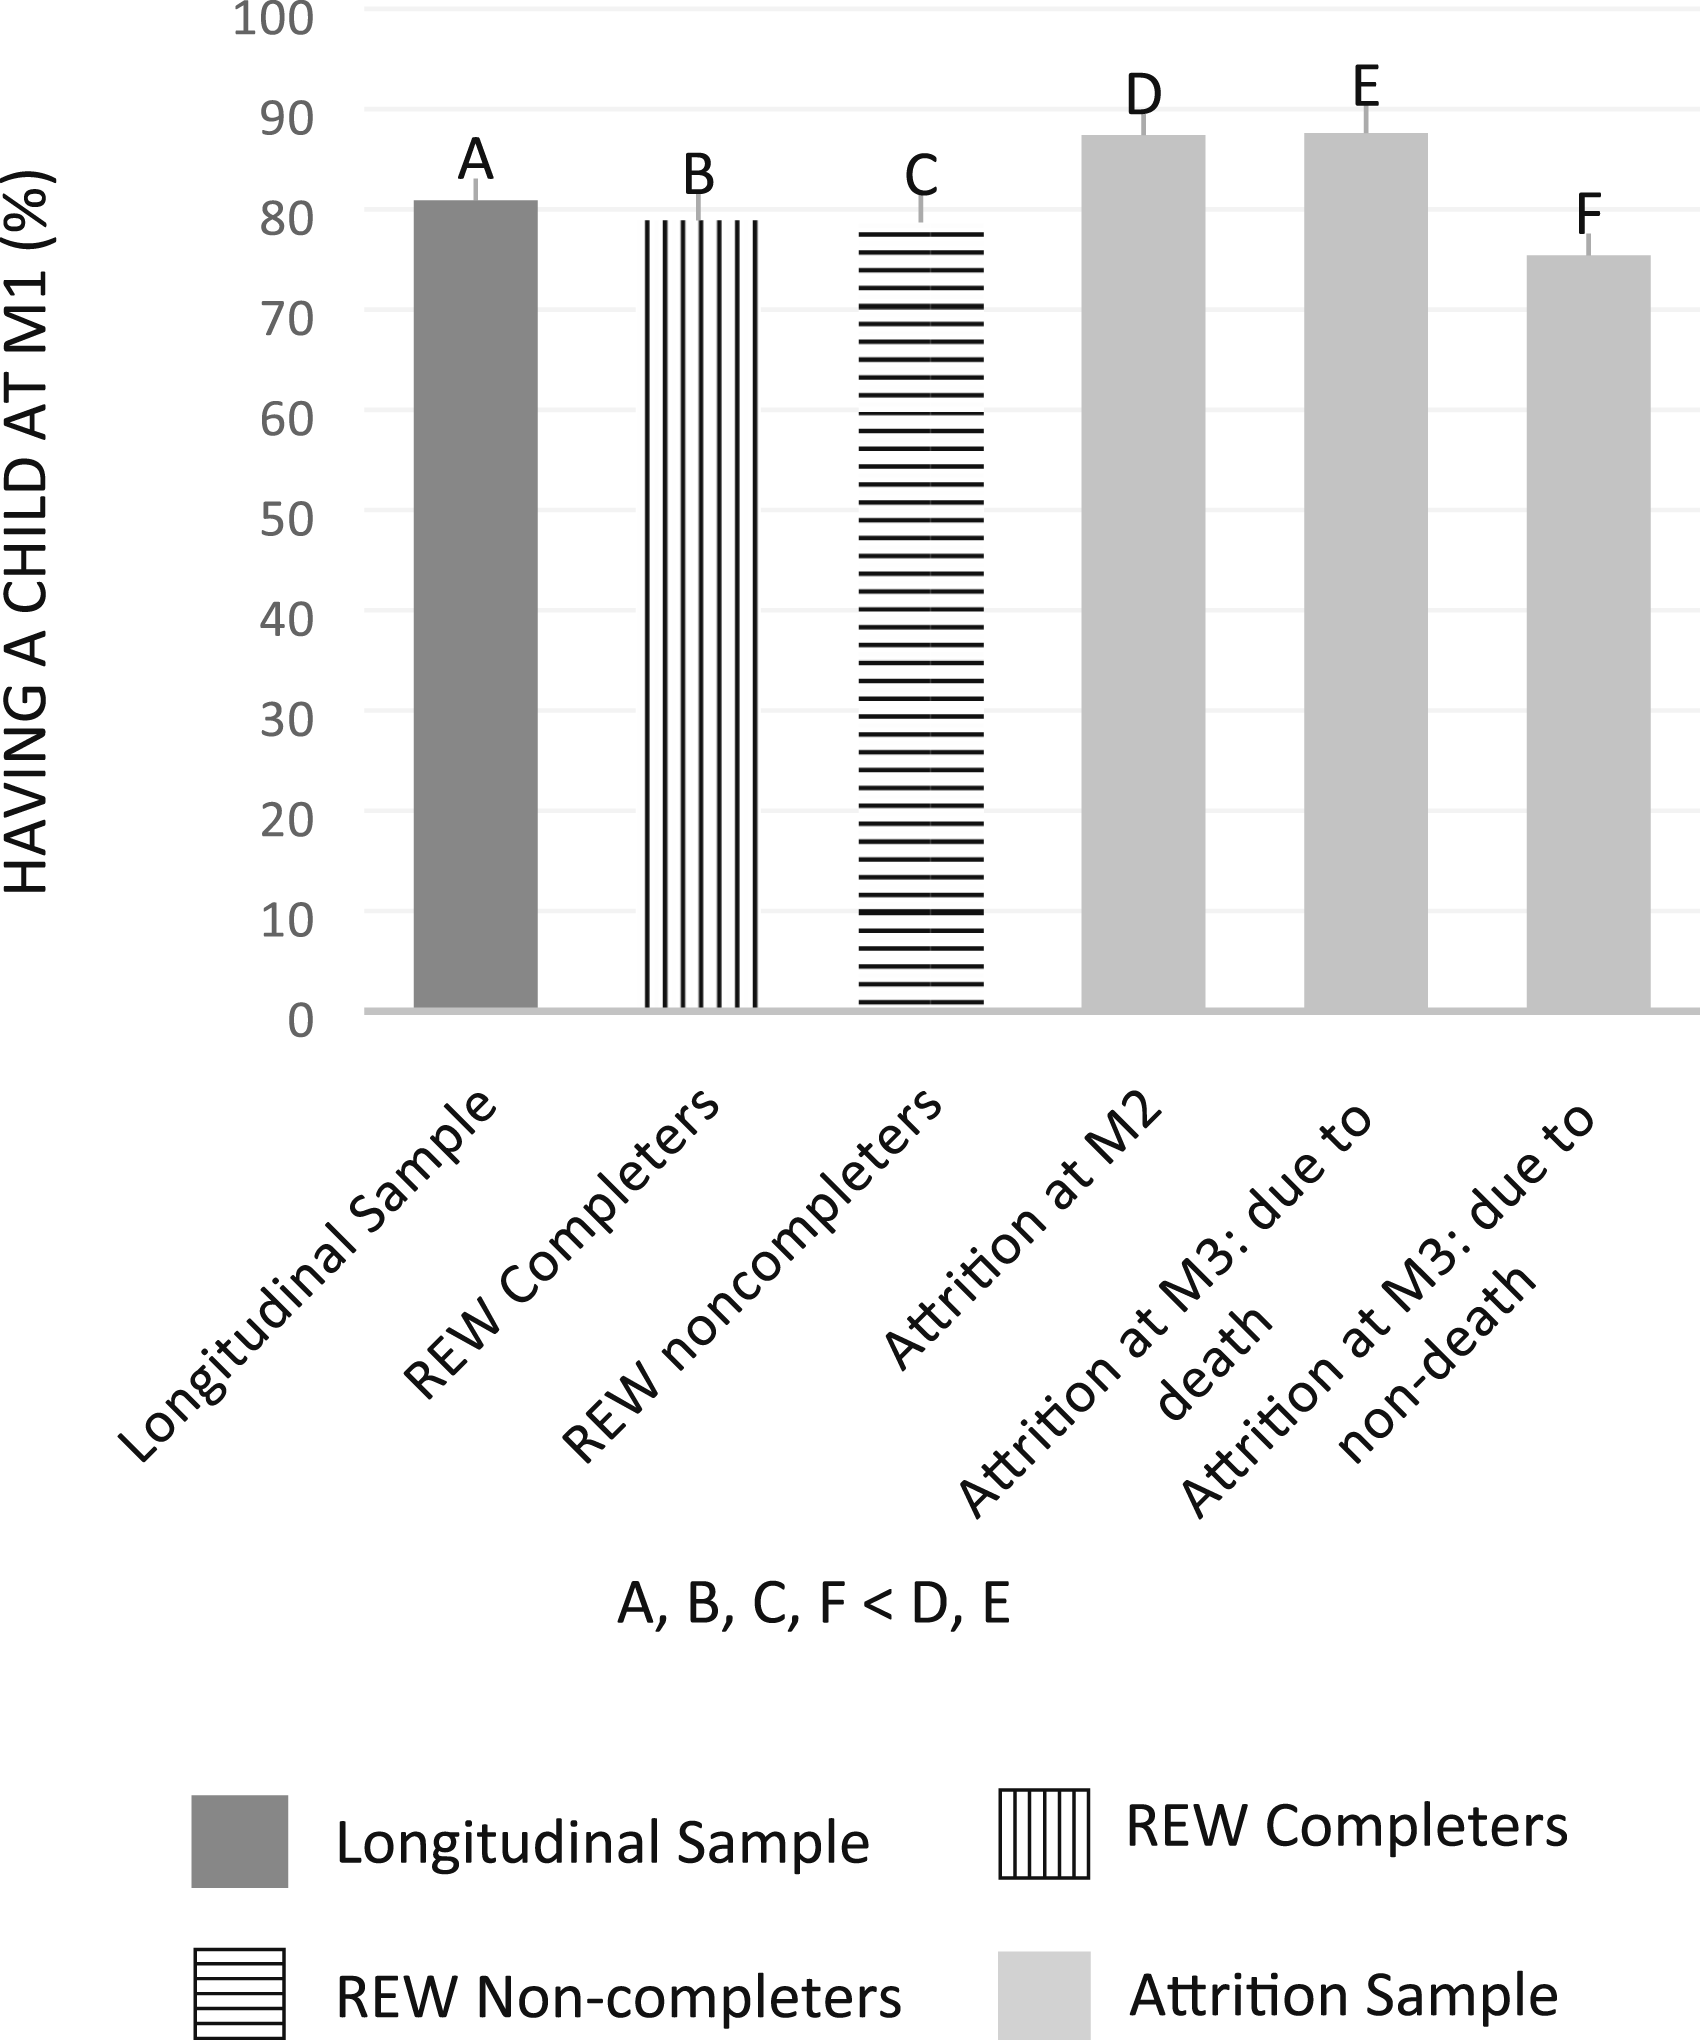
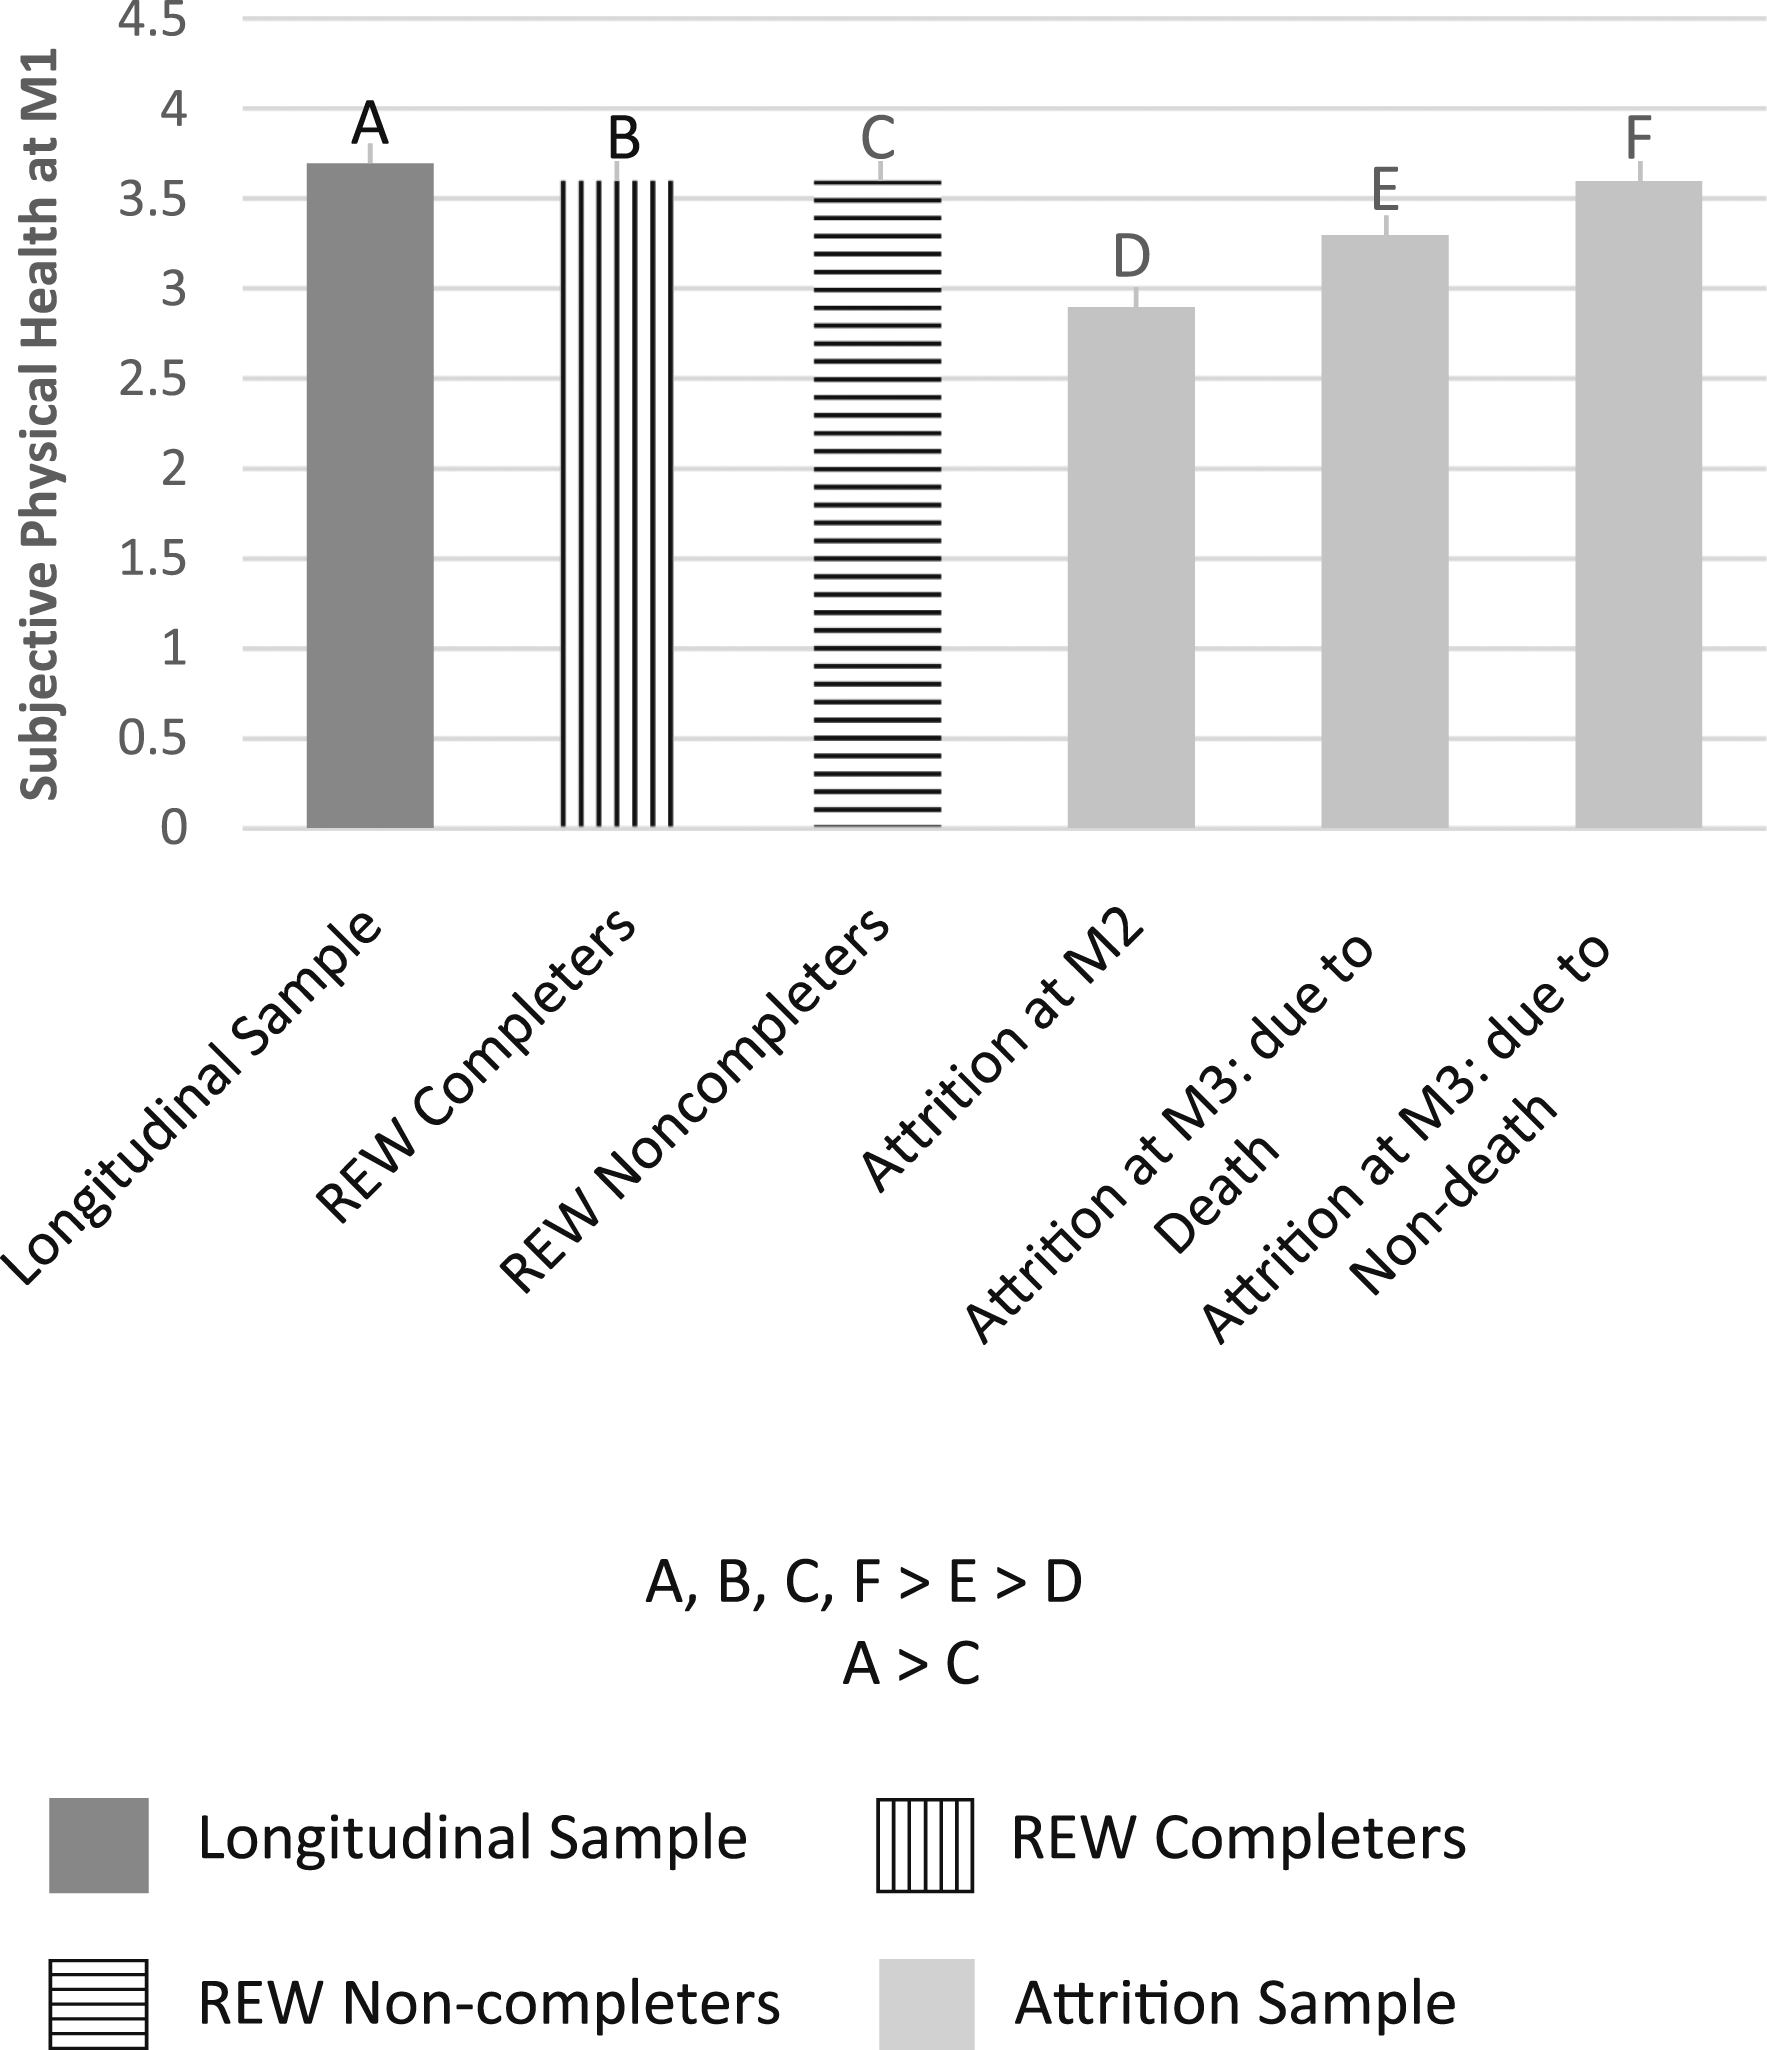
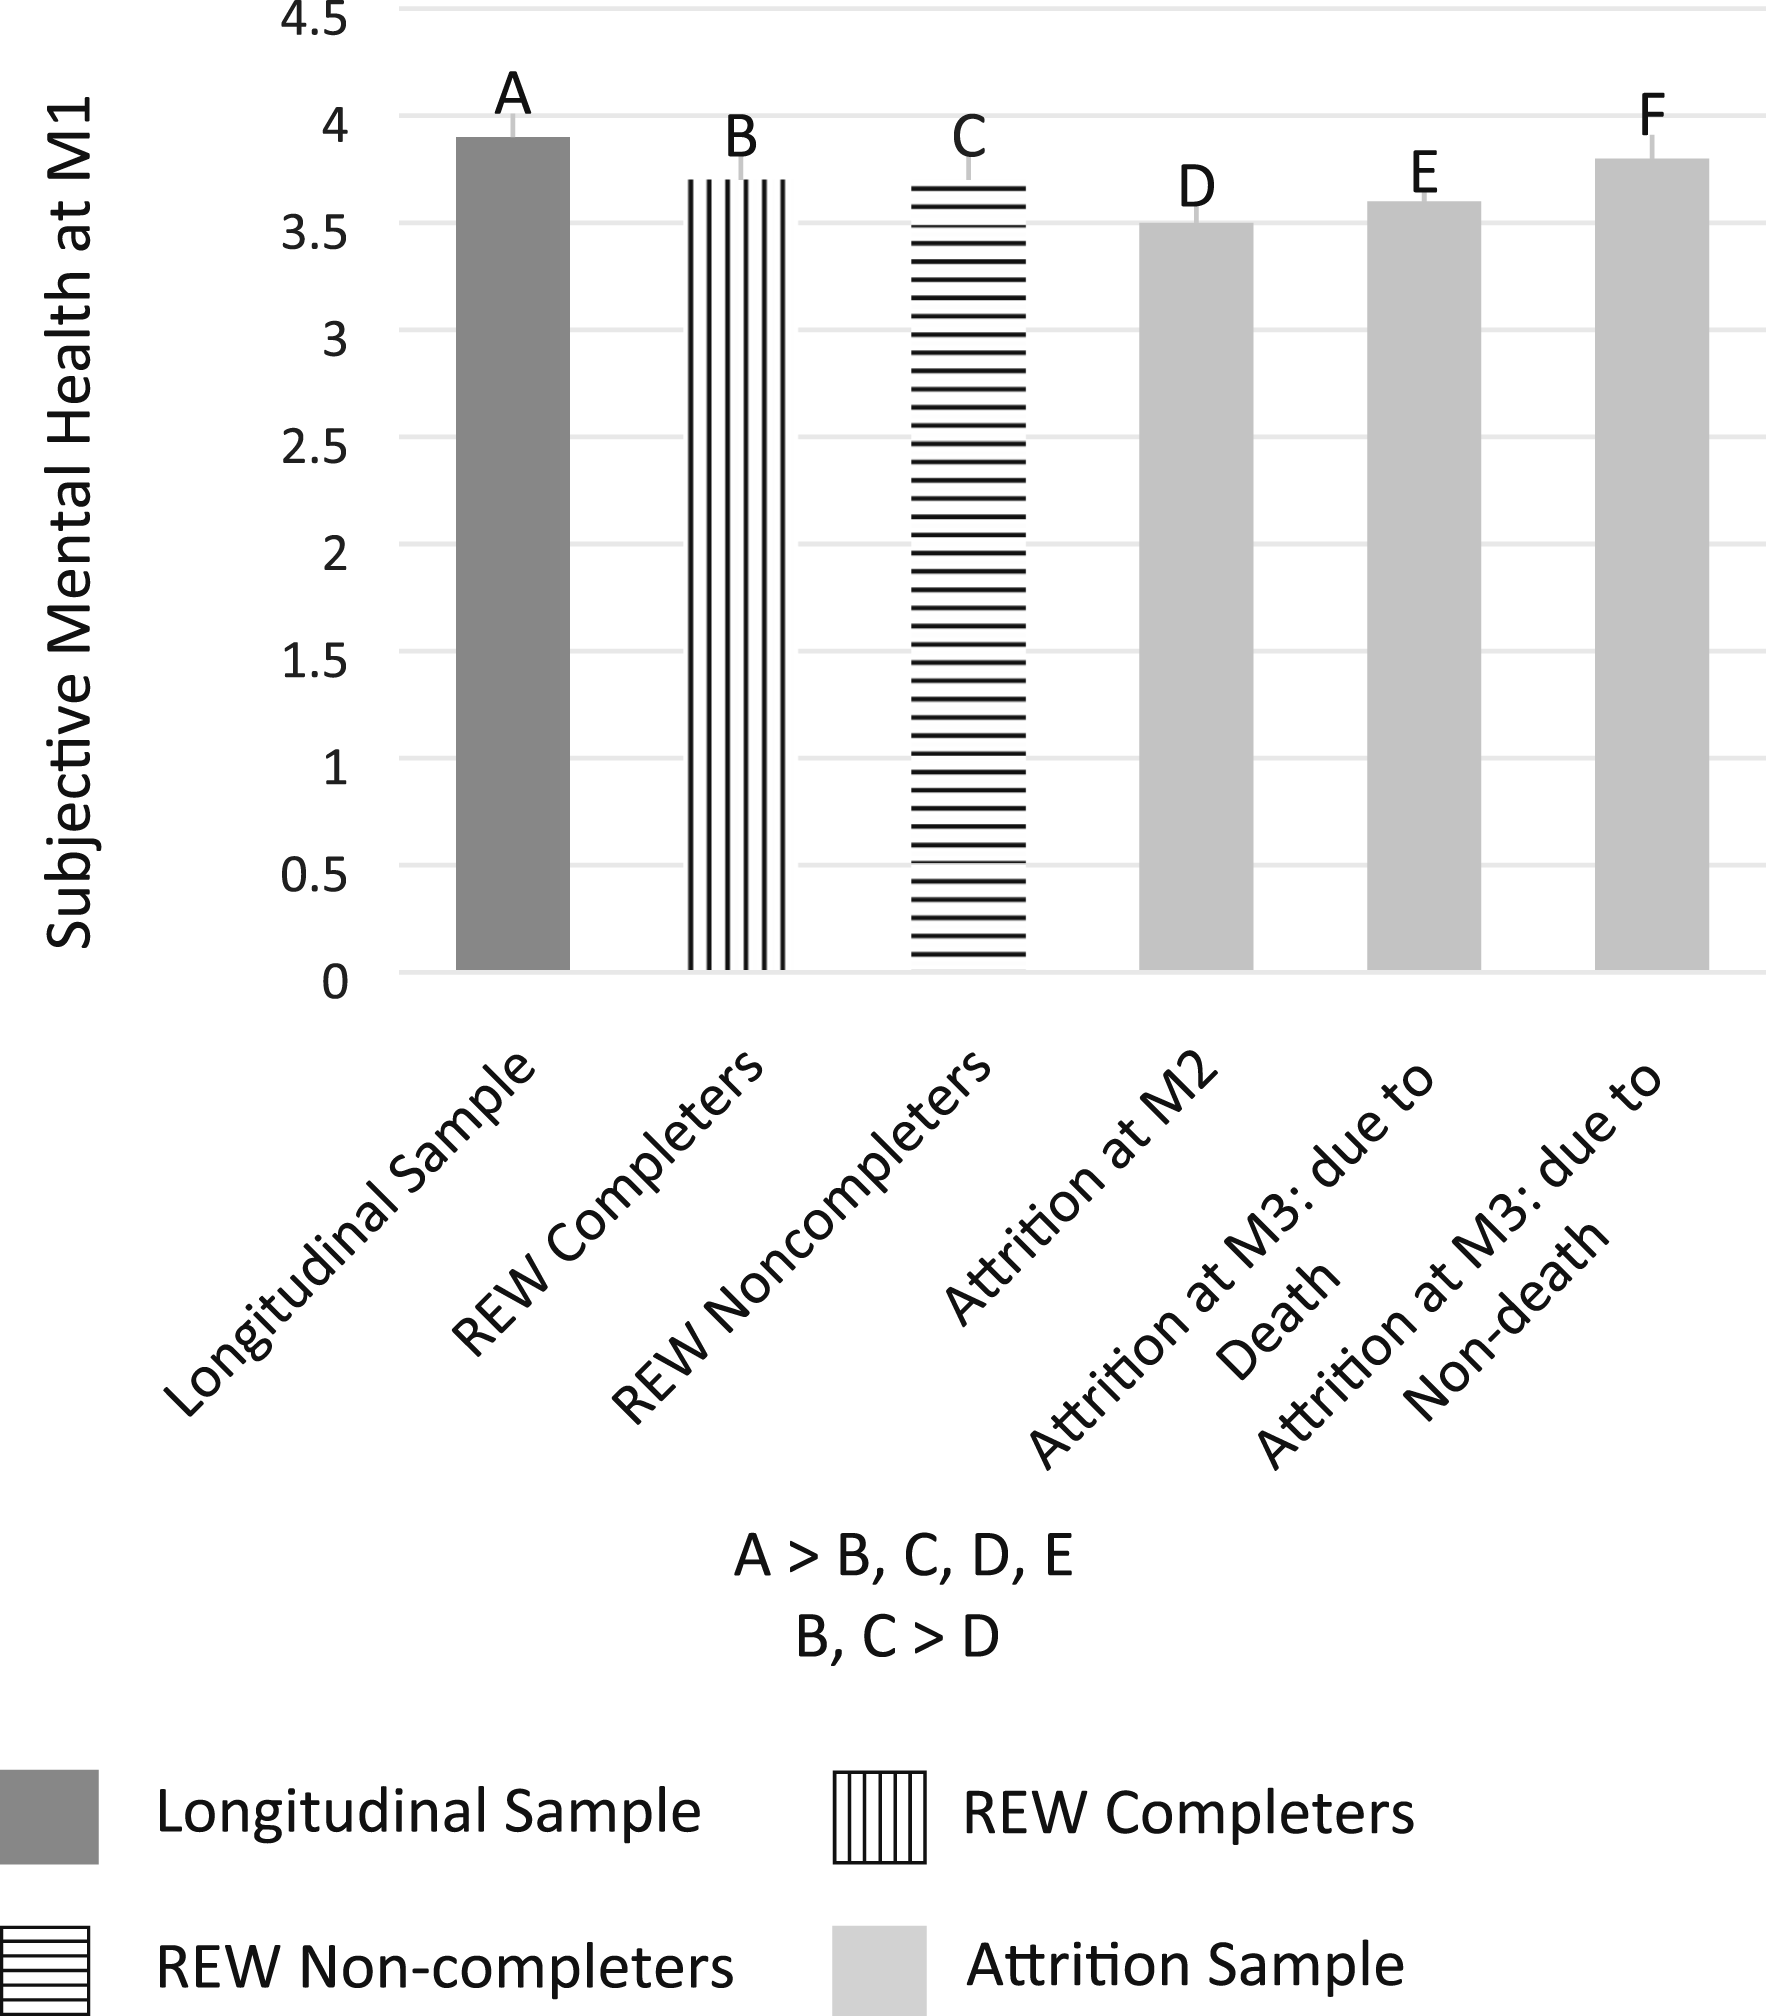
Figure 2 illustrates the average age for each group at M1. The REW completers were the youngest among the participants at M1. On the other hand, the Attrition samples (Attrition at M2 and Attrition at M3) groups were older than the Longitudinal sample and REW sample at M1. Figure 3 illustrates the gender distribution for each group by reporting the percentage of female participants. The results of the post-hoc analyses showed that the proportion of female was higher in the Longitudinal sample than in the REW non-completers and the Attrition at M2 groups. Figure 4 illustrates average educational attainment (by years) of the participants at M1 for each group. The Longitudinal sample had the highest level of education among the participants at M1. The REW completers had lower levels of education than the Longitudinal sample, but higher levels of education relative to the REW non-completers, the Attrition at M2, and the Attrition at M3 due to non-death groups.
Figure 5 illustrates marital status (married vs. unmarried) of the participants at M1 for each group. The Longitudinal sample was more likely to be married than the REW completers, the REW non-completers, the Attrition at M2, and the Attrition at M3 due to non-death groups. Figure 6 illustrates parental status of the participants (having at least one child vs. no child) at M1 for each group. The M2 Attrition and M3 Attrition due to death cases were more likely to have any children at M1 than the other four groups.
Figure 7 presents average levels of subjective physical health for each group at M1. Notably, the Attrition at M2 group had the poorest physical health at M1. The Longitudinal sample, the REW sample (both REW completers and REW non-completers), and the Attrition at M3 due to non-death groups had better physical health at M1 relative to the Attrition at M2 and the Attrition at M3 due to death groups. Figure 8 presents average levels of subjective mental health for each group at M1. The Longitudinal sample had higher levels of subjective mental health at M1 than other groups, except for the Attrition at M3 due to non-death group. In addition, the REW sample (both REW completers and REW non-completers) had higher levels of subjective mental health at M1 than the Attrition at M2 group.
Integrative Analyses
Multinomial Logistic Regression Model Predicting Membership of Participation Status Groups: Longitudinal Sample (reference), REW Completers, REW Non-Completers, Attrition at M2, Attrition at M3 Due to Death, and Attrition at M3 Due to Non-Death.

Notes. M1: MIDUS 1 (1995–1996). M2: MIDUS 2 (2004–2005). M3: MIDUS 3 (2013–2014). REW: Retention Early Warning (2019). REW completers: completed M1 (or M1 and M2), attrited at M2 (or M3), but reinstated at REW. REW non-completers: completed M1 (or M1 and M2), attrited at M2 (or M3), and recruited for REW but reinstatement failed. Attrition at M2 (due to death or unable to reach): completed M1, attrited M2, not recruited for REW due to death or unable to reach. Attrition at M3 due to death: completed M1 and M2, attrited at M3, not recruited for REW due to death after M3. Attrition at M3 due to non-death (withdrawal or unable to reach): completed M1 and M2, attrited at M3, not recruited for REW due to withdrawal after M2 or unable to reach.
*p ≤ .05; ** p ≤ .01; *** p ≤ .001.
The Attrition at M2 (either due to death or non-death) and the Attrition at M3 due to death groups were older, more likely to be male and unmarried, and had lower levels of education and poorer subjective physical health at M1 relative to the Longitudinal sample. The Attrition at M3 due to non-death group (either being unable to reach/complete or withdrawal) was older and more likely to be childless than the Longitudinal sample at M1.
Discussion
The purpose of the present study was to describe a major effort, known as the Retention Early Warning (REW) project, to reinstate dropouts in the MIDUS longitudinal study of aging. Using proven methods to bring participants back, we were successful in reinstating 651 participants who had left the study at the 2nd or 3rd wave. This constituted 31.4% of the living dropouts. More importantly, the reinstatement of these participants increased the extant longitudinal sample in MIDUS by 19% (from n = 2749 to n = 3400). Given the widespread usage of MIDUS by the scientific community, these sample refinements will benefit many ongoing areas of inquiry.
We framed the reinstatement initiative in the context of previous research on retention and attrition in longitudinal aging studies focused on factors that predict who tends to remain in such inquiries over time and who drops out. Those who are retained tend to be younger, female, married, better educated, and in better health than those who attrite (Banks et al., 2011; Jacobsen et al., 2020; Radler & Ryff, 2010; Tolonen et al., 2006). Similar outcomes are observed in the MIDUS longitudinal study when the standard two-group comparisons (retention sample vs. attrition sample) are examined (analyses not shown). We also gave explicit attention to when (what wave) and for what reason (death, withdrawal, or unable to contact or complete interview) participants drop out.
The initial partitioning of the MIDUS sample (based on wave of drop out and reasons for exiting as well as reinstatement status) revealed 11 distinct groups. However, initial examination of baseline demographic and health characteristics revealed six simplified groups that became the focus of remaining analyses. The six groups were (1) the Longitudinal sample; (2) those who did not complete M2 and/or M3 but were reinstated (REW completers); (3) those who did not complete M2 and/or M3 and were not reinstated (REW non-completers); (4) those who attrited at M2 due to death, withdrawal, or inability to reach/complete the survey (M2 attriters); (5) those who attrited at M3 due to death (M3 attriters due to death); and (6) those who attrited at M3 for other reasons (M3 attriters due to non-death).
These six groups were then compared in terms of their baseline sociodemographic characteristics. With regard to gender, the Longitudinal sample had a higher proportion of women compared, not to all other groups, but rather compared to those who dropped out at the second wave and to those who did not join the reinstatement effort (REW non-completers). The Longitudinal sample also had the highest educational level among the groups at baseline although those who returned (REW completers) had higher education than remaining groups except M3 attriters due to death. Regarding marital status, members of the Longitudinal sample were more likely to be married at baseline than any other group except M3 attriters due to death. With regard to age, findings revealed that those who returned to the study (REW completers) were the youngest participants at baseline, while those who dropped out at the second or third wave were older than the Longitudinal sample. A further novel finding was that those who attrited at M2 or M3 due to death were more likely to have children than members of the other four groups. In addition, REW non-completers were older, had less education, and were less likely to have children than REW completers. Overall, these findings underscored that a select number of sociodemographic factors mattered for understanding participation status albeit in more differentiated ways than are typically evident with two-group comparisons (retention vs. attrition).
Additional analyses compared the physical and mental health status of the six groups. With regard to subjective physical health, a novel finding was that those who attrited at M2 or M3 due to death had previously reported poorer physical health at baseline than all other groups perhaps because they were older than these other groups. However, subjective mental health followed a different pattern, with the Longitudinal sample reporting better mental health at baseline than all other groups except those M3 attriters due to non-death. Underscoring new insights from the reinstatement effort, both REW completers and REW non-completers had higher levels of subjective mental health at baseline than those who attrited at the second wave due to death, withdrawal, or failure to reach (and thus were not in the REW project).
Taken together, these univariate results pointed to more nuanced group differences than typical comparison of those who remain and those who drop out of longitudinal studies. For example, dropping out due to death (but not due to withdrawal or unable to reach) was linked with poorer baseline health compared to all other groups, whereas dropping out due to non-death reasons was not linked with poorer mental health compared to the Longitudinal sample. In addition, although older age predicts attrition, younger ages at baseline was a predictor of who was more likely to be reinstated into the study. These individuals who came back to the study (REW completers) also differed in important ways from those for whom reinstatement was attempted but failed (REW non-completers) on other baseline characteristics—reinstatement was more likely among those who were female, better educated, and more likely to have children. These findings convey useful information regarding proactive efforts to bring back participants who have previously dropped out of the study (Teague et al., 2018).
Results of the integrative analyses (multinomial logistic regressions) using a simplified set of six groups revealed further notable findings. Compared to the Longitudinal sample, the referent category, those who returned to the study (REW completers) were more likely to be younger, male, unmarried, and less educated and had at least one child. That is to say, the selective biases that account for attrition can, alternatively, become factors that increase likelihood of reinstatement back into the sample. Alternatively, those eligible to return to the study but did not (REW non-completers) were also more likely to be younger, male, unmarried, and less educated than the Longitudinal sample, but in addition, they had poorer mental health at baseline than the Longitudinal sample. This result underscores the importance of mental health as a key difference between the two REW groups (completers and non-completers) relative to the Longitudinal sample.
As noted above, the two REW groups also differed from each other, with non-completers being older, having less education, and less likelihood of having children than completers. Supplementary analyses (not shown) further indicated that the REW non-completers also had poorer subjective mental health at baseline than dropouts at the 2nd or 3rd waves who were not in the REW survey (due to deaths before or after each wave), again underscoring participants’ subjective mental health at baseline as a key factor in longitudinal retention efforts. Importantly, respondents who dropped out (e.g., could not be reached, unable to complete the interview, or withdrawal) were older and more likely to be childless at baseline than those in the Longitudinal sample. These differences also have relevance for strategic retention efforts, such as increasing incentives and/or using multiple mailings with particular subgroups to increase response rates.
It is noteworthy that parental status is a significant predictor of longitudinal participation, as the findings indicated, for several reasons. First, parental status is a major demographic variable, which in and of itself warrants study in longitudinal participation/attrition research. If the research community seeks to identify variables that are associated with the risk of attrition for “early warning” or to adjust for potential bias, the results of the current study justify the inclusion of parental status by showing how it matters. Relatedly, there are secular trends toward parents having fewer children and increased single parenting. If such trends are more pronounced in subgroups of the population, then the participation of these subgroups in longitudinal research may be affected. Together, these trends could affect age cohorts differentially, and this is obviously relevant to longitudinal MIDUS research.
Second, the life course principle of “linked lives” argues for the importance of including parental status in the study of attrition and/or retention of longitudinal sample. The prevalence of disabilities and death among children may affect the participation of their parents in longitudinal research. The CDC estimates that one in six children have disabilities (Boyle et al., 2011) and ongoing analyses showed that the parents whose son or daughter have disabilities were surprisingly less likely to drop out from longitudinal study than their peers who had unaffected children. The rates of child death in the United States are high, and research with MIDUS has shown that child death affects the mortality of parents (Song et al., 2019), which in turn reduces longitudinal participation or reinstatement in survey research.
Our more nuanced look at who participates, who drops out, and who comes back into the study is limited by the small set of sociodemographic and health variables that were considered. That is to say, numerous opportunities are now available to others using MIDUS data to examine other sociodemographic or psychosocial or health variables that may provide useful windows into understanding longitudinal participation in MIDUS. Working status, for example, is possibly another relevant influence and personal characteristics might also matter. Some prior findings have linked personality traits to attrition (Hansson et al., 2018; Satherley et al., 2015). Our analyses are thus not exhaustive, but rather illustrative of further lines of inquiry to enrich understanding of the composition of samples as longitudinal research unfolds.
In addition to these directions, we note three other promising avenues for future research. First, although emphasis here has been on examining single baseline characteristics to illuminate longitudinal participation, it is also useful to examine the interplay between baseline characteristics in predicting retention, attrition, or reinstatement. These questions are of crucial interest in longitudinal trajectory analyses. Radler and Ryff (2010) used such an approach to account for who remained in the MIDUS study after the 2nd wave of data collection (M2). Such inquiry informed how one baseline characteristic might exacerbate or mitigate the influence of another characteristic on participation at the next wave. Relevant questions, for example, are how age might interact with other characteristics, such as mental health at baseline, in accounting for multiwave participation. Our findings suggest that mental health at baseline may be particularly relevant for understanding long-term participation of younger versus older members of the sample. The association between educational attainment and participation might also be more salient for younger participants than for older participants. Thinking more broadly, longitudinal studies in general will be enhanced by identifying factors that offset (protect against) the likelihood of attrition among those who are more socioeconomically disadvantaged (low educational status) or have health vulnerabilities. Being married and/or having children might constitute such mitigating factors, suggesting possibly extra retention efforts (higher incentives and multiple mailings) among those who are not married or do not have children.
Second, from a methodological perspective, these findings on the heterogeneity in varieties of participation and their associations with baseline sociodemographic and health characteristics can be utilized to correct for bias due to attrition. These identified characteristics are critical factors for imputation or weighting adjustments. MIDUS is a rich source of diverse samples that were surveyed subsequently, and the additional efforts can provide useful information for diagnosing and adjusting for bias due to potentially non-ignorable attrition of the longitudinal sample (Deng et al., 2013). Thus, future studies focusing on the REW sample can improve the evaluation of nonresponse mechanisms or attrition bias and thus can inform the adjustment for various types of attrition bias in the main longitudinal sample.
Third and relatedly, the reinstated sample offers unique opportunities to examine whether respondents’ “early warning profiles”—that is, indicators of baseline vulnerabilities (e.g., low socioeconomic status and poor health) translated to subsequent life stresses and health problems that increase later-life health vulnerabilities. Such queries are important, given prior research suggesting that baseline characteristics and multiple imputation strategies have provided important insights into understanding attrition in longitudinal aging studies (Asendorpf et al., 2014; Salthouse, 2014). What the REW sample brings to the scientific community are new opportunities to adjust for attrition using imputation based on characteristics assessed after reinstatement. Stated otherwise, newly collected data from the reinstated sample, which constitutes approximately 25% of the full attrition sample, offer novel opportunities to assess whether attrition is biasing longitudinal findings. A central question therein is whether the lives of those who dropped out were characterized by greater subsequent stress exposures or health challenges that might compromise later-life health. These are important questions open for exploration by the scientific community via use of the newly collected data from the MIDUS REW project.
Supplemental Material
sj-pdf-1-jah-10.1177_08982643211018552 – Supplemental Material for Who Returns? Understanding Varieties of Longitudinal Participation in MIDUS
Supplemental Material, sj-pdf-1-jah-10.1177_08982643211018552 for Who Returns? Understanding Varieties of Longitudinal Participation in MIDUS by Jieun Song, Barry T. Radler, Margie E. Lachman, Marsha R. Mailick, Yajuan Si and Carol D. Ryff in Journal of Aging and Health
Footnotes
Declaration of Conflicting Interests
The author(s) declared no potential conflicts of interest with respect to the research, authorship, and/or publication of this article.
Funding
The author(s) disclosed receipt of the following financial support for the research, authorship, and/or publication of this article: This study was supported by National Institute on Aging grant (P01-AG020166 and U19-AG051426) to conduct a longitudinal follow-up of the MIDUS (Midlife in the United States) investigation. The original study was supported by the John D. and Catherine T. MacArthur Foundation Research Network on Successful Midlife Development.
Supplemental Material
Supplemental material for this article is available online.
Note
References
Supplementary Material
Please find the following supplemental material available below.
For Open Access articles published under a Creative Commons License, all supplemental material carries the same license as the article it is associated with.
For non-Open Access articles published, all supplemental material carries a non-exclusive license, and permission requests for re-use of supplemental material or any part of supplemental material shall be sent directly to the copyright owner as specified in the copyright notice associated with the article.