



Abstract
Objectives
To assess the association of systolic blood pressure (SBP) and diastolic blood pressure (DBP) with mortality among older adults in Singapore.
Methods
Association of SBP and DBP measured in 2009 for 4443 older adults (69.5±7.4 years; 60–97 years) participating in a nationally representative study with mortality risk through end-December 2015 was assessed using Cox regression.
Results
Higher mortality risk was observed at the lower and upper extremes of SBP and DBP. With SBP of 100–119 mmHg as the reference, multivariable mortality hazard ratios [HRs (95% confidence interval)] were SBP <100 mmHg: 2.41 (1.23–4.72); SBP 160–179 mmHg: 1.51 (1.02–2.22); and SBP ≥180 mmHg: 1.78 (1.12–2.81). With DBP of 70–79 mmHg as the reference, HRs were DBP <50 mmHg: 2.41 (1.28–4.54) and DBP ≥110 mmHg: 2.16 (1.09–4.31).
Discussion
Management of high blood pressure among older adults will likely reduce their mortality risk. However, the association of excessively low SBP and DBP values with mortality risk needs further evaluation.
Introduction
Population-based observational cohort studies that focus exclusively on older adults have reported a J- or U-shaped relationship of blood pressure (BP) with mortality risk, with higher risk of mortality at lower and upper extremes of BP (Beddhu et al., 2018; Gutierrez-Misis et al., 2013; Masoli et al., 2020; Merlo et al., 1996; Ogliari et al., 2015; Protogerou et al., 2007; Tervahauta et al., 1994). While informative, these observational studies have a major limitation—they often do not consider confounders beyond demographic characteristics and physical health or chronic disease status. There is substantial evidence supporting associations of health factors such as sleep duration (Gangwisch, 2014) and psychosocial factors such as depressive symptoms (Barrett-Connor & Palinkas, 1994; Licht et al., 2009; Paterniti et al., 2000), cognitive impairment (Elias et al., 1993; Mossello et al., 2015), and social isolation and loneliness (Steptoe et al., 2013) with BP. Furthermore, all these have been found to be independent predictors of mortality (Dalgard & Lund Haheim, 1998; Kripke et al., 2002; Ogliari et al., 2015; Schulz et al., 2000; Tomaka et al., 2006). Thus, given the empirical evidence linking sleep duration and psychosocial factors with BP and mortality, these factors should be controlled for as confounders in observational studies examining the relationship between BP and mortality. Adjusting for these confounders is even more important when the relationship is assessed in older adults, as they are common in old age—for example, chronic sleep difficulties affect more than half of those aged ≥65 years (Foley et al., 1995) and depressive symptomatology affects up to 20% of community-dwelling older adults (Simonsick et al., 1995).
In addition, most of the observational cohort studies of older adults referred to above pertain to Western populations. Increasing evidence suggests that South Asians are at elevated risk of cardiovascular disease (CVD) compared to other ethnicities (Misra et al., 2017). With CVD onset at an earlier age—possibly attributable to distinctive genotypes—the relationship between BP and its ultimate effect on organ systems and mortality risk might also be different. Given the rapidly aging Asian populations, it is of interest to assess association between BP and mortality among older adults residing in an Asian country.
Thus, using data from a nationally representative longitudinal study of community-dwelling older adults in Singapore, a rapidly aging Asian nation (Malhotra et al., 2019), we assess associations of systolic BP (SBP) and diastolic BP (DBP) measured in 2009 with all-cause mortality through December 31, 2015 while adjusting for a wide range of demographic, health, and psychosocial confounders.
Methods
PHASE and Derivation of Analysis Sample
Study data is from the Panel on Health and Ageing of Singaporean Elderly (PHASE), a nationally representative longitudinal study of community-dwelling older Singaporeans—BP values measured at wave 1, in 2009, were the primary predictor in this study—together with PHASE participant death date information through December 31, 2015 obtained primarily from the national Registry of Births and Deaths databases (hereafter, mortality databases). PHASE is described in detail elsewhere (Chan et al., 2019). Briefly, 4990 older Singapore citizens and permanent residents were interviewed at their place of residence in wave 1 after informed consent. Analysis of de-identified data from wave 1 and linkage with the mortality databases were approved by the Institutional Review Board at the National University of Singapore.
The analysis sample was restricted to 4443 of the 4990 PHASE wave 1 participants, after sequentially excluding (1) those missing all three SBP and DBP measurements (N = 502), with BP not measured for health reasons, and (2) mortality within 6 months of wave 1 (N = 45), to avoid confounding due to asymptomatic life-limiting diseases whereby lower BP is accounted for by proximity to death rather than vice versa.
Blood Pressure Measurement
At wave 1 of PHASE, SBP and DBP readings were taken in the supported left (98.3%) or right (1.7%) arm of resting participants with an automated blood pressure monitor (Omron HEM-762, Omron, Kyoto, Japan). A total of three SBP and DBP measurements were obtained by trained study personnel, about 1 minute apart. After excluding the first reading, BP was recorded as the average of the second and third readings.
All-Cause Mortality
All-cause mortality through December 31, 2015 was determined primarily from mortality databases, supplemented by data collected during waves 2 and 3 of PHASE.
Confounders
We adjusted for wave 1 values of a wide range of confounders: demographic (age, gender, ethnicity, marital status, education, housing type, and living arrangement), health (body mass index (BMI) category, antihypertensive medication use, physical pain, comorbidity history [CVD (angina pectoris, myocardial infarction, and cerebrovascular disease), diabetes mellitus and cancer], activity of daily living (ADL) limitation status, smoking status, alcohol intake, and sleep duration), and psychosocial (depressive symptoms, cognition, social networks, and loneliness). Supplementary–Methods presents a detailed description of the confounders, including why they were accounted for in the analyses.
Statistical Analysis
SBP (mmHg) was categorized into 8 groups: <100, 100–109, 110–119 (reference), 120–129, 130–139, 140–159, 160–179, and ≥180; DBP (mmHg) was similarly categorized: <50, 50–59, 60–69, 70–79 (reference), 80–89, 90–99, 100–109, and ≥110. Differences in the various confounders across the eight SBP and DBP categories were assessed using analysis of variance (ANOVA) for continuous variables and χ2 test for categorical variables.
Survival analysis was used to assess the associations of SBP and DBP measured in 2009 with subsequent all-cause mortality, through December 31, 2015, given the longitudinal nature of the study and the fact that the participants contributed variable duration of follow-up time. The time-to-event variable was time, in years, since wave 1 interview date to either date of death (for those dead by December 31, 2015) or December 31, 2015 (for those alive at that date). It ranged from 0.50 to 6.99 years (mean ± standard deviation: 6.11 ± 1.47 years).
Of the 4443 participants in the analysis sample, 862 (19.4%) died by December 31, 2015. Date of death for those who died during the follow-up period was obtained primarily through data-linkage with the mortality databases. Self-reported information, including national identification number, name, date of birth, and gender, which were reported by the respondent or their proxy in the wave 1 interview, were used for the data-linkage. For the majority (811; 94.1%) of those dead by December 31, 2015, the date of death was available in the mortality databases and was used. For those (27; 3.1%) who were reported as dead on contact at wave 2 or 3 but could not be located in the mortality databases, the date of death reported by the next-of-kin in a decedent questionnaire at wave 2 or 3 was utilized. For the rest (24; 2.8%), who were reported as dead on contact at wave 2 or 3 but could not be located in the mortality databases or whose exact date of death was not available, the death of death was assigned as the mid-point between the date of their wave 1 interview (or wave 2 interview) and date of contact at wave 2 (or wave 3) with the next-of-kin. The inability to locate some of those who had died in the mortality databases is likely the result of missing or incorrect/misspelt values in the variables (national identification number, name, date of birth, and gender) used for the data-linkage since these variables were self-reported by the respondent or their proxy in wave 1. Participants who were still alive on December 31, 2015 were censored at that date.
Kaplan–Meier survival plots and multivariable Cox proportional hazards models were employed to examine the unadjusted and adjusted (for confounders) associations, respectively, of SBP and DBP categories with risk of all-cause mortality. Models for SBP categories were adjusted for DBP (continuous), and vice versa. We used cross-product terms of the SBP and DBP categories with time to test tenability of the proportional hazards assumption. It was met for all SBP and DBP categories except SBP 100–109 mmHg. We assessed for multicollinearity across the various independent variables included in the multivariable models—there was no evidence for multicollinearity (values of all variance inflation factors were less than 2.5). Sensitivity of the Cox models to variation in either confounders or analysis sample composition was assessed: Sensitivity Analysis 1—models linking SBP categories with mortality were not adjusted for DBP (continuous) and vice versa; Sensitivity Analysis 2—the analysis sample included participants who died within 6 months of the wave 1 interview (N = 4488); Sensitivity Analysis 3—the analysis sample excluded participants with missing values for all three SBP and DBP measurements as well as those who died within 12 months of the wave 1 interview (N = 4388); and Sensitivity Analysis 4—variables which did not have an association with SBP or DBP or with mortality in our dataset, or could be considered to be on the pathway between BP and mortality were not controlled for as confounders.
In line with previous studies (Chen et al., 2020; Jung et al., 2019; Li et al., 2018), we also evaluated the association of SBP and DBP as continuous variables with all-cause mortality. To accommodate the potential non-linear association, we adopted a multivariable Cox proportional hazard model with estimation using natural cubic splines. For SBP, we used six interior knots (at 75, 100, 125, 150, 175, and 200 mmHg) and for DBP three interior knots (at 64, 87, and 110 mmHg), as these specifications maximized model fit.
All analyses were performed using SAS University Edition (SAS Institute, Cary, NC, USA) and weighted by wave 1 survey sampling weights. Two-sided p-values were calculated, and statistical significance was set at 0.05 unless stated otherwise.
Results
The mean age of the 4443 participants in the analysis sample was 69.5±7.4 years (range: 60 to 97 years). The mean SBP and DBP was 142.2±22.1 mmHg (range: 73.5 to 245.5 mmHg) and 77.2±11.4 mmHg (range: 41.0 to 133.0 mmHg), respectively. 54.3% were women and 82.3% were of Chinese ethnicity. Distribution of the various confounders across the SBP and DBP categories are presented in Supplementary Tables 1 and 2, respectively. Relative to those in lower SBP categories, those in higher SBP categories were more likely to be older, men, non-Chinese, less educated, reside in housing indicative of a lower socioeconomic status, have obesity, report antihypertensive medication use, have no or mild pain, be socially isolated, and have cognitive impairment. In context of DBP, those in higher DBP groups, versus those in lower groups, were more likely to be younger, men, non-Chinese, less educated, reside in housing indicative of a lower socioeconomic status, have obesity, be current smokers, not be on antihypertensive medication, less likely to report prior history of CVD and diabetes, have no or mild pain, and have intact cognition.
In the 28,078 person-years of follow-up, there were a total of 862 deaths, resulting in a weighted all-cause mortality rate of 23.6 per 1000 person-years. The Kaplan–Meier curves in Supplementary Figure 1A show that survival probability was the highest for older adults with SBP 110–119 mmHg and lowest for those with SBP<100 mmHg and SBP≥180 mmHg. Similarly, Supplementary Figure 1B shows that the survival probability was the highest for those with DBP 70–79 mmHg, 80–89 mmHg, and 90–99 mmHg and lowest for those with DBP <50 mmHg and DBP ≥110 mmHg.
Association of Systolic and Diastolic Blood Pressure Categories With all-Cause Mortality (N = 4443).
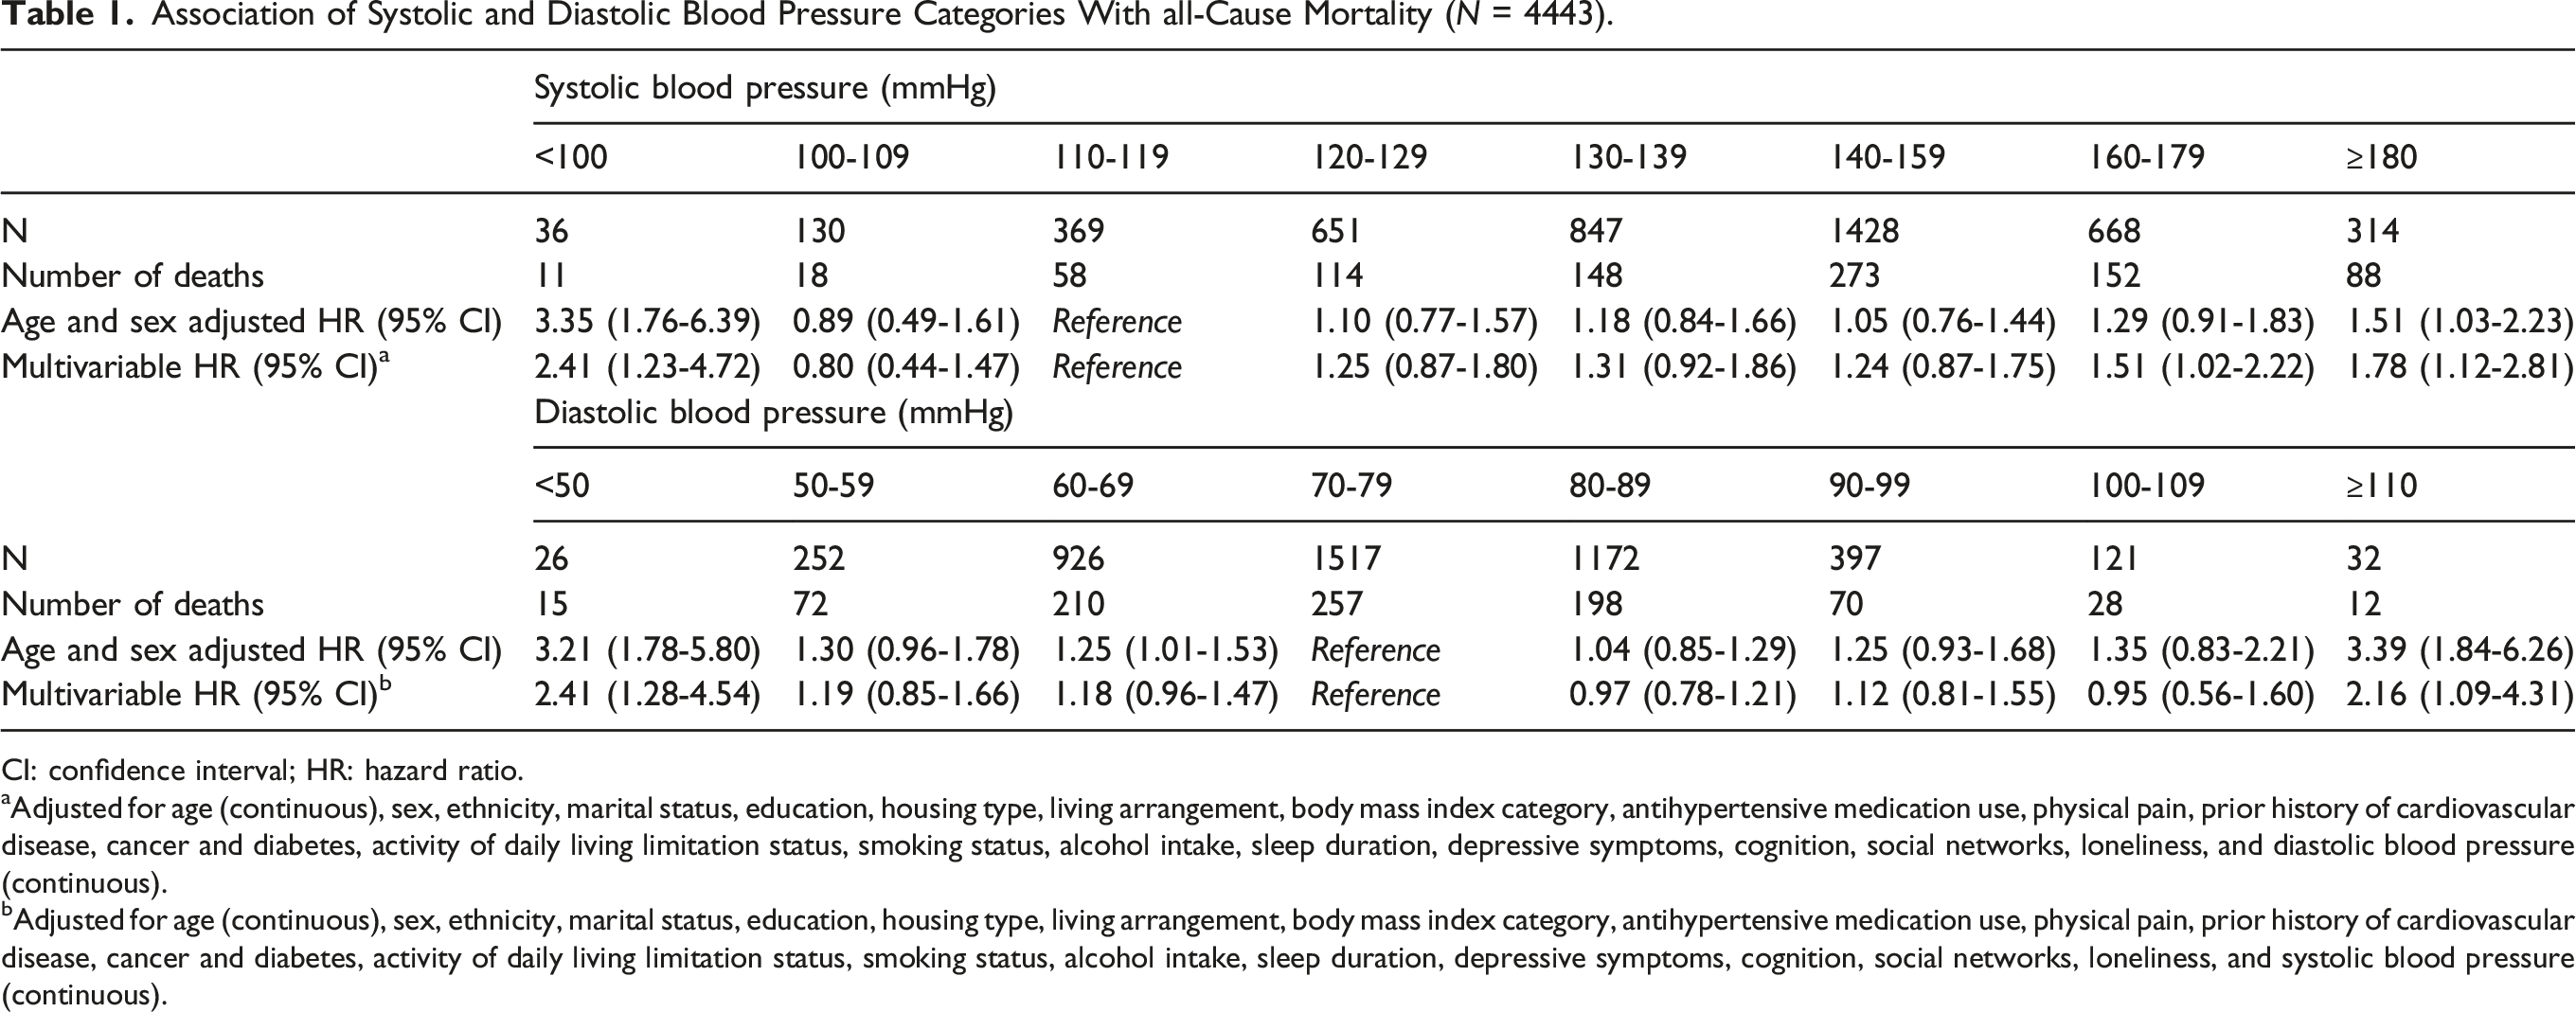
CI: confidence interval; HR: hazard ratio.
aAdjusted for age (continuous), sex, ethnicity, marital status, education, housing type, living arrangement, body mass index category, antihypertensive medication use, physical pain, prior history of cardiovascular disease, cancer and diabetes, activity of daily living limitation status, smoking status, alcohol intake, sleep duration, depressive symptoms, cognition, social networks, loneliness, and diastolic blood pressure (continuous).
bAdjusted for age (continuous), sex, ethnicity, marital status, education, housing type, living arrangement, body mass index category, antihypertensive medication use, physical pain, prior history of cardiovascular disease, cancer and diabetes, activity of daily living limitation status, smoking status, alcohol intake, sleep duration, depressive symptoms, cognition, social networks, loneliness, and systolic blood pressure (continuous).
Association of Systolic and Diastolic Blood Pressures Categories With all-Cause Mortality–Sensitivity Analyses.

CI: confidence interval; HR: hazard ratio.
Sensitivity analysis 1: Diastolic blood pressure was not adjusted for models linking systolic blood pressure with mortality and vice versa. Adjusted for age (continuous), sex, ethnicity, marital status, education, housing type, living arrangement, body mass index category, antihypertensive medication use, physical pain, prior history of cardiovascular disease, cancer and diabetes, activity of daily living limitation status, smoking status, alcohol intake, sleep duration, depressive symptoms, cognition, social networks, and loneliness.
Sensitivity analysis 2: Did not exclude participants who died within 6 months after enrollment. Adjusted for age (continuous), sex, ethnicity, marital status, education, housing type, living arrangement, body mass index category, antihypertensive medication use, physical pain, prior history of cardiovascular disease, cancer and diabetes, activity of daily living limitation status, smoking status, alcohol intake, sleep duration, depressive symptoms, cognition, social networks, loneliness, and diastolic blood pressure (continuous) (or systolic blood pressure (continuous)).
Sensitivity analysis 3: Excluded participants who died within 12 months after enrollment. Adjusted for age (continuous), sex, ethnicity, marital status, education, housing type, living arrangement, body mass index category, antihypertensive medication use, physical pain, prior history of cardiovascular disease, cancer and diabetes, activity of daily living limitation status, smoking status, alcohol intake, sleep duration, depressive symptoms, cognition, social networks, loneliness, and diastolic blood pressure (continuous) (or systolic blood pressure (continuous)).
Sensitivity analysis 4: Variables which did not have an association with systolic blood pressure or diastolic blood pressure or with mortality in our dataset, or could be considered to be on the pathway between blood pressure and mortality were not controlled for. Model linking systolic blood pressure with mortality was adjusted for age (continuous), sex, ethnicity, marital status, education, housing type, body mass index category, antihypertensive medication use, physical pain, alcohol intake, sleep duration, social networks, and diastolic blood pressure (continuous) (Thus, the model did not adjust for living arrangement, cardiovascular disease, cancer, diabetes, activity of daily living limitation status, smoking, sleep duration, depressive symptoms, loneliness and cognition). Model linking diastolic blood pressure with mortality was adjusted for age (continuous), sex, ethnicity, education, housing type, body mass index category, antihypertensive medication use, physical pain, prior history of diabetes, activity of daily living limitation status, smoking status, depressive symptoms, social networks, and systolic blood pressure (continuous) (Thus, the model did not adjust for marital status, living arrangement, cardiovascular disease, cancer, alcohol intake, sleep duration, loneliness, and cognition).
Cox models with natural cubic splines also supported the higher mortality risk at the extremes of SBP (continuous) and DBP (continuous), respectively (Figures 1a and b). Compared to SBP 109 mmHg, which had the least mortality risk, the risk of all-cause mortality was higher for SBP ≤101 mmHg or ≥165 mmHg. And, relative to DBP 85 mmHg, which had the least mortality risk, the risk was higher for DBP ≤63 mmHg. Association of (a) systolic blood pressure (SBP) and (b) diastolic blood pressure (DBP), as continuous variables, with risk of all-cause mortality (solid line) with the corresponding 95% confidence intervals (dotted lines): Results from multivariable Cox proportional hazard models with natural cubic splines (N = 4443). ((a): Non-linear; p = <0.0001). ((b): Non-linear; p = 0.025).
Discussion
In a nationally representative sample of community-dwelling older adults from Singapore, a higher mortality risk was observed at the lower and upper extremes of SBP and DBP. These associations were observed even after accounting for numerous confounders, many of which—sleep duration, depressive symptoms, cognitive function, social isolation, and loneliness—should be, yet are seldom accounted for in previous studies.
The association of BP in the higher range with all-cause mortality, as we observed for SBP ≥160 mmHg and for DBP ≥110 mmHg, is not surprising. Hypertension is known to affect many organs, including the heart, vasculature, kidneys and brain, and control of BP among those with hypertension leads to reduced morbidity and mortality (Cushman, 2003). For instance, in the Hypertension in the Very Elderly Double Blind Trial (HYVET), which included adults aged 80 years or older with SBP ≥160 mmHg, those who achieved target BP of 150/80 mmHg had significant reduction in all cause-mortality (median follow-up: 1.8 years) (Beckett et al., 2008). In a subgroup analysis of the SPRINT trial that recruited subjects 75 years or older with SBP ≥130 mmHg, targeting SBP <120 mmHg resulted in a decrease in all-cause mortality (median follow-up: 3.14 years) (Williamson et al., 2016).
Next, we focus on the link between BP in the lower range with all-cause mortality, which we observed for SBP <100 mmHg and for DBP <50 mmHg. It has been postulated that a steep blood flow fall and BP below the threshold whereby perfusion to the vital organs is impaired could explain the decreased survival associated with low BP (Mancia & Grassi, 2014). It is of interest to note that the SBP threshold below which mortality risk increases differs between Western and Asian populations. Observational studies among older adults from Western populations largely report an increased risk of all-cause mortality at SBP <140 mmHg (Douros et al., 2019; Masoli et al., 2020; Oates et al., 2007; Odden et al., 2012; Ogliari et al., 2015; Rastas et al., 2006; Ravindrarajah et al., 2017; Streit et al., 2018). However, studies conducted in Asian populations, including our study, report an increased mortality risk only at much lower SBP. A study examining 4658 oldest old individuals (mean age = 92.1 years) in China observed the risk of all-cause mortality only for SBP<107 mmHg. Studies conducted among one million South Koreans aged 30–95 years (Kimm et al., 2018; Yi et al., 2016) and over 160,000 Chinese aged 40–69 years (Wang et al., 2018), reporting a J- or U-shaped relationship between BP and all-cause mortality, observed higher mortality risk only for SBP <90 mmHg. And, a previous study from Singapore, among 30,692 individuals aged 48–85 years, found an increased risk of cardiovascular mortality only for SBP <100 mmHg among those aged ≥60 years (Koh et al., 2016). The reasons for the difference in the SBP threshold below which mortality risk increases between Western and Asian population needs to examined in future studies. Nonetheless, it points toward caution in the direct application of findings observed for the link between BP and mortality observed in Western populations to Asian populations, and the need for more studies in Asian populations, like our study.
The prevalence of hypertension increases with age (Aronow et al., 2011), yet elevated BP among older adults is often undertreated (Agarwala et al., 2020). Various hypertension guidelines recommend the initiation of antihypertensive medication in the presence of high BP among older adults, though the BP thresholds for initiating treatment vary across guidelines and by patient age (Agarwala et al., 2020; Qaseem et al., 2017; Whelton et al., 2018; Williams et al., 2018). Furthermore, a recent meta-analysis of randomized controlled trials showed that pharmacological reduction of BP is effective for older persons, even when their BP is not highly elevated (Blood Pressure Lowering Treatment Trialists, 2021). Our finding of an increased mortality risk for those with SBP ≥160 mmHg and with DBP ≥110 mmHg sides with such guidelines, in terms of the importance of managing high BP among older adults. The guidelines also provide generic BP targets. However, it has been suggested that BP management and targets among older adults should be individualized, taking “patient preferences, medical comorbidities, life expectancy, treatment goals, and an appropriate balance between risks and benefits factors” into account (Agarwala et al., 2020). Our finding of a higher mortality risk for those with SBP <100 mmHg and with DBP <50 mmHg highlights that clinicians should be mindful of excessively low BP (though we caution that the low BP values in our observational study cannot be attributed to the use of antihypertensive medication).
Strengths and Limitations
Our study has several strengths, including its setting in Asia and large sample size. The follow-up period, 7 years, is longer than many previous observational cohort studies linking BP with mortality among older adults (Beddhu et al., 2018; Odden et al., 2012; Protogerou et al., 2007; Streit et al., 2018; Tervahauta et al., 1994), although some studies do have longer follow-up periods (Gutierrez-Misis et al., 2013; Masoli et al., 2020; Merlo et al., 1996; Ogliari et al., 2015). We adjusted for a wide range of confounders, many of which—including sleep duration and psychosocial factors—are seldom considered among previous studies. Finally, the results observed in the primary analysis were largely maintained in the various sensitivity analyses.
Our study does have its limitations. First, it is observational and does not support inferences regarding causality. It contributes to the observational evidence of the link between BP and mortality; however, it should not be considered on its own for setting BP targets in individual patients. Moreover, very few individuals in our study had SBP <100 mmHg (1.0%) and DBP <50 mmHg (0.5%); thus, the possibility of a chance finding in these subgroups cannot be ruled out. Second, data on comorbidity were obtained through self-reporting which is less accurate than data obtained from medical records. Third, the PHASE study did not collect information on dietary practices, physical activity, or genetic data, thus we are unable to control for these variables. Fourth, while our primary analysis excluded those who died within 6 months of baseline, and one of the sensitivity analyses in which results mirrored those of the primary analysis excluded those who died within 12 months of baseline, we cannot rule out residual confounding due to undiagnosed or asymptomatic illnesses, especially with regard to the link between lower BP values and mortality. It has been previously reported that an accelerated decline in SBP may occur in the final 24 months of life, resulting in the link between low BP with mortality (Ravindrarajah et al., 2017). Fifth, the PHASE study did not collect data on the type and dose of anti-hypertensive medications being used by the participants precluding us from commenting on the role played by potential over (or under) treatment of BP. Finally, our study pertains to older adults from Singapore, thus the results may not be generalizable to other countries. It will be of interest to see if our findings hold among older adults in other Asian populations.
Conclusion
A higher mortality risk was exhibited at the lower and upper extremes of SBP and DBP among older adults in our observational study, even after accounting for a range of demographic, health, and psychosocial confounders, many of which have not been considered among previous studies. Participants with SBP <100 mmHg and ≥160 mmHg (vs. 110–119 mmHg) and with DBP <50 mmHg and ≥110 mmHg (vs. 70–79 mmHg) had a significantly higher risk of all-cause mortality during the subsequent 7 years. Our findings provide evidence that maintaining lower, versus higher, SBP and DBP will likely reduce the likelihood of mortality in older adults. At the same time, clinicians should be mindful of the association of increased mortality with excessively low SBP (<100 mmHg) and DBP (<50 mmHg) in older adults.
Supplemental Material
sj-pdf-1-jah-10.1177_08982643211055245 – Supplemental Material for Association of Systolic and Diastolic Blood Pressure With All-Cause Mortality Among Community-Dwelling Older Adults: A Prospective Observational Study
Supplemental Material, sj-pdf-1-jah-10.1177_08982643211055245 for Association of Systolic and Diastolic Blood Pressure With All-Cause Mortality Among Community-Dwelling Older Adults: A Prospective Observational Study by Qian Lian, Tazeen H. Jafar, John C. Allen, Stefan Ma and Rahul Malhotra in Journal of Aging and Health
Footnotes
Declaration of conflicting interests
The author(s) declared no potential conflicts of interest with respect to the research, authorship, and/or publication of this article.
Funding
The author(s) disclosed receipt of the following financial support for the research, authorship, and/or publication of this article: This study was supported by waves 1, 2 and 3 of the Panel on Health and Ageing of Singaporean Elderly (PHASE), which have been funded or supported by the following sources: Ministry of Social and Family Development, Singapore; Singapore Ministry of Health’s National Medical Research Council under its Singapore Translational Research Investigator Award ‘Establishing a Practical and Theoretical Foundation for Comprehensive and Integrated Community, Policy and Academic Efforts to Improve Dementia Care in Singapore’ (NMRC-STAR-0005-2009), and its Clinician Scientist—Individual Research Grant—New Investigator Grant ‘Singapore Assessment for Frailty in Elderly-Building upon the Panel on Health and Aging of Singaporean Elderly’ (NMRC-CNIG-1124-2014); and Duke-NUS Geriatric Research Fund. Funding for electronic blood pressure monitors used in PHASE was through a grant obtained by the Nihon University Population Research Institute from the “Academic Frontier” Project for Private Universities: matching fund subsidy from Japan’s Ministry of Education, Culture, Sports, Science and Technology (MEXT), 2006-2010.

Supplemental Material
Supplemental material for this article is available online.
References
Supplementary Material
Please find the following supplemental material available below.
For Open Access articles published under a Creative Commons License, all supplemental material carries the same license as the article it is associated with.
For non-Open Access articles published, all supplemental material carries a non-exclusive license, and permission requests for re-use of supplemental material or any part of supplemental material shall be sent directly to the copyright owner as specified in the copyright notice associated with the article.
