



Abstract
Physical activity participation declines with age, and many adults ages 50 years or older report being physically inactive outside of work (Watson et al., 2016). Sustained physical activity is widely recognized as beneficial for aging adults’ health and well-being, but many of the measurement instruments needed for the study of physical activity maintenance were developed on samples of younger adults. For instance, motives for physical activity that emanate from one’s sense of self are theorized to support sustained physical activity participation for all ages (Kwasnicka et al., 2016; Rhodes et al., 2016). Specifically, highly self-determined physical activity regulatory styles (e.g., integrated regulation; Ryan & Deci, 2017) and a strong physical activity identity (Stryker & Burke, 2000) can lead people to make behavioral choices that are congruent with core personal values, goals, and expectations affixed to one’s identity. These motives are thought to give meaning and salience to past physical activity experiences and to help individuals internalize and self-regulate behavior (Rhodes et al., 2016; Ryan & Deci, 2003). However, the Behavioral Regulation in Exercise Questionnaire (BREQ, and its subsequent extensions) and the Exercise Identity Scale (EIS) were developed to measure regulatory styles and identity, respectively, with university students and younger samples (see Supplementary Appendix A for details).
Additionally, these instruments were developed to measure constructs relevant for exercise; that is, for planned, structured, and repetitive activities performed for the purpose of enhancing physical fitness (Caspersen et al., 1985). In contrast, physical activity refers to “any bodily movement produced by the skeletal muscles that results in energy expenditure” (Caspersen et al., 1985, p. 126). Many older adults prefer the more inclusive term “physical activity” as opposed to “exercise” to refer to their activities (Ory et al., 2003), and they find the term “physically active person” more self-descriptive than “exerciser” (Whaley & Ebbeck, 2002). As such, older adults might not interpret measurement instrument items pertaining to “exercise” as intended, and this may adversely affect the score interpretations of the BREQ and EIS if used as is in studies for which physical activity is the focal behavior. Researchers have modified the EIS by substituting terms pertaining to “exercise” with “physical activity” (e.g., Miller et al., 2002; Strachan et al., 2010; Perras et al., 2016). However, the impact of this modification on the reliability and validity of the EIS to measure physical activity identity remains largely unknown.
The overall purpose of this study is to examine the psychometric adequacies of modified versions of the BREQ and EIS for use with adults aged 55 years and older to measure regulatory styles and identity related to physical activity. We modified items of the BREQ and EIS by substituting terms pertaining to “exercise” with “physical activity.” Because such modifications may result in changes in the meaning of the items, it is essential to examine the psychometric adequacies of these modified measurement instruments (Hagger & Chatzisarantis, 2009; Stewart et al., 2012). This is especially important since these instruments were developed primarily with university students and younger adults (see Supplementary Appendix A for details). Specifically, this study aims to (1) replicate the factor structure of the original instruments and evaluate reliability of the modified measures among a sample of adults 55 years or older, (2) establish gender and longitudinal measurement invariance, and (3) appraise convergent and divergent validity based on relations between physical activity regulatory styles, physical activity identity, and physical activity behavior.
Aim 1: Measurement Factor Structure and Reliability
Regulatory Styles
The BREQ was created by Mullan et al. (1997) to assess four regulatory styles (see Supplementary Table A1 in Supplementary Appendix A for full descriptions of the different regulatory styles). Markland and Tobin (2004) added an amotivation subscale to the BREQ and confirmed that this addition produced a well-fitting five-factor model (BREQ-2). Wilson et al. (2006) created a measure of integrated regulation and added it to Mullan et al.’s (1997) original instrument. Similar to Markland and Tobin (2004), they found that the integrated regulation subscale represented a one-factor model that could be added to Mullan et al.’s (1997) four subscales. Researchers have labeled the combination of all subscales [i.e., Mullan et al.’s (1997) original four-subscale measure, Markland and Tobin’s (2004) amotivation subscale, and Wilson et al.’s (2006) integrated regulation subscale], along with an additional introjected regulation item, the BREQ-3.
Identity
Anderson and Cychosz (1994) developed the EIS to measure exercise identity among university students, and this scale was found to reflect a one-factor model of identity (see Supplementary Table A2 in Supplementary Appendix A). Further, Strachan et al. (2010) and Perras et al. (2016) reported that a modified EIS measuring physical activity identity also represented a one-factor model of identity. However, data pertaining to their factorial analysis was not provided. In contrast, Wilson and Muon (2008) reported that the EIS more appropriately reflects a two-factor model of identity consisting of dimensions that have been labeled role identity (e.g., how the behavior has been integrated with one’s identity) and exercise beliefs (e.g., perceptions about the behavior itself). The superior fit of this two-factor model has been subsequently verified among Greek adults (ages 18–64 years; Vlachopoulos et al., 2011). As suggested by others (Vlachopoulos et al., 2011; Wilson & Muon, 2008), there is a need to further examine the tenability of both one- and two-factor EIS measurement models in different samples, such as older adults.
This study attempts to replicate the measurement factor structure of the modified versions of the BREQ-3 and EIS and estimates the item-level reliability and internal consistency reliability of these measures.
Aim 2: Measurement Invariance
To enable the testing of relationships involving a given theoretical construct with other variables, it is essential to establish whether the chosen measure of the construct is invariant (Estabrook, 2012). Measurement invariance is comprised of configural invariance (i.e., equivalent forms of the model represented by the measure) and metric invariance (i.e., equivalent relationships between the scale items and the underlying construct) (Schaie et al., 1998). When measurement invariance is established among subgroups of the population of interest or over time, it can be inferred that respondents interpret the measure in a conceptually similar way. This study investigates whether the interpretations of items of the modified versions of the BREQ-3 and EIS vary between men and women and across a four-week timescale.
Gender Invariance
Gender is salient to people’s physical activity experiences (Semerjian, 2018). Sex stereotypes and gender roles are thought to affect how people perceive themselves, their motivations for physical activity, and the value they ascribe to their physical activity (Chalabaev et al., 2013; Semerjian, 2018). Thus, men and women may interpret certain items used to measure physical activity regulatory styles and identity differently (e.g., Vlachopoulos et al., 2008; Ennigkeit & Hänsel, 2018). From a practical standpoint, gender invariance is essential to discern properly for whom and why an intervention may or may not promote physical activity. As illustrated in Figure 1, the effectiveness of an intervention strategy might be a function of gender (reflected by the arrow pointing from gender to path c’). For example, the use of a given strategy may increase physical activity participation for women but not men for at least two distinct reasons. First, gender may moderate the effect of the intervention strategy on the intervention target (reflected by the arrow pointing from gender to path a). In this case, the intervention target may be appropriate for both men and women, but a different strategy is needed to change that target for men. Second, gender may moderate the effect of the intervention target on physical activity (reflected by the arrow pointing from gender to path b). In this case, the intervention strategy is effective at changing the target for both men and women, but the target is not (or is only weakly) influencing physical activity for men. Hence, without evidence for measurement invariance, observed differences in the size or direction of associations involving the intervention target may be due to fluctuating interpretations of the questionnaire or scale items by men and women rather than real changes in the target. Practical Relevance of Measurement Invariance to Health Behavior Change. Note. To reduce clutter, we have omitted pre-intervention physical activity or time as predictors. Adapted from Sheeran et al. (2017).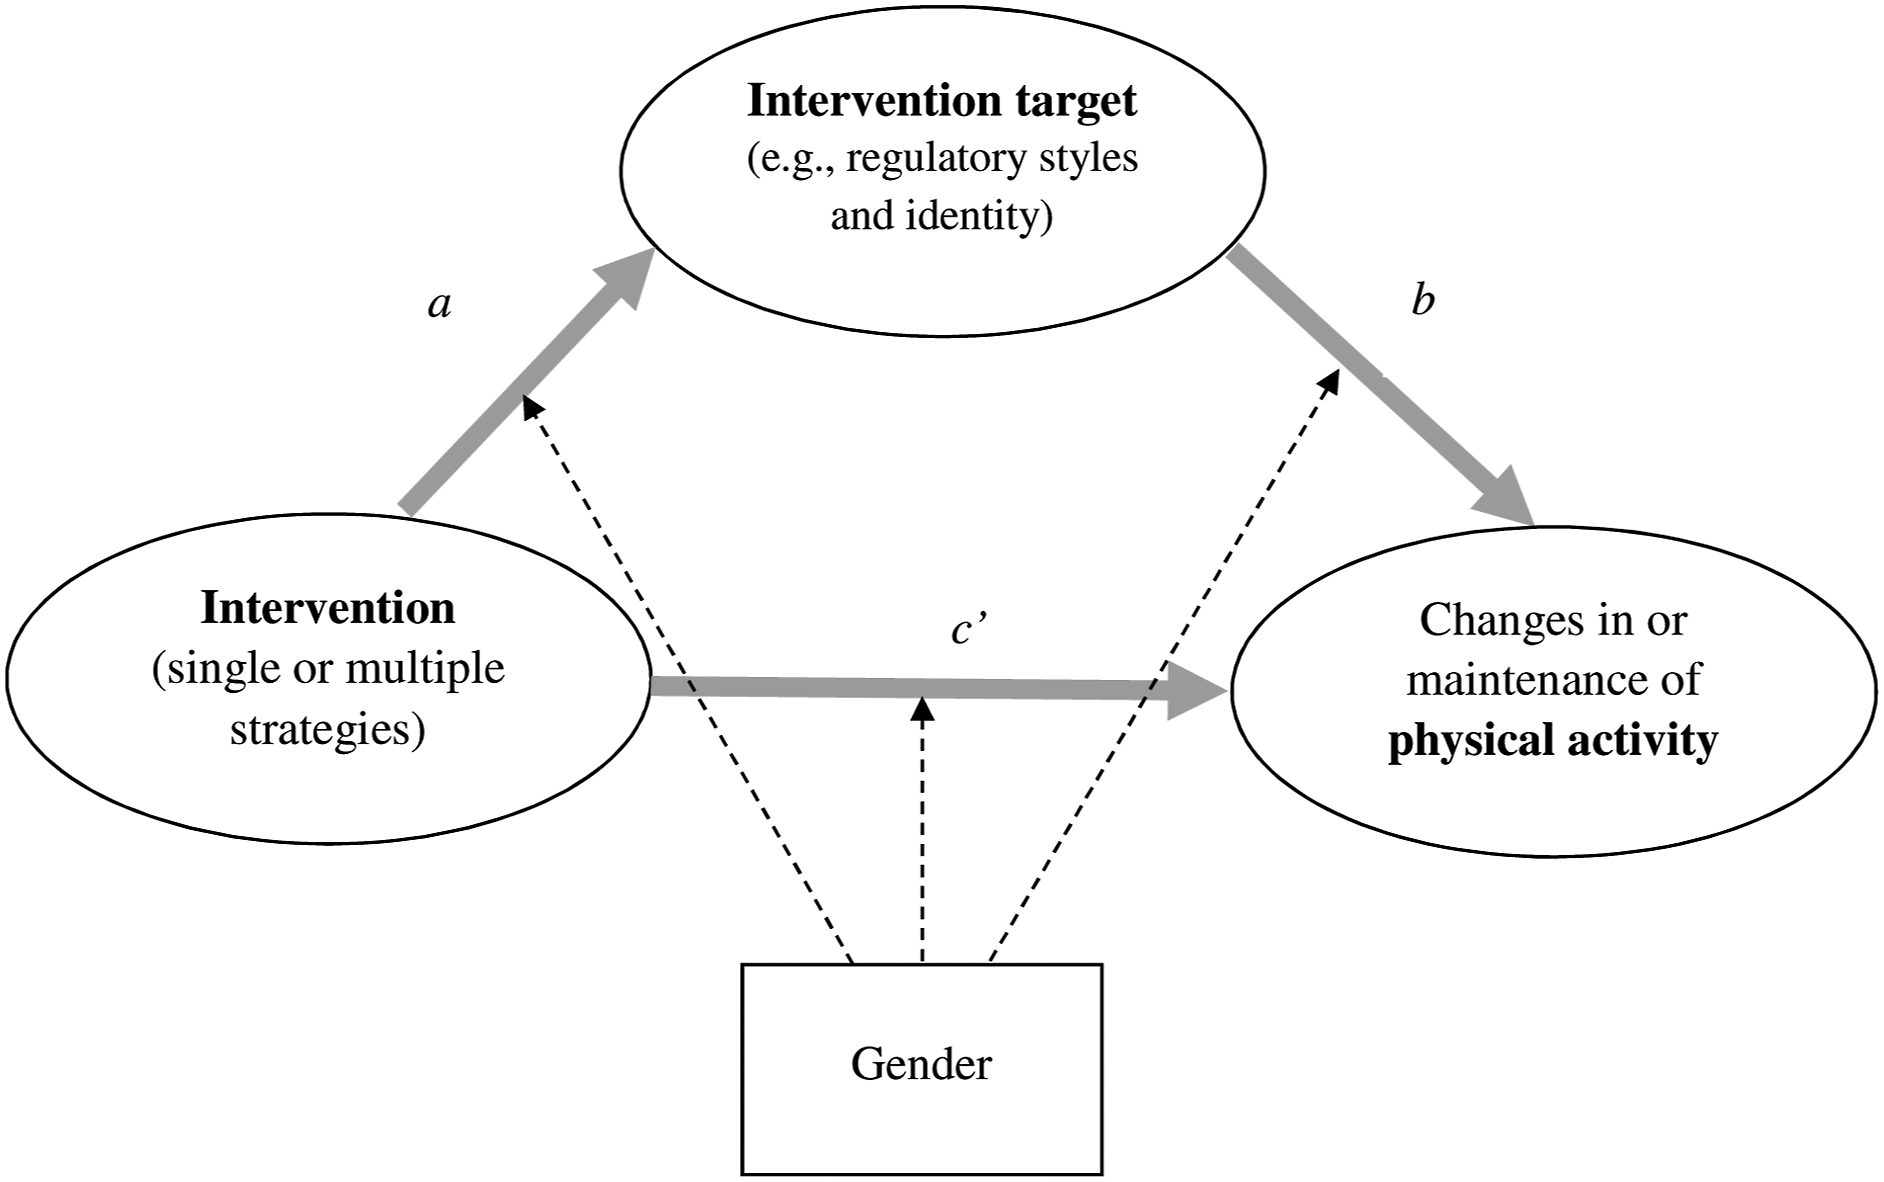
Longitudinal Invariance
A longitudinally invariant measure indicates that the meaning and interpretation of the underlying construct is the same when respondents are assessed across different measurement occasions. Understanding longitudinal invariance is important for any sampling timescale and relates to the dynamics of what is being measured. Motives for physical activity that emanate from one’s sense of self are likely stable over daily or weekly timescales (Ennigkeit & Hänsel, 2018) but may be impacted by contextual factors such as the occurrence of major life events or crises (Ogden & Hills, 2008). Because major life events are less likely to occur frequently, establishing longitudinal measurement invariance for a monthly (i.e., four-week) timescale is more relevant, as it would allow for the examination of whether changes in physical activity regulatory styles and identity are associated with changes in physical activity over several months (Ntoumanis et al., 2018). When measures are assumed to be invariant but actually vary across time, one may estimate inaccurate direct (reflected by path a or b in Figure 1) and indirect (reflected by a × b product in Figure 1) effects (Xu et al., 2020).
Aim 3: Convergent and Divergent Validity
Organismic integration theory and identity theory offer compatible theoretical views on the processes underlying motives that emanate from one’s sense of self and behavioral regulation. Both behavior-based identity and more self-determined motivation reflect greater autonomy and self-concordance with one’s broader life goals and values. Indeed, the process of internalization incorporates behaviors into one’s life in a way that makes them congruent with identity meanings and expectations, ultimately enabling the behavior to become self-reinforcing (Ryan & Deci, 2003; Soenens & Vansteenkiste, 2011). This study evaluates preliminary evidence for convergent and divergent validity of modified versions of the BREQ-3 and EIS based on relations between the measured constructs and physical activity. We expected (1) more self-determined regulatory styles to be more strongly and positively related to physical activity than less self-determined regulatory styles (Wilson et al., 2006), (2) identity to be positively related to physical activity (Strachan et al., 2010; Rhodes et al., 2016), (3) identity to be strongly and positively related to more self-determined regulatory styles and weakly related to less self-determined regulatory styles (Strachan et al., 2013; Vlachopoulos et al., 2011), and (4) regulatory styles nearer each other on the continuum of relative autonomy to be more strongly related than those farther apart (Ryan & Deci, 2017).
Methods
Participants and Recruitment Process
Participants for this study were recruited from ResearchMatch (www.researchmatch.org), which is an online health research volunteer registry created by several academic institutions and supported by the U.S. National Institutes of Health as part of the Clinical Translational Science Award (CTSA) program. Eligibility criteria for this study included being at least 55 years old, having no indication of cognitive impairment, and being able to read and understand English. Eligibility criteria were entered into ResearchMatch’s filtering system, and an initial invitation message was sent to randomly selected individuals meeting these criteria. We additionally filtered on gender in order to recruit approximately equal numbers of both men and women. A total of 5750 adults 55 years or older were sent the invitation message. Recipients of the initial invitation were asked if they were interested in participating in the study, and if so, they were emailed a unique link to an online Qualtrics survey. Four weeks later, those who provided their informed consent and answered at least one question from the first survey received a second unique link to an identical survey. See Supplementary Appendix B for a study timeline and participant flowchart. All participants were compensated with a $10 Amazon gift card. This study was approved by the Purdue University Institutional Review Board (IRB Protocol #: 1906022325).
Measures
Physical activity
Participants were first presented with the following definition of physical activity: “Physical activity refers to activities that get your body moving. Doing such activities would result in noticeable increases in breathing, heart rate, or sweating.” Consistent with recommendations to measure physical activity in older adults (Rikli, 2000; Sattler et al., 2020), examples of activities that older adults typically engage in (e.g., gardening, walking; Amireault et al., 2019; DiPietro, 2001) were provided.
Physical activity was then assessed in two ways. First, participants were asked how often in the past month, ranging from 1 (never) to 7 (4 days or more per week), they had been physically active for ≥30 minutes in a single day, not including activities that were part of their job, volunteering, or caretaker duties (Gionet & Godin, 1989; Godin et al., 1986). This single-item measure is arguably less liable to reporting errors that result from problems in recalling the duration of activities, as it does not ask about time spent in the activities (Matthews et al., 2012; Rikli, 2000). Among the adult population, including adults 55 years or older, correlations between active days and accelerometry measures (Milton et al., 2013; Wanner et al., 2014) and the frequency in visiting a fitness center (i.e., weekly number of mandatory check-ins or card swipes; Amireault & Godin, 2014) ranged from .44 to .57.
Second, physical activity was assessed using the Godin–Shephard Leisure-Time Physical Activity Questionnaire (GLTPAQ; Godin & Shephard, 1985; Godin, 2011), also known as the Godin Leisure-Time Exercise Questionnaire (GLTEQ; Godin & Shephard, 1997). The GLTEQ has been used in prior research examining the relationship between exercise, regulatory styles, and identity (Strachan et al., 2010; Wilson et al., 2006). Participants reported how many times on average they engage in strenuous (“heart beats rapidly”), moderate (“not exhausting”), and mild (“minimal effort”) physical activity for ≥15 minutes in a typical week. Again, appropriate examples of activities that older adults typically engage in were provided for each intensity category. Participants’ total leisure score index (LSI) was calculated using the following formula: LSI = (number of bouts of mild activity × 3) + (number of bouts of moderate activity × 5) + (number of bouts of strenuous activity × 9). Evidence supporting the use and interpretation of the LSI in the adult population (Jacobs et al., 1993; Miller & Freedson, 1994), cancer survivors (Amireault et al., 2015), and people with multiple sclerosis (Sikes et al., 2018) has been provided, with correlations between the LSI and accelerometry measures ranging from .38 and .60.
Modified Behavioral Regulation in Exercise Questionnaire
The BREQ-3 instrument (Markland & Tobin, 2004; Mullan et al., 1997; Wilson et al., 2006) used in this study consists of 24 items (four items per regulatory style subscale) that ask about reasons why the respondents engage in exercise on a scale from 1 (not true for me) to 5 (always true for me). This instrument was modified to replace “exercise” with “physical activity.” The full measure is presented in Supplementary Appendix C.
Modified Exercise Identity Scale
The EIS (Anderson & Cychosz, 1994) consists of nine items that are answered with responses ranging from 1 (strongly disagree) to 7 (strongly agree). The scale was modified by replacing the word “exercise” with “physical activity.” The full measure is presented in Supplementary Appendix D.
Demographics and Health Characteristics
Age, gender, race/ethnicity, employment status, relationship status, education, self-rated health, weight, height, and chronic conditions experienced were reported by the participants. Body mass index (BMI; kg/m2) was calculated from self-reported weight and height.
Survey Administration
Eligible individuals who indicated they would like to participate in the study provided the research team with their email address contact information. Before starting the survey at baseline, participants were asked to consent to an online consent form (i.e., responding “I agree” to the statement “By clicking ‘I agree’ below, you are indicating that you have read and understood this consent form and agree to participate in this research study.”). The physical activity questions were asked first, and the demographics and health characteristics questions were asked last. The order of the modified BREQ-3 and EIS were randomized using Qualtrics’ features, as were the items within each scale. The same survey administration procedures were used at follow up four weeks later. Data collection occurred from August to September 2019. Complete details regarding survey administration are reported in Supplementary Appendix B.
Data Analysis
Data were first screened for out-of-range values, missing data, and non-normal distributions using SAS version 9.4 (SAS Institute Inc, Cary, NC, USA) and Stata version 16 (StataCorp LLC, College Station TX, USA). Missing gender information was imputed based on gender reported at one occasion (i.e., either baseline or at follow up), if available. Responses to the identity items were visually inspected, which revealed that some distributions were negatively skewed. Similarly, the distributions of BREQ-3 items were found to be skewed (negatively for identified regulation and integrated regulation, positively for amotivation and external regulation). A comparison between completers (i.e., those who answered both surveys) and dropouts (i.e., those who answered only at baseline) was made (see Supplementary Appendix E). Finally, one respondent’s baseline answers were removed from the analyses due to evidence of a “nay-saying” response pattern (i.e., answering the lowest response possible for all scales).
Measurement invariance was tested using structural equation modeling (Bollen, 1989). First, the measurement models (latent variables for regulatory styles and identity) were assessed for fit using confirmatory factor analysis. Second, the forms of the models were tested for men and women and across the two measurement occasions, allowing parameter estimates to be different between groups and over time, to determine if the general structure (e.g., number of factors or dimensions) of the model was invariant. Third, factor loadings were constrained to be equal between groups and across time, and Lagrange multiplier tests were conducted to determine if the factor loadings were invariant (α = .01). These analyses were conducted using Stata version 16 (StataCorp LLC, College Station TX, USA). Observations (i.e., individual respondents’ answers at baseline and at follow up) were pooled from both surveys. Clustered bootstrapping with 500 replications and the robust cluster estimator were used to account for the clustering of repeated measures within respondents of the pooled sample and to calculate standard errors, correcting for non-normal outcomes. Observations were listwise deleted automatically when the bootstrap procedure was used. See Figure B2 For the final numbers of observations included in each analysis. The following model fit criteria (cut off for acceptable fit) were considered: the chi-square test (χ2; p > .05), Tucker-Lewis Index (TLI; ≥ .90), comparative fit index (CFI; ≥ .90), root mean square error of approximation (RMSEA; < .10), coefficient of determination (CD; ≥ .90), standardized root mean square residual (SRMR; < .08), item factor loadings, and item reliability values. Item reliability values represent the proportion of variance in an item due to the underlying latent variable (Bollen, 1989). Values ≥.70 were considered strong, values between .40 and .70 were considered moderate, and values ≤ .40 were considered weak (Bollen, 1989). Omega coefficients were also calculated to determine the extent to which the items were measuring the same underlying construct (McDonald, 1999). Finally, the latent variables represented by the models were correlated with each other and with physical activity to evaluate convergent and divergent validity within a structural equation modeling framework using clustered bootstrapping.
Results
A total of 410 individuals answered at least one question at baseline, and 314 answered at least one question at follow up. At baseline, about half of the respondents were women (48.9%) and on average 66.29 years (SD = 7.06) of age. The majority were white/Caucasian (88.0%), retired (54.3%), and educated (71.9% with a bachelor’s degree or higher). Participants’ average BMI was 27.91 (SD = 5.64), 69.9% reported having at least one chronic condition (e.g., asthma and cancer), and 49.1% considered themselves to be in “excellent” or “very good” health. Most participants were physically active at least two days per week over the previous month, with 44.5% reporting that they were active four days or more per week. The mean LSI was 37.77 (SD = 30.96). The means and SDs of the scale items at each time point are presented in Supplementary Appendix F. Results corresponding to Aims 1 and 2 are presented separately for each measurement instrument. Results corresponding to Aim 3 are presented afterward.
Modified Behavioral Regulation in Exercise Questionnaire
Aim 1: Measurement factor structure and reliability
Global Model Fit Indices for the Six Subscales of the Modified BREQ-3.
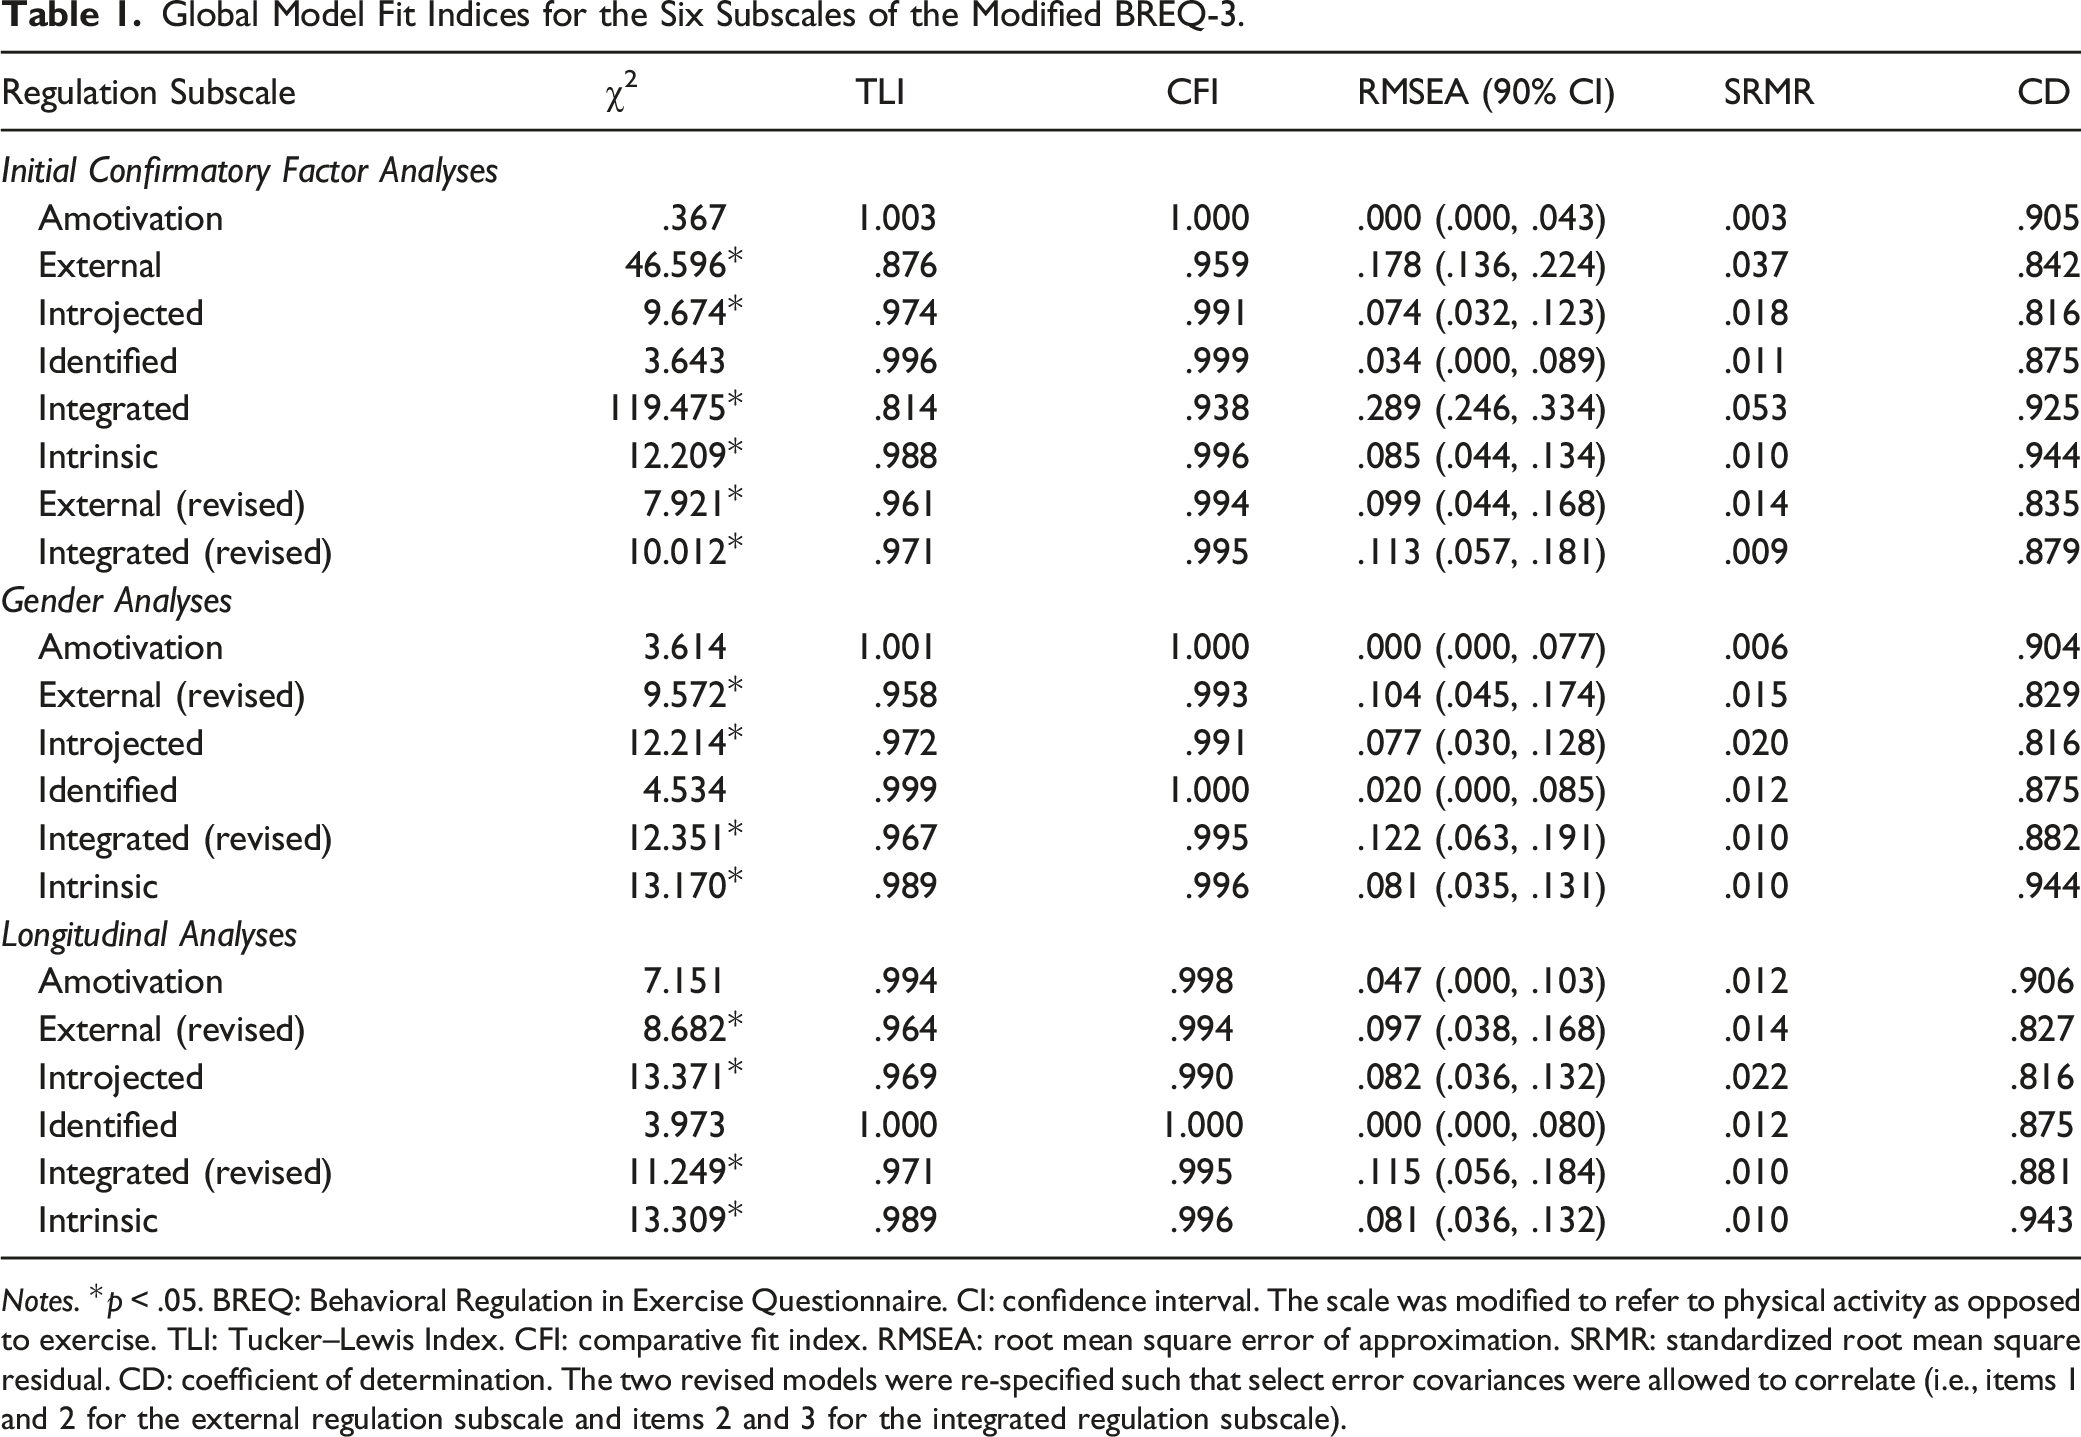
Notes. *p < .05. BREQ: Behavioral Regulation in Exercise Questionnaire. CI: confidence interval. The scale was modified to refer to physical activity as opposed to exercise. TLI: Tucker–Lewis Index. CFI: comparative fit index. RMSEA: root mean square error of approximation. SRMR: standardized root mean square residual. CD: coefficient of determination. The two revised models were re-specified such that select error covariances were allowed to correlate (i.e., items 1 and 2 for the external regulation subscale and items 2 and 3 for the integrated regulation subscale).
Aim 2: Measurement Invariance
Gender Invariance
The final models were tested for men and women simultaneously, allowing all estimates to vary across gender. All models fit well for both men and women (see Table 1, middle panel, for global fit indices; factor loading information is presented in Supplementary Appendix G). Therefore, the forms of the models were considered the same for both genders. Item reliability values were moderate to strong for all items for all subscales except for the first item of the external regulation scale (.34 and .30 for men and women, respectively) and for the last item of the identified regulation scale (.34 and .29 for men and women, respectively). Next, factor loadings were constrained to be equal between gender, and Lagrange multiplier tests indicated that factor loadings were the same for men and women for all subscales, indicating measurement invariance for the relationships between the constructs and the scale items across genders (see Supplementary Appendix G).
Longitudinal Invariance
The forms of the models were tested across a four-week timescale. All models fit well at both measurement occasions (see Table 1, bottom panel, for global fit indices; factor loading information is presented in Supplementary Appendix G). Therefore, the forms of the models were considered equivalent over time. Item reliability values were again moderate to strong for all items with the exception of the first item of the external regulation scale (.36 at baseline and .25 at follow up) and the last item of the identified regulation scale (.27 at baseline and .36 at follow up). Lagrange multiplier tests indicated that factor loadings were stable over time when constrained to be equal for all six subscales, indicating invariance for the relationships between the constructs and the scale items over time (see Supplementary Appendix G).
Once the fit and invariance of each one-factor model was established, the models were combined into one six-factor model representing the entire continuum of relative autonomy. This model fit the data well for the entire sample [χ2 = 933.067, df = 235, p = .000; TLI = .930; CFI = .940; RMSEA = .065, 90% CI: (.061, .070); CD = 1.000; SRMR = .068] and was subsequently found to be invariant across gender and time (data not shown).
Modified Exercise Identity Scale
Aim 1: Measurement factor structure and reliability
The one-factor model of physical activity identity was assessed first (Anderson & Cychosz, 1994). However, this conceptualization did not represent a well-fitting model for the data collected for this study. Although all factor loadings were significant and in expected directions, two reliability values were weak (.36 and .39), and global model fit indices indicated poor fit [χ2 = 421.691, df = 27, p = .000; TLI = .859; CFI = .894; RMSEA = .144, 90% CI: (.132, .156); CD = .923; SRMR = .055]. The two-factor model determined by Wilson and Muon (2008) was assessed, representing two dimensions of role identity and physical activity beliefs. All factor loadings for this model were significant and in expected directions. Only one item reliability value was weak (.37, item seven), with the remainder ranging from moderate to strong. Global model fit was improved [χ2 = 194.087, df = 26, p = .000; TLI = .938; CFI = .955; RMSEA = .096, 90% CI: (.083, .108); CD = .974; SRMR = .042]. Because these two models were not nested, Akaike’s information criteria (AIC) and Bayesian information criteria (BIC) were also investigated. AIC and BIC values were smaller for this second model (21,088.83 and 21,216.58, respectively) compared to the first model (21,314.43 and 21,437.62, respectively), indicating improved fit for the second model. This model was retained for the invariance analyses. Omega coefficients of the two-factor model were acceptable, ranging from .86 to .90 (see Supplementary Appendix F).
Aim 2: Measurement Invariance
Gender Invariance
The form of the two-factor model was tested for men and women, allowing all estimates to vary across gender. Supplementary Appendix G displays factor loading information for both gender groups. The global model fit was acceptable [χ2 = 234.928, df = 52, p = .000; TLI = .933; CFI = .951; RMSEA = .100, 90% CI: (.087, .113); CD = .975; SRMR = .046]. Therefore, the form of the model was considered invariant between genders. For both groups, item seven had the weakest reliability value (.34 for men, .41 for women). Otherwise, item reliability values ranged from moderate to strong. Results of the Lagrange multiplier tests indicated that all factor loadings were equal for men and women.
Longitudinal Invariance
Supplementary Appendix G displays factor loading information at baseline and follow up. The global fit indices indicated a good fit [χ2 = 230.672, df = 52, p = .000; TLI = .934; CFI = .952; RMSEA = .099, 90% CI: (.086, .112); CD = .974; SRMR = .045]. The form was thus considered longitudinally invariant over four weeks. Item reliability values ranged from moderate to large (with the exception of the value for item seven at baseline, .35). Lagrange multiplier test results indicated that factor loadings were equal over time.
Aim 3: Convergent and Divergent Validity
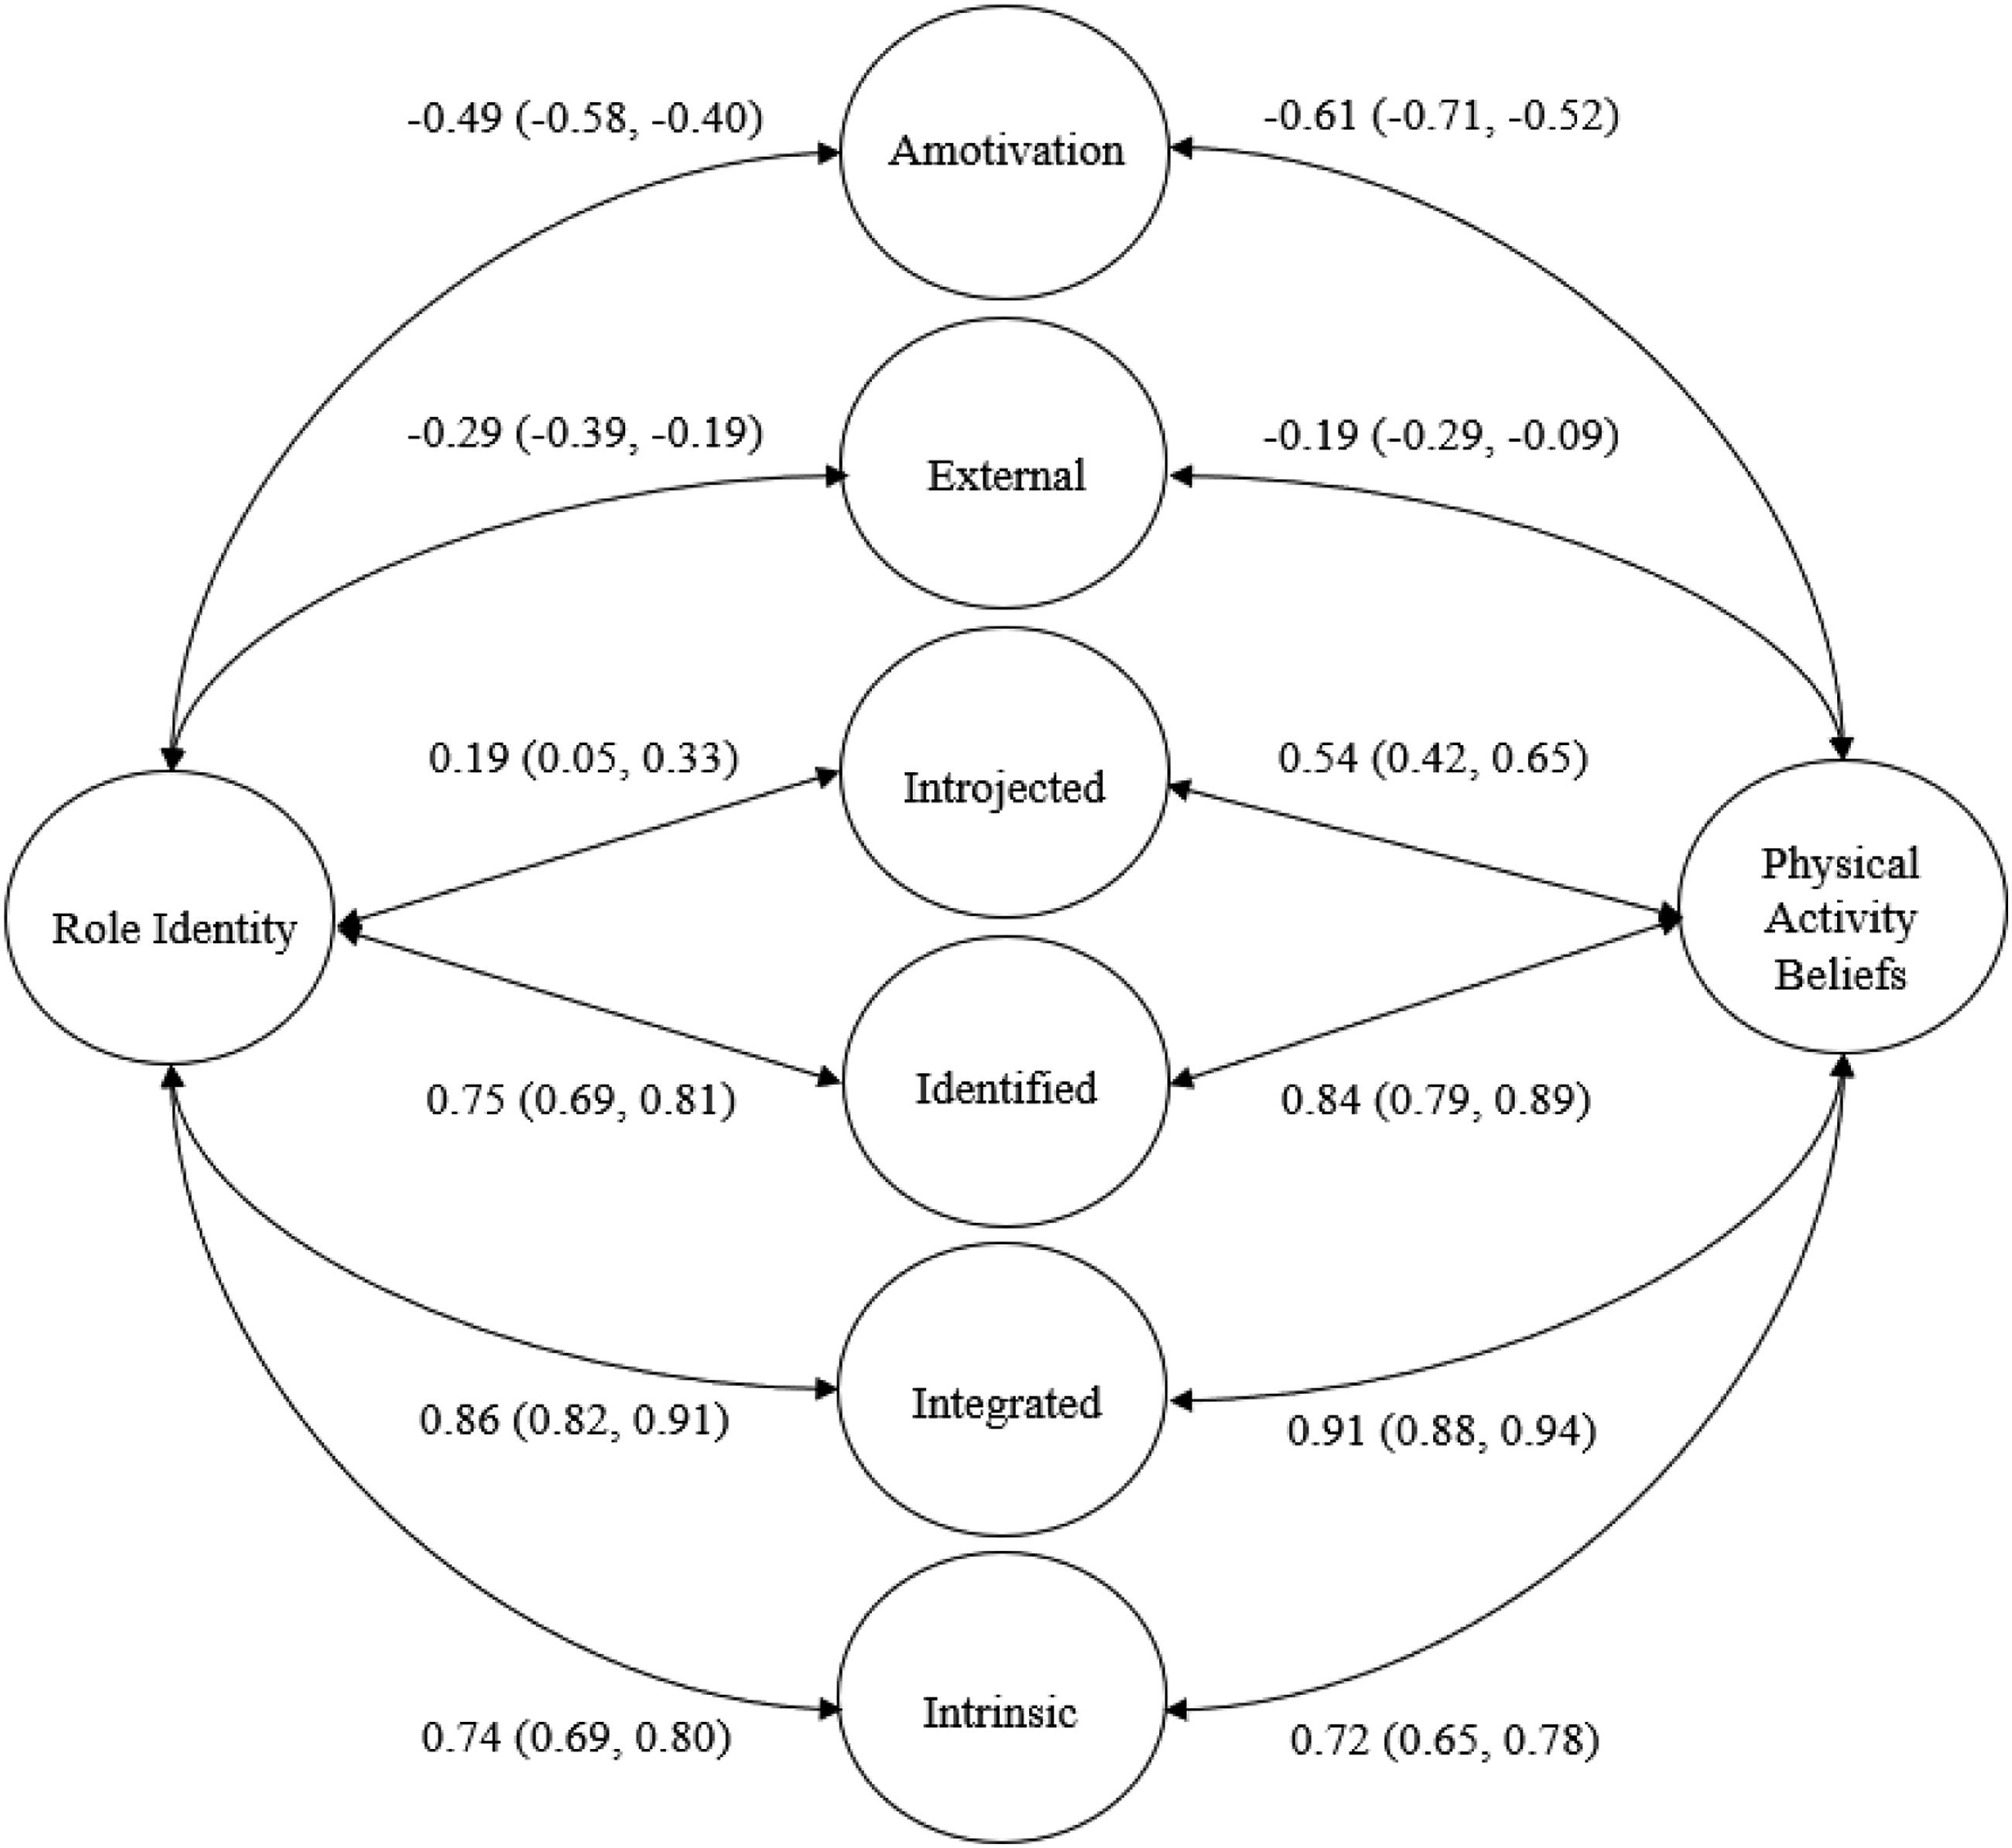
Using confirmatory factor analysis, correlations between the constructs and physical activity were estimated. The correlations (r [95% CI]) between role identity and physical activity were .62 [.53, .71] and .44 [.37, .52] for the frequency measure and the LSI, respectively. For physical activity beliefs, the correlations were .55 [.45, .64] and .35 [.27, .44] for the frequency measure and the LSI, respectively. The identity dimensions were also strongly related to each other (.83 [.77, .89]). The three more self-determined regulatory styles were strongly and positively related to physical activity, while external and introjected regulation were weakly related to physical activity (see Figure 2). Regulatory styles posited to be more similar with respect to their relative level of autonomy (i.e., more controlled vs. more self-determined) had larger positive correlations than those less similar (see correlation matrix, Supplementary Appendix H). Finally, Figure 3 illustrates the correlations between identity dimensions and regulatory styles. As hypothesized, role identity and physical activity beliefs were strongly related to more self-determined regulatory styles. Notably, introjected regulation was more strongly associated with physical activity beliefs (r = .54) than with role identity (r = .19). Relations Between Regulatory Styles and Physical Activity. Notes. Correlations between the regulatory styles are not shown for simplicity. The ellipses indicate that each regulatory style subscale is likewise measured by four items, although the external regulation subscale and the integrated regulation subscale each have a pair of correlated errors. δ denotes item errors. Bolded correlations and confidence intervals (in parentheses) represent relations between regulations and LSI. Non-bolded correlations and confidence intervals represent relations between regulations and the one-item measure. All correlations depicted are statistically significant (p < .05) except for the correlations between physical activity and introjected regulation (p > .05 for the correlation between LSI and introjected regulation, p = .05 for the correlation between the one-item measure and introjected regulation). Relations Between Identity Dimensions and Regulatory Styles. Note. All correlations depicted are statistically significant (p < 0.05).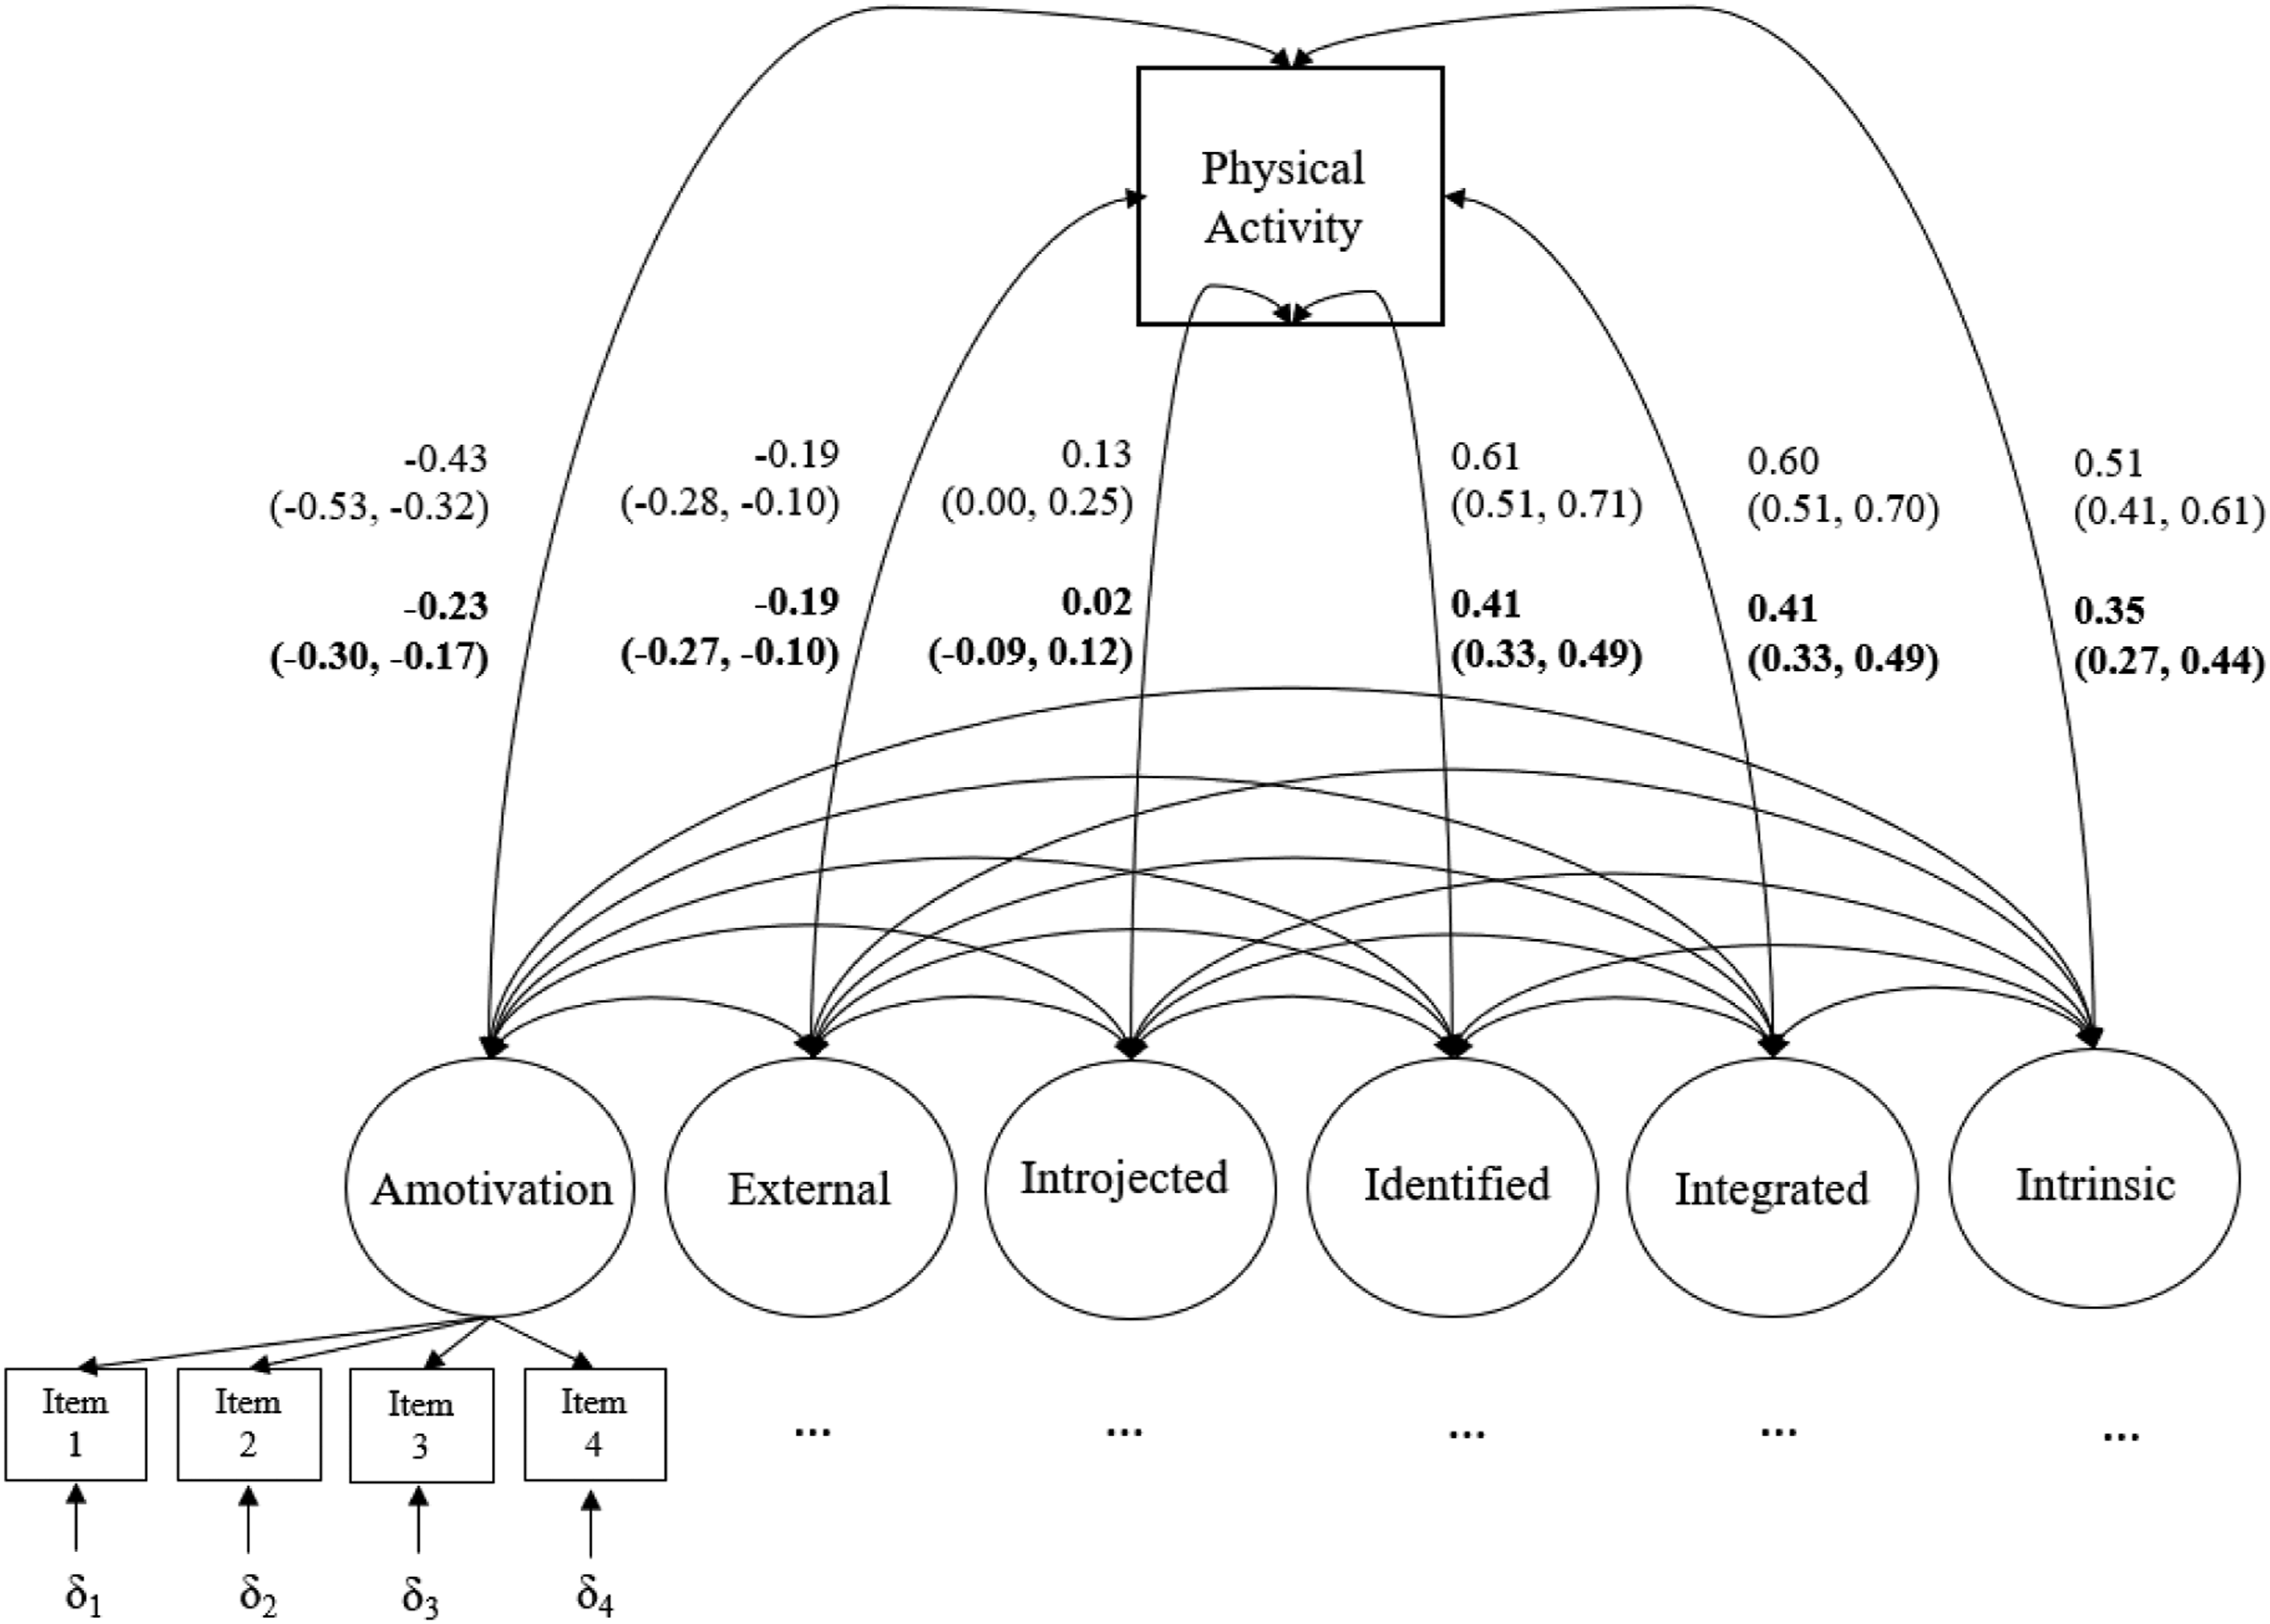
Discussion
Motives that emanate from one’s sense of self may help individuals of all ages sustain their physical activity. However, two common measures of such motives—the BREQ-3 and the EIS—were initially developed with younger samples to assess exercise-related constructs. By examining the psychometric properties of modified versions of the BREQ-3 and EIS among adults 55 years or older, we conclude that physical activity regulatory styles and physical activity identity are readily measurable in later life.
A substantial finding from this study was that the initial confirmatory factor analysis for the EIS did not support a one-factor model. Rather, a two-factor model representing role identity and physical activity beliefs as two dimensions of physical activity identity demonstrated a better fit. Although this two-factor model has been supported and used in past research (Ennigkeit & Hänsel, 2018; Ntoumanis et al., 2018; Vlachopoulos et al., 2011; Wilson & Muon, 2008), it has not previously found support among the older population (Perras et al., 2016; Strachan et al., 2010). Both dimensions of identity were positively related to each other (r = .83) and to physical activity (r = .44, role identity and LSI; r = .35, physical activity beliefs and LSI). These findings are similar to those of Wilson and Muon (2008), who reported a correlation of .70 between role identity and exercise beliefs, .41 between role identity and LSI, and .36 between exercise beliefs and LSI. Importantly, while both identity dimensions were positively related to more self-determined regulatory styles in the current study, physical activity beliefs was more strongly positively related to introjected regulation. Higher levels of introjected regulation (guilt-based motive) are associated with short-term engagement in physical activity (Deci & Ryan, 2008), as well as poorer psychological outcomes such as anxiety and the inability to cope with failures (Ryan & Deci, 2017). Thus, behavioral scientists may wish to focus on role identity rather than physical activity beliefs to promote sustained engagement in physical activity. Additionally, item scores are often consolidated into one measure of the underlying construct. Should the items of this scale be summed or averaged together into one measure of physical activity identity, the score may be primarily influenced by physical activity beliefs due to the larger number of scale items for this factor. Because role identity is measured with fewer items, and due to its weaker association with introjected regulation, investigators may opt to only measure role identity in future physical activity studies.
Correlations between more self-determined regulatory styles (identified and integrated regulation, intrinsic motivation) and LSI and correlations between less self-determined regulatory styles (introjected and external regulation) and LSI are similar to those reported by Wilson et al. (2006). A few remarks regarding two BREQ-3 items are worth noting. The first item of the external regulation subscale (“I am physically active because other people say I should”) had lower item reliability. External regulation represents a regulatory style where people engage in activities due to peripheral, controlling factors; however, the degree to which someone perceives an external source as controlling is of importance for determining the ultimate motivational impact (Deci & Ryan, 2008). Thus, the degree to which this item represents a controlling situation should be investigated in future studies. The last item of the identified regulation subscale (“I get restless if I’m not physically active regularly”) also had lower item reliability. This item has posed problems for other researchers when attempting to validate versions of the BREQ (e.g., Cid et al., 2018; Wilson et al., 2006). In fact, this item was removed from Markland and Tobin’s (2004) validation study due to an unspecified “error.” This item may more appropriately load onto introjected regulation (Cid et al., 2018), as it conveys an anxiousness that is possibly associated with the desire to avoid inactivity-related guilt (Mullan et al., 1997). Additional research should confirm which regulatory style this item best reflects for adults 55 years or older—or consider removing the item from the measure, as there is evidence supporting its omission for adults approximately 55 years of age (Markland & Tobin, 2004).
This study has limitations that should be acknowledged. Participants were recruited from an online health research registry of individuals living in the United States, and therefore findings may not generalize to the wider population of adults 55 years or older. Additionally, respondents were mostly white/Caucasian, educated, and in relatively good health. Finally, data were gathered via self-report, and shared method variance might have inflated the correlations between the theoretical constructs and physical activity.
Conclusion
Physical activity regulatory styles and identity are motives that may help adults 55 years or older internalize and self-regulate their physical activity. The modified BREQ-3 and EIS were found to be gender and time invariant, and the latent variables related to each other and to physical activity in ways consistent with theory. Importantly, a one-factor model of identity should not be considered the default, especially for the older population. We conclude that these measures are suitable for use among adults ages 55 and older and should therefore be used to good advantage in future research investigating these constructs among this population.
Supplemental Material
sj-pdf-1-jah-10.1177_08982643211063349 – Supplemental Material for Measuring Physical Activity Regulatory Styles and Identity Among Adults 55 Years or Older
Supplemental Material, sj-pdf-1-jah-10.1177_08982643211063349 for Measuring Physical Activity Regulatory Styles and Identity Among Adults 55 Years or Older by Mary Katherine Huffman, Sharon Christ, Kenneth F. Ferraro, David B. Klenosky, Kristine Marceau, and Steve Amireault in Journal of Aging and Health
Footnotes
Declaration of Conflicting Interests
The author(s) declared no potential conflicts of interest with respect to the research, authorship, and/or publication of this article.
Funding
The author(s) received no financial support for the research, authorship, and/or publication of this article.

Supplementary Material
Supplementary Material for this article is available online.
References
Supplementary Material
Please find the following supplemental material available below.
For Open Access articles published under a Creative Commons License, all supplemental material carries the same license as the article it is associated with.
For non-Open Access articles published, all supplemental material carries a non-exclusive license, and permission requests for re-use of supplemental material or any part of supplemental material shall be sent directly to the copyright owner as specified in the copyright notice associated with the article.
