
Abstract
Objectives
To investigate the impact of intergenerational mobility—measured as the difference between one’s own and one’s father’s education level—on overall life-satisfaction among Hispanic, White, and Black older Americans.
Methods
Data from the Health and Retirement Study were used to estimate life satisfaction by race/ethnicity using ordinary least squares regression (N = 5,057).
Results
Hispanic and Black older Americans report greater educational gains relative to their fathers compared to Whites. Despite having the lowest reported education levels, Hispanics report the highest life satisfaction across race/ethnic groups. However, net of education level and other factors, intergenerational mobility decreased rather than increased life satisfaction for Hispanic older Americans.
Discussion
These results indicate that intergenerational mobility may not confer equal benefits for overall life satisfaction across racial/ethnic groups. As Hispanic individuals continue to achieve higher education levels, it is unclear whether upward mobility will translate to positive or negative assimilation consequences.
Introduction and Objectives
In 2018, almost one quarter of older Americans were members of minority populations (Administration on Aging, 2020). Hispanic individuals constitute a substantial and growing minority group among older U.S. adults, with a 170% projected increase between 2011 and 2030 (Pollard & Scommegna, 2013). Maximizing the wellbeing of older adults overall is at the core of gerontological research and practice, but the factors driving quality of life across an increasingly diverse older population are not well understood. Life satisfaction, a global and subjective assessment of one’s own life circumstances, is considered a key quality of life indicator among older adults (Diener et al., 2013), and one that is predictive of a number of health and wellbeing outcomes including physical health and functioning, cognition, and health care utilization (Diener & Seligman, 2004; Jeste & Palmer, 2013). However, previous research suggests a Hispanic “paradox” in life satisfaction consistent with a number of other wellbeing measures, with more favorable outcomes for this group relative to the White majority (Calvo et al., 2017, 2019).
Educational attainment is generally predictive of life satisfaction, but some evidence suggests that this relationship is dependent on race and ethnicity. Although increased levels of education and upward mobility are associated with positive outcomes across the life course on average, non-White individuals do not seem to receive the same positive return from education for life satisfaction (Calvo et al., 2019). Hispanics have not historically had the relative benefit of educational “inheritance” from their parents compared to their Whites counterparts (Reeves & Venator, 2014), yet Hispanic individuals continue to make gains in education, especially in college enrollment rates (Tran & Valdez, 2017; Trevino & DeFreitas, 2014). The implications of generational increases in education for wellbeing among Hispanics have not been fully evaluated.
Concurrent with educational advances, the stress involved with acculturation and assimilation for both foreign- and native-born Hispanics may negatively impact their well-being (Viruell-Fuentes, 2011). Segmented Assimilation Theory (SAT) suggests that although minority groups may achieve some markers of majority acceptance (e.g., increased education), the process can be “bumpy” (Esser, 2010; Gans, 1992) where integration into mainstream society is only partial or fragmented. For example, managing potentially conflicting values and expectations between family and the university could impact educational persistence (Aguinaga & Gloria, 2015). Further, for Hispanics, educational gains may not translate to socioeconomic and related gains across the life course compared to the experiences of their White counterparts (Ortiz & Telles, 2017). Taken together, this research suggests the returns of upward mobility for quality of life may be diminished for Hispanic adults as they age into and throughout later life.
The current paper examines racial and ethnic differences in the impact of intergenerational mobility, net of one’s own education level, for overall life satisfaction among older Americans. Hispanic older adults are of particular interest for the current study because they have been shown to have paradoxically high levels of life satisfaction in later life in spite of lower overall levels of formal education. Hispanics in older cohorts also represent a unique mixture of first and second-generation immigrants representing different migration waves and educational trajectories. Studying these cohorts may provide insight not only related to diversity among older Americans but to the rapidly growing number of Hispanic young adults now enrolling in higher education.
Using data drawn from the Health and Retirement Study (HRS), we conceptualize and measure intergenerational mobility as the educational difference between an adult child and their father. We specifically address how this increase in education across generations has differential impacts on life satisfaction for Hispanic older adults in the U.S. compared to their Black and White counterparts.
The pan ethnic term Hispanic is used throughout this paper in place of other terms such as Latina/o, Latinx or the newest term Latine. It is clear that no one term is preferred by the heterogenous population of interest in this paper. The authors have chosen to use the term Hispanic, given the generation of the respondents in our sample. Terms such as Latinx and Latine better represent younger cohorts. In addition, the term Hispanic is gender neutral.
Background
Life Satisfaction Among Older Adults
Life satisfaction is a widely accepted indicator of subjective wellbeing in later life (Diener et al., 2013; George, 2010). Life satisfaction is seen as a dynamic, global evaluation of one’s life based on one’s own standards (Pavot & Diener, 2009). Thus, this measure is comprehensive, accounting for multiple dimensions of wellbeing including health, economic, social, and cultural domains (Calvo et al., 2017). Higher levels of life satisfaction are associated with a number of positive outcomes including better physical and cognitive function (Diener & Chan, 2011; St John et al., 2015). Previous work also suggests that life satisfaction, as a global evaluation of one’s life, may be particularly well suited to understanding racial and ethnic differences in the subjective wellbeing of older adults, as the factors on which individuals base their self-assessments are subjective and may allow inclusion of social and cultural factors beyond the relatively narrow factors previously emphasized in the literature (e.g., health and economic security) (Calvo, et al., 2017).
Education has been shown to be one of the strongest predictors of life satisfaction and is viewed as an “enduring resource for successful aging” (Meeks & Murrell, 2001). The strength of the relationship between education and life satisfaction is due to its stable nature across the life course, and it is also a strong indication of socioeconomic status, and the opportunities and aspirations education provides (Zhang et al., 2017). Given the known inequality of education and other relevant predictors, studies have begun to tease out disparities and paradoxes in life satisfaction among older adults across racial, ethnic, and immigrant groups. African American individuals generally report comparable or slightly lower levels of life satisfaction compared to Whites, depending on which socioeconomic and control variables are accounted for in statistical models (Calvo, et al., 2019). Despite having the lowest socioeconomic resources on average, Hispanic older adults report significantly higher levels of life satisfaction compared to their White counterparts, a finding consistent across both native and foreign-born individuals (Calvo et al., 2017). Higher levels of education are thought to be associated with greater life satisfaction (Zhang et al., 2017), yet native born Hispanic and Black older adults experience lower life satisfaction in association with higher levels of education (Calvo et al., 2019). These nuances in the drivers of life satisfaction suggest that socioeconomic achievement markers may differentially translate to assessment of life satisfaction across groups.
Research across ethnic groups also suggests very different experiences in achievement, upward mobility, and their returns. For example, second-generation Mexicans and Puerto Ricans are still relatively disadvantaged on educational attainment outcomes (Tran & Valdez, 2017). Maintaining ethnic identity and sense of belonging is particularly challenging in the racialized context of the U.S. and may lead to diminished wellbeing (Viruell-Fuentes, 2011). Avoiding stigmatizing environments and residing in neighborhoods with clusters of one’s own ethnic group appear to have protective effects for some ethnic groups (Knies et al., 2016). Hispanic women who are upwardly mobile acknowledge the need to resemble normative standards of the White middle-class culture. Yet, they continue to use their “middle-class ethnic capital” to support each other and create professional ethnic communities (Vallejo, 2009). This balancing act of having to both assimilate into mainstream society for individual upward mobility while remaining connected to and supporting one’s ethnic community may negatively affect well-being as individuals age. This may arise partially from the extra work of maintaining potentially conflicting identities, but also due to reduced socioeconomic returns of educational attainment over the life course among ethnic minorities. Together, this work suggests that attaining and maintaining traditional markers of assimilation, such as education, may come at a cost for those in non-majority or disadvantaged groups.
Segmented Assimilation Theory
The assimilation patterns of immigrant groups are vital to understanding social mobility in the U.S., and researchers have established and debated many theories regarding these processes. Segmented Assimilation Theory (SAT) contradicts the seamless transition of assimilation proposed by early theoretical frameworks which posit a somewhat uniform adoption of majority values, beliefs, and behaviors (Portes & Zhou, 1993). SAT states that there are multiple possible assimilation outcomes based on the immigrant groups’ exposure to social contexts upon arrival. These include the following: (1) upward mobility to the middle class as a result of assimilation, (2) maintained status in marginal communities leading to downward mobility, and (3) selective acculturation, or maintaining ethnic communities and effectively using resources for economic success while maintaining one’s ethnic identity (Esser, 2010; Portes & Zhou, 1993). Another key concept of SAT is “downward assimilation,” which captures the extent to which some immigrants and their children are assimilated in a manner that is not conducive to upward mobility. Downward assimilation is a reality for many second-generation immigrants and showcases the challenges of upward mobility across generations among non-White immigrants in particular. (Haller et al., 2011; Portes et al., 2009; Rumbaut, 2005).
Although socioeconomic status has increased among Hispanics living in the U.S., on average, they have not reached parity with the overall U.S. population. Although 13% of all Americans live in poverty, 19% of all Hispanics live in poverty—with 20% of Hispanics born in the U.S. living in poverty compared to 18% of foreign-born Hispanics (Noe-Bustamante & Flores, 2019). Furthermore, Hispanics reported almost $20,000 less in median income compared to non-Hispanic Whites in 2018 (Semega et al., 2019). Even in highly immigrant populated cities, those who are not members of the dominant immigrant group may suffer negative effects on their subjective well-being (Vaquera & Aranda, 2017).
The Role of Education in Upward Mobility
Educational attainment continues to be viewed as a vital component in promoting upward mobility, yet the ability to achieve high levels of education is not equally distributed in society. Some families offer negative social capital, such as the lack of bureaucratic understanding or links to low-income employment (Raymond-Flesch et al., 2017), and cannot assist with navigating educational or other structural systems. Although some individuals do gain an increased level of education compared to the previous generation, they may lack the knowledge and skills to navigate bureaucracies and key institutions which may ultimately diminish monetary and professional returns (Checchi & van de Werfhorst, 2018; Lareau, 2015). Beller & Hout, 2006 state “educational opportunity promotes social mobility not only by distributing human capital in many ways that are independent of social origins, but also by loosening the ties between occupational and income origins and destinations.” Individual educational attainment is strongly associated with parental educational attainment, whereby children in the top educational groups typically have parents with similar levels of education (Reeves & Venator, 2014). In addition, the economic resources families are able to provide do impact educational attainment (Pfeffer, 2018; Prix & Pfeffer, 2017), including but not limited to additional resources for test preparations (Buchmann et al., 2010) and better funded schools in wealthier neighborhoods (Owens et al., 2016). However, Hispanics, who are more likely to have parents without higher levels of formal education or income, have begun to surpass their parents’ educational level despite not having access to educational inheritance.
Beyond the experience of Hispanic older adults, the historical context of birth cohorts in our sample is also important as it pertains to educational attainment among African Americans. Significant institutional and structural changes pertaining to educational access for African Americans occurred during their formative years and continued into their early careers. The Civil Rights Movement, the Supreme Court decision Brown v. Board of Education in 1954, desegregating local school districts, followed by the 1965 Higher Education Act all influenced the academic outcomes facilitating higher achievement levels among African Americans (Bloome & Western, 2011). In addition, the introduction of Affirmative Action was signed into law by Executive Order in 1961 to ensure non-discriminatory employment practices. Thus, increased educational attainment led to increased work opportunities for Black men in the public-sector, white collar jobs, and skilled trade assisted by affirmative action policies. However, even as access to education increased, education has not served as the “the great equalizer” (Bloome & Western, 2011).
Despite the increased educational levels of older Hispanics and Blacks, many studies have shown evidence of Minorities’ Diminished Returns (MDRs) theory, arguing that despite increased socioeconomic status or education, minorities do not benefit equally from social mobility measures for health and wellbeing outcomes. For Hispanics, increased educational attainment is not protective against higher frequency of binge drinking (Assari et al., 2019) or risk of cardiovascular disease hospitalization (Assari & Bazargan, 2019). Black individuals with upward mobility do not benefit equally for self-rated health (Assari, 2018), economic returns, and mental health compared to Whites (Assari et al., 2018).
In sum, SAT and previous research on MDRs suggest that although education and upward mobility are linked to life satisfaction in later life, this association may not be equally positive across racial and ethnic groups. Minority adults have fewer socioeconomic returns over the life course compared to their White counterparts. Further, the challenges of upward mobility among racial and ethnic minorities are highlighted in the literature as extra “work” in maintaining multiple identities (Viruell-Fuentes, 2011). For the diverse group that comprises older Hispanic adults in these cohorts, there may be additional challenges of maintaining multiple cultures with conflicting values that may diminish assessments of one’s overall life as individuals age. Thus, upward mobility may not offer benefits, and could even work to counteract the “paradoxically” high levels of life satisfaction usually observed in this group (Calvo et al., 2017, 2019).
Research Question
This paper seeks to answer the following questions: How does intergenerational mobility among Hispanics, measured by the difference between an adult child’s educational attainment compared to their father, affect overall life satisfaction net of overall education level? How does this association compare to other race/ethnicity groups?
Research Design and Methods
Data
The analysis for this study uses data from the University of Michigan Health and Retirement study (HRS). The HRS is nationally representative biennial longitudinal panel study that surveys American adults ages 50 and over, as well as their spouse regardless of age. This study used a pooled cross-sectional dataset consisting of a combination of the 2012 and 2014 waves of the Leave Behind Questionnaire (“LBQ”) and core “fat” files, which are cleaned by the RAND Corporation, as well as the Tracker File. The LBQ, piloted in 2004 and fully adopted in 2006, is a psychosocial and lifestyle questionnaire. Starting in 2006, the LBQ was administered to half of the HRS respondents each wave, with respondents thus providing answers every other wave or four years. The Tracker File is the updated version of respondents’ basic demographic information, and is linked to the national death index (Smith et al., 2017). The HRS is the optimal dataset for addressing the goals of this study considering the type and availability of the survey items, longitudinal design, and that it is nationally representative.
The analysis includes those 65 years or older that completed either the 2012 or 2014 waves of the Leave Behind Questionnaire (“LBQ”). The selection of individuals 65 or older focuses the study on those of typical retirement ages to avoid potential confounding whereby the effects of work-related satisfaction might shape assessments of overall life satisfaction. This study centers on intergenerational mobility, measured as the difference between one’s own and one’s father’s education level, in its connection to overall life satisfaction among White, Black, and Hispanic older Americans. Using the HRS-LBQ, we examine educational gains among older adults (65+) compared to their father in connection to self-reported life satisfaction (N = 5,057).
Measures
Outcome variable
Overall Life Satisfaction in the HRS LBQ study is the well-established measure of self-evaluated quality of life (Diener et al., 1985). The index of life satisfaction was created by averaging the scores across all five items and setting the final score to missing for cases with three or more missing items. The five items were as follows: How much would you agree or disagree with the following statements: (1) in most ways my life is close to ideal, (2) the conditions of my life are excellent, (3) I am satisfied with my life, (4) so far, I have gotten the important things I want in life, and (5) if I could live my life again, I would change almost nothing. In both waves’ response options remained consistent using a Likert scale from “1 Strongly disagree” to “7 Strongly agree.” This variable was standardized to better understand the effects of race, intergenerational mobility, and other key variables.
Key variables of interest
The key variables of interest are race/ethnicity and intergenerational mobility. Intergenerational mobility is conceptualized and measured as the difference in years of education of the respondent compared to their father. During their HRS interview, respondents were able to self-identify their race and, if applicable, Hispanic ethnicity. Based on their responses to the race and ethnicity questions respondents were coded as either, non-Hispanic White, non-Hispanic Black, or Hispanic. Due to the small proportion of respondents who identified with another racial/ethnic category, we only include the three categories mentioned above. Respondents were also asked to select how many years of education their mother, father, and they completed. The intergenerational mobility variable was created by subtracting the father’s educational level (in years) from the respondent’s educational attainment (in years). During initial analysis the difference between the respondent’s education and their mother’s was also analyzed. However, preliminary findings did not yield a substantive difference from the presented results and the sample size decreased substantially for Hispanic respondents. This is likely because more Hispanic respondents did not know or did not report their mother’s education level relative to their father’s education. Thus, this study focuses on the effects of the difference in years of education between the respondent and their father, based on the historical educational context of this cohort and previous research suggesting educational level of fathers is more predictive of educational attainment (De Vries & De Graaf, 2008; Keage et al., 2016; Reeder & Conger, 1984), reason for attending college (Schlechter & Milevsky, 2010) and career aspirations (Khampirat, 2020). Race and years of education, along with other demographic information is maintained in the HRS Tracker File.
Other factors included in models are as follows: everyday discrimination, support from family, and support from children. An index for everyday discrimination was created by reverse-coding, and averaging the scores across the following questions: “In your day-to-day life how often have any of the following things happened to you…(1) treated with less courtesy or respect than other people, (2) receive poorer service than other people at restaurants or stores, (3) people act as if they think you are not smart, (4) people act as if they are afraid of you, (5) you are threatened or harassed, and (6) receive poorer service or treatment than other people from doctors or hospitals.” Response options were as follows: “Almost every day,” “At least once a week,” “A few times a month,” “A few times a year,” “Less than once a year,” or “Never.” The final score was set to missing if three or more items were not answered.
Indices for positive or negative support from family, and children were created by reverse coding all items and averaging the scores within each grouping (positive/negative) for family, and for children. Positive support questions were as follows: “How much… (1) do they really understand the way you feel about things, (2) can you rely on them if you have a serious problem, (3) can you open up to them if you need to talk about your worries.” Negative support questions were: “How often/much do they… (1) make too many demands on you, (2) criticize you, (3) let you down when you are counting on them, (4) get on your nerves.” Response options for both positive and negative support were as follows: “A lot,” “Some,” “A little,” or “Not at all.” Final scores were set to missing if there was more than one item missing values for the positive support, and more than two items with missing values for the negative support indices.
Control variables
Various demographic control variables include: nativity, gender, age, years of education, religion, living children, and a base-year variable created to account for the year the respondent completed the LBQ survey. Nativity, gender, and base-year are dichotomous variables. Respondents were coded as either born in the U.S. or not for nativity, and for gender they are coded as male or female. The base-year variable is coded as either “2012” or “2014” depending on the year the LBQ survey was completed by the respondent. Years of education and age are both continuous variables. Respondent’s age is based on their age at the beginning of the month when they took the survey and is their actual age in years. This study is limited to individuals age 65 and over. Respondents were asked to select the highest number of years of completed education from a list of zero to 17+ for themselves and their parents. Religion is a categorical variable based on which religious identity was selected among the following: “Protestant,” “Catholic,” “Jewish,” “No Religion,” or “Other Religion.” Living children is the number of living children of the respondent and spouse or partner.
In addition, four variables regarding health status are included as controls: self-reported health, functional limitations, depressive symptoms, and social engagement. Self-reported health is the respondent’s self-reported general health. Respondents were asked “Would you say your health is excellent, very good, good, fair, or poor?” This variable was reverse coded to “5 Excellent,” “4 Very Good,” “3 Good,” “2 Fair,” and “1 Poor.” Functional limitations is a count measure of how many activities respondents have difficulty completing. Activities include: walking one block, climbing one flight of stairs, kneeling, lifting, or carrying 10 pounds, picking up a dime, and pushing or pulling a large object. Depressive symptoms are the sum of the CES-D measure (Radloff, 1977), with higher values reflecting higher depressive symptoms in the past week. A scale of social engagement was created by averaging responses regarding how often respondents participate in the following social activities: “Do volunteer work with children or young people,” “Do any other volunteer or charity work,” “Attend educational or training courses,” “Go to a sport, social, or other club,” “Attend meetings of non-religious organizations, such as political or community interest groups.” Response options included: “Daily,” “Several times a week,” “Once a week,” “Several times a month,” “At least once a month,” “Not in the last month,” or “Never/Not relevant.” Responses were reverse coded so that higher scores represented higher social engagement. In addition, if two or more items were not answered the final score was set to missing.
Finally, three variables regarding financial status are included as additional controls: difficulty paying bills, total income, and total wealth. Difficulty paying bills is a treated as a continuous measure in which respondents selected from the following options regarding trouble paying their bills: “1 Not at all difficult,” “2 Not very difficult,” “3 Somewhat difficult,” “4 Very difficult,” “5 Completely difficult,” Total income is the total household income, reported in nominal dollars, based on the last calendar year and includes the respondent’s and their spouse’s income if applicable. Total wealth is the net value of total wealth less all debt, excluding a second home reported in nominal dollars. For this study, the inverse hyperbolic sine function was applied to both total income and total wealth in order to reduce the right skewness of these variables and support robust coefficients (Aihounton & Henningsen, 2021).
Analysis Plan
Descriptive Statistics of the Sample and by Race/Ethnicity.

Note. Statistical significance indicates significant differences between non-Hispanic Whites and Hispanics or non-Hispanic Blacks; t-tests used for continuous variables, chi-square tests for categorical measures. ***p<0.001; **p<0.01; *p<0.05.
In Model 2, an interaction term for intergenerational mobility and race/ethnicity was included to test the moderating effect related to the second research question. The same controls were carried forward from Model 1, however, additional factors thought to mediate the effect of intergenerational mobility on life satisfaction were also included. Marginal probabilities of life satisfaction were estimated by years of education and according to intergenerational mobility, with statistical difference tests calculated by racial/ethnic group. All analyses were conducted using Stata SE 14.
Results
Descriptive data for the sample (N = 5,057) is provided in Table 1. Older Americans report 13 years of education, on average, and gains of about 3.5 years over their fathers. On average, Hispanics report just under 10 years of education, Blacks report about 12 years of education, and Whites report 13 years of education. Hispanics and Blacks report educational gains of 4 years, while Whites report educational gains of 3 years over their fathers’ education, on average. Hispanics report the lowest levels of education compared to Whites and Blacks, however, have an additional year of educational gains compared to Whites.
Regression Results.
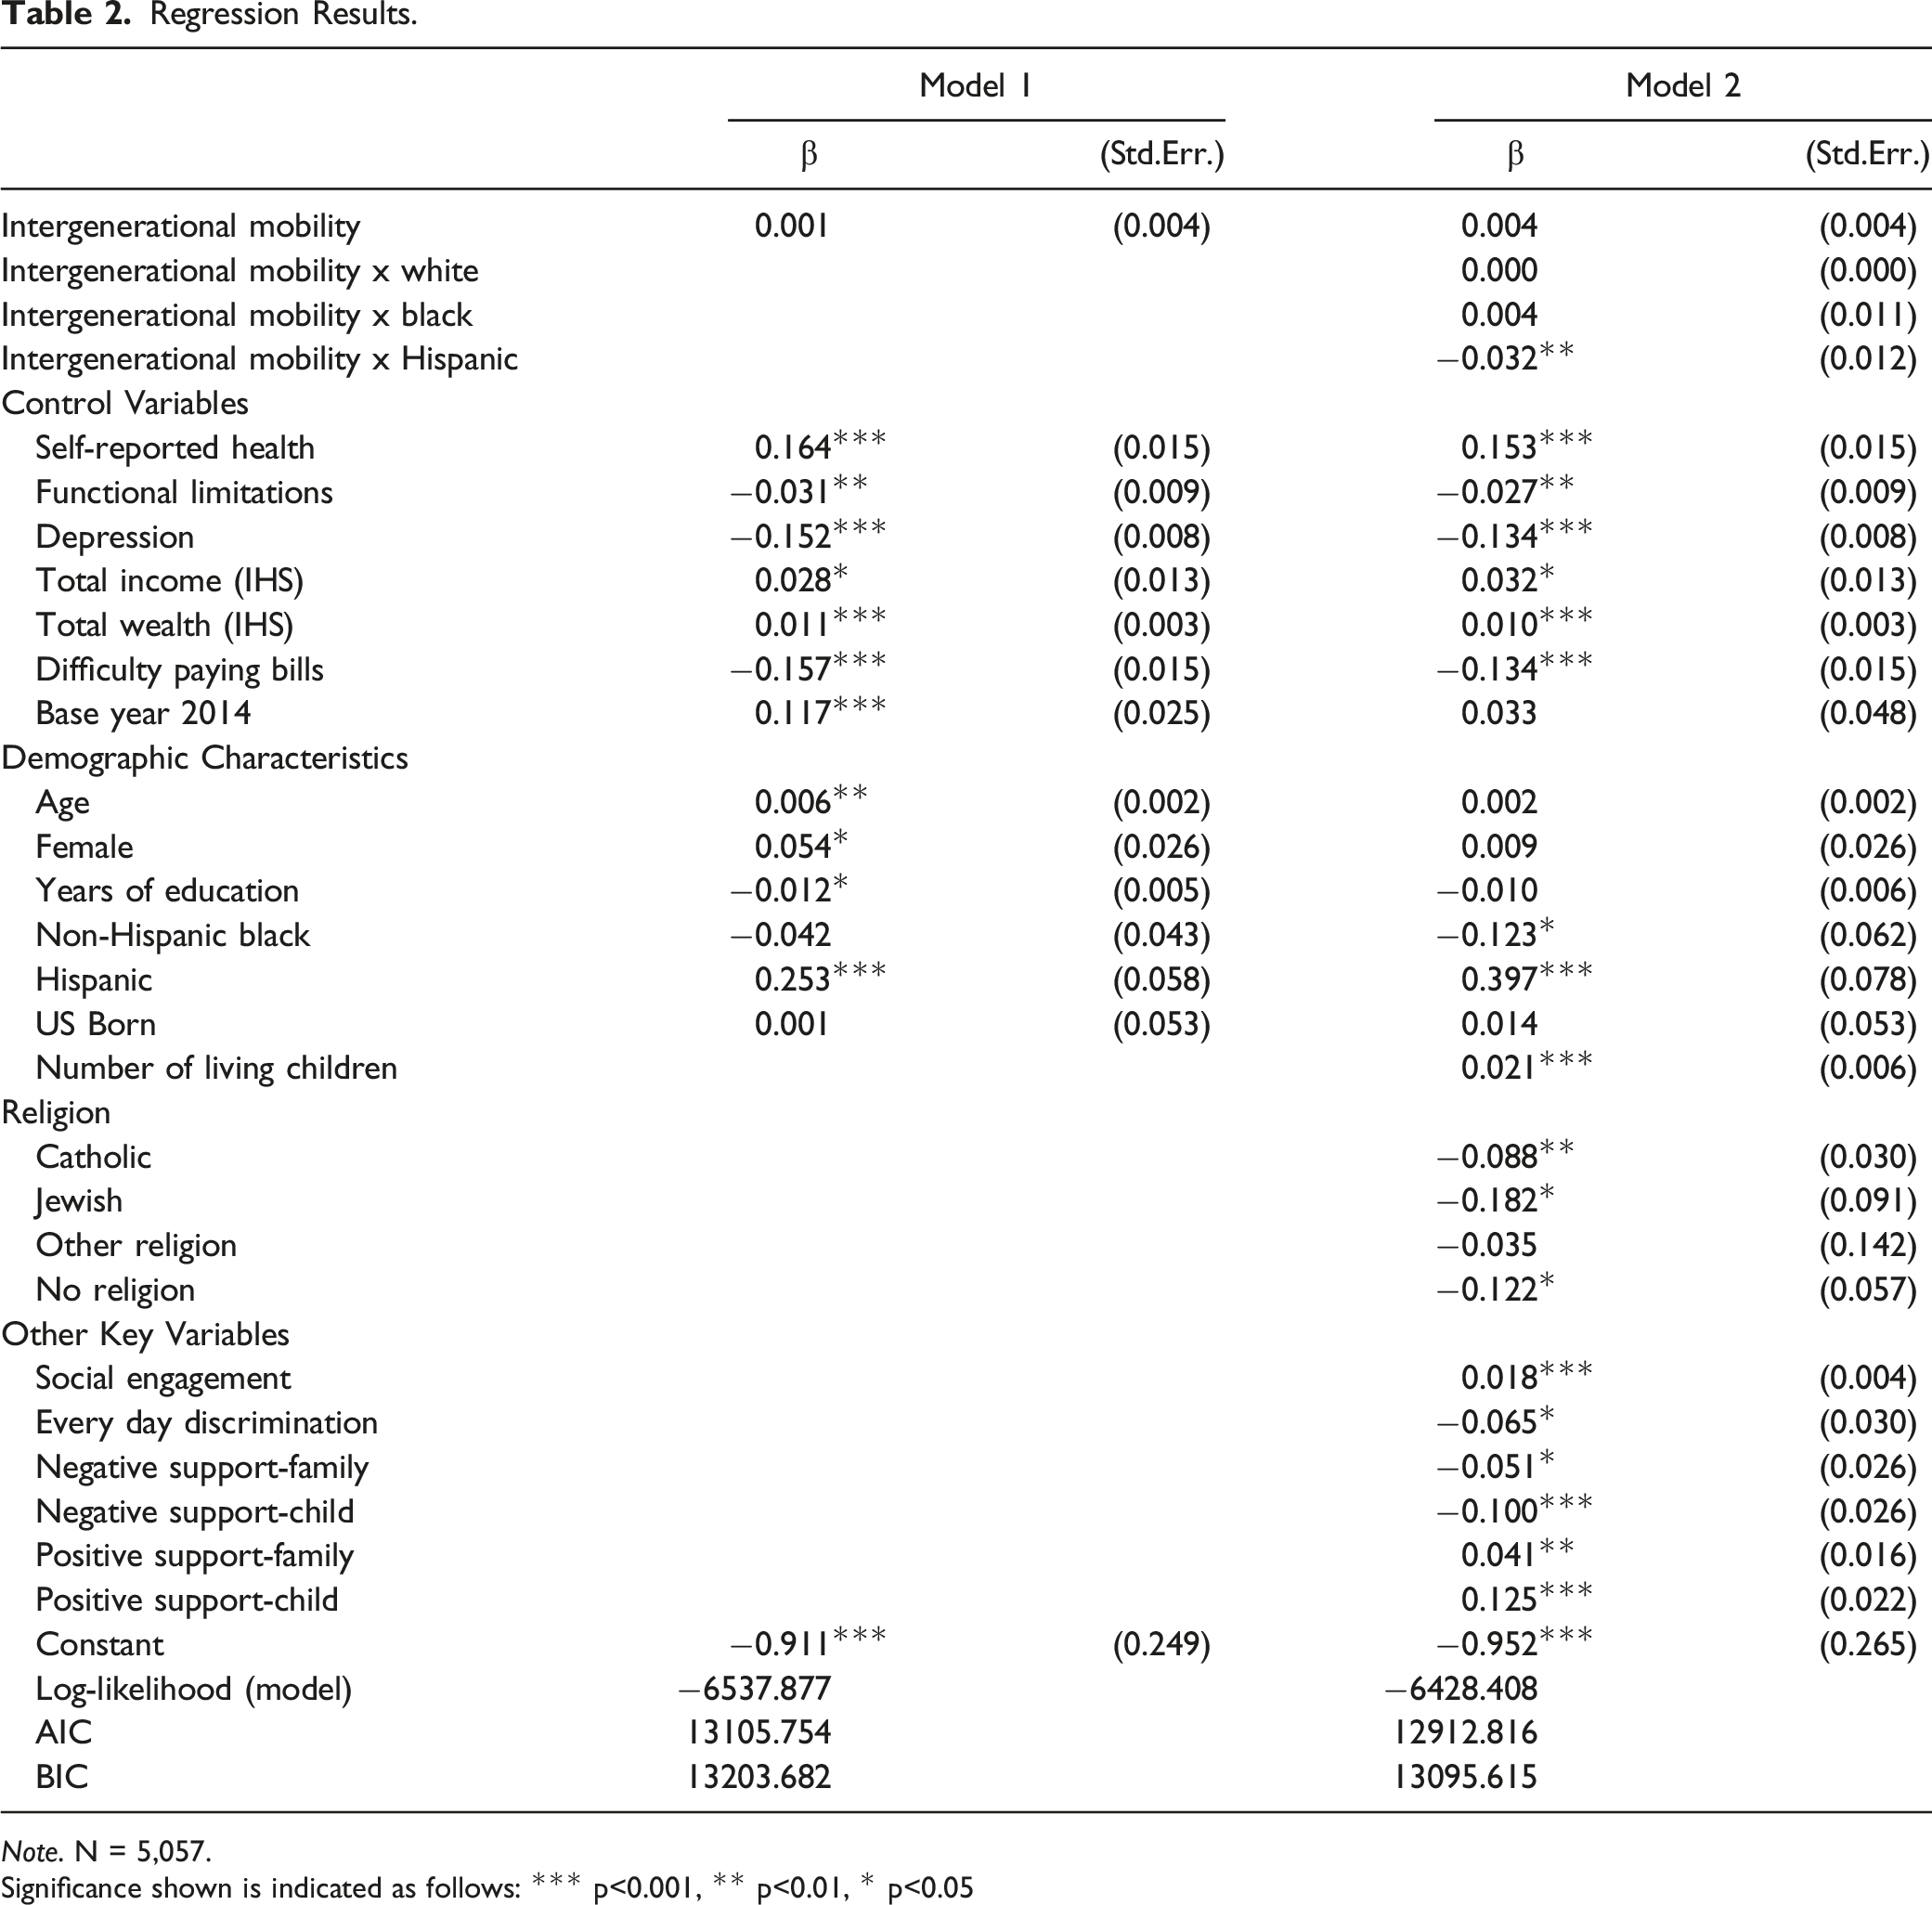
Note. N = 5,057.
Significance shown is indicated as follows: *** p<0.001, ** p<0.01, * p<0.05
Model 2 shows that race moderates the effect of intergenerational mobility on life satisfaction, but only for Hispanic older adults. Specifically, Hispanics experienced a decrease of 0.032 standard deviations in life satisfaction for each unit increase in intergenerational mobility, net of other variables, relative to Whites (p < 0.01). Among Black older adults, life satisfaction was not related to intergenerational mobility and was not statistically different from Whites net of all control measures (Model 2).
To evaluate these findings more thoroughly, we calculated marginal effects values based on intergenerational mobility values for each race group. Results are calculated based on Model 2, comparing Black older adults to Whites (Figure 1), and Hispanic older adults to Whites (Figure 2), holding all other measures at the mean. For Whites, intergenerational mobility is associated with a small, but statistically significant increase in life satisfaction. Among Blacks with low intergenerational mobility, life satisfaction is significantly lower than their White counterparts. However, for Black older adults who completed at least 7 additional years of schooling relative to their father, life satisfaction is not significantly different from Whites with similar intergenerational mobility. That is, intergenerational mobility buffers the life satisfaction disparity between older Blacks and Whites. Conversely, Hispanic older adults with low levels of intergenerational mobility have significantly higher life satisfaction relative to their White counterparts. However, upward intergenerational mobility is associated with a decline in life satisfaction for Hispanics whereby once Hispanics complete at least 9 additional years of schooling, life satisfaction is similar to their White counterparts. These results suggest that intergenerational mobility via educational gains does not confer equal benefits for overall life satisfaction across racial/ethnic groups. Life Satisfaction on Intergenerational Mobility for Blacks and Whites. Note. ** p < 0.01, * p < 0.05, indicates significant difference relative to Whites at the same level of intergenerational mobility. Life Satisfaction on Intergenerational Mobility for Hispanics and Whites. Note. *** p < 0.001 indicates significant difference relative to Whites at the same level of intergenerational mobility.

Discussion
This paper sought to answer the following questions: How does intergenerational mobility, among Hispanics, affect overall life satisfaction net of overall education level? and How does this association compare to other race/ethnicity groups? By conceptualizing and measuring intergenerational mobility as increased educational difference relative to one’s father, we tested whether this specific form of upward mobility, established (typically) early in adulthood but with persisting effects across the life course, is related to life satisfaction in later life. The results of this study suggest the returns from intergenerational mobility are quite different for Hispanics compared to other racial groups. Specifically, for Black individuals, upward intergenerational mobility seems to “close the gap” in life satisfaction disparities, compared to Whites, at roughly 7 years of increased education compared to one’s father (Figure 1) showing conflicting results to studies on Minorities’ Diminished Returns (MDR) focused on Black adults. This paper intentionally focused more on the Hispanic population given not only the growing nature of the group, and the strides made in increasing educational attainment, but most importantly, the fact that such a key value to this community, education, is not as protective as it is believed to be. In contrast, older Hispanics, on average, report higher levels of life satisfaction compared to older Whites, but upward intergenerational mobility abates this benefit, such that Hispanic life satisfaction decreases to levels comparable to Whites once they obtain at least 9 years of additional years of education relative to their father (Figure 2).
Although Hispanics may have better mortality outcomes relative to their socioeconomic status, (Calvo et al., 2017; Lariscy et al., 2014; Markides & Eschbach, 2011) this paradox does not seem to be as stable for life satisfaction. To better understand why intergenerational mobility seems to serve as a penalty for life satisfaction among Hispanics, we look to SAT. Although increased education may be preventing downward assimilation in terms of downward economic and social mobility, segmentation of assimilation suggests other perceptions of life quality may not increase in tandem with Hispanic’s intergenerational mobility. According to SAT, second wave immigrants (including Hispanics) face different contextual situations than first wave immigrants faced, such as not being perceived as White, speaking different languages at home, and having different economic opportunities within a vastly different economic system (Portes & Zhou, 1993).
Segmented assimilation could potentially be influencing the decline in life satisfaction among Hispanics with higher levels of upward mobility despite having increased educational outcomes. That is, even though they have increased education they maintain their minority status as members of marginalized communities in dominant institutions which may not value their perspective or view them as “token” or affirmative action hires. Although minority individuals gain increased education, they may not know the “rules of the game” and lack the cultural knowledge and the skills to navigate bureaucracies and key institutions designed and dominated by their White majority counterparts (Checchi & van de Werfhorst, 2018; Lareau, 2015). In addition, different cultural values and expectations may affect life satisfaction. Some families offer negative social capital, meaning they do not promote social mobility and cannot assist with navigating structural systems. Their capital (or lack thereof) may perpetuate the cycle of family inequality (Hardie & Seltzer, 2016; Raymond-Flesch et al., 2017). Finally, while Hispanics may have increased their socioeconomic status via increased education, they have not reached parity with the majority (Park & Myers, 2010). Experiences of minority groups not favored by government policies, such as immigration laws, influence the ability to move up the socioeconomic ladder, and/or be accepted as a member of a higher social class (Vaquera & Aranda, 2017).
A limitation of this study is that the measures associated with segmented assimilation were measured independently and did not mediate the effect of intergenerational mobility. Although Hispanics reported significantly higher levels of negative family support compared to Whites, the effect was not sufficient to mediate the findings reported here. This could be due to the higher levels of positive family support and social engagement. It is a challenge to capture the cultural conflict of increased intergenerational mobility. Future research should attempt to combine measures associated with segmented assimilation and comprehensively evaluate how it shapes outcomes including life satisfaction. Another limitation of this study is that it focuses on White, Black, and Hispanic birth cohorts born prior to 1947, and the effects of segmented assimilation may change with other groups and as subsequent cohorts matriculate into old age, particularly given historical and present-day contextual factors shaping the wellbeing of marginalized groups. In addition, the data are between eight to ten years old and much has happened, including changes in how immigrant families, many of whom are Hispanic, are viewed with the construction of the “wall” along the US Mexico border in 2018 and of course the most recent COVID-19 pandemic. Future research should attempt to see if there are any changes in life satisfaction based on these potential period effects.
Implications
The Hispanic population is projected to nearly double within the next four decades (Vespa et al., 2018). Further, high school dropout rates among the Hispanic population have dropped dramatically—from 32% in 2000 to 12% in 2014—yet, Hispanics still have the highest dropout rate compared to Blacks (7%) and Whites (5%) (Krogstad, 2016). Younger generations are continuing to make strides compared to the older adults in this study, who only averaged 10 years of education. According to a recent report by the Hispanic Association of Colleges and Universities (HACU) (2021), the percent of bachelor’s degrees conferred to Hispanic students increased from 6.5% to 14.9% between 2001 and 2019. Furthermore, HACU projects that Hispanic enrollment will exceed over 4 million students by 2025, the largest growth rate of any other racial-ethnic group. However, as Hispanics continue to achieve higher levels of education, will they continue to experience the negative effects of segmented assimilation on life satisfaction? Or will Hispanics become fully assimilated, and no longer be considered part of a subjective class who should be kept behind a “wall”? Will future Hispanic generations continue to lose the protective effects against mortality as they have during COVID-19 (Sáenz & Garcia, 2021)? Future studies should continue to research the effects of segmented assimilation on later generations as they continue to increase their intergenerational mobility and how different occupations may influence overall life satisfaction or other health outcomes. In addition, future studies could examine whether younger generations are less prone to downward assimilation compared to older generations.
Footnotes
Declaration of conflicting interests
The author(s) declared no potential conflicts of interest with respect to the research, authorship, and/or publication of this article.
Funding
The author(s) received no financial support for the research, authorship, and/or publication of this article.