



Abstract
Keywords
Introduction
Physical activity (PA) contributes to increased longevity, reduced morbidity, and improved health and well-being over the lifespan, including in middle age and older adulthood. In a study of older, community-dwelling women aged 70–79, women in the most physically active tertile experienced a 72% lower 5-year mortality risk compared to women in the least physically active tertile (Nicklett et al., 2012). Furthermore, even small amounts of PA have been found to be protective against health decline and mobility loss in older adulthood (Simonsick et al., 2005). Despite these health benefits, physical inactivity is the norm among middle-aged and older adults; approximately 28% adults aged 50 and older do not engage in leisure-time PA (Watson et al., 2016).
Neighborhood ecology, or the physical and social characteristics of one’s neighborhood and immediate surroundings, has long been recognized as an important factor shaping PA behaviors across the lifespan (Barnett et al., 2017; Diez Roux & Mair, 2010). Compared to other age groups, older adults spend a greater amount of time in their residential neighborhoods for social, recreational, and task-related activities; thus, the area close to one’s home is particularly impactful on the health and well-being of older adult populations (Michael & Yen, 2014). Indeed, in a study of 434 older adults aged 60 and older in Canada and the United States, participants reported that they engaged in light, moderate, and vigorous leisure-time PA most frequently at home (87.1%) or within three blocks of one’s home (76.5%) (Chaudhury et al., 2016). Therefore, the location of one’s home and community provide a context for engagement in PA, which is increasingly influential in older adulthood (Wiles et al., 2012).
Social cohesion is one aspect of the neighborhood social environment thought to influence PA (Cagney et al., 2009; Mendes de Leon et al., 2009; Quinn et al., 2019; Yi et al., 2016). Neighborhood social cohesion entails the perceived connectedness among neighbors and the extent to which individuals in that neighborhood are willing to intervene on behalf of other neighbors for the common good (McNeill et al., 2006). High neighborhood social cohesion may influence PA through the extended social network, greater social support (Chaudhury et al., 2012, 2016), enhanced communication, and social norms reinforcement (Chaudhury et al., 2016). In addition to neighborhood social cohesion, the physical conditions of a neighborhood—such as the presence or absence of hazards—also shape opportunities for PA. Previous research has identified environmental predictors of PA across the lifespan, including access to facilities or services (Gebauer et al., 2020b; Ranchod et al., 2014), access to public transportation (Gebauer et al., 2020b), walkability (Gebauer et al., 2020a; King et al., 2011; Kwarteng et al., 2014; Orstad et al., 2018) vandalism/littering (Strong et al., 2013), and traffic (Chaudhury et al., 2012). For example, Chaudhury et al. (2012) found that accessible seating and sidewalks that are even, wide, and well-lit promote PA in older adults. Perceptions of neighborhood safety have been found to be positively associated with PA (Chaudhury et al., 2012; Clark et al., 2009; Kwarteng et al., 2014; Mooney et al., 2017; Tucker-Seeley et al., 2009). Overall, findings suggest that neighborhoods with more favorable social and physical environments can provide social support and resources that promote PA.
Persistent racial and ethnic differences can be observed in PA behaviors in middle age and older adulthood. According to the Center for Disease Control and Prevention (2020), the prevalence of physical inactivity is higher for Hispanic/Latinx populations (31.7%) and non-Hispanic Blacks (30.3%) compared to non-Hispanic Whites (23.4%). While the reasons for these racial and ethnic differences in PA behaviors are not fully understood, a growing body of evidence suggests that the neighborhood environment could exacerbate racial and ethnic inequalities in health over the lifespan (Diez Roux & Mair, 2010; Ferraro et al., 2017; Franzini et al., 2010). Structural racism creates unequal access to amenities and other resources in neighborhoods that promote PA (Franzini et al., 2010; Hannon et al., 2012; Moore et al., 2008; York Cornwell & Cagney, 2014). In contrast to predominantly White neighborhoods, predominately Black and Hispanic/Latinx neighborhoods are significantly less likely to have recreational facilities (Franzini et al., 2010; Moore et al., 2008), green space (Browning & Rigolon, 2018), and favorable social processes that support outdoor PA, such as higher collective efficacy, stronger social ties, and higher satisfaction with one’s neighborhood (Franzini et al., 2010; York Cornwell & Cagney, 2014). Unlike predominantly White neighborhoods, predominantly Black and Hispanic/Latinx neighborhoods tend to have worse sidewalk conditions (Franzini et al., 2010) and higher perceived neighborhood danger, resulting in residents being more afraid to walk alone at night (York Cornwell & Cagney, 2014). Racial/ethnic disparities in accessing neighborhood-level resources that promote PA could partially explain lower levels of physical inactivity among Black and Hispanic/Latinx older adults compared to their non-Hispanic White counterparts (Diez Roux & Mair, 2010; Ferraro et al., 2017).
Neighborhood social and physical environment may have distinct effects on the health outcomes and health-promoting behaviors of older adults with different racial/ethnic backgrounds. There is mixed evidence regarding racial/ethnic differences in the association of neighborhood social cohesion with health and behavioral outcomes (Echeverria et al., 2008; Millar, 2020; Mulvaney-Day et al., 2007; Murillo et al., 2016, 2019; Quinn et al., 2019; Wong et al., 2018; Yi et al., 2016). In a study based on a nationally representative sample of US adults aged 18 and older (N = 64,754) conducted by Yi et al. (2016), higher neighborhood social cohesion was associated with higher odds of meeting PA guidelines among non-Hispanic Whites and Hispanic/Latinx adults, but not among non-Hispanic Blacks and Asian Americans. In a similar vein, in a study by Murillo et al. (2016), Hispanic/Latinx adults who reported higher social cohesion were more likely to meet the PA guidelines compared to those reporting lower levels of social cohesion (OR: 1.33; 95% CI: 1.17–1.52). In contrast, other studies found that the association between neighborhood social cohesion and PA did not differ by race/ethnicity (Echeverria et al., 2008; Quinn et al., 2019).
Evidence regarding racial/ethnic differences in the relationship between physical environment and health outcomes and health-promoting behaviors has been mixed and not well-understood (O’Brien et al., 2019; Echeverria et al., 2008; Kwarteng et al., 2014; Millar, 2020). In a study of a racially and ethnically diverse older cohort, the effects of neighborhood physical environment (e.g., exposure to trash and violence, access to recreational facilities, sidewalks) on walking behavior were not significantly different across non-Hispanic Whites, non-Hispanic Blacks, Hispanic/Latinx participants, and Chinese Americans (Echeverria et al., 2008). In contrast, Kwarteng et al. (2014) found that neighborhood physical disorder was more negatively associated with PA among non-Hispanic White participants than among non-Hispanic Black and Hispanic/Latinx participants. Neighborhood physical disorder has also been linked to poorer physical function only in non-Hispanic White respondents aged 65 and older, and not among non-Hispanic Black and Hispanic/Latinx participants (Millar, 2020). These mixed results call for further investigations on the moderating effects of race/ethnicity on the association between PA and neighborhood environment.
Of those studies that have examined the relationships between PA and the neighborhood environment (Chaudhury et al., 2016; Gebauer et al., 2020a; Gebauer et al., 2020b; Kwarteng et al., 2014; Mendes de Leon et al., 2009; Mooney et al., 2017; Murillo et al., 2016; Quinn et al., 2019; Ranchod et al., 2014; Strong et al., 2013; Whitaker et al., 2019; Yi et al., 2016), only a few utilized longitudinal designs (Mendes de Leon et al., 2009; Mooney et al., 2017). Lack of evidence from longitudinal designs challenges the ability to ascertain the direction of a relationship between the neighborhood environment and PA. To address the gaps discussed above, the present study examined the associations between perceptions of the neighborhood environment and PA among a nationally representative sample of US adults aged 50 and older. Specifically, we tested the following hypotheses: (1) respondents who perceive their neighborhood to have higher social cohesion engage in higher levels of PA; and (2) respondents who perceive their neighborhood to have a more positive physical environment engage in higher levels of PA. Further, we tested for differences in neighborhood effects by race/ethnicity. We hypothesized that (3) the effects of neighborhood—perceived social cohesion and perceived physical environment—on PA are stronger among non-Hispanic Whites than among non-Hispanic Black and Hispanic/Latinx participants. We also examined specific aspects of perceived social cohesion and perceived physical environment in relation to PA, controlling for individual-level sociodemographic and health-related characteristics.
Methods
We examined data from the Health and Retirement Study (HRS), a nationally representative and prospective panel study of Americans aged 50 and older. The HRS has been fielded biennially since 1992 to provide data on the health, economics, and demographics of aging, including the intersection of these factors with the retirement process. Participants were sampled based on a multi-stage area probability design involving geographic stratification and clustering, including the oversampling of African Americans, Hispanic/Latinx participants, and residents from Florida (Sonnega et al., 2014).
The current study includes data from 2006 to 2014 HRS core interviews (RAND version) and the 2006 to 2014 Psychosocial and Lifestyle Questionnaire (for perceived neighborhood environment measures). Beginning in 2006, a rotating 50% of the HRS core sample participated in a psychosocial leave-behind questionnaire that involves topics on well-being, lifestyle, social relationships, personality, and self-related beliefs (Smith et al., 2013). Among those 50% selected, an alternating cohort approach was established for the Psychosocial and Lifestyle Questionnaire: Cohort 1 (assessed in 2006, 2010, 2014) and Cohort 2 (assessed in 2008 and 2012). We included the measures of the neighborhood environment from these two rotating cohorts (2006–2014) to increase statistical power and precision (as done in Chopik et al., 2018; Crowe et al., 2021). Thus, depending on the cohort to which they were assigned, each participant had 2 or 3 measures of their neighborhood environment.
Inclusion criteria for current analyses were: (1) aged 50 and older, (2) with at least one wave of available data on the perceived neighborhood environment, physical activity measure, and covariates, and (3) interviews were not answered by proxy. Proxy interviews were excluded as past studies have demonstrated lower reliability of proxy (vs. self-respondent) data for questions regarding self-reported recreational PA (Nelson et al., 1994). 20,881 individuals participated in one or more of the HRS across five survey waves (2006–2014), 2888 respondents were excluded from our analysis for the following reasons: (1) aged 49 and younger (n = 1007), (2) missing race/ethnicity measures across all waves (n = 19), and (3) interviews were answered by proxy (n = 1881), resulting in an analytic sample over five waves of 17,974 respondents. Every respondent had at least one observation for physical activity and perceived neighborhood environment measures across survey waves (no participants were excluded due to missingness for these measures). Only 19 respondents (<1%) were excluded due to missingness on race/ethnicity measures across all waves. Those who were interviewed by proxy (and excluded from the analyses) were found to be less physically active, older, and more likely to be non-Hispanic White and male. Proxy respondents reported higher numbers of chronic conditions and more difficulties in physical function but did not report significantly different perceptions of the neighborhood environment from self-respondents. At the first wave (2006), the sample size was 13,590. New participants were enrolled to supplement the loss of the previous wave in each survey year. Details on the inclusion of analytic sample across waves are illustrated in Figure 1. Diagram of analytic sample across survey waves, Health and Retirement Study Core and Psychosocial and Lifestyle Questionnaires, 2006–2014.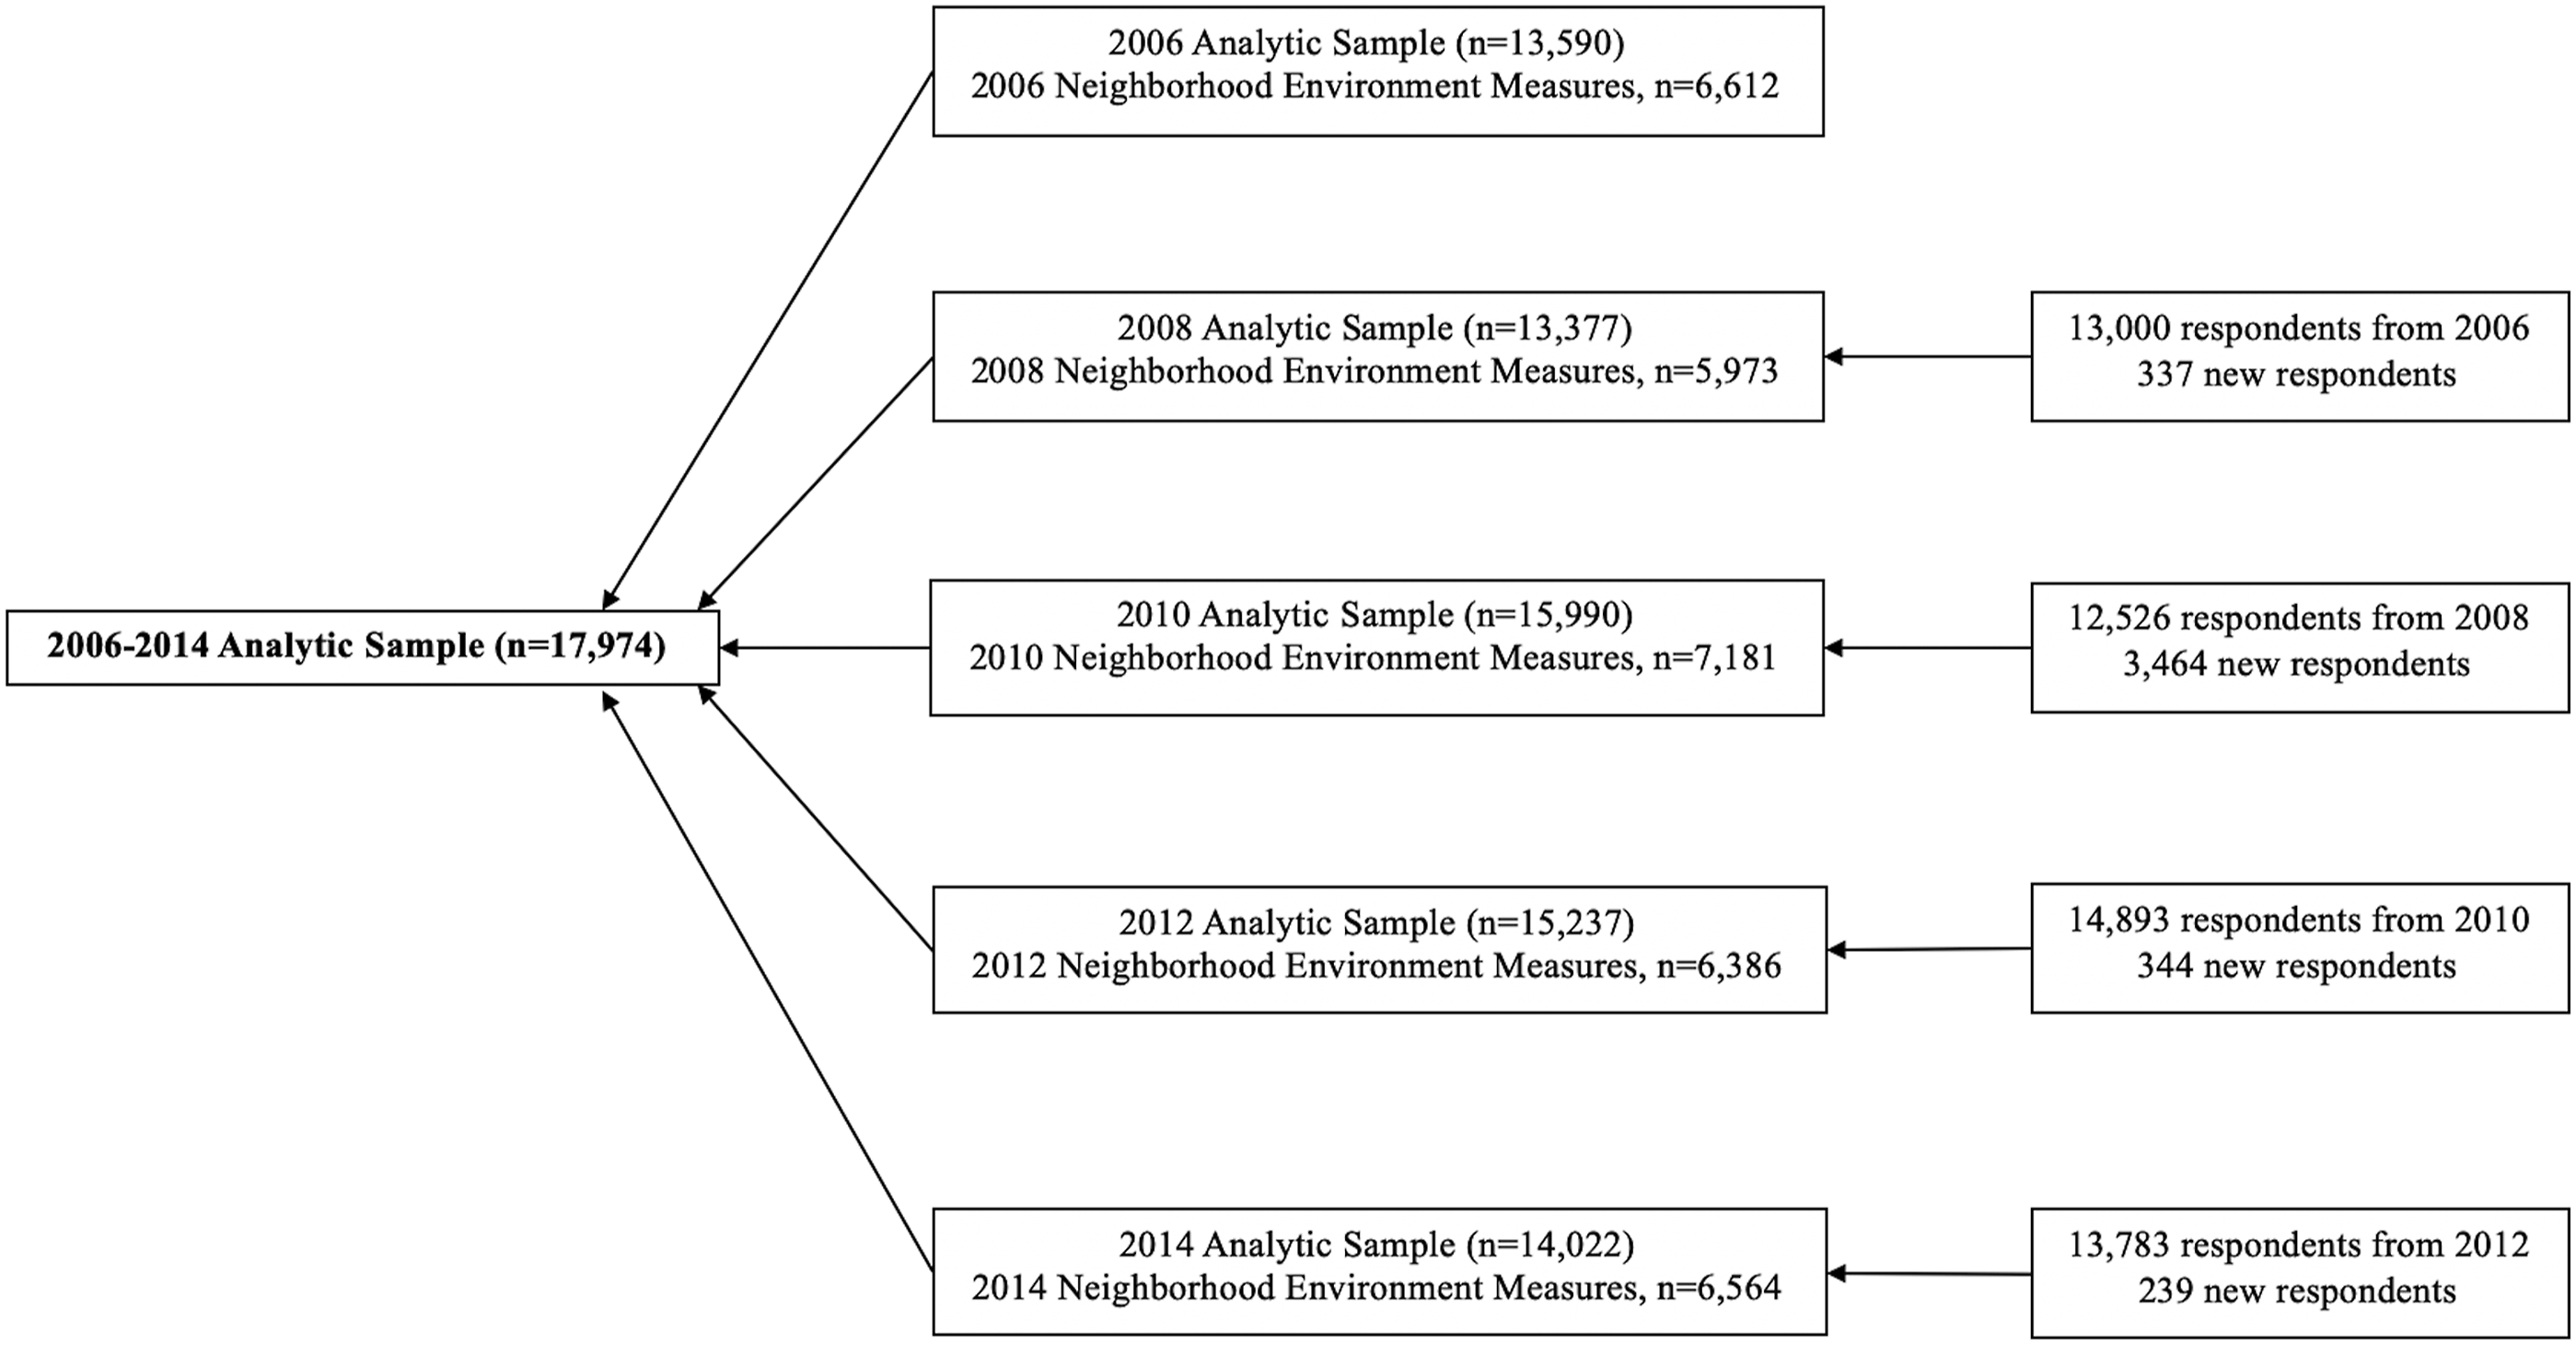
Variables and Measures
Physical activity. PA was measured biennially at baseline (2006) and in subsequent survey waves (2008–2014). To quantify PA level, we calculated metabolic equivalent of tasks (METs) to estimate energy expenditure based on the intensity and frequency of self-reported leisure-time PA (Ainsworth et al., 2000; Kwarteng et al., 2014; Nicklett et al., 2020). Participants were asked to rate the frequency of engagement in light, moderate, and vigorous levels of PA: (1) “how often do you take part in sports or activities that are mildly energetic, such as vacuuming, laundry, home repairs?”, (2) “how often do you take part in sports or activities that are moderately energetic, such as gardening, cleaning the car, walking at a moderate pace, dancing, floor or stretching exercises?”, and (3) “how often do you take part in sports or activities that are vigorous, such as running or jogging, swimming, cycling, aerobics or gym workout, tennis, or digging with a spade or shovel?”. The response scale ranged from 0 to4, 0 = hardly ever or never, 1 = one to three times a month, 2 = once a week, 3 = more than once/week, and 4 = every day.
Following a previous method (Kwarteng et al., 2014; Nicklett et al., 2020) motivated by Ainsworth et al. (2000), the physical activity score is a weighted sum of self-reported frequency of light/mildly energetic, moderate, and vigorous activity levels. Activity level was weighted by average METs scores: light activity (1–2.9 METS for an average 2), moderate activity (3–5.9 METs for an average of 4.5) and vigorous activity (6–10 METs for an average of 8.25) (Ainsworth et al., 2000). Correspondingly, individual responses to each physical activity question were assigned a weight (mildly energetic = 1; moderate = 2.5; vigorous = 4.25). The scores were summed across all three intensity levels of PA to give a total PA estimate (range: 0–31). Details on MET scores correspond to activities with a certain frequency and intensity level are described in the Supplementary Table.
Neighborhood environment. Perceptions of neighborhood social cohesion and neighborhood physical environment were measured at 2006/2008, 2010/2012, and 2014. Participants were asked about their perceptions regarding the area within a 20-minute walk or about a mile of their residence (Adams et al., 2009; Smith et al., 2013). Neighborhood social cohesion was measured by the extent to which the participants agreed with the following statements: (1) I feel a sense of belonging to this area, (2) I trust most people in this area, (3) I consider most people in this area to be friendly, and (4) I believe that most people in this area would help me if I were in trouble (Cagney et al., 2009; Chen-Edinboro et al., 2015; Nicklett et al., 2017; Smith et al., 2013). The level of agreement on each statement was measured using a 7-point Likert-type scale. The neighborhood social cohesion scale ranges from 1 to 7 based on the averaged response across all four statements. The final score was set to missing if there were more than two statements with missing responses (Smith et al., 2013). A higher score indicates that participants perceived their neighborhood to have higher social cohesion.
Neighborhood physical environment examined the extent to which the participants agreed that: (1) vandalism and graffiti are not a problem in the area I reside, (2) I consider the area to be relatively clean and absent of rubbish and litter, (3) I consider the area to be absent of vacant or deserted houses, (4) I feel safe walking alone in the area at night (Cagney et al., 2009; Chen-Edinboro et al., 2015; Nicklett et al., 2017; Smith et al., 2013). The level of agreement on each statement was measured using a 7-point Likert-type scale. The neighborhood physical environment scale ranges from 1 to 7 based on the averaged response across all four statements. The final score was set to missing if there were more than two statements with missing responses (Smith et al., 2013). A higher score indicates that participants perceived their neighborhood to have a more positive physical environment. The neighborhood social cohesion and neighborhood physical environment scales have a Cronbach’s alpha score of 0.84 and 0.86, respectively (Smith et al., 2013).
Health-related covariates. We included functional limitations, chronic illness comorbidities, and depressive symptoms as time-varying covariates because they could be potential confounders of the associations between PA and perceptions of one’s neighborhood environment. Functional limitations were assessed by activities of daily living (ADLs) and instrumental activities of daily living (IADLs). ADL was measured by the level of assistance needed in bathing, eating, dressing, walking across a room, and getting in or out of bed (Katz et al., 1963). IADL was measured by the level of assistance needed in using a telephone, taking medication, and handling money (Lawton & Brody, 1969). Participants rated each ADL or IADL item as 0 (without assistance) and 1 (with assistance). The final scores were summed for ADL (ranging from 0 to 5) and IADL (ranging from 0 to 3), respectively, to indicate participants’ functional limitations. Chronic illness comorbidities (ranging from 0 to 8) were the sum of self-reported diagnoses of eight chronic conditions, which include hypertension, diabetes, cancer, lung disease, heart disease, stroke, arthritis, and psychiatric problems. Depressive symptoms were measured using 8-item Center for Epidemiologic Studies Depression (CES-D) scale. The sum score range was 0–8, with a higher score indicating higher levels of depressive symptoms (Lewinsohn et al., 1997).
Sociodemographic covariates. Time-varying covariates included age in years, race/ethnicity (non-Hispanic White, non-Hispanic Black, Hispanic/Latinx, and other), sex (female, male), educational attainment (less than high school, high school or equivalent, some college, college or more), total wealth (5 quintiles), and urbanicity (urban, suburban, ex-urban), which was classified by following the 2013 Beale Rural-Urban Continuum Codes. Total wealth (excluding secondary residence) was calculated by the sum of all wealth components minus all the debt 1 and was scaled in US dollars ($1000s).
Statistical Analyses
We described the baseline sample characteristics overall and by racial/ethnic group. In multivariate models, we applied the sampling weight to estimate population-weighted means, frequencies and corresponding 95% confidence intervals. To estimate the associations between PA and perceived neighborhood environments (social cohesion and physical environment), we specified multivariate mixed-effects linear models with random person-specific intercepts using maximum likelihood estimation. To examine the moderating effects of race/ethnicity on the neighborhood environment-PA associations, we incorporated two interaction terms (a. race/ethnicity x social cohesion; b. race/ethnicity x physical environment), respectively, into the main effects models. We evaluated the interaction effects based on likelihood ratio tests and p-values for the interaction terms. In addition, we compared the differential effects of specific neighborhood factors on PA by estimating the associations between PA and sub-measures of social cohesion and physical environment. We computed robust standard errors and all linear models incorporated the baseline sampling weight at level 2 (person-level) and an attrition weight at level 1 (observation-level) of the multilevel model. Using methods detailed in Heeringa et al. (2017), we created an inverse probability of retention weight for repeated observations as the level 1 weight. All analyses were conducted using Stata (17.0 StataCorp LLC, College Station, TX).
Results
Population-Weighted Characteristics of 2006 Sample, Health and Retirement Study Core Questionnaire (n = 13,590) and Psychosocial and Lifestyle Questionnaire (n = 6612).
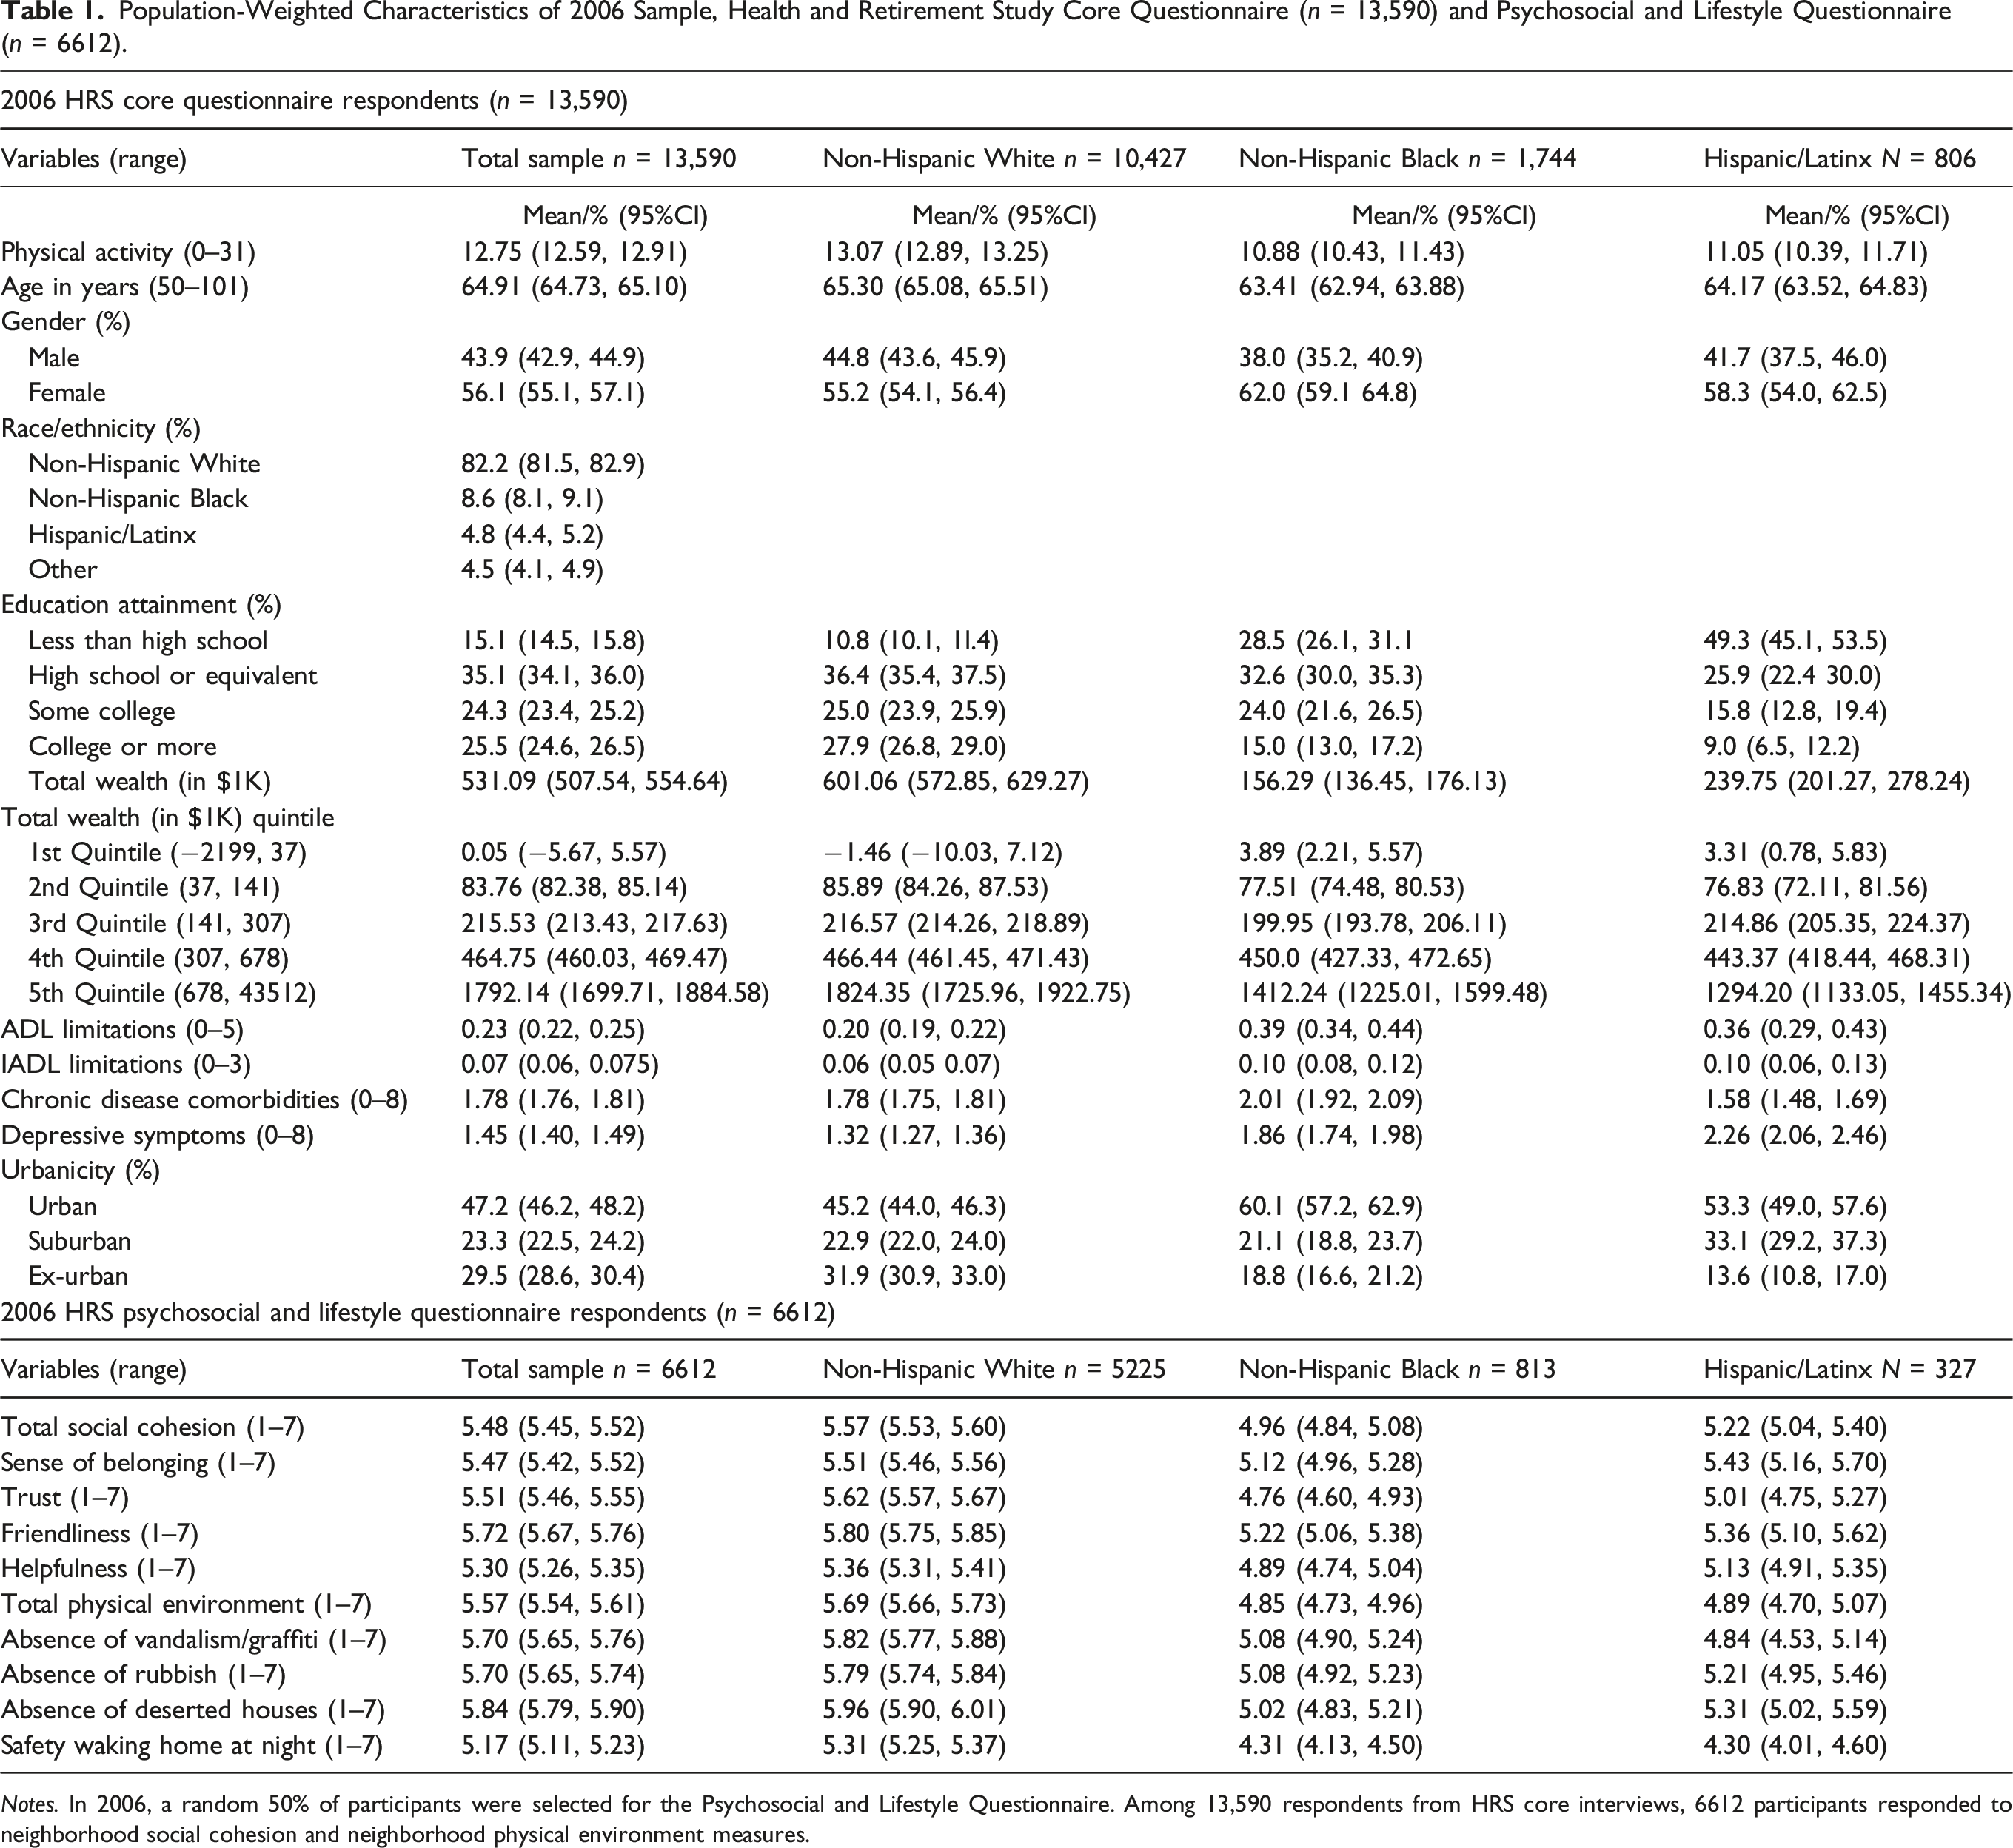
Notes. In 2006, a random 50% of participants were selected for the Psychosocial and Lifestyle Questionnaire. Among 13,590 respondents from HRS core interviews, 6612 participants responded to neighborhood social cohesion and neighborhood physical environment measures.
Population- and Attrition-Weighted, Multivariate Linear Mixed-Effects Models Estimating the Association between Perceived Neighborhood Social Cohesion and Physical Activity, 2006–2014 Health and Retirement Study, N = 17,974 (33,228 Observations).
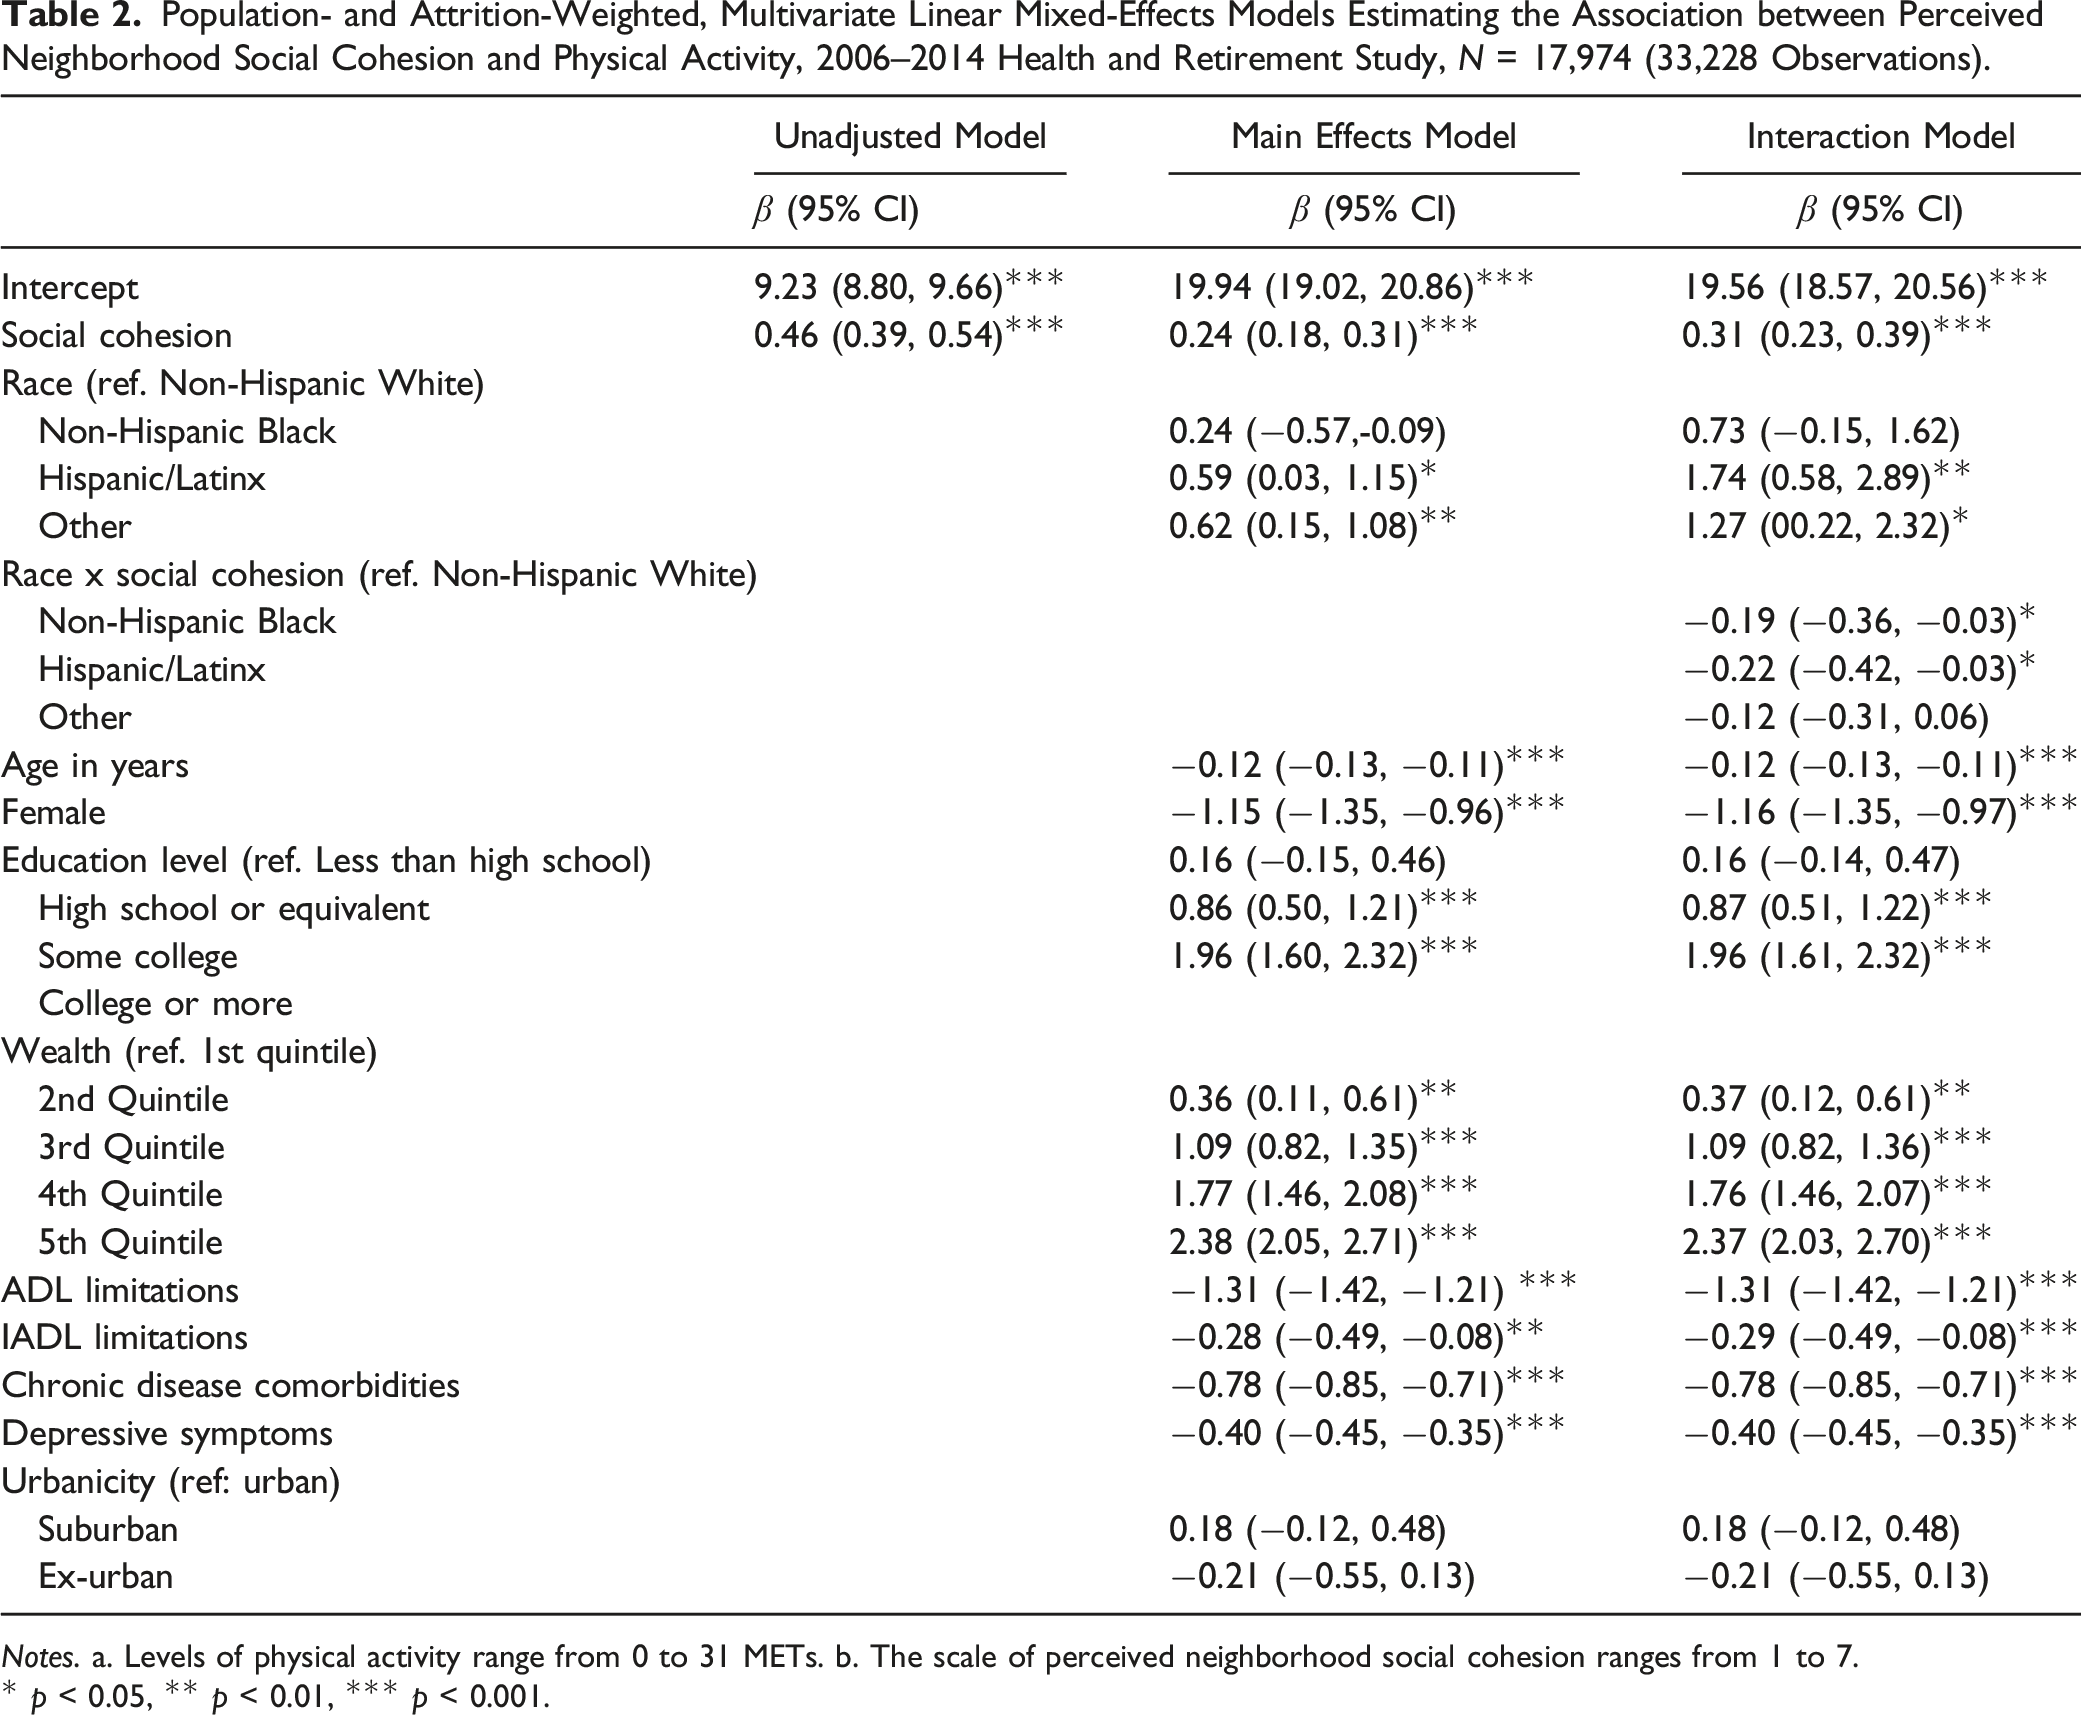
Notes. a. Levels of physical activity range from 0 to 31 METs. b. The scale of perceived neighborhood social cohesion ranges from 1 to 7.
* p < 0.05, ** p < 0.01, *** p < 0.001.
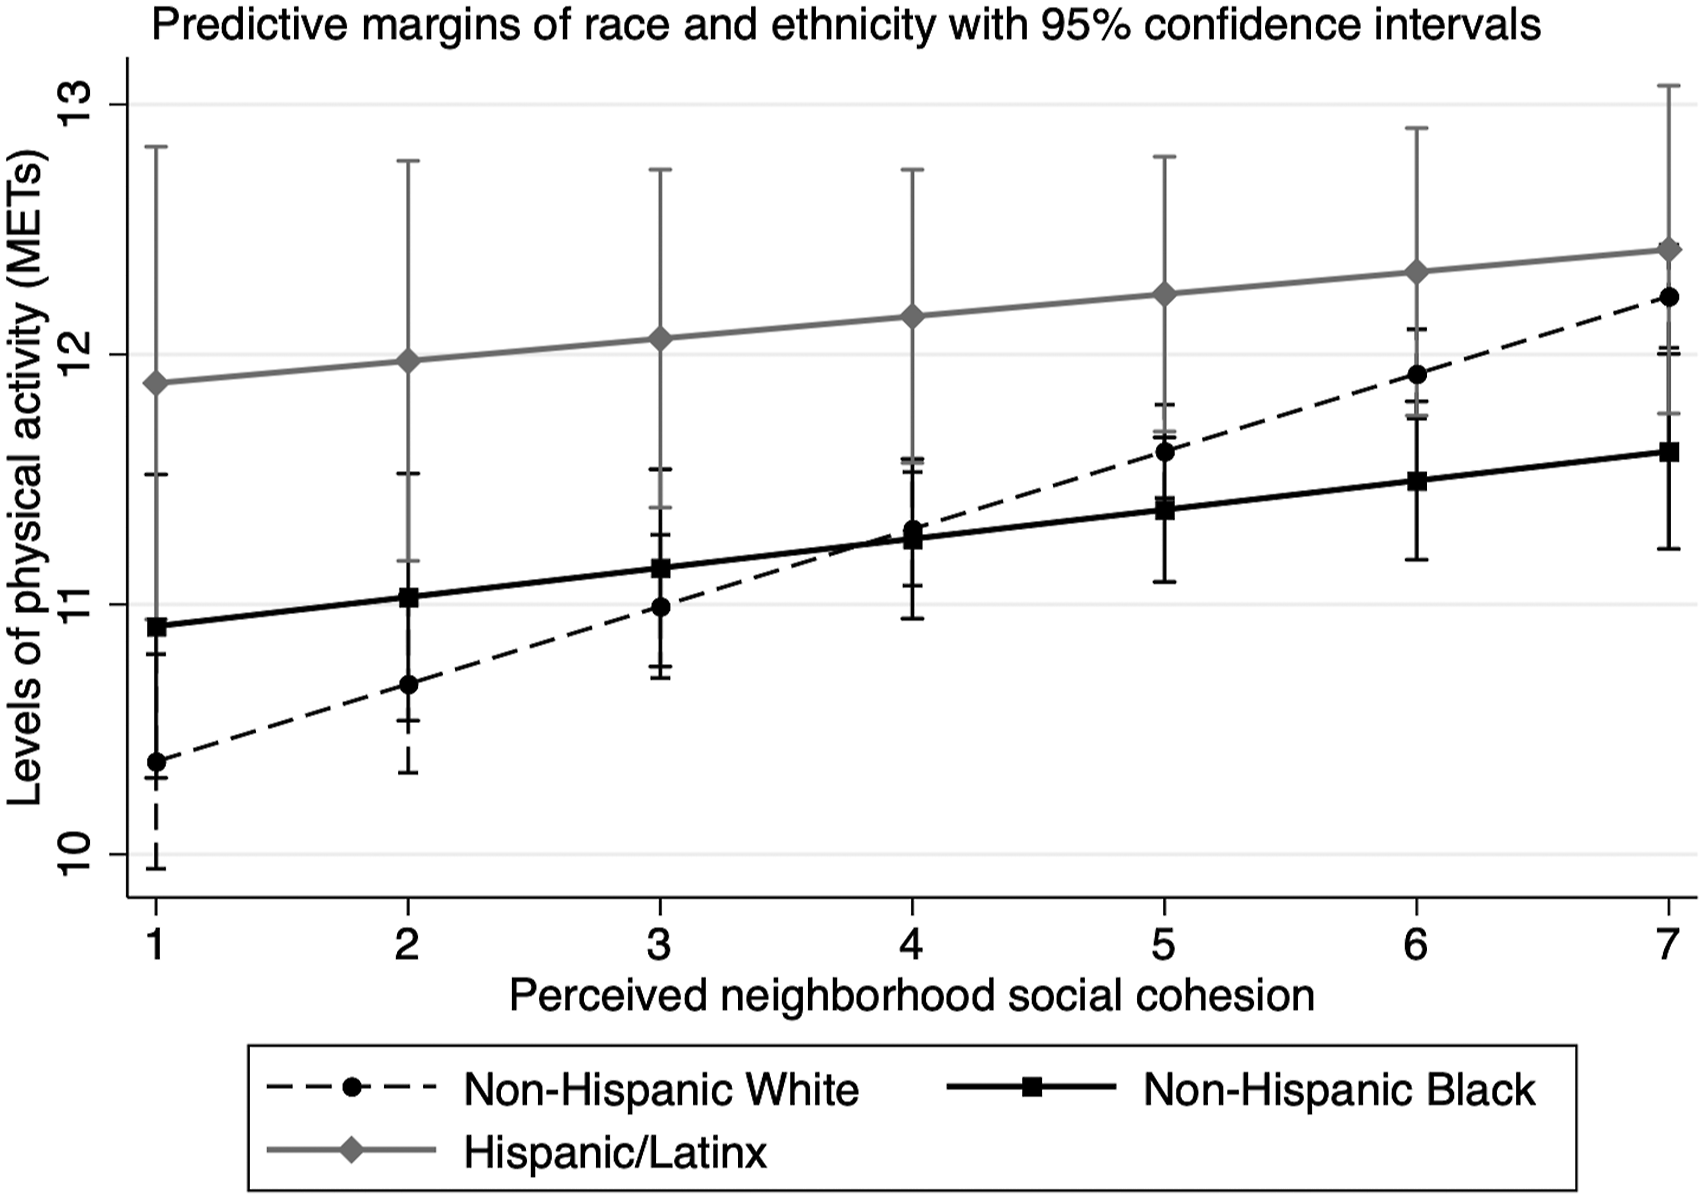
Differences in the effects of perceived neighborhood social cohesion on physical activity by race/ethnicity, 2006–2014 Health and Retirement Study, N = 17,974 (33,228 observations).
Population- and Attrition-Weighted, Multivariate Linear Mixed-Effects Models Estimating the Association between Perceived Neighborhood Physical Environment and Physical Activity, 2006–2014 Health and Retirement Study, N = 17,974 (33,228 Observations).
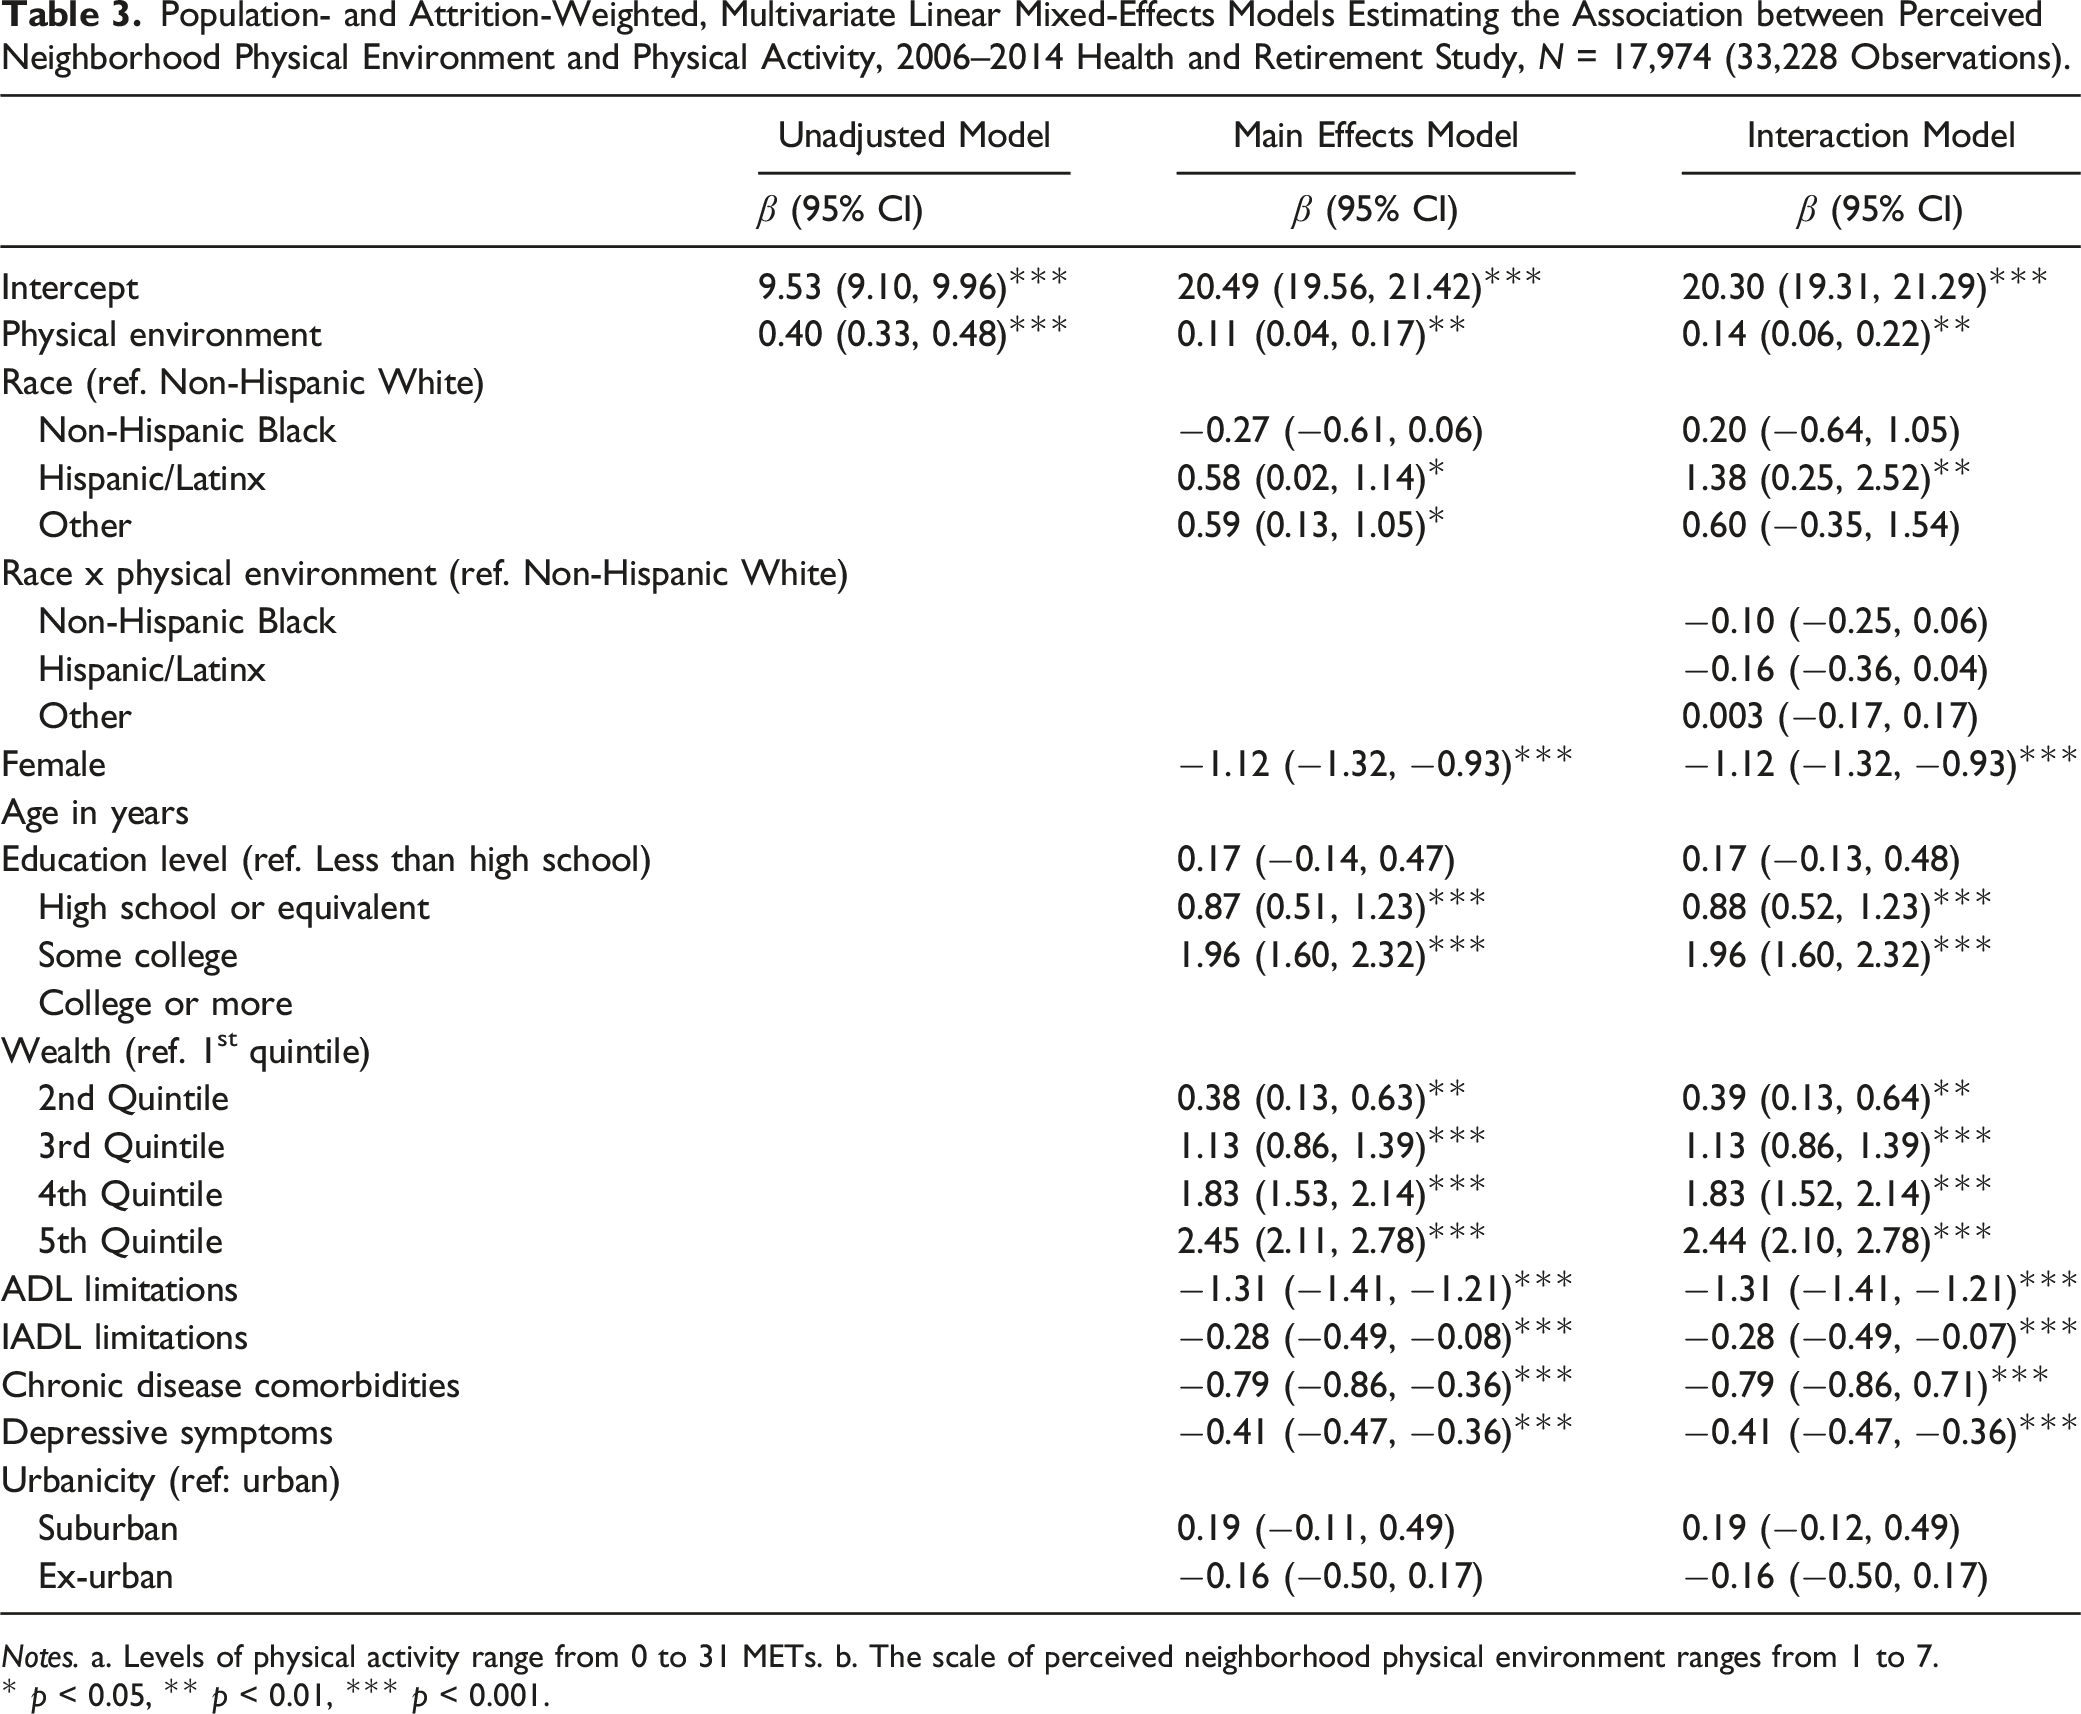
Notes. a. Levels of physical activity range from 0 to 31 METs. b. The scale of perceived neighborhood physical environment ranges from 1 to 7.
* p < 0.05, ** p < 0.01, *** p < 0.001.
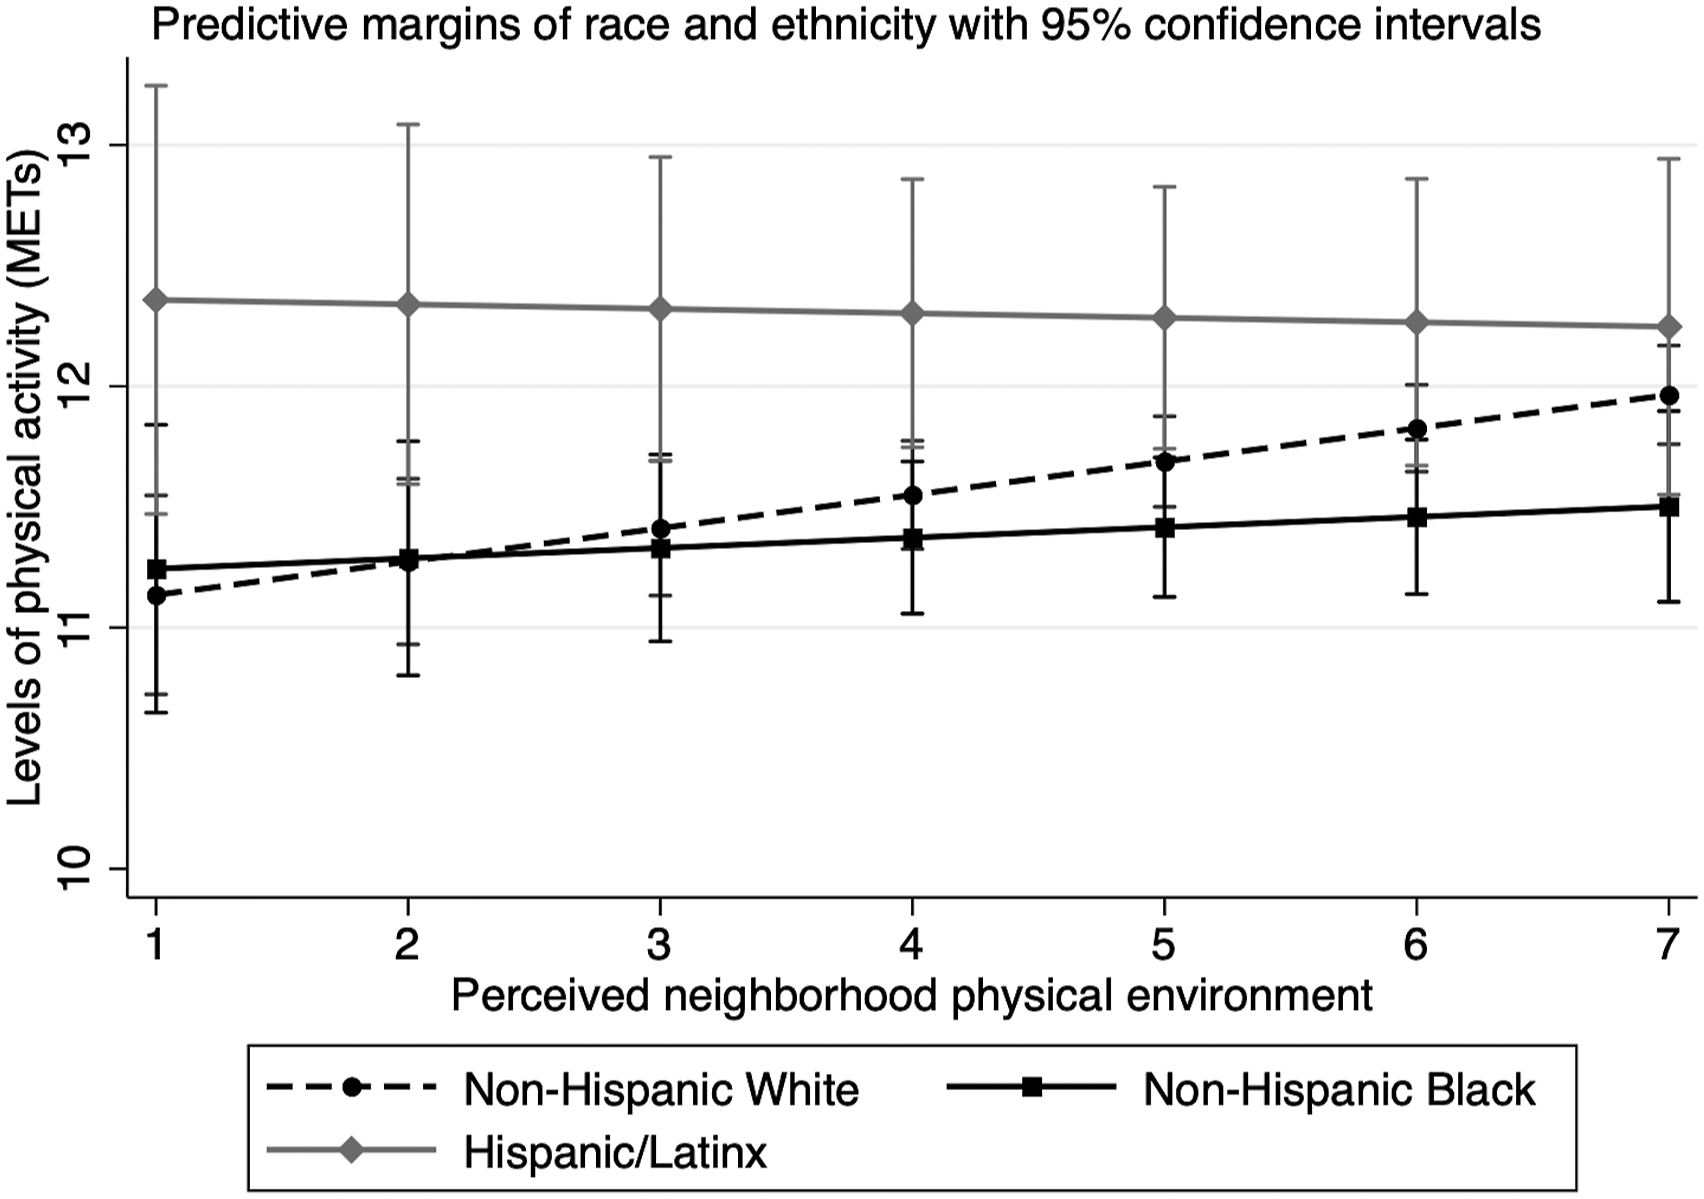
Differences in the effects of perceived neighborhood physical environment on physical activity by race/ethnicity, 2006–2014 Health and Retirement Study, N = 17,974 (33,228 observations).
Population- and Attrition-Weighted, Multivariate Linear Mixed-Effects Models Estimating the Associations between Perceived Neighborhood Environment and Physical Activity, 2006–2014 Health and Retirement Study, N = 17,974 (33,228 Observations).
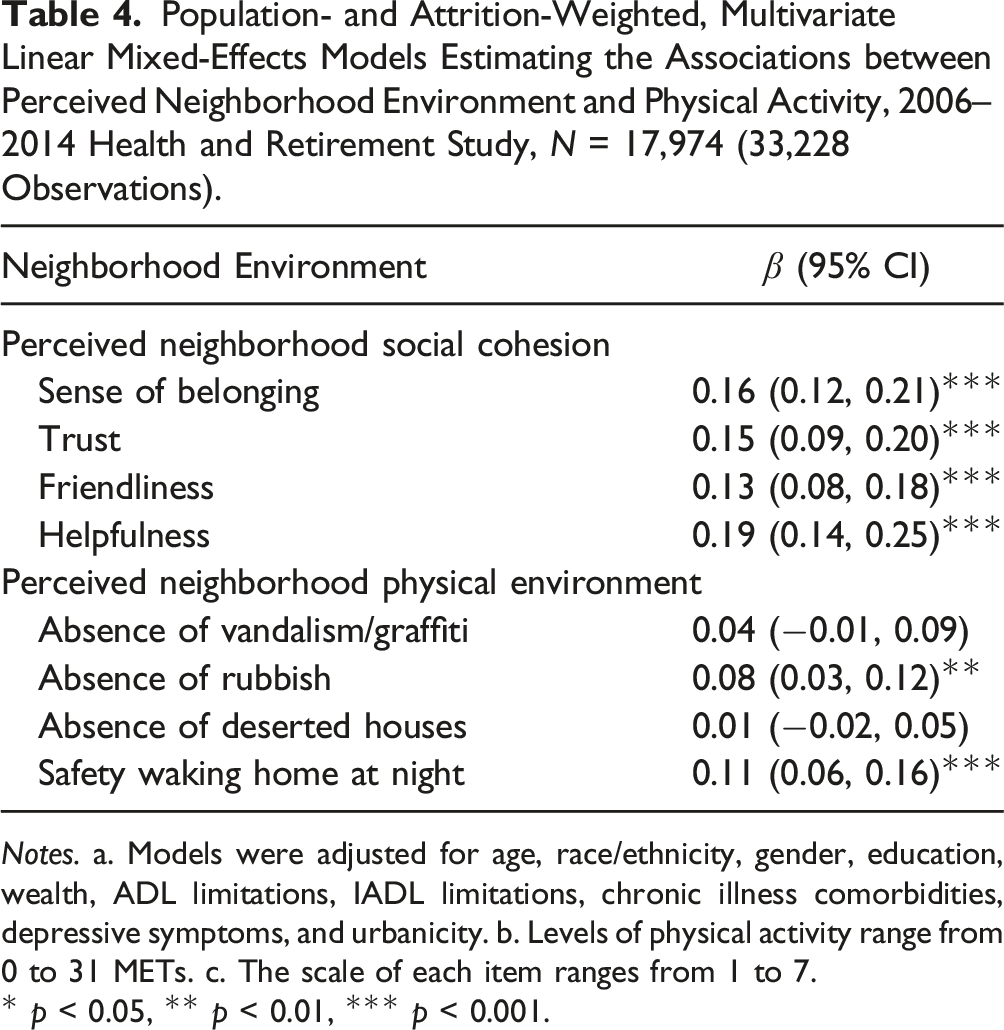
Notes. a. Models were adjusted for age, race/ethnicity, gender, education, wealth, ADL limitations, IADL limitations, chronic illness comorbidities, depressive symptoms, and urbanicity. b. Levels of physical activity range from 0 to 31 METs. c. The scale of each item ranges from 1 to 7.
* p < 0.05, ** p < 0.01, *** p < 0.001.
Discussion
This study suggests that the social and physical characteristics of one’s neighborhood environment do, in fact, relate to individual-level behaviors among middle-aged and older adults. First, our results supported our first hypothesis that individuals who perceived their neighborhood to have higher social cohesion engaged in higher levels of PA. Items of the perceived neighborhood social cohesion scale that were positively associated with higher levels of PA included sense of belonging to the neighborhood, sense of trust on neighbors, friendliness, and helpfulness of neighbors. Second, as we hypothesized, individuals who perceived their neighborhood to have a more positive physical environment engaged in higher levels of PA. Items of the perceived neighborhood physical environment scale that were positively associated with higher levels of PA included the absence of rubbish in the neighborhood and feeling safe walking alone at night. Finally, race/ethnicity moderated the PA-social cohesion association but not the PA-physical environment association. The effects of neighborhood social cohesion on PA were stronger among non-Hispanic Whites than among non-Hispanic Black and Hispanic/Latinx participants.
In prior studies, neighborhood social cohesion has been linked to more favorable health outcomes in middle-aged and older adults, including lower prevalence of frailty (Cramm & Nieboer, 2013), lower odds of falls (Nicklett et al., 2017), and lower odds of insomnia symptoms (Chen-Edinboro et al., 2015). In this study, higher levels of neighborhood social cohesion were associated with higher levels of PA in middle-aged and older adults, which was consistent with previous literature (Echeverria et al., 2008; Murillo et al., 2016; Quinn et al., 2019; Yi et al., 2016). Consistent with Quinn and colleagues’ (2019) study, our findings showed that PA was positively associated with the sense of belonging, sense of trust, neighbors’ friendliness, and willingness to help. Individuals’ sense of belonging in their neighborhood and trust in neighbors may encourage them to foster healthy social contacts, seek social support, and enhance their social networks. At the neighborhood level, social cohesion can provide resources for individuals to cope with and adapt to environmental stressors, such as limited access to recreational facilities or green space, lower neighborhood walkability, traffic, and vandalism/littering issues (Diez Roux & Mair, 2010; Kawachi & Berkman, 2014). The buffering effects of social cohesion may facilitate residents to initiate and maintain PA, enforce norms and social control inducing PA, and reduce stress that constrains on PA.
The presence of environmental hazards and perceived neighborhood danger have been recognized as risk factors for falls (Nicklett et al., 2017), physical inactivity (Chaudhury et al., 2012; Mooney et al., 2017; Strong et al., 2013), and poorer physical function (Millar, 2020) in middle-aged and older adults. Our study found that a more positive neighborhood physical environment was significantly associated with higher levels of PA. Consistent with the study by Strong et al. (2013), we found that two specific neighborhood physical features—the presence of rubbish in the neighborhood and perceived safety walking at night—were independently related to PA. These findings suggest that reducing environmental hazards at the neighborhood level is an important element to consider for PA-promoting interventions.
Of note, race/ethnicity was found to moderate the association of PA-neighborhood social cohesion, consistent with the direction we hypothesized. An attenuated association between social cohesion and MET equivalent scores was observed among non-Hispanic Black (0.19 lower MET unit) and Hispanic/Latinx participants (0.22 lower MET unit) relative to non-Hispanic White participants. The 0.19 to 0.22 difference in MET units can be interpreted as an average change in mildly energetic activity from “hardly ever or never” to “one to three times per month” and vice versa (Ainsworth et al., 2000). While this effect is modest, it should be noted that average physical activity participation levels remain below recommended levels (Physical Activity Guideline Advisory Committee, 2018) across all racial/ethnic groups examined. Prior research has found that even small increases in physical activity can contribute to the health, mobility, and longevity of older adults (Hupin et al., 2015; Simonsick et al., 2005). Therefore, multilevel strategies are needed to encourage regular physical activity, including investments in neighborhood environments that facilitate and promote opportunities for older adults to engage in regular physical activity.
As a protective factor, social cohesion showed a greater slope for non-Hispanic Whites than for non-Hispanic Black and Hispanic/Latinx individuals. The greater slope can be interpreted as an indicator of relative advantage; greater perceived social cohesion is associated with higher levels of PA among non-Hispanic Whites but not among Hispanic/Latinx and non-Hispanic Black participants in this study. On the other hand, the greater slope could also reflect potential vulnerability of non-Hispanic Whites—greater loss of PA—when exposed to a neighborhood with low social cohesion. Previous studies share similar findings that non-Hispanic Whites had fared worse than other groups in face of stressful life events or environmental stressors (Assari, 2016; Kwarteng et al., 2014; Millar, 2020; Nicklett et al., 2020). For example, Assari (2016) found that the association between perceived neighborhood safety and all-cause mortality was stronger for Whites compared to Blacks, which is comparable to our findings that a stronger association of between PA and neighborhood social cohesion was observed among non-Hispanic Whites than among Hispanic/Latinx and non-Hispanic Black individuals.
While non-Hispanic Whites have greater than average access to amenities and other resources in neighborhoods that promote PA (Viruell-Fuentes et al., 2012; Williams & Mohammed, 2013; York Cornwell & Cagney, 2014), they may be less resilient and have fewer psychosocial assets to positively respond to the stress caused by adverse social and physical environments (Assari, 2018; DiAngelo, 2011; Keyes, 2009; Malat et al., 2018). Malat et al. (2018) proposed that Whites’ greater vulnerability to stressors may be due to the cost of their privileges. Compared to Blacks who have endured a wide range of social and economic stressors for centuries, Whites may be less prepared and adaptable to adversity (Assari, 2018; Keyes, 2009). Communities disproportionately burdened by structural racism may equip some minoritized seniors with individual and collective strategies to cope with and overcome environmental stressors (Eschbach et al., 2004; Ferraro et al., 2017; Gilbert et al., 2022; Meyer, 1995, 2003). For example, the greater sense of connection across generations among Hispanic/Latinx older adults (Burr & Mutchler, 1999) or the active engagement in faith-based organizations among Black individuals (Chatters et al., 2009; Assari, 2018: ; Gilbert et al., 2022) could contribute to building greater social cohesion, social support, and social norms that promote PA, as well as utilizing psychosocial and institutional resources to buffer the effects of adverse neighborhood environments. Future qualitative studies are warranted to promote a better understanding of how social cohesion operationalizes differently to affect health-promoting behaviors among non-Hispanic White, non-Hispanic Black, and Hispanic/Latinx communities.
Strengths and Limitations
The interest in the impact of the neighborhood environment on PA has become salient in public health research, however, previous studies have primarily relied on cross-sectional data. We addressed this gap by examining the associations between the neighborhood environment (social cohesion/physical environment), PA, and race/ethnicity using a population-based cohort study of racially and ethnically diverse older adults. One major strength is the utilization of a large nationally representative sample (17,974 participants), which allows our findings to be generalizable to community-dwelling adults aged 50 and older in the United States. We incorporated repeated measures of PA, perceptions of neighborhood environment, and selected covariates over an 8-year period. Multilevel modeling is a suitable and robust approach to model clustered data accounting for repeated observations across waves (level 1) nested within respondents (level 2) (Chopik et al., 2018; Crowe et al., 2021; Snijders & Bosker, 2011). Our metric of PA included both intensity and frequency measures across a broad range of activities with various levels, allowing us to capture the dynamic nature of PA.
Although our findings are robust and noteworthy, several limitations must be considered. First, the present study only examined recreational PA and excluded occupation-associated PA, which may lead to an underestimate of PA among respondents with physically demanding occupations. The measure of PA used in this study was based on self-reported data. Responses could have been affected by social desirability bias and the degree of over-reporting may be influenced by individual perceived and measured weight status (Ferrari et al., 2007; Warner et al., 2012). Our PA measure is an estimate of METs based on the frequency of engaging in light, moderate, and vigorous activities (Latham & Williams, 2015; Li et al., 2019; Kraal et al., 2021; Nicklett et al., 2020). Although no studies have yet validated this measure, prior studies have assessed the validity and reliability of estimating METs based on an established self-reported PA questionnaire (Craig et al., 2003; Sember et al., 2020). These studies demonstrated the moderately high test-retest reliability and concurrent validity of self-reported PA measures. Despite the large and racially/ethnically diverse sample, it is possible that the differential sample sizes represented among racial/ethnic groups lead to differential ability of our model to detect PA differences in relation to social cohesion between groups. Further, the mean and range of social cohesion scores differed by racial and ethnic group, with the highest scores among non-Hispanic Whites (5.57, range: 5.53–5.60), followed by Hispanics/Latinos (5.22, range: 5.04–5.40) and non-Hispanic Blacks (4.96, range: 4.84, 5.08). It is also possible that race/ethnicity is a significant moderator of PA-social cohesion association only when a threshold is reached or when present at higher levels (Hobson-Prater & Leech, 2012).
Due to the limitation of race/ethnicity groupings in the survey design, we were unable to estimate the differential influence of the neighborhood environment on PA across specific subgroups within non-Hispanic Black and Hispanic/Latinx participants, as well as among Asian American and American Indian/Alaska native groups and subgroups. The groups examined here, such as Hispanic/Latinx participants, are heterogeneous and have diverse language and cultural backgrounds. Perceptions of one’s neighborhood environment and the subsequent effects on PA may vary significantly across racial/ethnic and cultural groups.
In addition, this study did not examine other aspects of neighborhood environments that could be explanatory factors for individual-level variations in PA, namely social capital, social support, infrastructure/built environment, and toxic environmental exposures. Lastly, the present study merely relied on a self-rated neighborhood physical environment scale which is likely to be dependent on individual characteristics (Boslaugh et al., 2004). This subjective measure warrants caution when interpreting findings. More objective measures of neighborhood physical characteristics have been commonly utilized in prior studies, such as the photovoice method (Chaudhury et al., 2012), systematic social observation (Kwarteng et al., 2014), and Walk ScoreTM (Towne et al., 2016). Results regarding associations of neighborhood physical environment and PA has been mixed, potentially given the variation in measuring neighborhood physical environment (Orstad et al., 2017). Future research is warranted to disentangle the extent to which objective and subjective measures of neighborhood physical environment overlap and complement each other in affecting PA levels.
Conclusion
Strategies to enhance neighborhood physical and social environment could encourage PA among middle-aged and older adults. For example, intervention strategies that improve neighborhood safety and reduce the presence of litter—as well as those enhancing community social engagement and trust, communications, and social connections between neighborhoods—could promote the initiation and maintenance of PA. Community and government institutions should focus on building and maintaining a variety of social ties through, for example, hosting social events and interest group meetings, including those involving and promoting physical activity. Our findings also shed light on a potential difference in the association between PA and the neighborhood environment among middle-aged and older adults from different racial/ethnic backgrounds. We must acknowledge that “one size does not fit all.” The effectiveness of community intervention strategies may differ across and within neighborhoods. Future research focusing on racial/ethnic minority groups and subgroups is needed to fully characterize the pathways operating racial/ethnic differences in the relationships between the neighborhood environment and PA or other health behaviors.
Supplemental Material
Supplemental Material - Racial and Ethnic Differences in the Relationship Between Neighborhood Environment and Physical Activity Among Middle-Aged and Older Adults
Supplemental Material for Racial and Ethnic Differences in the Relationship Between Neighborhood Environment and Physical Activity Among Middle-Aged and Older Adults by Greta J. Cheng, and Emily J. Nicklett in Journal of Aging and Health
Footnotes
Acknowledgments
The authors are gratefully to Ann Reiter, MSW for her contribution to the literature review.
Declaration of Conflicting Interests
The author(s) declared no potential conflicts of interest with respect to the research, authorship, and/or publication of this article.
Funding
The author(s) received no financial support for the research, authorship, and/or publication of this article.

Supplemental Material
Supplemental material for this article is available online.
Note
References
Supplementary Material
Please find the following supplemental material available below.
For Open Access articles published under a Creative Commons License, all supplemental material carries the same license as the article it is associated with.
For non-Open Access articles published, all supplemental material carries a non-exclusive license, and permission requests for re-use of supplemental material or any part of supplemental material shall be sent directly to the copyright owner as specified in the copyright notice associated with the article.
