



Abstract
Introduction
As people age, they are more vulnerable to health issues. Healing and recovery become slower, affecting the quality of life of older individuals (Guo & DiPietro, 2010). The physiological changes experienced in the ageing process involve every system in the body, especially the musculoskeletal, cardiovascular, endocrine and immune systems (Khan et al., 2019) and can contribute to conditions such as sarcopenia (Ferrucci & Fabbri, 2018). Furthermore, it has been suggested longer-term chronic diseases increase the risk of disability, frailty and poorer quality of life in older people (Maresova et al., 2019).
As the number and proportion of the older population grows, new research is being conducted to understand the ageing process and how to better manage chronic diseases and clinical syndromes in older adults (World Health Organization, 2017; 2022). Frailty is one such syndrome and is a ‘complex vulnerability syndrome’, where there is a decrease in the individual’s capacity to manage physical demands or challenges which increases their probability of developing disability, comorbidity and ultimately their risk of death (Fried et al., 2001; Lally & Crome, 2007). Frailty is considered a dynamic bidirectional process where individuals can transition to lesser and more severe frailty states (Thompson et al., 2018). Therefore, determining the prevalence and risk factors for frailty is important to inform clinical practice (Collard et al., 2012).
Besides being related to older age (Collard et al., 2012; Fried et al., 2001), frailty has also been associated with being female (Fried et al., 2001; Rockwood et al., 2004), obesity and underweight (Blaum et al., 2005), and anaemia (Chaves et al., 2005). In parallel, many chronic diseases also increase in prevalence with advancing age, such as hypertension, type 2 diabetes mellitus, osteoporosis and depression (Fries, 2005; Weiss, 2011; Wong et al., 2010). Having more than one chronic disease (multimorbidity) is associated with worse frailty status (Abu et al., 2020).
There are several proposed definitions and models of frailty; however, no standard definition of frailty is applied in clinical practice. This creates challenges in the identification and management of frailty syndrome. The two main theoretical frameworks associated with frailty are (1) Fried’s frailty phenotype model (Fried et al., 2001) and (2) Rockwood’s deficit accumulation model (Frailty Index), which states that frailty is the addition of several health conditions (evaluation of 30–70 itemised deficits) (Rockwood, 2005). These two models have been used to develop instruments to assess frailty. Both unidimensional, which consider only a physical dimension as Fried’s frailty phenotype (Fried et al., 2001) and multidimensional (physical, psychological and social characteristics) instruments can be used to assess frailty (Collard et al., 2012). The prevalence of frailty has varied in different epidemiological studies, and one reason for this is the type of instrument used to detect frailty. Those studies using unidimensional instruments generally find a lower prevalence than those using multidimensional instruments, which could mean that unidimensional instruments are less sensitive than multidimensional instruments (Collard et al., 2012; Widagdo et al., 2015).
The main limitation of these instruments (Fried’s physical frailty model and the Frailty Index) is that they require healthcare professionals to conduct the assessment. Therefore, instruments based on self-reported measures can be utilised in populations with difficult access to healthcare, healthcare professionals and large population studies (Huang et al., 2022). There are prominent instruments, such as the Groningen Frailty Indicator (GFI) (Steverink et al., 2001), based on a self-reported measurement that would be more appropriate for large-population prevalence research. The GFI focuses on functional living and stipulates that frailty should refer to physical and psychosocial vulnerabilities (Steverink et al., 1998). The assessment is based on the current daily life problems, and which are the essential requirements to having functional physical, social and psychological living. The GFI questionnaire contains 15 items that assess mobility, activities in daily living, physical fitness, comorbidity, vision, hearing, nutrition, cognition, psychological status (depressed mood and anxiety feelings) and social interaction (loneliness) (Steverink et al., 2001).
In Australia, the prevalence of frailty syndrome has been evaluated through epidemiological studies in urban populations (Dent et al., 2012; Rochat et al., 2010; Thompson et al., 2018; Widagdo et al., 2015). Most of these studies have been through secondary analysis using pre-existing data sets (Rochat et al., 2010; Thompson et al., 2018; Widagdo et al., 2015) and used a modification of the Fried’s frailty phenotype model. Only one study (Widagdo et al., 2015) used four different frailty measures to compare their results between unidimensional measures (Fried’s frailty phenotype model (Fried et al., 2001) and Simplified frailty phenotype by Kiely et al. (Kiely et al., 2009)) and multidimensional measures (Frailty Index (Mitnitski et al., 2001) and Prognostic frailty score by Ravaglia et al. (Ravaglia et al., 2008)). The Australian studies found that frailty ranged from 6% to 21% in those aged 65 years and over (Thompson et al., 2018; Widagdo et al., 2015). However, the prevalence of frailty syndrome in rural areas of Australia is less well understood. This information is important because rural populations have, on average, shorter life spans and higher levels of disease compared to people living in metropolitan areas (Australian Institute of Health and Welfare, 2019a). These differences between urban and rural health may be due to the complex interplay of multiple factors, for example, lower incomes, lower educational attainment, poorer health behaviours and less access to healthcare (Australian Institute of Health and Welfare, 2019b).
This present study aimed to identify the prevalence of frailty among adults living in one area in rural Victoria, Australia. Therefore, the objectives of this study were (a) to determine how many participants were frail based on a modified instrument and (b) to identify demographic, environmental and health-related factors that potentially increase the risk of developing frailty. Better understanding of the frailty status of rural populations enables the design and implementation of health interventions to address the development and progression of frailty (Puts et al., 2017). From a clinical perspective, identifying key risk factors can inform the design of interventions to prevent or delay the onset of frailty and allow the identification of groups of older adults who might need extra medical attention (Collard et al., 2012). For policymakers, this knowledge can help improve the allocation of scarce resources and the design of health interventions at the healthcare system level.
Methods
Study Design and Population
This study involved secondary data analysis of the Crossroads II study to evaluate frailty indicators in a regional Victorian population. Using the Australian Standard Geographical Classification System, Australia is divided into five geographical areas: major cities (metropolitan areas), inner regional, outer regional, remote and very remote areas (non-metropolitan), according to available access to services (Australian Institute of Health and Welfare, 2019a). The Crossroads II study was conducted in the Goulburn Valley, which is considered a regional area. In order to align with international terminology, ‘rural areas’ is used in this study to refer to all non-metropolitan areas. Therefore, the entire population of this study is considered to live rurally. The Crossroads II cross-sectional study was conducted to identify changes in the prevalence of key chronic health conditions in comparation to Crossroads I (Glenister et al., 2019), including undiagnosed and undermanaged disease, and access to healthcare (Glenister et al., 2018). It included participants older than 18 years who were resident in the regional centre (Shepparton/Mooroopna) and three adjacent ‘shire capitals’ (Benalla, Cobram, Seymour) (Glenister et al., 2018).
An ethics committee approved the Crossroads II study, and written consent was obtained from each participant (Glenister et al., 2018). The data were collected between 2016 and 2018 through researcher assisted surveys, or face to face surveys and clinical examinations (Glenister et al., 2018). (Figure 1 outlines the participant recruitment flow chart.) The community households were selected randomly, and the study achieved a good response rate (62.7%). All participants were asked about their socio-demographic status, health-related problems, physical activity, self-rated health, health service utilisation and health behaviour during the interviews. A subgroup of this sample (n = 747) was randomly selected to undergo a two-hour appointment for physical health assessments by trained and calibrated research assistants, which included weight and height measurement, cognitive screening, audiometry and psychological testing. Those aged 55 years and older (n = 376) were included in this present study; we included adults 55 years and over to describe the health characteristics of this age group. Even though this age group is part of the workforce in Australia, there are health and community care groups for people that involve adults 55 years and over (Australian Government, 2021; Department of Social Services, 2019). All participants who had a complete set of responses were included in this secondary analysis. Participants flow chart for frailty sub-study.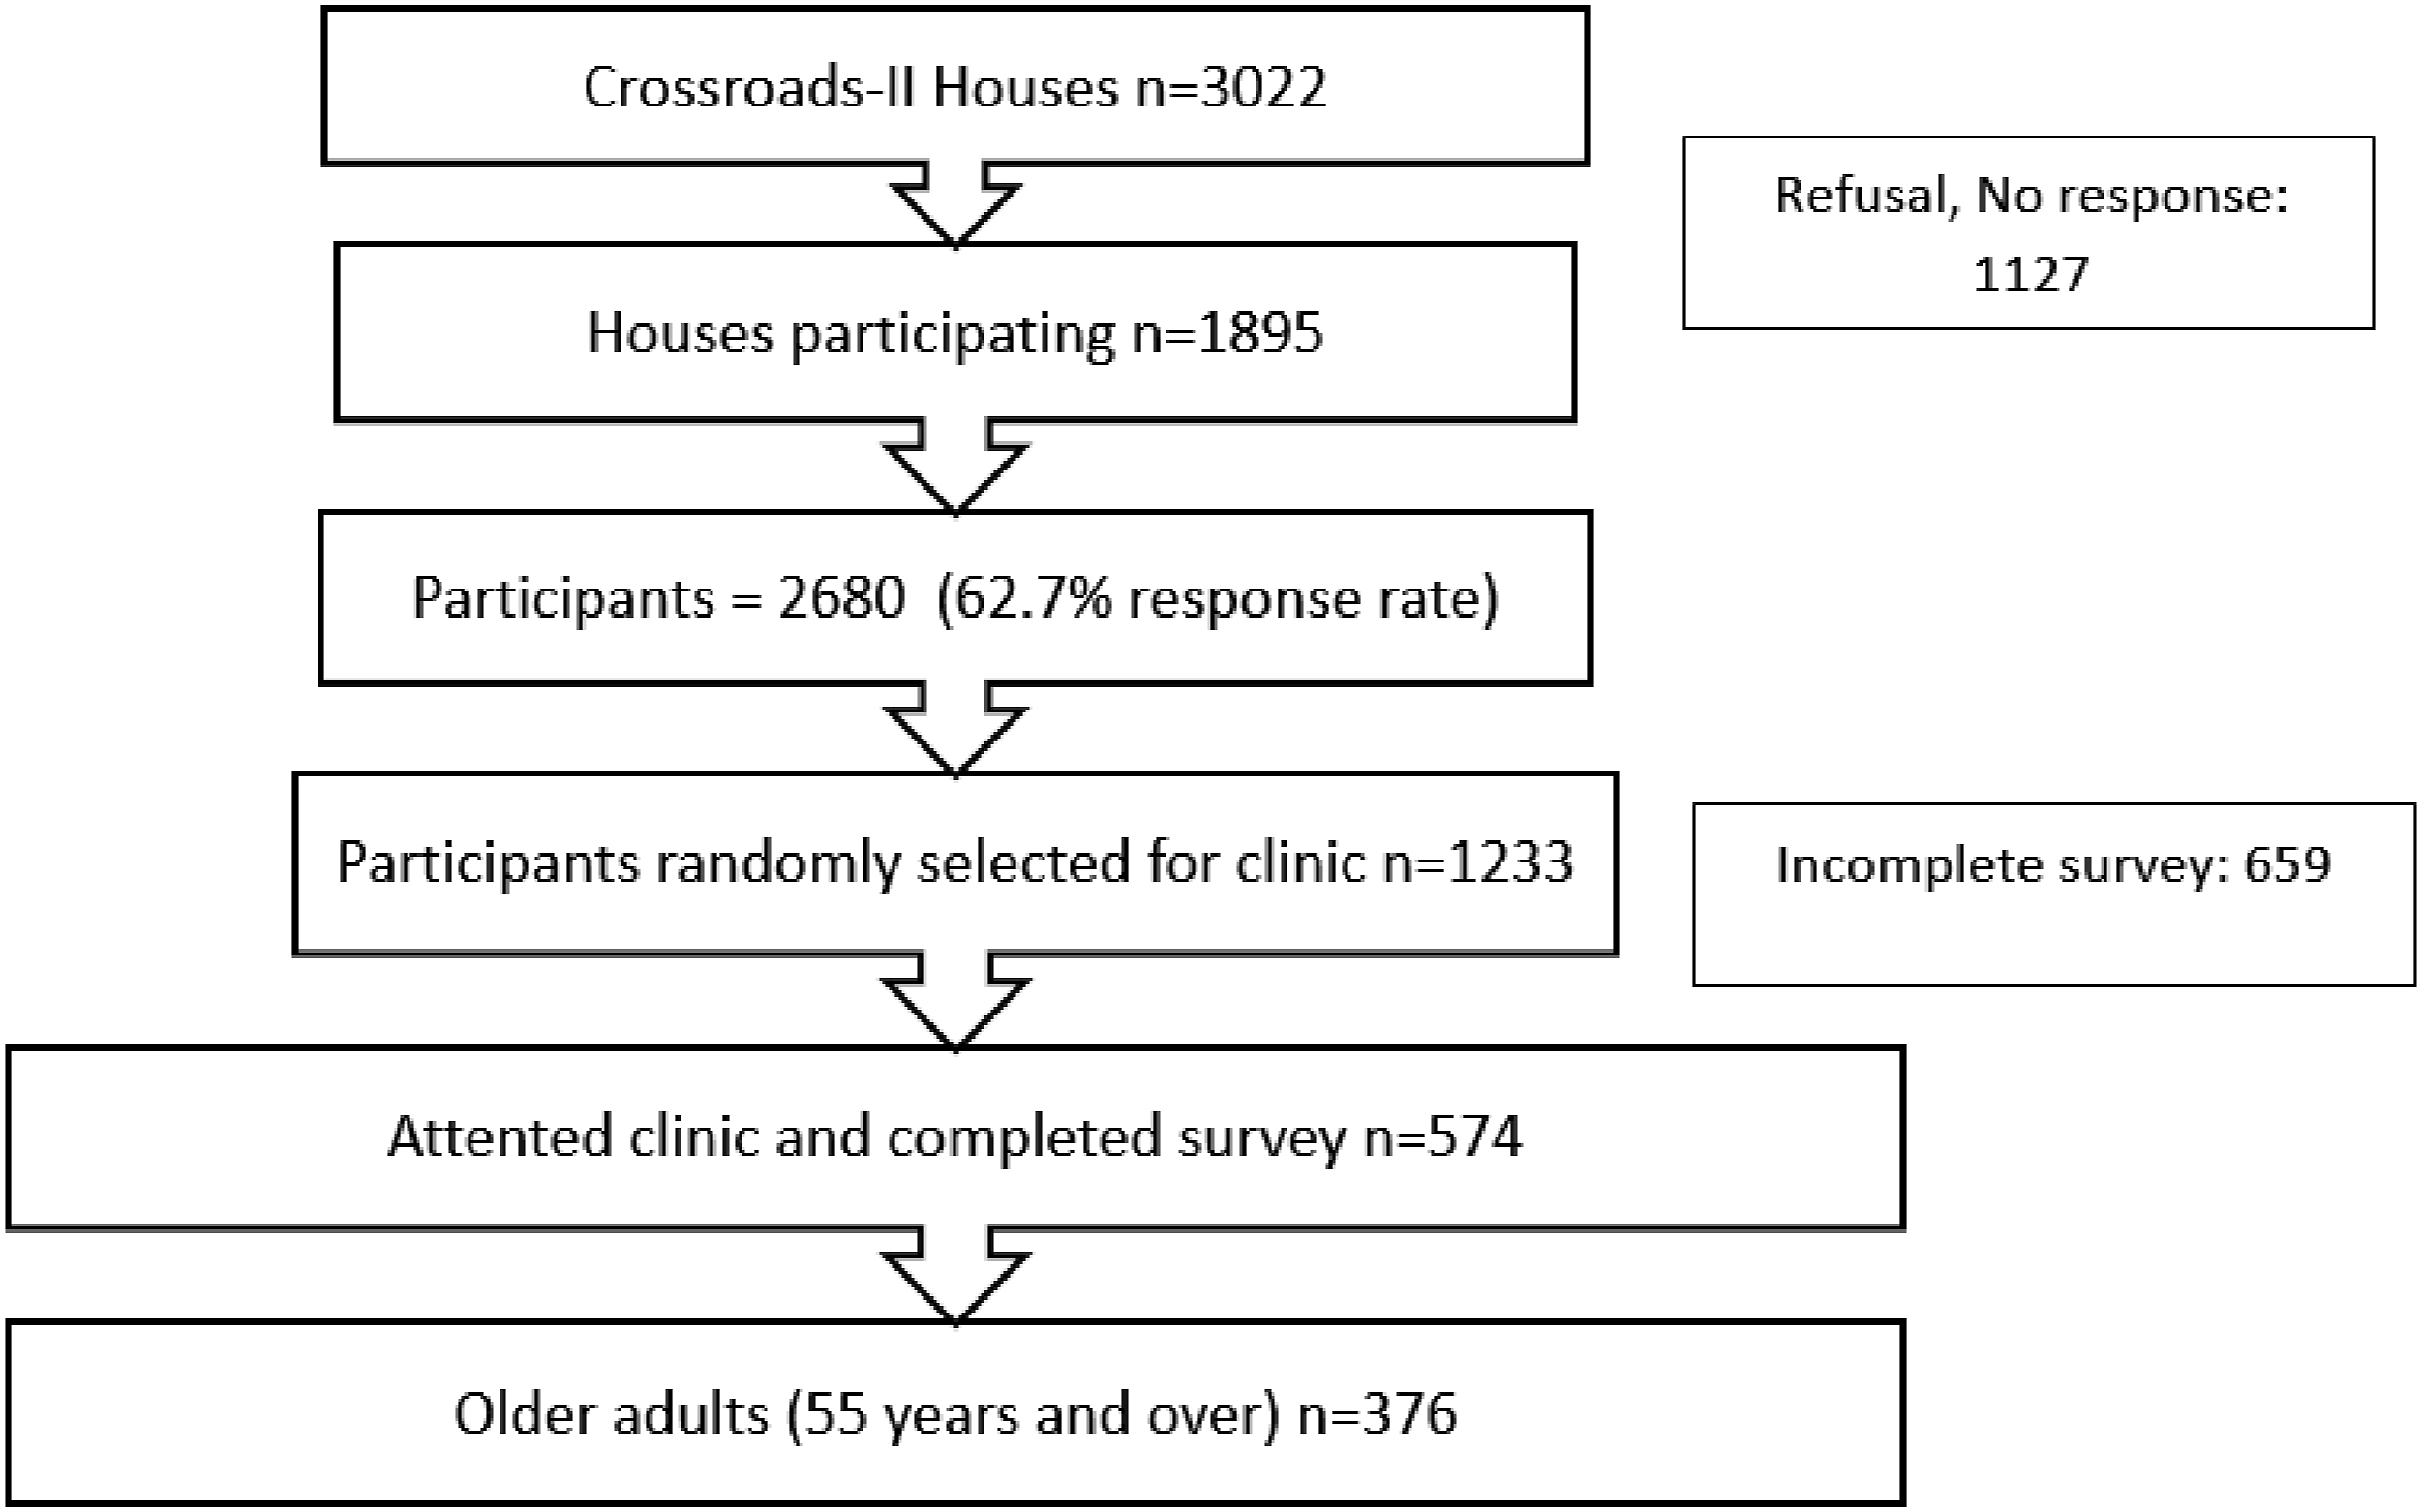
Frailty Outcome Operationalisation
In the Crossroads II study, there was no frailty instrument included. Therefore, variables deemed as acceptable markers of frailty by the research team were selected from the existing dataset. In our study we used the Groningen Frailty Indicator (GFI) (Steverink et al., 2001) as a guide and reference standard for the selected items. The GFI is a widely used and validated instrument (Olaroiu et al., 2014; Peters et al., 2015; Xiang et al., 2020) and the variables in the GFI align with the variables available in the Crossroads II dataset. The research group met regularly online over 8 weeks to discuss the selection of the items based on the semantic similarities between the items from the Crossroads II survey and the GFI.
The definition of frailty used in this study was the definition proposed by Steverink et al., 2001: ‘Frailty is a state of decreasing reserves with respect to those functions and resources that are essential for a person to maintain an acceptable level of physical, social and psychological functioning’.
The operational definition of frailty was the degree to which the target group (rural Australians) approaches basic prerequisites of overall functioning (problems performing activities in daily living, comorbidity, loss weight, cognitive problems, and vision and hearing difficulties), fulfilment of basic physical and social needs (problems to performing physical activities and social isolation) and psychological responses (signs of anxiety and depression).
The Crossroads II study used a series of previously validated questionnaires, from which fifteen items were selected for the frailty assessment. The items selected to assess the mobility and activities of daily living (ADL) were from the EQ-5D questionnaire (EuroQol Research Foundation, 2021). The items referring to the physical activity were from the Short Form Health Survey (SF-36) (Ware & Sherbourne, 1992). To assess the psychosocial dimension, items were selected from the PHQ-9 (Kroenke et al., 2001) and K10 (Kessler et al., 2002) questionnaires to evaluate depression and anxiety. For the cognitive screening, the total score of the Montreal Cognitive Assessment (MoCA) (Nasreddine et al., 2005) was used. The MoCA scores that range from 0 to 30 and can be interpreted as a score between 26 and 30 as normal or no presence of a cognitive problem and a score less than 26 as having cognitive impairment (Nasreddine et al., 2005). Several instruments used to assess frailty (Fried et al., 2001; Rolfson et al., 2006; Steverink et al., 2001) estimate nutritional status by people’s perception of their weight loss over time. To assess the nutritional status, the selected question was ‘With regard to your weight, do you consider yourself to be: underweight, right weight, slightly overweight, very overweight or don’t know’? The underweight response was considered a marker of frailty risk. Although it does not evaluate the perception of weight loss over time, it responds to the person’s perceptions related to their nutrition.
Appendix 1 shows the items and questions selected. These items refer to sensory functions (vision and hearing) (2 items), mobility (1 item), physical activity (2 items), nutrition (1 item), polypharmacy (1 item), activities of daily living (ADL) (2 items), cognition (1 item), psychological distress (4 items) and community participation (1 item). All items were dichotomised (yes/no) to make responses comparable to the GFI. In determining frailty, the same cut-off scores proposed by the GFI were used in the modelling for this study, where a person is considered frail when the total score is 4 points or more (Steverink et al., 2001).
The structural validity of the variables selected to assess frailty were evaluated through exploratory factorial analysis (EFA). Items with factor loadings or slope coefficients below .30 were considered inadequate as they contributed <10% variation of the latent construct measured (Boateng et al., 2018). EFA revealed the presence of two factors that explain 54.09% of the variance. The construct validity was assessed by the known groups. Known group validity is a type of construct validity and refers to the degree to which the measurement instrument meets the assumptions that would be expected among distinct groups (Rodrigues et al., 2019). Reliability was assessed using Ordinal Alpha, which is conceptually equivalent to Cronbach’s alpha (Zumbo et al., 2007). The advantage of using ordinal alpha is that it estimates measurements involving nominal data (Gadermann et al., 2012). The Ordinal Alpha value was .909 for the first factor and .981 for the second factor, so it can be concluded that the measuring instrument for the two related factors is reliable. Therefore, the proposed frailty instrument showed to be reliable and valid.
Independent Variable Operationalisation
The independent variables analysed for their relationship with frailty included socio-demographic factors, environmental factors and health factors. The socio-demographic variables for the bivariate analysis included sex (Male/Female), age (categorised as ‘55–59 years’, ‘60–69 years’, ‘70–79 years’ and ‘80 years and over’), marital status (as ‘Married/de facto’, ‘Separated/Divorced’, ‘Widow/widower’ and ‘Single/Never married’), level of formal education (‘Some secondary’, ‘Secondary complete’, ‘Trades’ and ‘Tertiary education’) and the ethnic background (‘Aboriginal and/or Torres Strait Islander’, ‘European/Anglo-Saxon/Celtic/Caucasian’, ‘Asian’ and ‘Other’). For non-bivariate analysis ‘age’ was used as a continuous variable.
The environmental factors included in the analysis were the locality of residence ‘Regional centre’ (Shepparton/Mooroopna), and ‘Shire capital’ (Benalla, Cobram, and Seymour), and the distance to the nearest hospital (<5 km, between 5 and 10 km, >10 km). Health status included self-perception of general health (‘Excellent’, ‘Very Good’, ‘Good’, ‘Fair’ or ‘Poor’). To make comparisons between groups in the binary logistic regression, the self-reported general health variable was dichotomised as positive when the answer was ‘Excellent’, ‘Very Good’, ‘Good’, and negative when the answer was ‘Fair’ or ‘Poor’. Multimorbidity was measured by the presence or absence of two or more chronic conditions, following the definition by the Australian Institute of Health and Welfare (Australian Institute of Health and Welfare, 2021). However, for the binary logistic regression analysis multimorbidity was divided into the following categories: ‘Absence of chronic condition’, ‘One chronic condition’, ‘Two chronic conditions’, ‘Three chronic conditions’, ‘Four chronic conditions’ and ‘Five or more chronic conditions’ to enhance sensitivity in assessing how multimorbidity predicts frailty. The chronic conditions considered in the multimorbidity score were arthritis, heart conditions, circulatory problems, high blood pressure, respiratory problems, kidney problems, liver diseases, thyroid trouble, high cholesterol, chronic pain, diabetes and depression.
Statistical Analysis
Data analyses were conducted using IBM-SPSS Statistics (Version 27.0). Characteristics of the population were described using frequencies or means and standard deviations (SD) when appropriate. To determine differences between frailty and the independent variables, the chi-square test was used for the dichotomous response variable ‘presence of frailty’. For the continuous response variables an ANOVA test was used. To identify the association between socio-demographic, environmental and health-related variables, a binary logistic regression analysis was conducted. The model employed a backward selection method. After checking assumptions and the multivariable methods the (collinearity, independency and homoskedasticity assumptions), predictors were included in the initial model based on the statistical significance of p < .20 from the bivariate analysis and those based on theoretical and literature review considerations. Seven predictors were included in the initial model based on theoretical and literature review considerations: four socio-demographic variables (sex, age, level of education, marital status), and two related health variables (self-reported health status and presence of multimorbidity) and environmental (distance to the nearest hospital). However, only predictors with p-value of less than .05 were retained in the model.
Results
A total of 376 adults from the Crossroads II study aged 55 and over were included in this analysis. The mean age of this subsample was 68.4 years (s.d. 8.3), ranging from 55 to 90 years old. There were slightly more females (51.9%) than males (48.1%). The largest group 43.6% (n = 164) had ‘some secondary education’, followed by a 21.5% (n = 81) with ‘tertiary education’. More subjects lived in the Shire’s capitals 55.6% (n = 209) with 44.4% (n = 167) of the participants domiciled in the regional centre of Shepparton. The majority of participants (71.3%) lived 5 km or less from a hospital, with 10.2% living 5–10 km and 18.5% more than 10 km from the nearest hospital.
The largest group of participants (97.6%) indicated that their ethnic background was European/Anglo-Saxon/Celtic/Caucasian; a small proportion identified as Aboriginal and/or Torres Strait Islander background (1.1%), as Asian background (.3%), as Middle East (.8%) and .5% as African background.
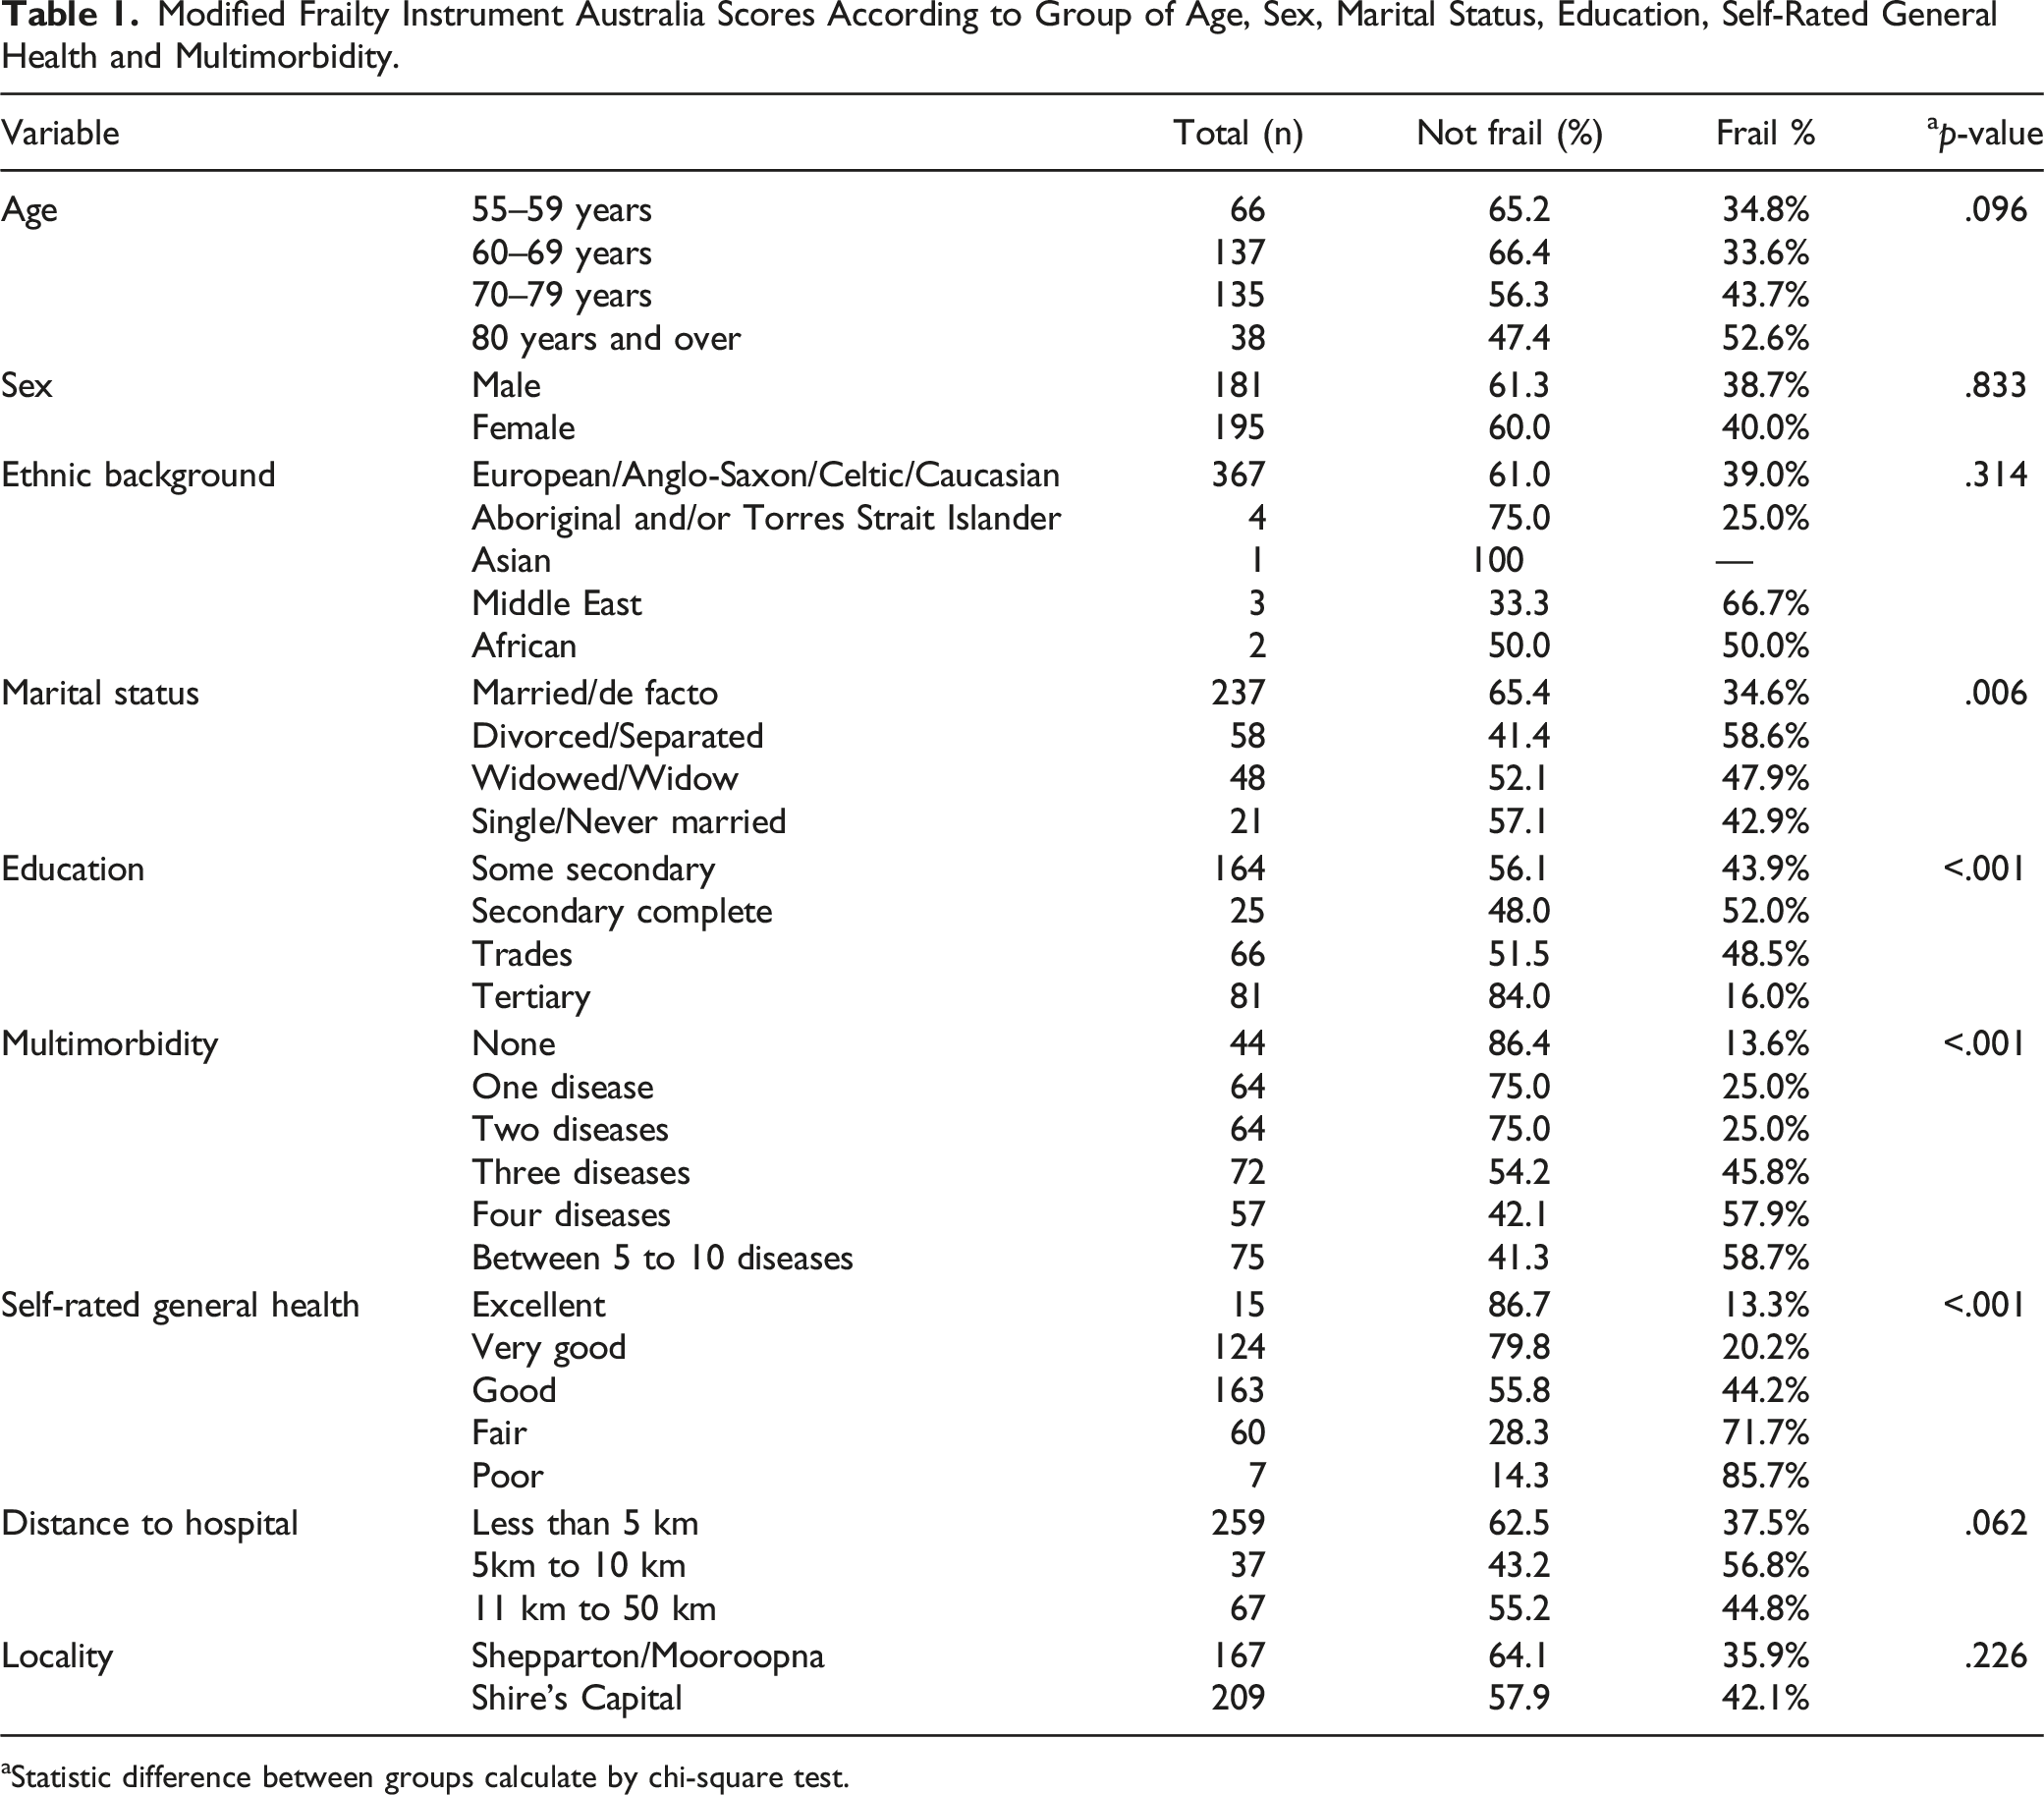
Modified Frailty Instrument Australia Scores According to Group of Age, Sex, Marital Status, Education, Self-Rated General Health and Multimorbidity.
aStatistic difference between groups calculate by chi-square test.
The prevalence of frailty was 39.4% in this study population. Table 1 also shows the bivariate analysis. The frailty and the mean scores of the frailty scale were higher in the presence of multimorbidity (p < .001): 53.0% of participants with multimorbidity were frail. A higher proportion of people that perceived their general health as negative (fair or poor) (73.1%) were frail (p < .001). Higher educational attainment (tertiary education) was associated with a lower mean score in frailty (p < .001) and 84.0% of those with tertiary education were not frail. The mean score of frailty for people who were separated/divorced (58.6%) was higher than in those married or in a de facto union (p < .001).
There was no statistically significant association between frailty and sex, distance to the hospital and locality (regional centre vs. smaller town), or the ethnic background. However, there was a significant association between increased age and higher mean score of frailty (p = .01) (Means of 67.61 (SD 8.19), 69.82 (SD 8.50) for non-frail and frail group, respectively).
Binary Logistic Regression (Adjusted), Odds Ratios and 95% Confidence Interval for Odds Ratios for the Factors Predicting Frailty.
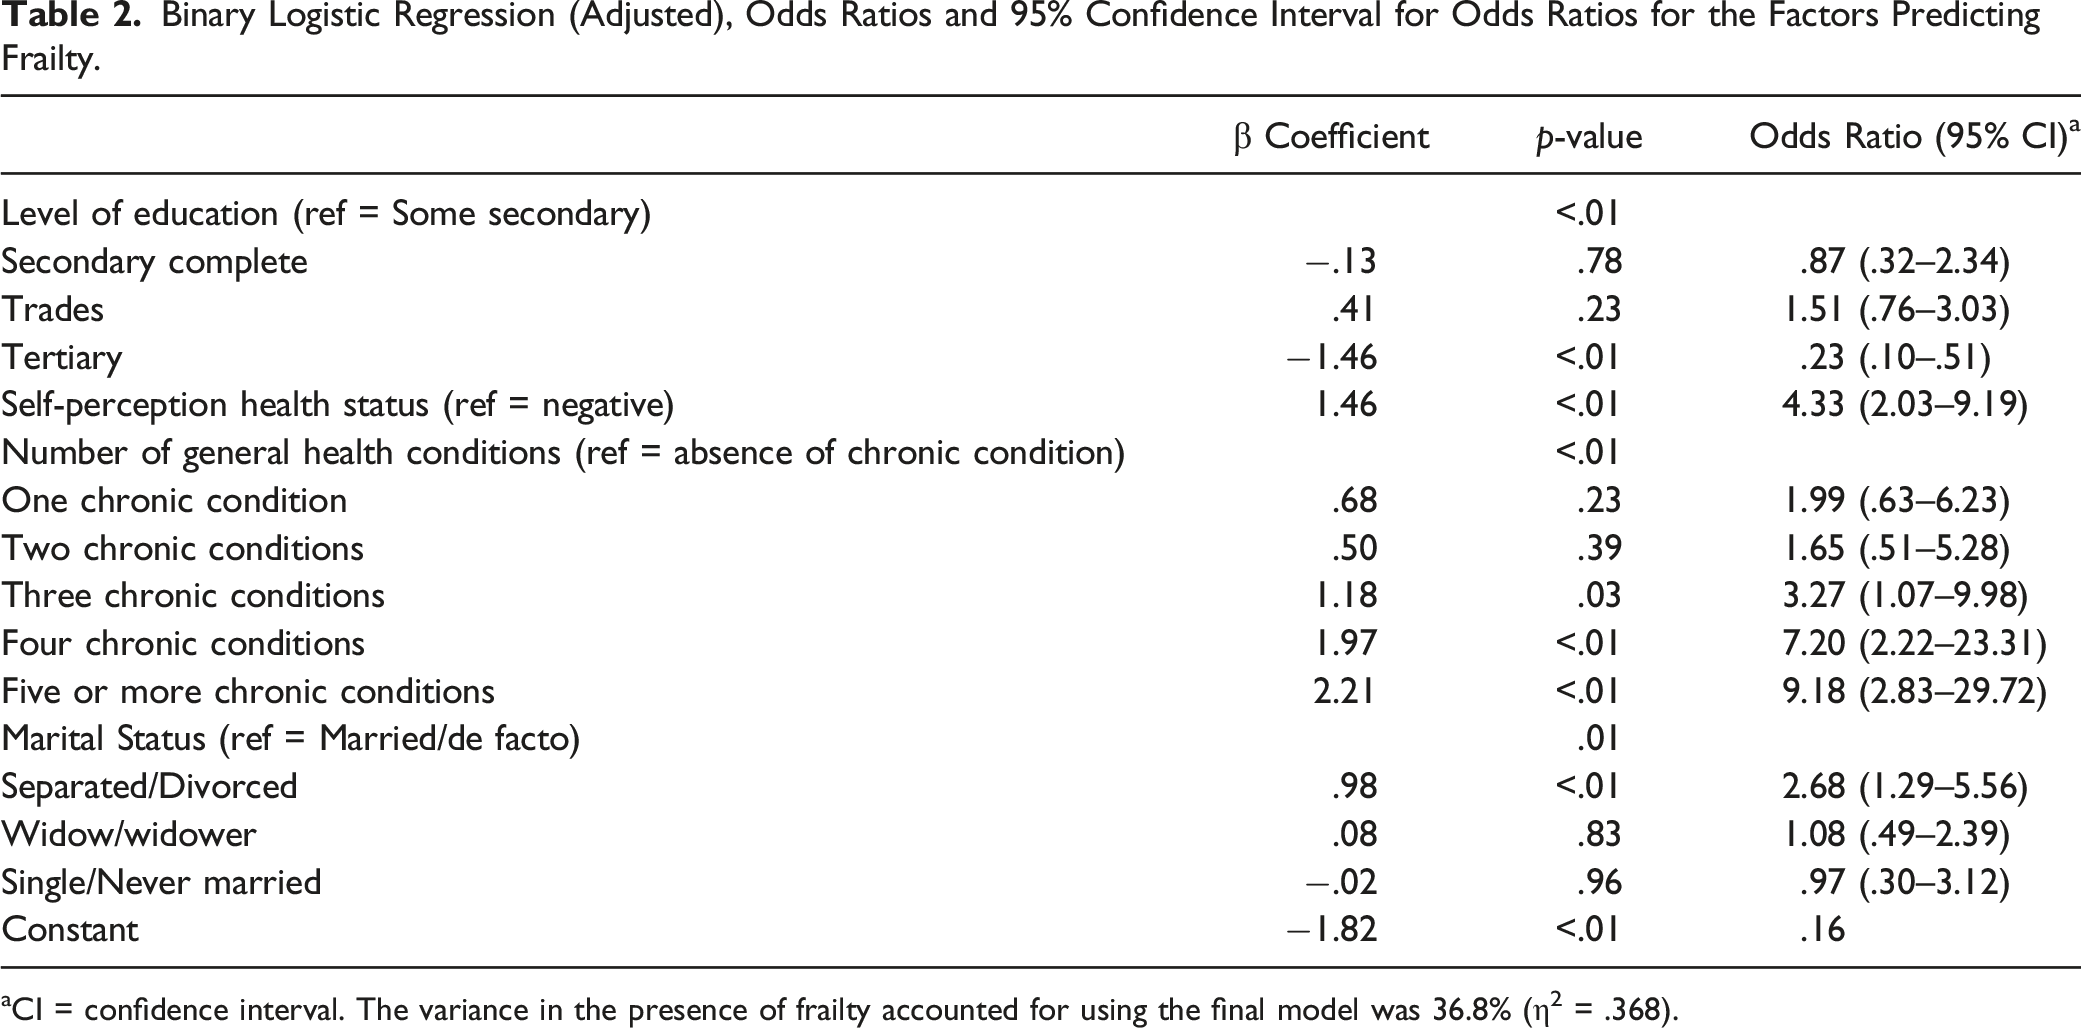
aCI = confidence interval. The variance in the presence of frailty accounted for using the final model was 36.8% (η2 = .368).
Discussion
Our study found that two-fifths (39.4%) of the rural population aged 55 and over had frailty. Those with frailty were more likely to have multiple chronic illnesses, a lower education level and be separated or divorced. Consistent with other studies, the prevalence of frailty was found to decrease with higher educational attainment (tertiary education) (Hoogendijk et al., 2014). Higher educational attainment has been associated with increased numbers of personal relationships, decreased depression (psychosocial factors) (Kristenson et al., 2004; Lyyra & Heikkinen, 2006), decreased chronic diseases (Koster et al., 2005) and healthier lifestyles (Ramsay et al., 2008). Other studies have also found frailty to be associated with being a widow, widower or being divorced (Armstrong et al., 2015; Thompson et al., 2018). One reason suggested by Wang et al. (Wang et al., 2021) for this is that married individuals have greater access to social, psychological and economic resources which may promote health and longevity. This result reinforces the importance of obtaining a frailty assessment that contains a psychological and social component, in addition to the physical component, as defined by the GFI (Steverink et al., 2001). The psychosocial wellbeing of older adults seems to be strongly associated with the development of frailty and, therefore, with functional living.
Several studies have indicated that frailty is more prevalent in the female population (Fried et al., 2001; Thompson et al., 2018; Widagdo et al., 2015). However, our study found no significant differences between males and females. This finding may be because the number of participants was insufficient to detect a difference.
An association between the distance to health services and health outcomes has previously been reported, with patients living near healthcare centres being found to have better health outcomes than those living further away (Bello et al., 2012; Kelly et al., 2016; Lankila et al., 2016). Our results show no significant association between the hospital distance and the prevalence of frailty; this could be because most participants (71.3%) live less than 5 km from the nearest hospital, and sampling occurred only within the town boundaries.
The prevalence of multimorbidity (presence of two or more chronic diseases) is widespread in advanced ages (Fabbri et al., 2015) and has been linked to frailty (Collard et al., 2012). In addition, health perception is often related to the number of chronic diseases present in the individual (Abu et al., 2020). Some studies have linked the presence of frailty with a worse self-perception of general health (Sousa et al., 2012; Xu et al., 2021), and our results were consistent with these findings. Health perception is a widely used measure because it is easy to collect and is related to the individual’s health status. Nevertheless, this relationship in older adults has shown to have certain biases. The differences between clinical indicators and self-perception of health status have been reported in several studies (Henchoz et al., 2008; Louie & Ward, 2010; Spitzer & Weber, 2019); therefore, caution should be exercised interpreting our findings related to self-reported health.
Our study found a higher prevalence of frailty than that reported in other Australian studies, even though we included people aged 55–64, who are not usually included in frailty studies (Thompson et al., 2018; Widagdo et al., 2015). This may be because other studies focussed on urban areas and our analysis was based in a rural population. Although, direct comparisons cannot be made due to methodological differences in assessing frailty, age inclusion criteria and the demographic areas (rural/urban). Risk factors associated with frailty, such as chronic diseases, low income and low educational level, are more common in rural areas (Australian Institute of Health and Welfare, 2019a). Therefore, this study’s focus on detecting frailty in rural populations could serve as a baseline for future studies and inform targeted population-based approaches to improved health service development and increase their responsiveness to rural groups’ needs.
One of the limitations of this study is that the data were obtained from a cross-sectional study, so causality cannot be inferred. Longitudinal studies are needed to investigate predictors of frailty in older people living in regional and rural areas. Another limitation or challenge was that the Crossroad II study was designed to understand the health status in rural settings comprehensively and did not directly assess frailty using a validated instrument. Due to the difficulty of accessing healthcare in rural areas, it is essential to have an insight into the state of health and the prevalence of frailty in this population. The Crossroad II study provided an existing rural data set enabling us to measure frailty using the variables available. The selected variables in this study had appropriate psychometric properties to allow us to calculate the prevalence of frailty. This research can be used in developing a modified GFI index; however, it requires further research to assess a modified instrument’s sensitivity, specificity and predictive accuracy. Despite these limitations, this study gives us an estimation of the frailty status in the rural population in Australia that can be used in designing clinical interventions and prioritising a Comprehensive Geriatric Assessment (CGA) for those that are more vulnerable to frailty.
One of the main strengths of this study is that it involved community-dwelling older participants from a rural area. Many frailty studies have been carried out in geriatric settings, hospitals and metropolitan areas where the characteristics of the population and the patient needs are very different compared with community-dwelling rural people. This is the first study determining frailty using an adapted frailty scale based on the GFI in rural areas in Australia, which is important in enhancing our understanding of the health and frailty conditions of adults older than 55 years old in rural Australia.
Estimating the frailty status in rural populations is important in planning interventions to address the onset and progression of frailty. It can assist in prioritising and improving healthcare delivery for people, preventing and delaying adverse health outcomes due to frailty syndrome. Thus, this research helps determines the extension of the frailty and could assist in ensuring that policies are tailored to the rural context for older adults. The results of this study highlight the need to explore the multidimensions of frailty. For example, recognising of the association between frailty and educational attainment, marital status and perceived health status helps improve understanding of the non-physical factors associated with developing frailty. Considering frailty as a medical multidimensional syndrome highlights the need for interventions to improve nutritional status, physical exercise, mental health, wellbeing and social connectedness of older adults. By addressing modifiable factors associated with frailty, we may optimise the quality of life for community-dwelling older people in rural areas. This is particularly important as the number of older adults living in rural areas continues to rise.
Footnotes
Acknowledgements
The researchers thank all participants who volunteered their time to the Crossroads II study. We are also grateful for all the Research Assistants who collected data for Crossroads II, namely, Sian Wright, Veronica Coady, Fulya Torun, Zahra Ali, Delia Allen, Jayden Andrew, Shane Barbary, Lauren Barker, Felicity Booth, Lou Bush, Amanda Clarkson, Nicole Dalle-Nogare, Madhulika Golhar, Priscilla Howden, Terry James, Viv Jeffries, James Kolacz, Lisa McCoy, Jill McFarlane, Angela Magoga, Zubaidah Mohamed Shaburdin, Bruce Naylor, Patricia Patt, Lyn Pierce, Karen Quinlan and Catherine Sambell and Peter Wnukowski-Mtonga. We acknowledge the National Health and Medical Research Council and our local partners for funding, including Goulburn Valley Health, Primary Care Connect, Benalla Health, Cobram District Health, Seymour Health, Moira Shire, Goulburn Valley Primary Care Partnerships, Shepparton Access, City of Greater Shepparton, Alfred Health and the Department of Rural Health, The University of Melbourne. Further, we acknowledge support of the Australian Government Department of Health Rural Health Multidisciplinary Training Program.
Declaration of Conflicting Interests
The author(s) declared no conflicts of interest concerning this article’s research, authorship, and publication.
Funding
The author(s) received no financial support for the research, authorship, and/or publication of this article.
Ethics Approval
This project received ethics approval from Goulburn Valley Health (ID 1648142).

Appendix
GFI items
Crossroad II items
Mobility
Under each heading, please click the ONE box that best describes your health TODAY:
Can the patient perform the following tasks without assistance from another person? (Walking aids such as a can or a wheelchair are allowed)
1. Mobility
1. Grocery shopping
I have no problem in walking about I have some problems in walking about I am confined to bed
2. Walking outside house (around the house or to neighbour)
2. Self-care
3. Getting (un)dressed
I have no problems with self-care
4. Visiting restroom
I have some problems with washing or dressing myself
Coding: (Yes = 0; No = 1)
I am unable to wash and dress myself
3. Usual Activities
I have no problems with performing my usual activities
I have some problems with performing my usual activities
I am unable to perform my usual activities
Coding: (No problem = 0; Some problem or unable = 1)
Vision
Vision
5. Does the patient encounter problems in daily life because of impaired vision?
4. Have you ever suffered from, or are currently being treated for Eye problems (include short sighted, long sighted and corrected vision)?
Coding: (Yes = 1; No = 0)
Coding: (Yes = 1; No = 0)
Hearing
Hearing
6. Does the patient encounter problems in daily life because of impaired hearing?
5. Have you ever suffered from, or are currently being treated for Hearing loss?
Coding: (Yes = 1; No = 0)
Coding: (Yes = 1; No = 0)
Nutrition
Nutrition
7. Has the patient unintentionally lost a lot of weight in the past 6 month (6 kg in 6 months or 3 kg in 3 months)?
6. With regard to your weight, do you consider yourself to be:
Underweight
The right weight
Slightly over weight
Very overweight
Don’t know
Coding: (Yes = 1; No = 0)
Coding: (The right weight; Slightly overweight; Very overweight; Don’t know = 0; Underweight = 1)
Comorbidity:
Comorbidity:
8. Does the patient use 4 or more different types of medication?
7. How many different medications (in total) do you take in a day?
Coding: (Yes = 1; No = 0)
Coding: (0–3 = 0; 4 or more = 1)
Cognition
Cognition
9. Does the patient has any complaints on his/her memory (or diagnosed with dementia)?
8. MoCA test
Coding: (Yes = 1; No = 0; Sometimes = 0)
Coding: (Score 26–30 = 0(normal); >26 = 1(abnormal))
Psychosocial
Psychosocial
10. Does the patient ever experience emptiness around him/her? for example, You feel so sad that you have no interest in your surroundings. Or if someone you love no longer love you, how do you feel?
Over the last 2 weeks, how often have you been bothered by any of the following problems?
9. Little interest or pleasure doing things
11. Does the patient ever miss the presence of other people around him? Or do you miss anyone you love?
10. Feeling down, depressed, or hopeless
Coding: (Not at all = 0; Several days, more than half the days or nearly every day = 1)
12. Does the patient ever feel left alone? For example, you wish there is someone to go with you for something important.
In the last 4 weeks, about how often…
13. Has the patient been feeling down or depressed lately?
11. Did you feel nervous?
14. Has the patient felt nervous or anxious lately?
12. Did you feel so sad that nothing could cheer you up?
Coding: (All of the time, most of the time or some of the time = 1; A little of the time, or none of the time = 0)
Coding: (Yes = 1; No = 0; Sometimes = 1)
13. Do you belong to any community or local group or other organisation?
Coding: (Yes = 0; No = 1)
Physical Fitness
Physical Fitness
15. How would the patient rate his/her own physical fitness? (0–10; 0 is very bad, 10 is very good)
The following questions are about activities you might do during a typical day. Does your health now limit you in these activities? If so, how much?
14. Walking more than 1 km
Coding: (0–6 = 1; 7–10 = 0)
15. Bending, Kneeling, or stooping.
Coding: (Yes, limited a lot or yes, limited a little = 1; No, limited at all = 0)