
Abstract
As the first systematic attempt to identify the issues involved in the use of large data sets to examine nonprofit surpluses and endowments, this paper provides suggestions for how best to ensure that the data are consistent and useful. We introduce five definitions of nonprofit surplus (the analogue of profit) and identify when researchers should use one in preference to the other. The distinctions are especially important when analyzing endowed organizations because surpluses affect the amount and rate of accumulation of endowment assets. Conversely, an endowment affects how managers and analysts should calculate surplus. Information on IRS 990 reports is incomplete, so we explain how to construct a pro forma endowment portfolio and endowment spending from available data for the purpose of calculating operating surplus of endowed organizations. We argue that researchers doing statistical analyses with large data bases should distinguish between endowed organizations and those without endowments because their financial behavior may differ. To lump them together is likely to distort statistical results. Finally, we discuss practical issues of data cleaning when using data from IRS 990 reports.
Keywords
The term surplus is used loosely as an alternative term for the profit of a nonprofit organization. 1 The term is so basic that one would think the matter of its definition is settled but in fact several alternatives are in common use (Bowman, 2008). In the sections that follow, we introduce five definitions and identify when researchers should use one in preference to another. We compare the alternatives statistically to test for robustness. Note that surplus, as used here, can be positive or negative (deficit).
Endowments are related to surpluses because surpluses affect the amount and rate of accumulation of endowment assets. Conversely, an endowment affects how managers and analysts should calculate surplus. When it comes to defining endowment, various professions have different definitions. Black’s Law Dictionary (Garner, 2009) defines an endowment as permanently restricted net assets. 2 Economists tend to define it as total net assets (cf. Core, Guay, & Verdi, 2006). Accountants stake out a middle ground, defining endowment as permanently restricted net assets plus board designated unrestricted funds that function as endowment (quasi-endowment). Unfortunately, for researchers using pre-2008 data, IRS Form 990 did not capture information on endowments. This article suggests a simple procedure for inferring the existence and size of an endowment from the earlier period.
The article is organized as follows. The first section presents the literature related to surplus and five measures of nonprofit surplus. The next section discusses the literature related to endowment and proposes a working definition for researchers. It also explains how to construct a pro forma endowment portfolio from IRS Form 990 data for calculating operating surplus. The section on statistical analysis and findings discusses practical issues of data cleaning before presenting statistical results for different definitions of surplus and endowment, and it discusses the implications of particular measures. We conclude in the final section that researchers should distinguish between endowed organizations and those without endowments because their financial behavior may differ and to lump them together would distort statistical results.
The most common sources of financial data are audited financial statements and IRS Form 990. We recommend using financial statements whenever possible because they are more accurate (Froelich, Knoepfle, & Pollak, 2000). This article is primarily intended to be a guide to researchers who must resort to data from IRS Form 990. Except where explicitly noted, the following discussion assumes the use of accrual accounting. 3
Five Metrics of Nonprofit Surplus
Several text books define the surplus of a nonprofit as the difference between total revenue and total expenses (e.g., Anthony & Young, 2003; Finkler, 2005; Zietlow, Hankin, & Seidner, 2007), but it is not always clear from the context whether the definition includes donor restricted gifts or how to treat endowment spending (which technically is not revenue). Researchers often use the “excess or (deficit) for the year” line on pre-2008 IRS Form 990 but this approach is generally invalid for reasons we will soon explain.
Two early articles (Chang & Tuckman, 1991; Tuckman & Chang, 1991) used total surplus divided by total revenue as one of four ratios predicting financial vulnerability. Other research on financial vulnerability followed using the same ratios as predictors while experimenting with different definitions of vulnerability (Greenlee & Trussel, 2000; Hager, 2001; Keating, Fischer, Gordon, & Greenlee, 2005; Trussel, 2002; Trussel & Greenlee, 2004). Recently, Greenlee and Tuckman (2007) identified 15 significant predictor variables in the literature, none of which accounted for restricted revenue or spending from endowment.
Managers, consultants, donors, government agencies, journalists, and researchers often use information in financial audits and IRS Form 990 to infer whether an organization’s budget was or was not balanced. Unfortunately, there is not a standard nonprofit budget format, much less a definition of nonprofit budget surplus. IRS Form 990 does not include a statement of cash flows that would allow researchers to observe “cash provided by (used in) operations”—which would be a reasonable proxy for a cash-basis budget surplus. We hope this article helps consumers of financial information to sort out the technical issues and decide which proxy for budget surplus best meets their needs. We offer one suggestion of our own.
Total surplus
Generally Accepted Accounting Principles (GAAP) require use of accrual accounting and reporting of “the total excess (deficiency) of revenues over expenses on financial statements, which is reported as a change in net assets or change in equity” (Financial Accounting Standards Board [FASB], 1993b, §17). Unfortunately, GAAP does not provide convenient shorthand for this phrase so we take the liberty of calling it total surplus. In essence, it is the increase (or decrease) in the sum of restricted and unrestricted net assets during the year. IRS Form 990 has no line for total surplus, so it must be inferred as follows:

Line numbers refer to the pre-2008 IRS Form 990. This version is used in preference to the current version because the lines on the old form are numbered consecutively throughout. (On the new form line numbering resets on each part.)
Total surplus is too expansive to remotely approximate a budget surplus because it includes restricted gifts, grants, and pledges as well as capital gains on investments. Now that most states have adopted some version of the Uniform Prudent Management of Institutional Funds Act (UPMIFA), nonappropriated investment earnings on endowments may never be spent. 4 However, total surplus is an indicator of the change in the long-run fortunes of nonprofits because endowment growth allows organizations to keep pace with inflation.
Unrestricted surplus
According to GAAP, restricted gifts and grants can only be used in accordance with a donor’s prior instructions. When expended for their intended purpose in the year received, they are classified as unrestricted revenue. 5 Gifts and grants (public support) that cannot be spent in the year received appear on financial statements in that year as temporarily restricted revenue. Furthermore, GAAP classifies all pledges as temporarily restricted revenue. When restrictions are fulfilled the assets are reclassified as “net assets released from restrictions.” GAAP classifies all expenses as unrestricted.
“A statement of activities shall report the amount of change in permanently restricted net assets, temporarily restricted net assets, and unrestricted net assets for the period” (FASB, 1993b, §19, italics added). Therefore, the sum of unrestricted gifts and grants, program service revenue, and net assets released from restrictions minus expenses equals a change in unrestricted net assets which we call unrestricted surplus. IRS Form 990 has no line for unrestricted surplus, so it must be inferred as follows:

Operating surplus
Because capital gains are GAAP revenues, in bull (rising) markets, unrestricted surplus tends to mask a budget deficit, and in bear (falling) markets, it is apt to understate a budget surplus. Further complicating matters, realized revenues from investments (lines 4, 5, 6c, 7) belong to the endowment and are not actually available for spending in the year earned. Their inclusion in the revenue section of IRS Form 990 gives an impression that more funds are available for spending than may be the case.
An operating surplus metric is preferred for use with endowed organizations because this metric substitutes cash flow generated by a “spending formula” for earned investment related revenue (interest, dividends, capital gains, and losses). A spending formula determines the amount of endowment resources available for operations in a given year (i.e., the spending rate). GAAP permits reporting of operating surplus on financial statements but does not provide a definition, leaving organizations free to define it to suit their purposes (FASB, 1993b, §23).
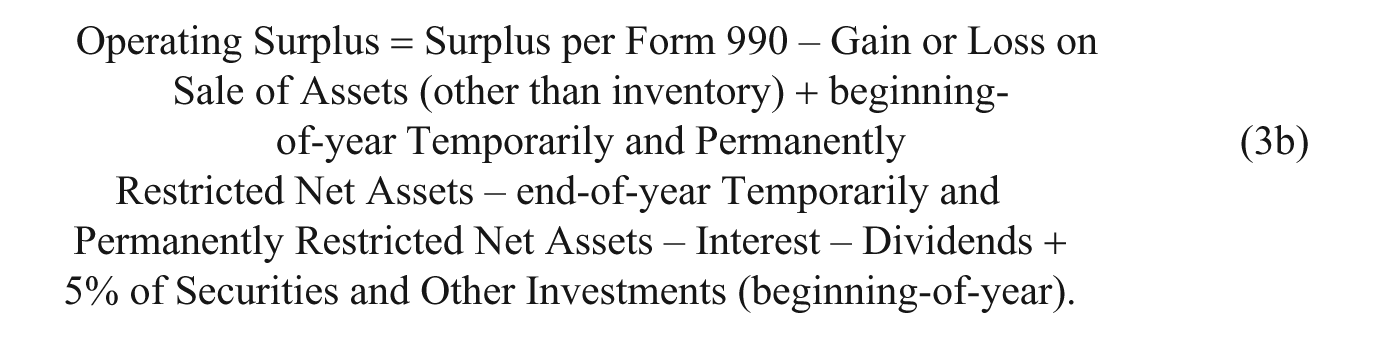
For-profit businesses tend to define operating revenue as revenue from operations which we regard as too narrow for nonprofits because it excludes spending from endowment and net assets released from restrictions. We believe nonprofits should define operating revenue as income for operations which includes both elements. 6 We recommend defining operating surplus as unrestricted surplus minus investment earnings (current income plus capital gains or losses) plus a contribution to annual spending by endowment that is determined by a board-approved formula:

The formula does not use actual spending from endowment but rather the maximum amount that a spending formula allows, which we call the nominal spending. Exceeding a nominal spending rate is unsustainable because it causes the purchasing power of the endowment to diminish over time. Information on endowment assets and the spending formula is included in an organization’s financial statements. The revised IRS Form 990 for fiscal years beginning in 2008 includes information on actual spending but nothing on the spending formula. (Note: formula 3b appears in the next section on Endowment.)
Surplus per Form 990
Perhaps the most widely applied version of surplus in nonprofit research is

and

We refer to these generically as “Surplus per Form 990.” Regrettably, it is a problematic metric. On one hand, it excludes unrealized capital gains and losses, donated services, and recovered grants and, on the other, it includes realized capital gains (line 8d: “net gain or loss” from sales of assets other than inventory).
Furthermore, Part 1 of old and new IRS Forms 990 has only a single column for reporting revenues and expenses and IRS instructions are unclear as to whether organizations should report unrestricted or total amounts. This ambiguity presents a problem: some nonprofits using GAAP may transfer data into Part I of the old IRS Form 990 (lines 1 through 12) from the unrestricted column of their statement of activities, whereas others may transfer data from the total column. As the total number is more comprehensive, it seems likely that organizations would report the total figures. However, this practice commingles (a) unrestricted gifts and earned income, which are available to spend in the current year, with (b) restricted gifts and grants and pledges, which are not.
Pro forma budget surplus
Table 1 provides a summary of the surplus concepts. Both Total Surplus and Surplus per Form 990 are too broad to be useful as indicators of budget surplus because they include as revenue restricted grants, restricted gifts, and pledges. Total Surplus also includes total return on investments whether or not the investments are being managed as an endowment. Surplus per Form 990 inconsistently includes realized capital gains but excludes unrealized capital gains. Although it reports the market value of in-kind donations, it does not report separately the amount used in the current period. Therefore, the net balance of in-kind donations and their expenditure is not included in the net on line 18 (old form) or line 19 (page 1 of the new form).
Alternative Concepts of Nonprofit Surplus
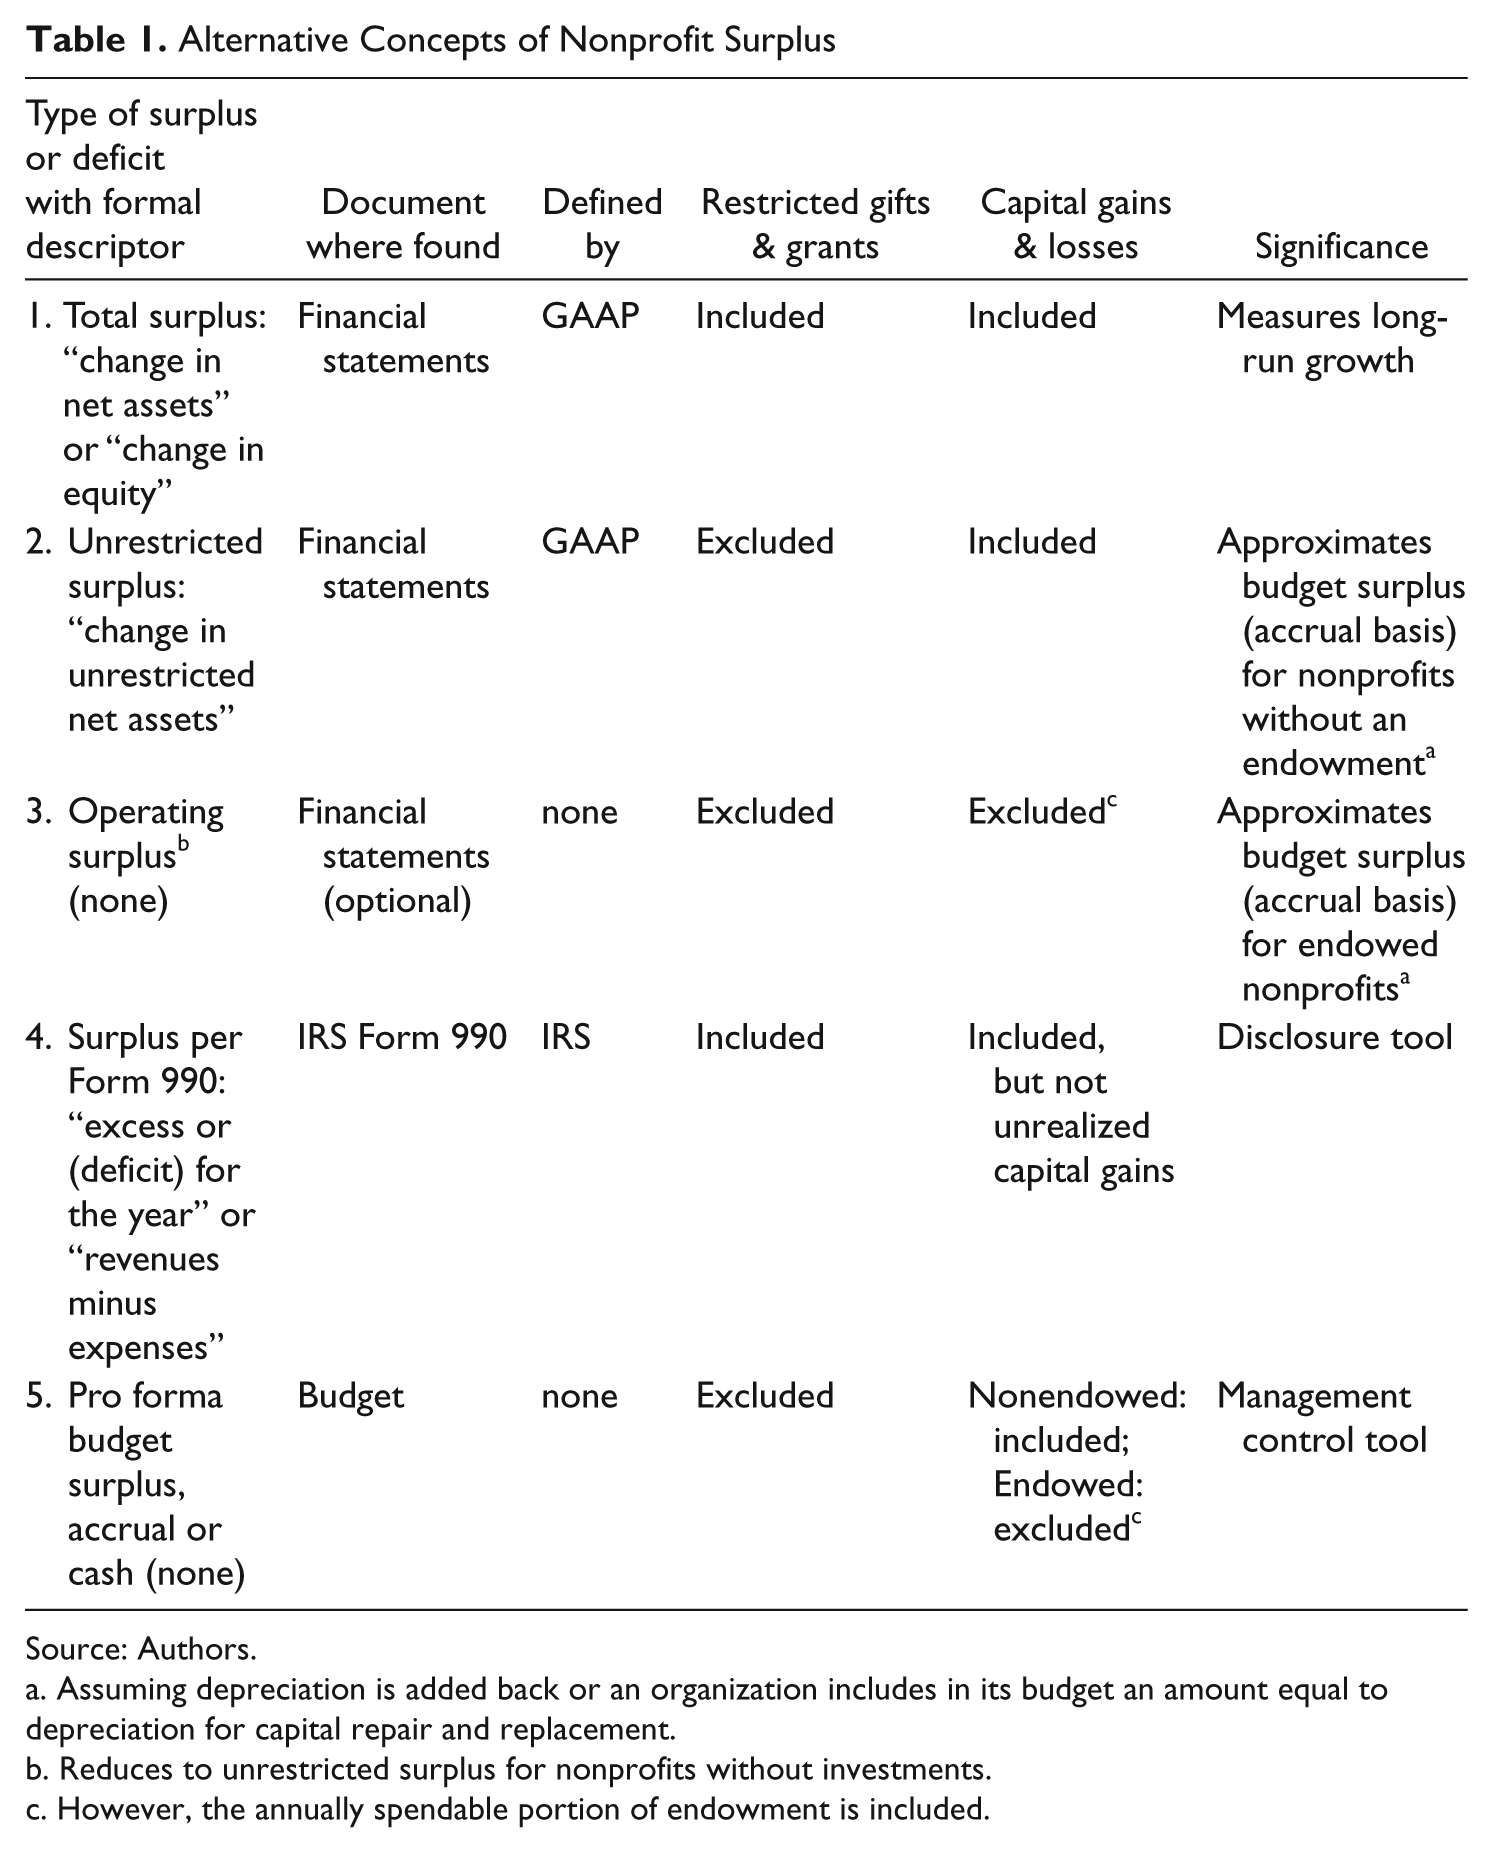
Source: Authors.
Assuming depreciation is added back or an organization includes in its budget an amount equal to depreciation for capital repair and replacement.
Reduces to unrestricted surplus for nonprofits without investments.
However, the annually spendable portion of endowment is included.
For organizations without an endowment, unrestricted surplus is a reasonable approximation to budgetary surplus (accrual). For endowed organizations, we can derive a pro forma budgetary surplus starting with Surplus per Form 990 as follows: 8
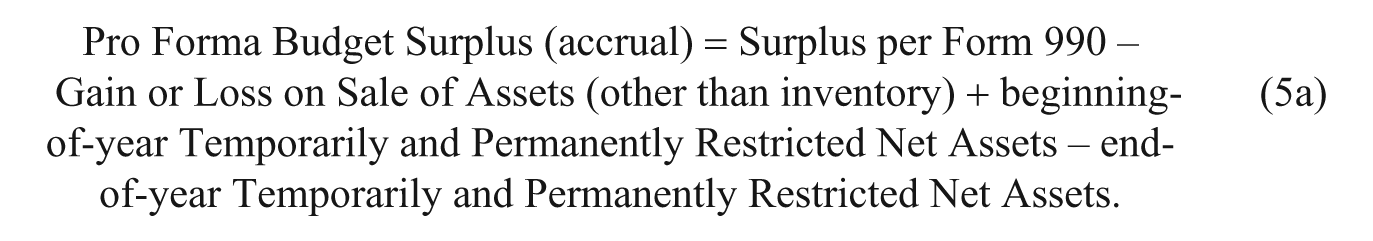
Change in Restricted Net Assets is the sum of end-of-year temporarily and restricted net assets minus the sum of beginning-of-year temporarily and restricted net assets. It reflects reclassifications as well as new restricted gifts, grants, and pledges. This equation assumes that in-kind donations are used up in the course of a year, so their net contribution to surplus is zero. This may be a reasonable approximation in many cases but it is easy to think of counterexamples (e.g., resale shops, food pantries). Volunteer time is rarely reported as in-kind donations because GAAP rules are very restrictive on this point. Despite these shortcomings, there is no obvious alternative. Given that depreciation is an expense that does not use cash and given the absence of a standard definition of budget surplus, depreciation may be added back to (5a) or not, depending on the researcher’s purpose.
Although financial statements prepared according to GAAP are based on accrual accounting, many budgets are on a cash basis. Purchases of property, plant and equipment (the accountant’s term) or land, building and equipment (the IRS Form 990 term, abbreviated LB&E) are not expenses in accrual accounting but they reduce available cash. So a pro forma budget surplus on a cash basis is approximately

Unfortunately, neither audited financial statements nor IRS Form 990 distinguish between gifts to annual budgets and capital gifts to endowments or to expand museum collections. Capital gifts are analogous to equity infusions to for-profits from issuance of stock. We find no obvious estimator for capital gifts so researchers must be aware and interpret their results cautiously when their data include organizations in the process of creating an endowment or are already endowed.
Endowment
One thread of the endowment literature debates their social value (Bradley, Jansen, & Silverman, 2003; Brody, 1997, Frey, 2002; Hansmann, 1990; Irvin, 2007). Another thread focuses on their relationship to operations (Bowman, 2002, 2007; Bowman, Keating, & Hagar, 2007; Ehrenberg, 2000; Fisman & Hubbard, 2003; Gentry, 2002; Greenlee & Bukovinsky, 1998; Lerner, Schoar, & Wang, 2008; Weisbrod, Ballou, & Asch, 2008). A consensus is emerging that endowed nonprofits behave differently from other nonprofits. Perhaps the lack of a way to identify which organizations have endowments has inhibited progress on empirically exploring these differences with large databases. This article is an attempt to provide new tools for researchers on this topic.
A Working Definition of Endowment
As we pointed out in the introduction, there is no agreement among lawyers, economists, and accountants about defining endowment. The views of practitioners are similarly diverse; when Commonfund (2004) asked university leaders to identify the underlying principle of their endowment, 54% said it was to provide a consistent and/or growing stream of income to the operating budget, 26% indicated it was to maximize intergenerational equity, and 11% wanted to reduce/smooth variations in their budgets.
Like the majority of practitioners, we prefer to think of an organization’s endowment as a collection of assets dedicated (either by donors or the board) to providing a perpetual source of income in support of its mission. Thus, endowment can be used to maintain indefinitely the price of goods and services below the real cost of their production.
10
The American Institute of Certified Public Accountants’ (AICPA) definition of endowment comes closest to our view: Endowment is
an established fund of cash, securities, or other assets to provide income for the maintenance of a not-for-profit organization. . . . Endowment funds are generally established by donor-restricted gifts and bequests to provide a permanent endowment, which is to provide a permanent source of income, or a term endowment, which is to provide income for a specified period. When an organization’s governing board earmarks a portion of its unrestricted net assets to provide income for a long but unspecified period the funds are called quasi-endowment or funds functioning as endowment. (American Institute of Certified Public Accountants, 1996, §366)
Researchers working with large databases, such as the pre-2008 National Center for Charitable Statistics’ (NCCS) files, have no information on endowments and must infer their existence. To solve this problem, we propose to operationalize the concept of endowed funds with a pro forma calculation that serves as a rule of thumb: if an organization owns a portfolio of investments in securities and other investments equal to or greater than total expenses, we say it is presumptively endowed. This rule can provide a perpetual stream of income at least equal to 5% of an expense budget.
Where does the 5% figure come from? A series of simulations conducted by Demarche Associates, Inc. (1990, updated 1999) for the Council on Foundations showed that the upper limit for annual spending from an endowment that can be sustained indefinitely with moderate exposure to investment risk is 5.5% of endowment assets. One can easily see that when securities and other investments are equal to or greater than total expenses, 5% of the one equals 5% of the other and, when securities and other investments are greater than expenses, they can support more than 5% of an operating budget. The 5% figure is pro forma, but it has the virtues of simplicity, materiality, and common usage.
Typically budgets change over time through incremental additions and reductions to prior year figures. Fluctuations in a source of income that comprises less than 5% of a total budget are not likely to have a material effect on spending. Furthermore, the 5% pro forma figure echoes federal law governing the minimum foundation payout (Tax Reform Act of 1969 as amended). Empirically, it is an observed maximum for most endowed organizations (Deep & Frumkin, 2005). According to Table 2, average actual spending rates of universities as computed by Commonfund and the National Association of College and University Business Officials (2009) have tended to stay below 5.0% during the past decade. The average actual spending rates of foundations are slightly above 5.0%.
Endowment Spending Rates by Year
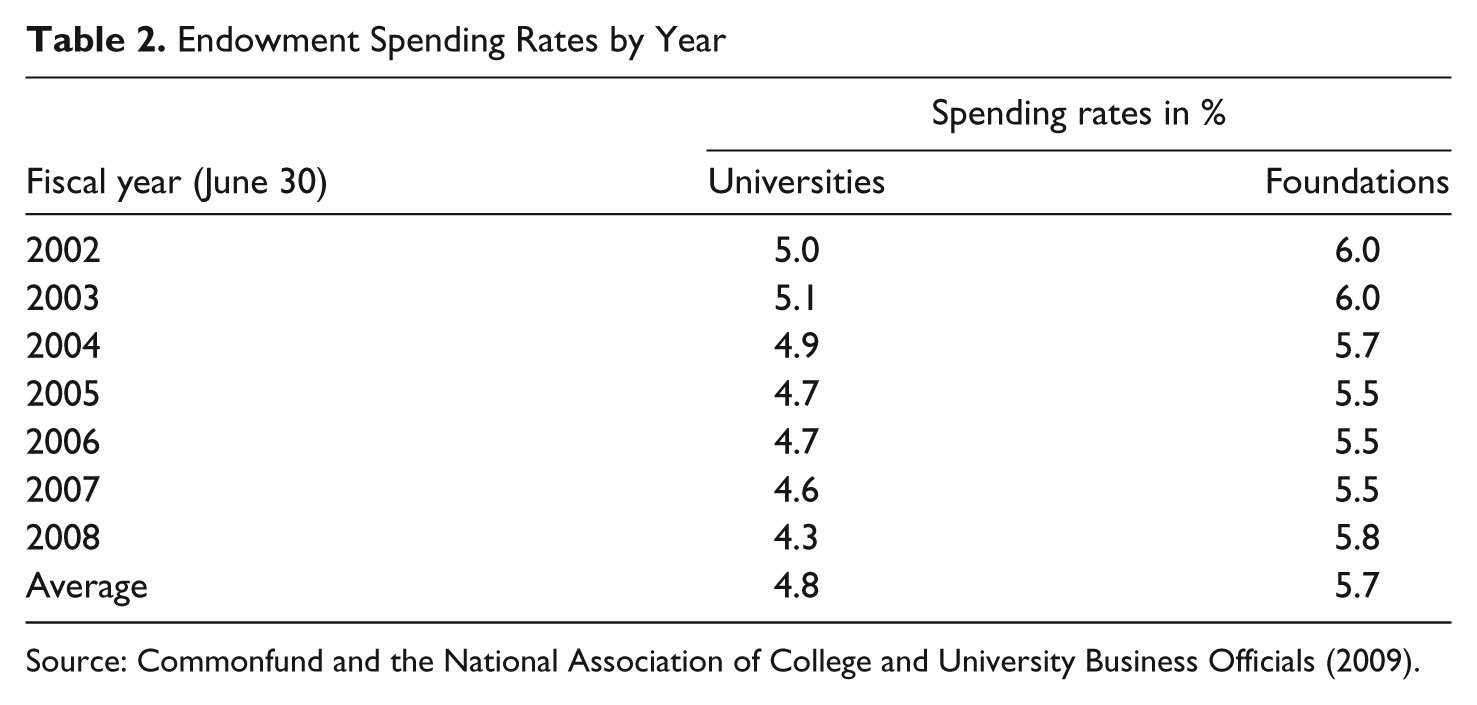
Without knowledge of nominal (target) spending rates a 5% pro forma standard is reasonable as being close to the upper limit for a sustainable operating surplus while exposing organizations to moderate risk of investment losses. Assuming that most organizations try to maintain a balanced operating budget, we would predict actual average spending from endowment around 5% or slightly less, given the economic environment. Table 2 confirms this expectation based on the past 7 years.
Although we like this method of inferring the existence of an endowment (including quasi-endowment) and estimating its size, we stress that it is a rule of thumb. We acknowledge it will overstate some cases and understate others but without access to financial statement data on endowments, a rule of thumb is necessary for empirical research. We now turn to the question of why we use securities and other investments as a pro forma endowment portfolio instead of some other combination of assets on IRS Form 990.
Pro Forma Endowment Portfolio
Researchers who want to use NCCS data to obtain information on the size and composition of endowment portfolios and endowment management policies will find it necessary to improvise. The NCCS digitized data and statistics of income (SOI) files contain information on cash, savings, securities, investments in land, building and equipment, other investments, and other assets. The question is that what combination of these assets constitutes the best pro forma endowment portfolio. We take an empirical approach to answering this question while noting here that the number of endowed organizations and all summary statistics depend on which alternative the researcher chooses.
The first panel of Table 3 (first 6 lines) shows the mean, median, the 90th percentile, and the percentile at which the measure is greater than zero for the full sample. The second panel (next 6 lines) shows the same statistics for the group that is presumptively endowed according to our preferred definition. The third panel (last 6 lines) shows the statistics for the nonendowed and the statistics for the two differ substantially. We now discuss the various types of assets one by one and determine which belong in the pro forma endowment portfolio used to construct Table 3.
Descriptive Statistics for Full Sample and Groups Based on Pro Forma Endowment of Securities and Other Investments
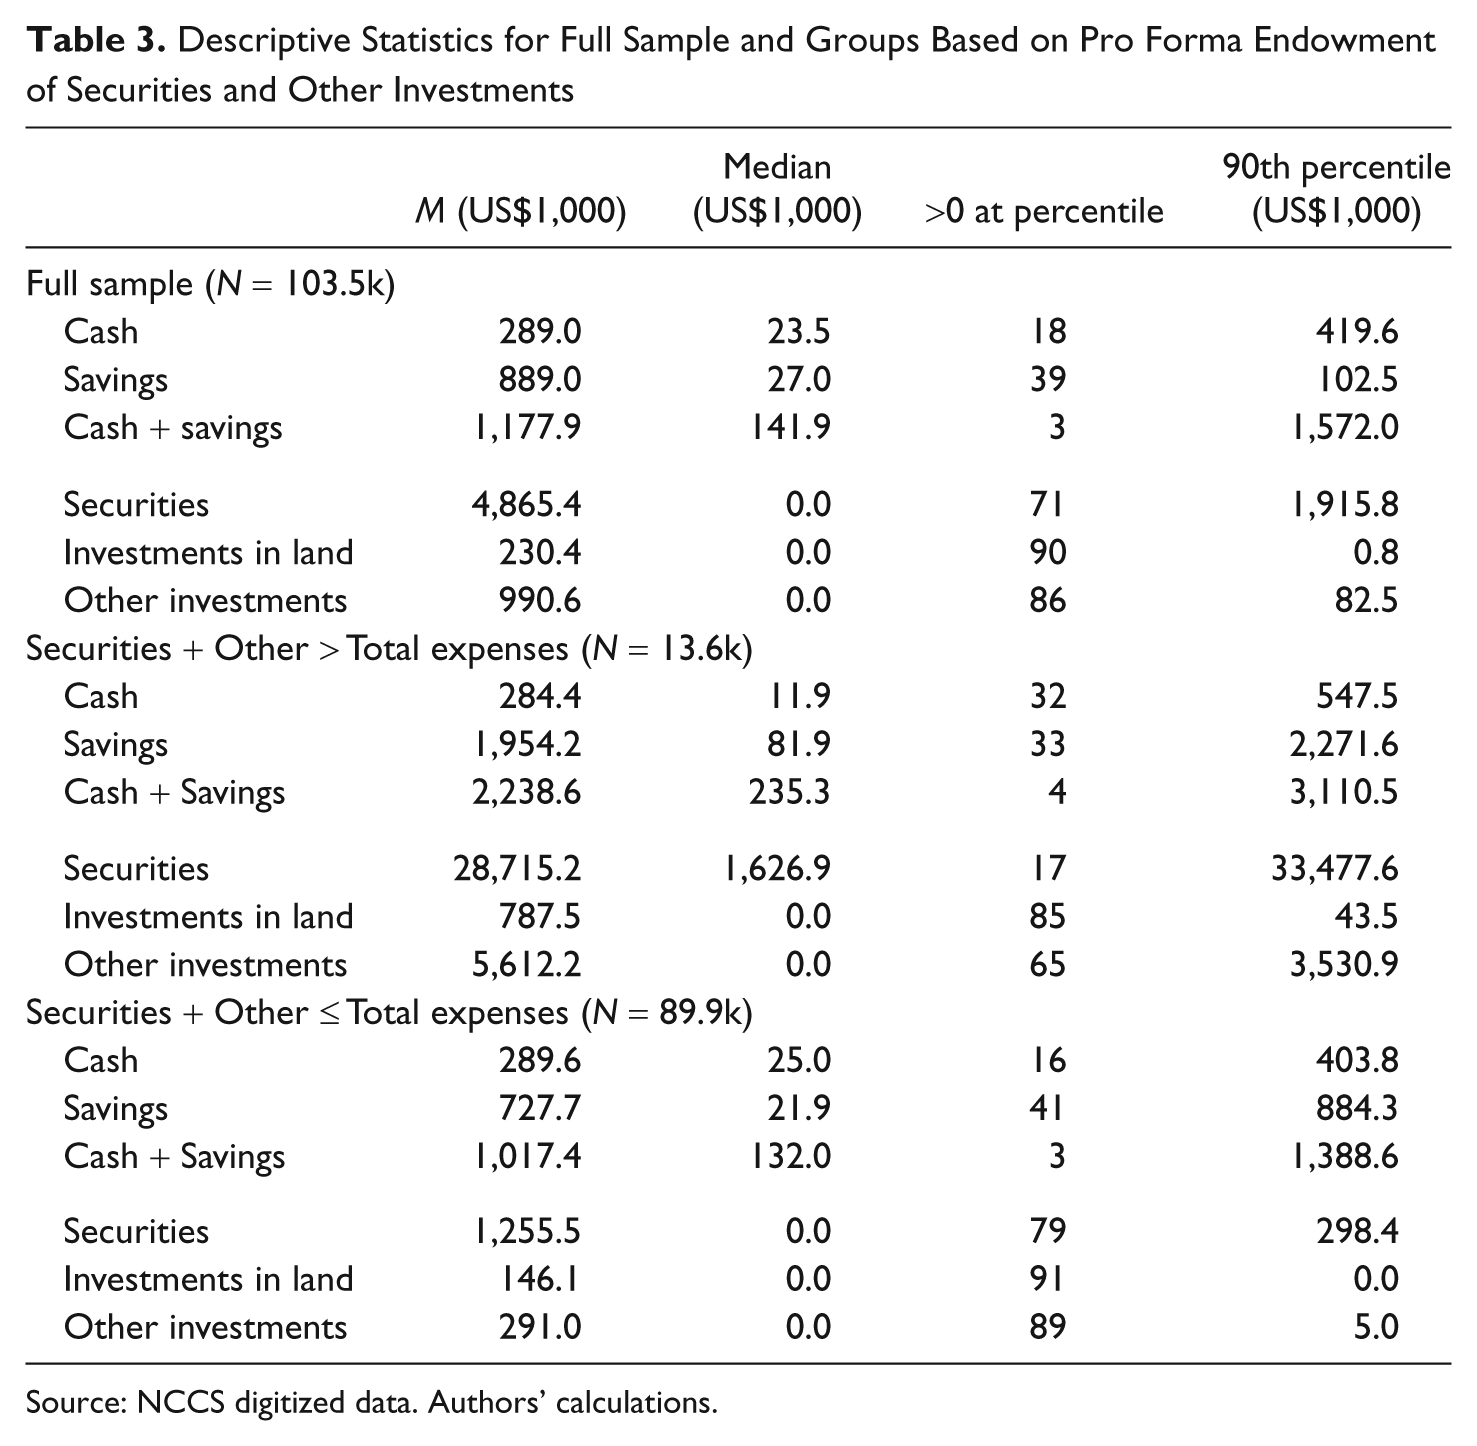
Source: NCCS digitized data. Authors’ calculations.
Securities belong in a pro forma endowment because few endowments are without securities, but we recommend against including either cash or savings which are used mostly to provide the liquidity to fund operations. When fund managers speak of cash they usually mean liquid, short-term interest bearing accounts, classified as savings on IRS Form 990. Fund managers leave little in non-interest-bearing accounts. 11 Savings, which are interest bearing, are used heavily for operating reserves, restricted grant funds, and plant funds. 12 Endowment fund managers usually hold savings when they cannot find enough good investments to absorb a positive cash flow (particularly likely in capital campaigns) or during periods of market turmoil. 13 Hence, cash and savings are mostly assets that are unavailable for endowments, so we exclude them from a pro forma endowment portfolio.
It is not immediately obvious whether investment in land should be included or excluded. Two thirds of nonprofits with investments in land own no securities, suggesting that, for these nonprofits at least, investments in land do not constitute an endowment. Basically, investments in land are any real estate holdings not used for mission purposes. We are unaware of any research on why nonprofits invest in real estate. We speculate that the numbers reflect real estate received as gifts or acquired with an intention to develop it for mission purposes. It is also possible that organizations mistakenly enter the value of their mission-related real estate in the wrong field. Only 10% have any investment in land at all, and the mean amount is only US$203k, compared with US$4.8 million in securities. 14 Therefore, we recommend excluding investment in land from a pro forma endowment portfolio. The new IRS Form 990 that went into effect in 2008 does not have a similar category, so the issue is moot prospectively.
“Other investments” can include a host of vehicles—some that qualify as endowments and others not. Before the asset bubble burst in 2008, the trend was for fund managers to boost returns by replacing traditional stocks and bonds in endowment portfolios with so-called “alternative investments” such as hedge funds and private equity (Commonfund, 2004). Therefore leaving out “other investments” would likely understate the true size of the endowment for nonprofits in this category, particularly for larger nonprofits. Approximately, 10% of the full sample reported owning “other investments” and their mean value is nearly US$1 million—nearly 4 times as much as investments in land and 20% of the value of securities.
In sum, we recommend researchers use a pro forma endowment portfolio consisting of securities and other investments. There are 13,605 nonprofits (approximately 13% of the sample) with securities plus other investments exceeding their total expenses. This group is presumptively endowed according to our definition. An additional 3,111 own smaller amounts of securities. We rewrite the pro forma operating surplus Equation 3a from the previous section (5 Metrics) more precisely as follows:
In the statistical testing that follows, this formulation is denoted as Operating Surplus B and it will be tested against an alternative that consists of securities only, denoted as Operating Surplus A.
Statistical Analysis and Findings
This section discusses computational issues and compares descriptive statistics for the alternative surplus metrics in addition to evaluating alternative pro forma endowment portfolios derivable from data on the IRS Form 990.
Data Cleaning
Researchers using the NCCS files should consider six issues before using them to statistically test their models.
Public charities
501(c)(3) nonprofits constitute 99% of the file. The remainder falls into other tax categories and organizations of unknown type, and we recommend excluding all records for organizations that are not public charities.
Individual returns
It is unwise to mix data from group returns with data from individual returns. Group returns will increase the number of data outliers. Only 0.2% of the records in the NCCS files are known with certainty to be group returns, and more than 30% are of unknown type. We exclude group returns but, to avoid unnecessary decimation of the sample, we classify all records of unknown type as individual returns. To us it is the most plausible default option for filers.
Long forms
The IRS allows small organizations to file a short form (IRS Form 990EZ) which omits select questions. Missing data in the NCCS files are indicated by blank fields. Statistical programs, such as SAS and SPSS, skip missing data and the N associated with calculation counts only populated fields. More than one in five of the nonprofits in the NCCS files report to the IRS on a form other than the long form. To guard against zeros inadvertently being inserted into fields with missing data and skewing the results, we screen out organizations that do not file a long form. If data for a variable are missing, that observation will not be used in a calculation involving that variable.
Accrual accounting
GAAP requires accrual accounting which provides consistent rules for measuring and reporting data. Approximately, half the organizations in the NCCS files do not use accrual, and there are no rules of use for the primary alternative—cash accounting. Unless researchers restrict their studies to organizations using accrual accounting, their data may not be comparable across organizations so we strongly recommend excluding records of organizations not using accrual accounting.
SFAS 117
The FASB promulgates accounting rules through Statements of Financial Accounting Standards (SFAS). In 1993, FASB published two new standards: SFAS 116 (FASB, 1993a) defines donor restrictions as being either permanent or temporary and SFAS 117 (FASB, 1993b) requires a new reporting model that classifies net assets according to the type of donor restriction. Whenever restrictions on gifts, grants, and net assets are important to a research project, researchers should eliminate all records of organizations using the pre-1993 accounting rules.
IRS Form 990 has a check-off box indicating whether an organization follows SFAS 117. To guard against a preparer overlooking it, we suggest adding retained earnings, paid-in or capital surplus, and capital stock (which charities should not have) and excluding organizations reporting a nonzero sum. SFAS 117 does not recognize any of the items being summed, so nonprofits not following SFAS 117 rules will have a nonzero (positive or negative) entry for at least one of these items. One in five organizations has a nonzero sum, which is inconsistent with SFAS 117. It possibly reflects inappropriate use of business-type accounting software.
Active organizations
Researchers are usually interested only in organizations that are functional. Shell organizations that own property without doing something with it are not interesting from a policy perspective so we recommend excluding all records for which total expenses are equal to or less than the sum of depreciation and interest paid. It is difficult to imagine how an organization can function with no assets at all, including cash, but between 2% and 3% of public charities report having none. Therefore, we recommend excluding records for all organizations for which total assets are equal to or less than zero.
Aggregate filter
Applying all of the above filters concurrently, we are left with 40.7% of the total population (an average annual 103K records). We call this the full sample although it is much smaller than the original 254K records. Two filters eliminate roughly half of the records: SFAS 117 and accrual accounting. This is regrettable but it would be misleading to commingle organizations that use different accounting rules. To illustrate with two examples, (a) pledges are not revenue for organizations that use cash accounting but they are revenue under accrual rules and (b) organizations using cash accounting record a capital purchase as an expenditure but organizations using accrual accounting do not recognize it as an expense. No one knows whether accrual users are more likely than cash accounting users to have pledges and capital expenditures, so we must speculate about the likely effect. It seems particularly plausible that these filters disproportionately remove small organizations from the sample.
Table 4, which aggregates all nonprofits without regard to these data filters, is offered to satisfy curious readers. It shows that the 10th percentile for revenue for the filtered sample (30.4) is more than three times the 10th percentile for all public charities (100.0) and the sample median (166.9) is more than five times the median for all public charities (725.6), which tends to support our speculation. However, because accrual users recognize pledges as revenue but cash accounting users do not, the differences are not as large as they seem. Researchers should be wary of mixing cash and accrual accounting users and consider how it might affect their results. The impact will depend on the phenomena under study and the explanatory models being tested. In general, it is preferable to restrict financial analysis to accrual users.
Characteristics of IRS Form 990 Filers

Source: NCCS digitized data. Calculations by authors.
Note: N = 254k. 10th percentile in million dollars, median in thousand dollars.
Statistical Results and Discussion
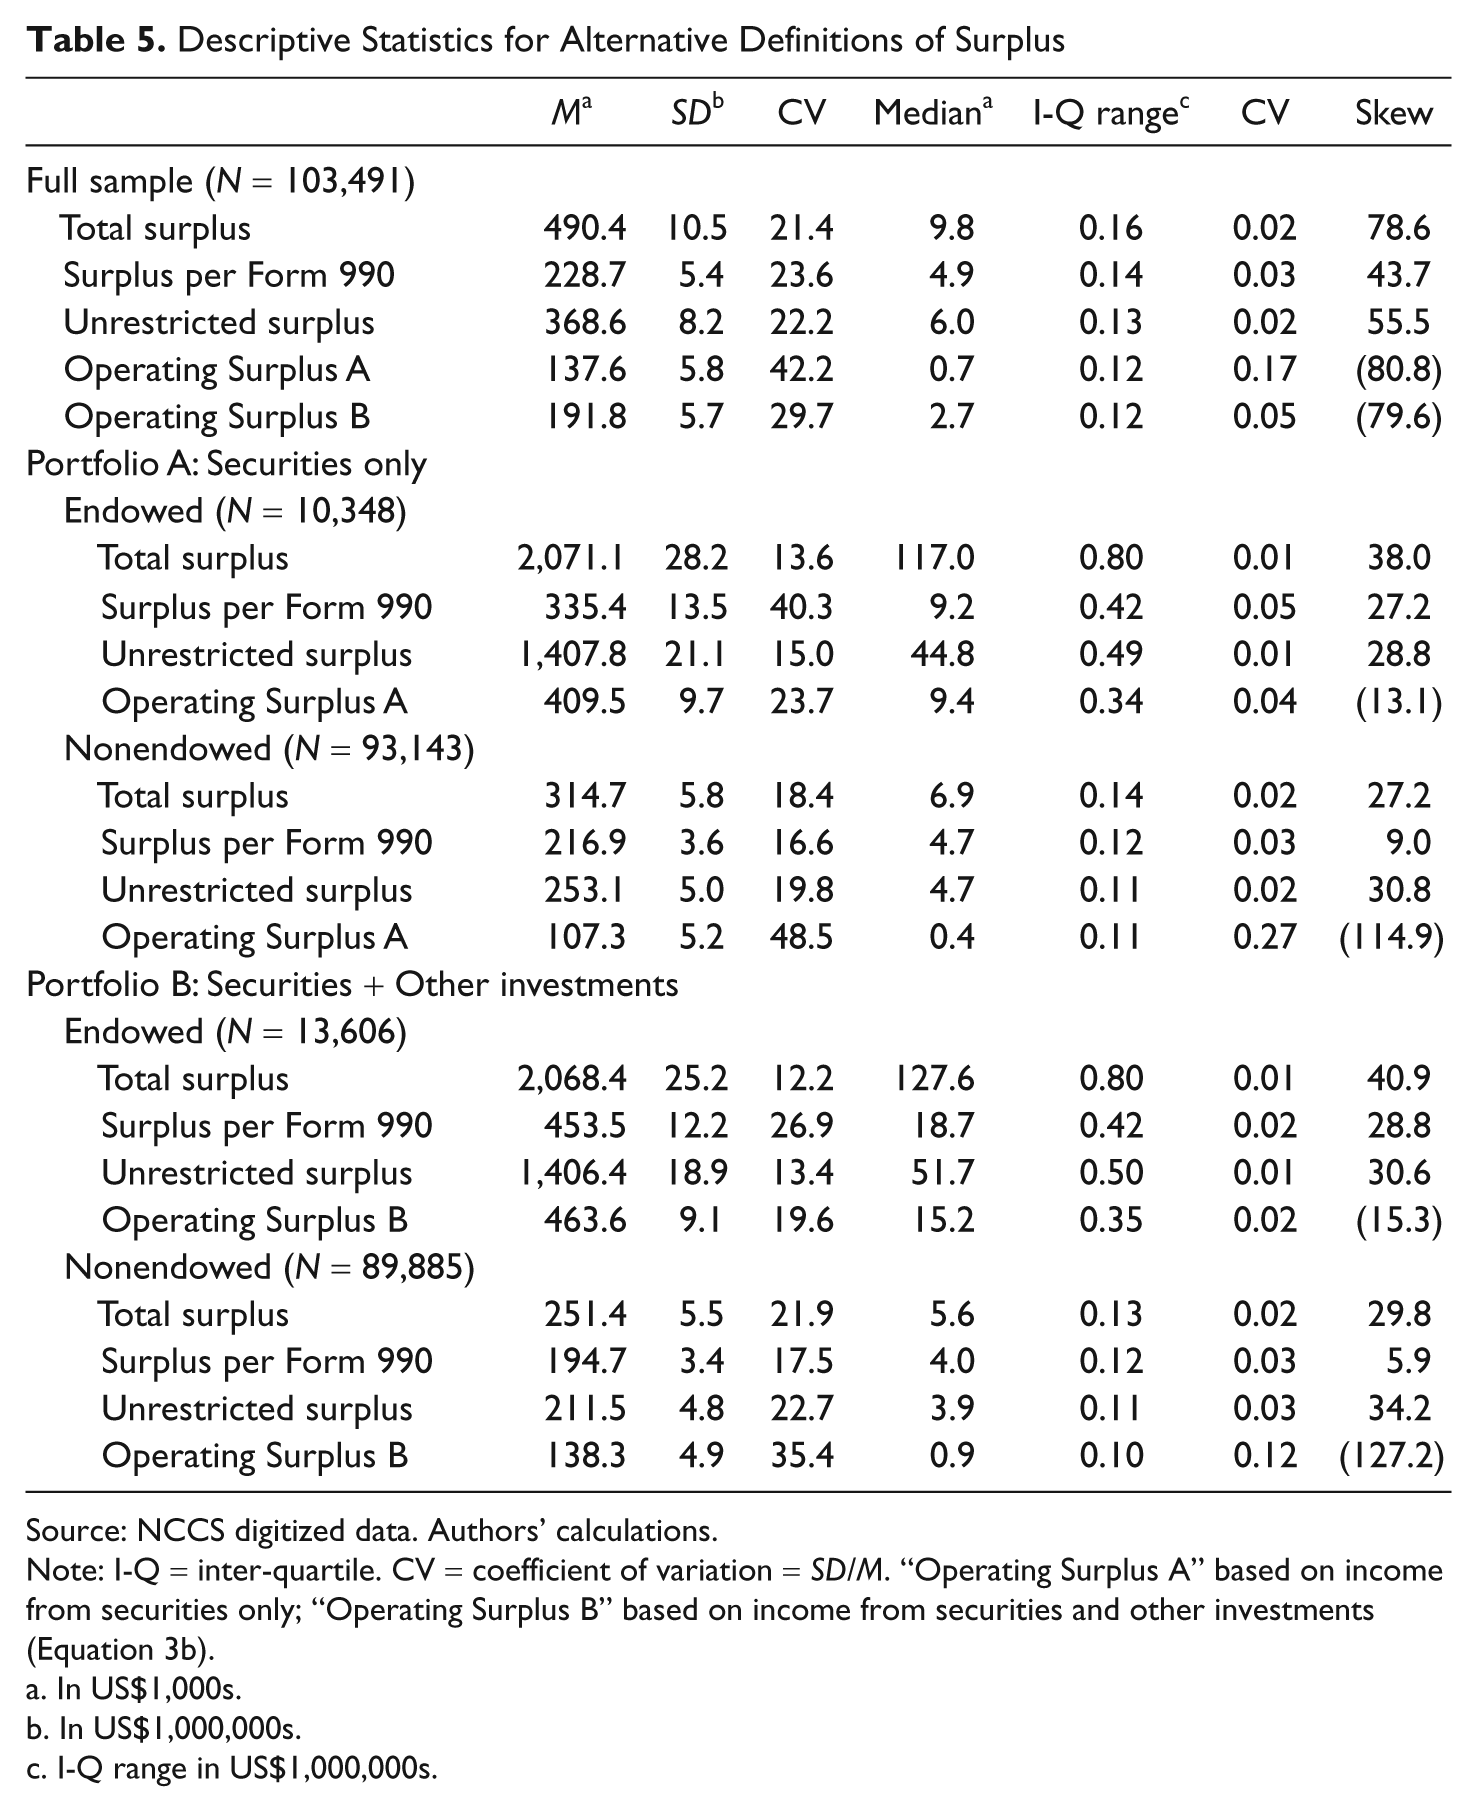
Table 5 summarizes statistics for (a) the full sample, (b) a pro forma portfolio of securities only, and (c) a portfolio that includes securities and other investments. First, we look at the full sample before decomposing it into endowed and nonendowed groups.
Descriptive Statistics for Alternative Definitions of Surplus
Source: NCCS digitized data. Authors’ calculations.
Note: I-Q = inter-quartile. CV = coefficient of variation = SD/M. “Operating Surplus A” based on income from securities only; “Operating Surplus B” based on income from securities and other investments (Equation 3b).
In US$1,000s.
In US$1,000,000s.
I-Q range in US$1,000,000s.
The full sample commingles presumptively endowed and nonendowed organizations. (Hereinafter, we drop the adjective presumptively.) The metrics which include actual investment earnings have the largest means and standard deviations. Both metrics of operating surplus have the lowest means and standard deviations. The pattern for medians and interquartile ranges are similar. Thus, actual investment earnings boost surplus regardless of how we measure investment earnings or surplus. 15
These patterns are not surprising, but it is very interesting that investment earnings inflate both central tendency and variation proportionately, as shown by a roughly constant coefficient of variation (CV). The sole exception is operating surplus A (based on income from securities only) which has a higher CV than any other surplus metric and, in particular, a higher CV than operating surplus B (based on income from securities and other investments). This stand-out difference suggests that the definition of operating surplus A introduces error (iatrogenesis).
When the sample is divided into endowed and nonendowed, the means and standard deviations of total surplus and unrestricted surplus in the endowed group are very substantially greater than the corresponding metrics in the nonendowed group. The pattern is the same with medians and interquartile ranges. Furthermore, by splitting the sample in this way, we reduce the skew of both parts compared with the full sample. All of this suggests that endowed organizations are very different from nonendowed ones—at least in terms of size. We conclude that empirical research on nonprofit finance should distinguish between endowed and nonendowed organizations.
Curiously, surplus per Form 990 is similar for the endowed and nonendowed groups but this fact does not imply that it is a robust metric for statistical work. Actually, it implies the opposite because (a) we know that it is defective conceptually and (b) we observe huge size differences in all other metrics. What we see here is the net effect of excluding unrealized capital gains (and losses) offsetting the inclusion of restricted gifts and grants. Thus, using this metric of surplus in a statistical analysis without controlling for endowment is likely to distort results in unpredictable ways.
In both groups, the distribution of operating surplus is skewed negatively, whereas all other metrics of surplus are skewed positively. The positive skews are likely the result of a small number of organizations experiencing outsized unrealized investment gains. The negative skew of operating surplus is likely caused by a small number of organizations financing budget deficits by using operating reserves instead of programmatic cutbacks.
Conclusions
The analysis presented above is the first systematic attempt to identify the issues involved in the use of large data sets to examine nonprofit surpluses and endowments, providing suggestions for how best to ensure that the data are consistent and useful. The results suggest that total surplus consistently results in a higher mean and median surplus than any of the other measures, and this is quite large when computed for the endowed group. Operating surplus is a reasonable proxy for a pro forma budget surplus of a typical organization, with or without endowment. Unrestricted surplus is easier to calculate, but it is only a reasonable approximation to budget surplus for organizations without investments, which rules out endowed organizations.
Our analysis also shows the important role that endowments play in affecting the surplus measures and presumed health of the nonprofit organizations. Differences between nonprofits with and without endowments open up avenues for new research and analysis. Financial research in the future should take into account the differences in the financial portfolios of the endowed and nonendowed organizations. Researchers now have a systematic set of suggestions and rules enabling them to refine their methodologies both with respect to how surplus and endowments are defined and measured and also the need to contrast nonprofits with endowments and those without. Research making use of these methods is being published concurrently (Bowman, 2011).
Now that IRS systematically collects endowment data, interest in quantitative research in this area will likely flourish and grow. We would like the next revision of IRS Form 990 to include a statement of cash flows, but that may be too burdensome for small nonprofits. However, there are some changes that would primarily affect endowed nonprofits, which usually have professional finance staffs: we would like GAAP (and IRS Form 990) to divide net assets into the following categories: (a) unrestricted net assets, (b) temporarily restricted net assets outside of endowment, (c) quasi-endowment net assets, (d) term endowment net assets, and (e) permanent endowment net assets. Furthermore, we would like capital gifts and grants separated from gifts and grants for operations. Schedule D, part V, of the revised IRS Form 990 should also report nominal spending rate (expressed as a percentage of endowment assets) as well as actual spending.
Footnotes
Acknowledgements
The authors dedicate this article to the memory of their colleague, collaborator, and pioneer in nonprofit finance, Dr. Howard Tuckman, who passed away suddenly during preparation of this manuscript.
Declaration of Conflicting Interests
The author(s) declared no potential conflicts of interest with respect to the research, authorship, and/or publication of this article.
Funding
The author(s) received no financial support for the research, authorship, and/or publication of this article.