




Abstract
The “public support test” is a set of provisions in the Internal Revenue Code determinative of public charity status for 85% of public charities (excluding houses of worship), requiring that at least one third of these nonprofits’ revenue come from the public broadly, government sources, or nonprofit funding intermediaries. Despite its importance in defining much of the nonprofit sector’s boundaries, no previous research describes the extent and sources of charities’ public support or how these vary by nonprofit subsector, size, and age. This article fills this knowledge gap based on analysis of 501(c)(3) public charities’ Form 990 and Form 990EZ data, finding most publicly supported charities greatly exceed the minimum public support requirements, but with wider variation in directness and breadth than “public support” might connote.
“Public support test” refers to a set of provisions in the Internal Revenue Code that are determinative of public charity status for nearly 300,000 501(c)(3) nonprofit organizations—85% of all public charities (excluding houses of worship). The public support test requires that at least one third of these nonprofits’ revenue come from the public broadly, government sources, or nonprofit funding intermediaries. Despite its importance in defining the nonprofit sector’s composition, no previous research describes the amount of public charities’ public support or the extent to which nonprofits’ public support is derived from broad public support or routed through funding intermediaries. Based on Form 990 and 990EZ data merged from six large Internal Revenue Service (IRS) data sets, this study addresses this gap in our fundamental knowledge of the scope of the nonprofit sector and how its boundaries are defined by public policy.
The 15% of public charities exempt from the public support test merit their 501(c)(3) public charity status (that is, not private foundation status) because their institutional types—mainly houses of worship, educational institutions, hospitals, and support organizations—are specified in the IRS code. These specified organizational types comprise the “per se” public charities. The remaining 85%, however, must meet the public support test by garnering at least one third of their financial support from the public broadly, rather than from a small number of supporters. The tax code describes two versions of the public support test: One test, described in Internal Revenue Code section 170, is for organizations that receive most of their public support in the form of charitable contributions. These organizations are referred to as “donative” nonprofits (Hansmann, 1980). Section 509 provides a second test for organizations that receive most of their public support in the form of fees for services related to their tax-exempt purpose, making them “commercial” (Hansmann, 1980) or “service provider” (Hopkins, 2011) nonprofits. Common among these commercial nonprofits are thrift stores, zoos, museums, and hospices, for example. Both tests require that nonprofits receive at least one third of their support from the public broadly, with limits on how much financial support from any one individual or corporation can count toward the public support requirement, and both tests include government grants and contributions from other 501(c)(3) nonprofits as public support without limit.
In practice, the public support test is calculated and self-reported by nonprofit administrators (or their accountants) when filing the annual Form 990 or 990EZ and the accompanying Schedule A with the IRS. In Schedule A Part I, the nonprofit filing as a public charity identifies itself as either one of the various types of per se organizations, a publicly supported organization qualifying under Internal Revenue Code section 170 (a donative organization), or a publicly supported organization qualifying under section 590 (a commercial organization). Those seeking to qualify as donative or commercial nonprofits are directed to complete either Part II or Part III of Schedule A, respectively, where the filer follows step-by-step instructions to compute the public support percentage. If this percentage is equal to or above 331/3%, the organization qualifies as a public charity. Generally, if the percentage is less than 331/3% for two consecutive years, the organization does not qualify as a public charity and must instead file as a private foundation and thus would be subject to much more stringent regulation. Figure 1 summarizes calculation of the two versions of the public support test.
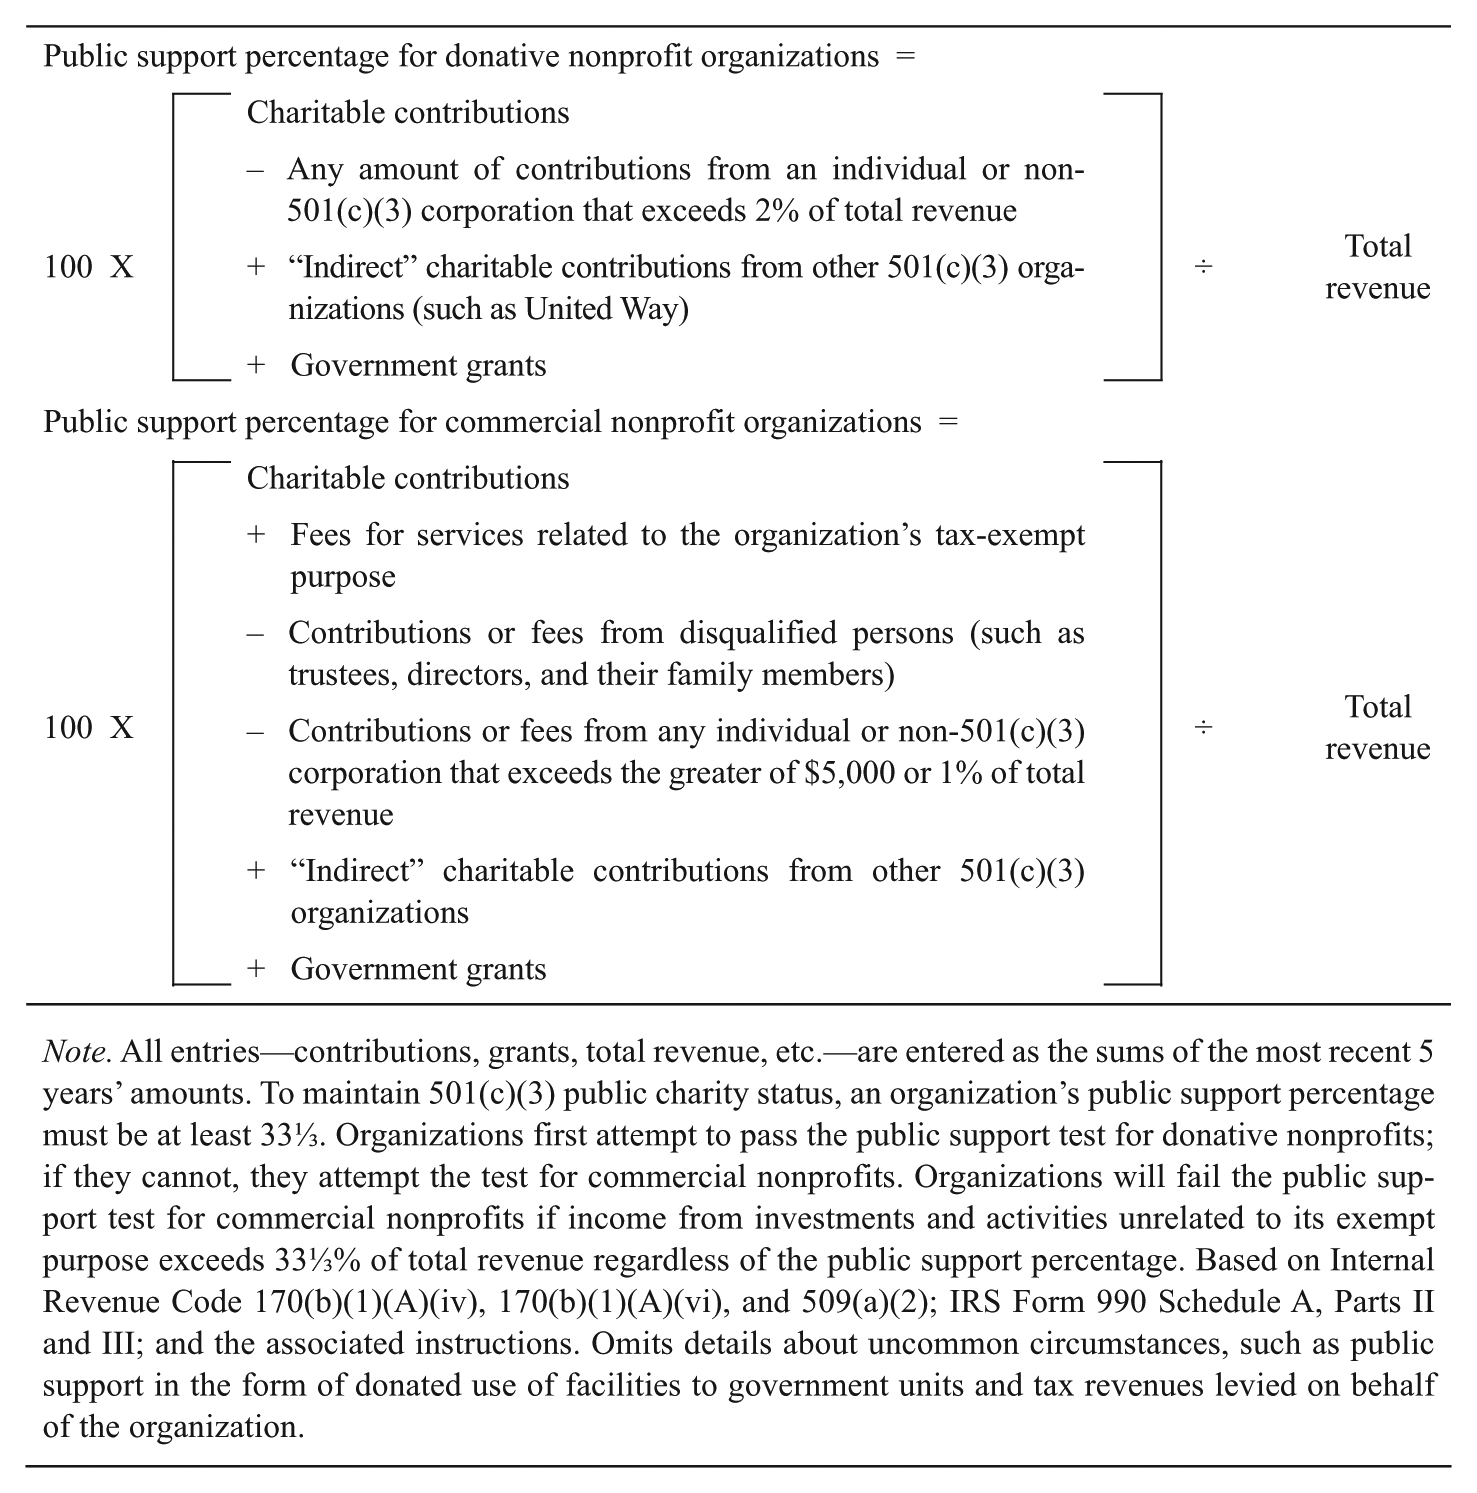
Calculation of the public support tests for donative and commercial 501(c)(3) public charities.
Why does public policy provide this path to charitable nonprofit status? Lacking direct evidence from the legislative history (Hall & Colombo, 1991b), we may infer a rationale for the public support test with three interrelated points: (1) By requiring broad public support, the public support test provides some assurance that a sizable segment of the public believes the organization serves a legitimate charitable purpose. In this sense, the public support test democratizes determination of which organizations’ purposes “count” as charitable and which do not. This democratizing conception of the public support test extends a thread of Hall and Colombo’s (1991a, 1991b) donative theory, which, in building a rationale for charities’ tax exemption, suggests a “market-like process that relies on the self-interest of donors to choose for themselves the objects of charity that deserve public support,” as opposed to “normative judgments of which activities deserve the exemption” (Hall & Colombo, 1991b, p. 1388). The public support test provides just such a process. Rather than attempting a strict definition of “charitable,” the public support test essentially crowdsources operationalization of this necessarily shifting (Fremont-Smith, 2004) construct. (2) The public support test serves to scale the nonprofit’s size relative to its public support. A nonprofit cannot maintain its public charity status if it grows only due to the support of a few donors; its broad public support must grow proportionately to its total support. (3) The public support test promotes accountability for the public charity, ensuring many eyes have an interest in watching to make sure it is serving a broad charitable purpose.
The analysis presented here first provides a description of nonprofits’ reporting related to the public support test and then explores the implications of its three-part rationale: How many public charities meet the public support requirement as donative nonprofits, and how many meet the requirement as commercial nonprofits? To what extent are donative and commercial nonprofits publicly supported? How much public support comes directly from a broad set of donors, and how much passes through government and nonprofit intermediaries? How do answers to these questions vary for nonprofits based on subsector, size, and age?
Data and Findings
The following analysis is based on a data set compiled from six separate IRS data files with data from tax year 2012: one sample of Form 990 returns, one sample of Form 990EZ returns, two population-level Form 990 data sets, and two population-level Form 990EZ data sets. These data files were used to construct one data set containing Forms 990 and 990EZ data for a representative sample of 14,391 active 501(c)(3) public charities (excluding houses of worship, denominations, and organizations with gross receipts of less than $50,000, who may file Form 990N) for tax year 2012, stratified and weighted by organizational size categories based on total assets. A detailed description of the data set construction is presented in Appendix A.
The key variables of interest are public support percentage for donative public charities, public support percentage for commercial public charities, and the decomposition of donative public charities’ public support percentage into its sources: broad public support, government grants, and contributions given indirectly through federated campaigns, such as from United Way. These key variables are compared in terms of organization age (determined by year of incorporation), organization type (as defined by National Taxonomy of Exempt Entities [NTEE] major codes), and organization size (using total assets as the indicator; the results below were repeated with total revenue as the indicator of organization size with very similar results).
How Many Public Charities are Donative, Commercial, and Per Se?
Percentages of donative, commercial, and per se public charities are presented in Figure 2. Of all 501(c)(3) public charities (excluding houses of worship and Form 990N filers), 40% are donative nonprofits, 45% are commercial nonprofits, and 15% are per se nonprofits. Some form of the public support test, then, determines the public charity status for 85% of public charities. Excluding the per se nonprofits, 47% of all publicly supported charities are donative nonprofits, and 53% are commercial nonprofits. Put another way, for every nine donative nonprofits, there are 10 commercial nonprofits.
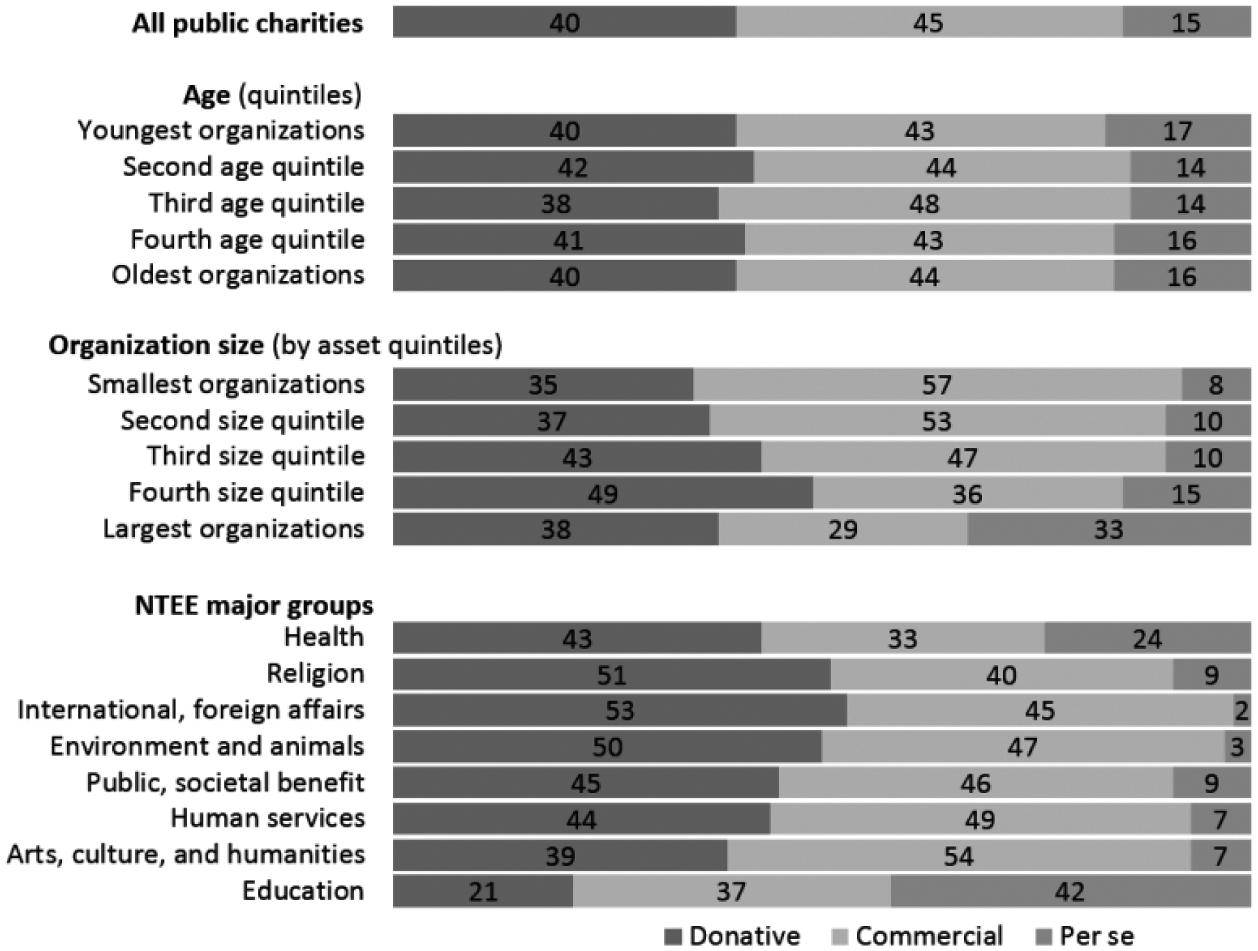
Percentages of donative, commercial, and per se public charities of all public charities and by age, organization size, and NTEE major groups (and percentage of all publicly supported charities that are donative nonprofits).
The percentages of donative, commercial, and per se organizations are consistent regardless of the age of organizations but vary substantially across organizations of different sizes and across NTEE groups. Charities near median size include roughly equal proportions of donative and commercial nonprofits, with smaller charities including more commercial nonprofits, and larger charities including more donative. The proportion of donative nonprofits climbs from 35% for the smallest nonprofits to 49% for organizations in the second largest quintile. In the largest quintile, which is dominated by universities and hospitals, the percentage of per se organizations more than doubles over the percentage in the fourth quintile organizations from 15% to 33%. Among the NTEE groups, education nonprofits have the lowest ratio of donative-to-commercial nonprofits, with donative education nonprofits making up 36% of the publicly supported education nonprofits. Education nonprofits are also dominated by per se organizations, the schools that make up 42% of all education-related charities. In general, though, public charities grouped by age, size, and NTEE category tend to have roughly equal proportions of donative and commercial nonprofits, as does the population of public charities as a whole.
To What Extent Are Commercial and Donative Nonprofits Publicly Supported?
Commercial nonprofits are required to have a public support percentage greater than or equal to 331/3%, and the sum of revenue from investments and unrelated business activities may not exceed 331/3%. The large majority of commercial nonprofits greatly exceed the minimum requirements of this public support test (Figure 3). The mean percentage of revenue from public support for all commercial nonprofits is 93%, and the median is 98%. Ninety-two percent of all commercial nonprofits report receiving more than three fourths of their revenue from public support. Public support percentages are uniformly high across commercial nonprofits of different ages, sizes, and NTEE groups.
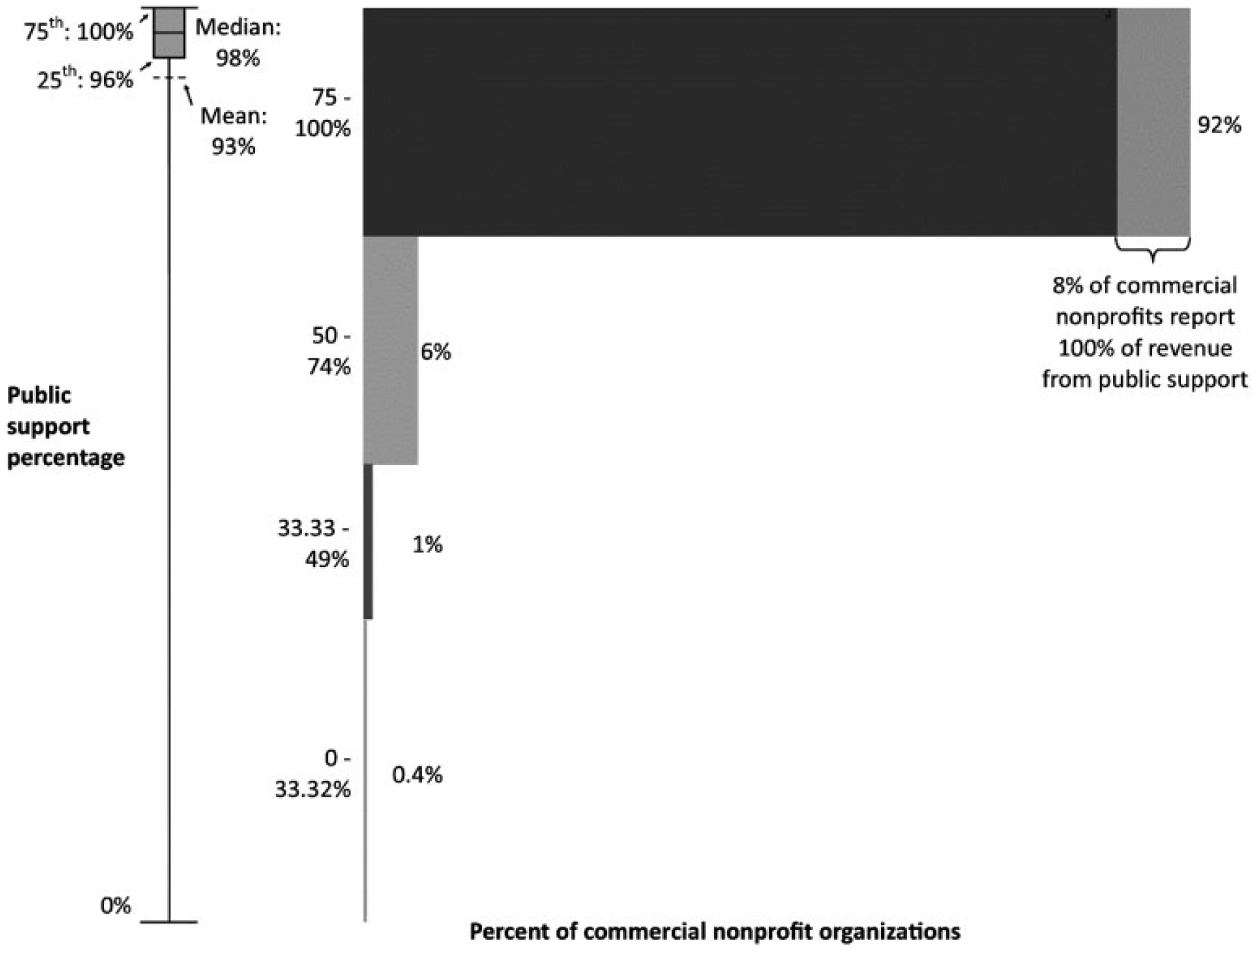
Distribution of public support percentage reported by all commercial nonprofit organizations.
Donative nonprofits meet the public support test by receiving at least 33.33% of their revenue from the general public directly or indirectly through government grants or contributions from federated campaigns, such as United Way. Donative nonprofits’ public support percentages vary somewhat more than commercial nonprofits,’ but are still quite high. As summarized in Figure 4, the mean public support percentage for all donative nonprofits is 85%, and the median is 96%. Seventy-seven percent of all donative nonprofits receive at least three fourths of their revenue from public support, and of those, 16% report receiving all revenue from public support.
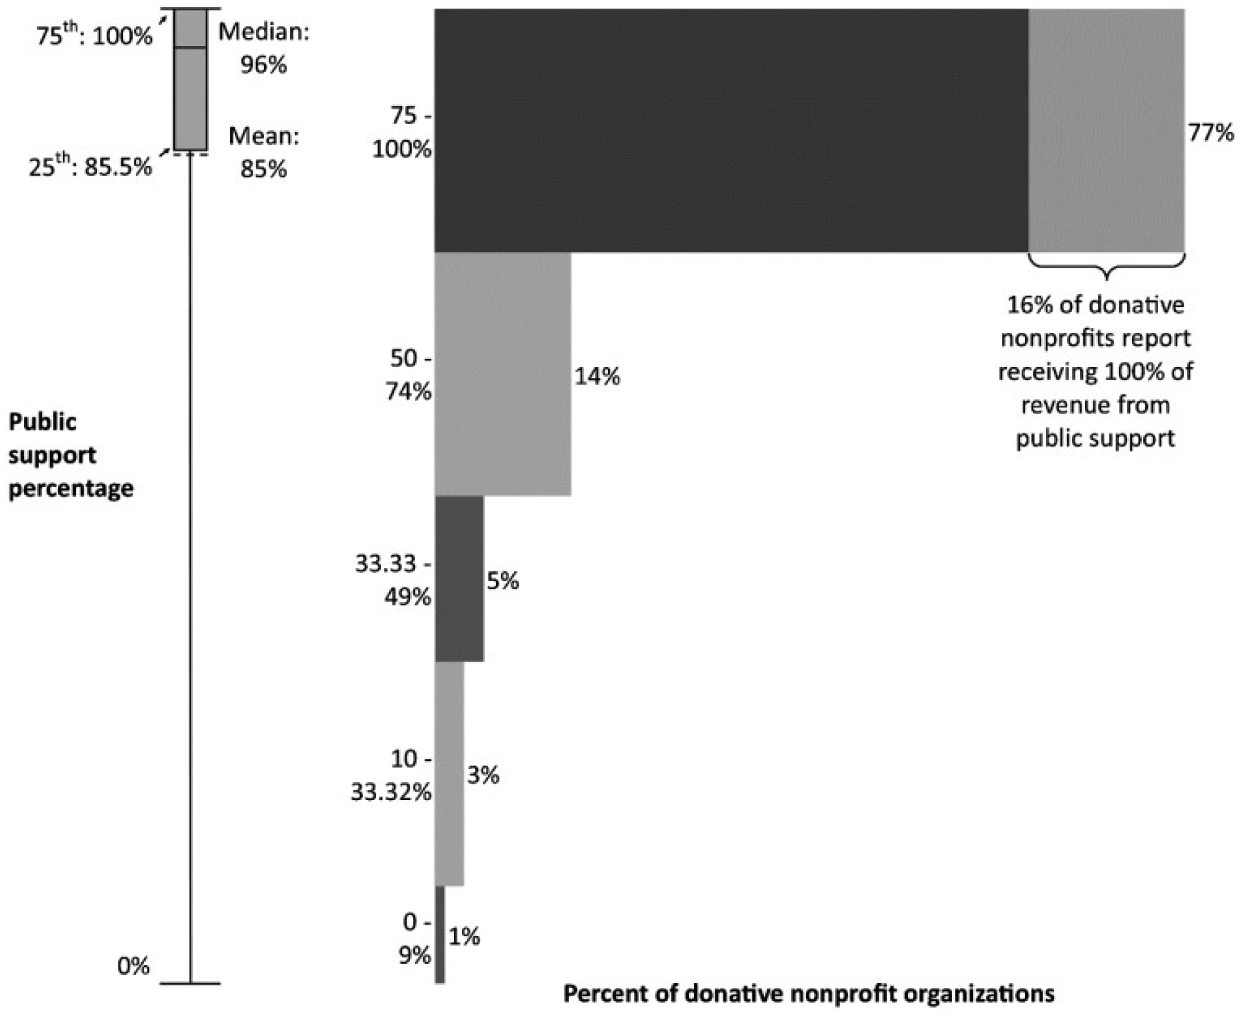
Distribution of public support percentage reported by all donative nonprofit organizations.
The rightmost numbers in Figure 5 depict the variation in median public support percentages across organizations of different ages, sizes, and NTEE categories. Public support is uniformly high across organizations of different ages. While high across the organization size quintiles, median public support percentage decreases as organization size increases, with nonprofits in the quintile of smallest organizations having a median public support percentage of 100%, decreasing to 91% for organizations in the quintile of largest organizations. Similar variation is seen across NTEE categories, with median public support percentages ranging from 98% for human services organizations to (a still quite high) 89% for arts/culture/humanities organizations.
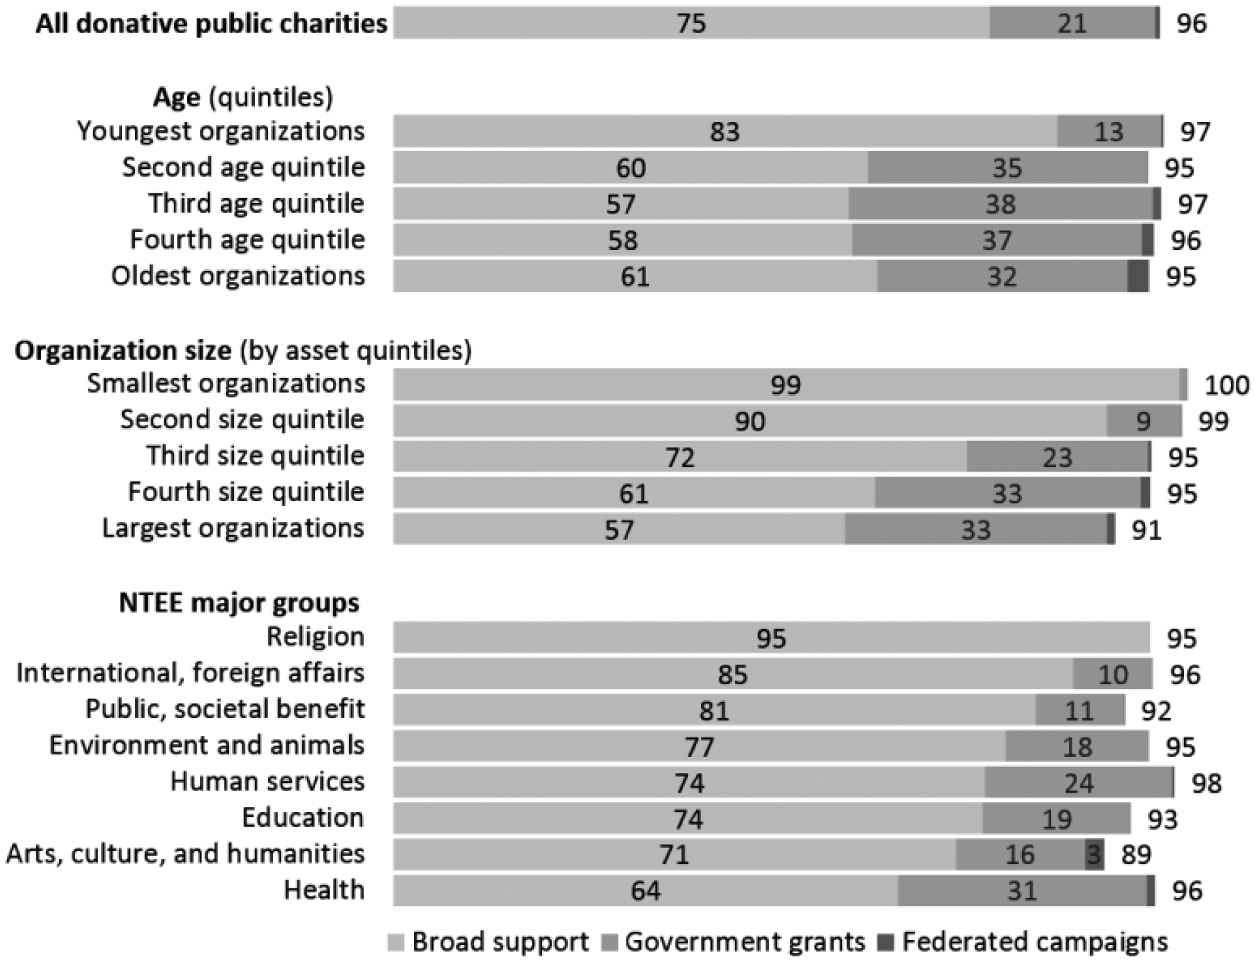
Median public support percentages from all sources, broad public support, government grants, and federated campaigns, for all donative public charities and by age, organization size, and NTEE major groups.
How Much of Donative Nonprofits’ Public Support Comes Directly From a Broad Set of Relatively Small Supporters, and How Much Passes Through Government and Nonprofit Intermediaries?
Donative nonprofits’ public support comes to the organizations either directly from individual and corporate donors or indirectly through federated campaigns and government grants. As presented in Figure 5, broad public support is the largest type of public support for all donative nonprofits and across donative nonprofits of different ages, sizes, and NTEE groups. For the set of donative nonprofits as a whole, a median 75% of total revenue comes from broad public support, 21% comes from government grants, and 0.5% comes from federated campaigns.
While uniformly the largest portion of public support, broad public support does vary substantially across organizations of different sizes and ages (p < .001; see Appendix B). Donative nonprofits in the quintile of youngest organizations receive the largest proportions—a median 83%—of their public support in the form of broad public support, with about 60% of revenue coming from broad public support in the remaining quintiles. There is a clearer inverse relationship between scope of broad public support and organization size. The smallest organizations tend to acquire nearly all—a median of 99%—of their revenue from broad public support. As organization size increases, reliance on broad public support decreases: The largest organizations receive a median 57% of revenue from broad public support, with nearly all of their remaining public support in the form of government grants, which accounts for a median 33% of total revenue.
Religion-related donative nonprofits (excluding, recall, houses of worship and denominations) receive the highest proportion of revenue—a median 95%—from broad public support of all the NTEE major groups. All of the NTEE groups receive most of their public support in the form of broad public support, with health-related donative nonprofits (excluding, recall, hospitals) having the lowest proportion of broad public support at the still-high median of 64% of total revenue. Government grants account for the largest proportions of public support among health-related donative nonprofits (median, 31% of total revenue) and human services donative nonprofits (24%).
While government grants and federated campaigns play a small role relative to broad public support in donative nonprofits meeting the public support test, a thought experiment demonstrates the importance of counting such revenue as broad public support: If government grants and federated campaign revenue were suddenly not counted toward the public support test, 23% of current donative nonprofit organizations would not automatically qualify to be public charities instead of private foundations (Figure 6). Without the indirect sources counted, 12% of donative nonprofits’ public support would fall to the 10% to 33.32% range, leaving the uncertain option of meeting the IRS’s “facts and circumstances” test, which can qualify 501(c)(3) organizations as public charities based on more subjective criteria, including their capacity for attracting broad public support, community representation on their boards, and public-serving activities, on a case-by-case basis. In reality, only 3% of donative nonprofits (Figure 4) rely on this risky provision. An additional 12% of donative nonprofits would fall below the 10% public support threshold and not qualify for public charity status at all. Most affected would be the largest donative nonprofits (33% of organizations in the quintile of largest organizations would be in jeopardy of losing public charity status), health-related donative nonprofits (35%), and human services donative nonprofits (26%).
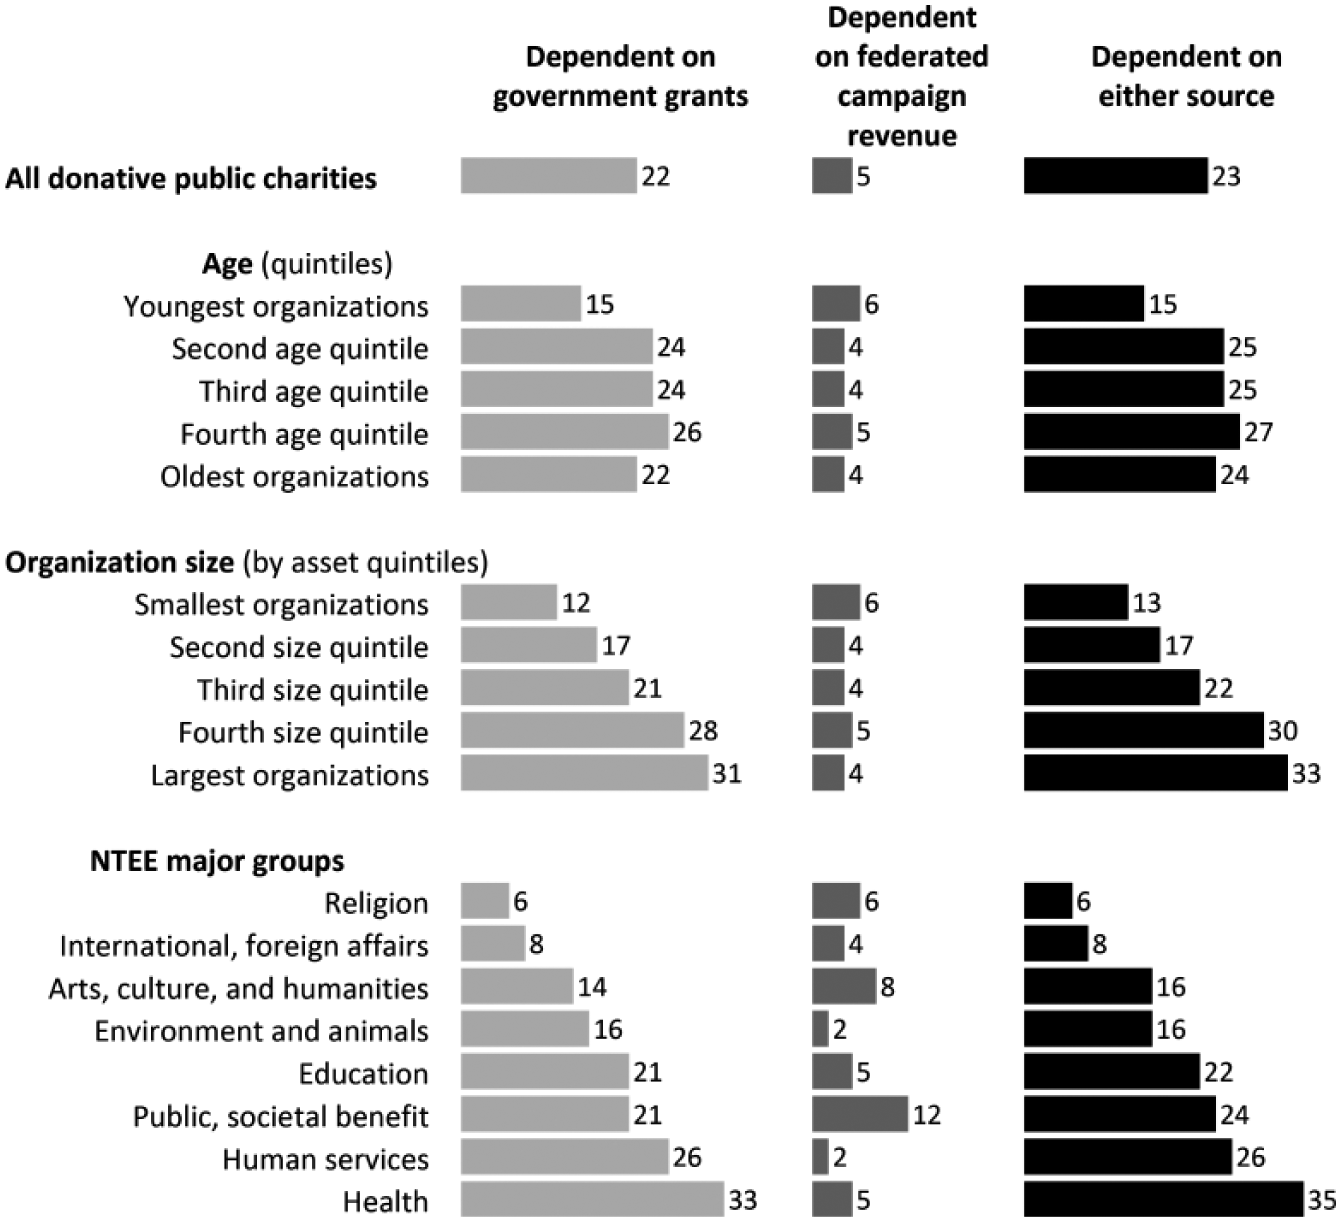
Percentage of donative public charities dependent on government grants and federated campaign revenue for public charity status, by all donative public charities, age, organizational size, and NTEE major groups.
Discussion and Conclusion
The findings reveal that the public support test does, indeed, achieve a democratized determination of public charity status for a large part of the nonprofit sector, but with wider variation in the role of charity than “public support” of “public charities” might connote. About one half of publicly supported charities rely not on charitable support, but on earned income, to maintain their legal status. For some, this may be a mark of a nonprofit sector that is increasingly “marketized” with a concomitant “potential deterioration of the distinctive contributions nonprofit organizations make to creating and maintaining a strong civil society” (Eikenberry & Kluver, 2004, p. 138). For these nonprofits, any democratization of public charity status determination relies on a public choice conception of democracy in which citizens-as-consumers settle the question of which organizations prosper or fade.
The other half of publicly supported charities, in contrast, appears to be a reservoir of the Tocquevillian, perhaps overly romanticized (Carson, 2002), nonprofit sector of the popular mind—a nonprofit sector primarily reliant on the broad support of likeminded charitable donors. A populist democratic impulse drives public charity status for 77% of these donative nonprofit organizations, with small donors’ collective definitions of “charity” exerting the strongest collective influence on the boundaries of the sector. For the remaining 23% of donative nonprofits, the individual preferences that determine public charity status are filtered through government action, reflecting a product of either a classic liberal conception of representative democracy or (more cynically) a process subject to the undue influence of the preferences of powerful elites.
The descriptive findings presented here constitute a large improvement over the current state of knowledge of the public support test; a search of major research databases (EBSCO, ProQuest, JSTOR, Academic OneFile, Web of Science) using the term public support test and related terms located zero journal articles reporting any empirical research on the topic and only a few articles that mention it in passing. The findings also provide a reference for future research about the public support test that would require additional data and different methodologies. Longitudinal data could helpfully extend the descriptive findings presented here to determine the extent to which public support determination has shifted away from the donative model toward the commercial model, whether the shift continuing, and whether the public support test favors some types of nonprofits while preventing others from emerging. Interviews with nonprofit leaders and key stakeholders may illuminate how—if at all—the public support test influences their decision making and whether it effectively promotes accountability. Forensic auditing may investigate whether nonprofits manipulate financial reporting to meet the public support test, as has apparently occurred with fundraising expense reporting (Krishnan, Yetman, & Yetman, 2006), particularly in light of IRS Form 990 audit rates of less than 1% (U.S. Government Accountability Office [USGAO], 2014). And simulation modeling could help explore whether applying a similar public support test to 501(c)(4) nonprofits (Hill, 2001) might curb potential political abuses of that legal form. It is hoped that this study will attract interest in refining and pursuing a research agenda to continue to improve our understanding of the role—democratizing and otherwise—of the underexamined public support test.
Footnotes
Appendix A
Appendix B
Declaration of Conflicting Interests
The author(s) declared no potential conflicts of interest with respect to the research, authorship, and/or publication of this article.
Funding
The author(s) received no financial support for the research, authorship, and/or publication of this article.