



Abstract
Nonprofit leaders and managers are recognizing the benefits of creating inclusive organizations in which everyone feels valued and appreciated, yet little is known about how leaders can foster workplace inclusion. This study examined the relationships among leader engagement, inclusion, innovation, job satisfaction, and perceived quality of care in a diverse nonprofit health care organization. Data were collected at three points in 6-month intervals from a U.S. nonprofit hospital. Multilevel path analysis indicated significant direct associations between leader engagement, inclusion, and innovation. Innovation was directly linked to improved job satisfaction and perceived quality of care. Significant indirect effects were found from leader engagement to increased job satisfaction and perceived quality of care through increased climates for inclusion and innovation. Findings suggest that nonprofit leaders who engage others in critical organizational processes can help foster an inclusive climate that leads to increased innovation, employee job satisfaction, and perceived quality of care.
Given the high turnover rates, low performance, and leadership deficits in the nonprofit sector (Lee, 2016), it takes a unique skill set for nonprofit leaders to effectively manage and sustain nonprofit organizations (Allen, Winston, Tatone, & Crowson, 2018; Nascimento, Porto, & Kwantes, 2018). Organizational turnover negatively affects nonprofit performance; therefore, finding ways to reduce turnover by increasing employee job satisfaction is a critical management task (Lee, 2016). One way to increase retention and improve performance is through creating positive work environments (Brimhall, Lizano, & Mor Barak, 2014; Glisson et al., 2008; Y. H. Huang et al., 2016). Although research in this area is limited, nonprofit leaders who create positive and inclusive work environments in which employees feel supported by the organization foster beneficial outcomes (e.g., increased employee job satisfaction; Knapp, Smith, & Sprinkle, 2017).
When nonprofit organization members believe they are valued for their unique personal characteristics and recognized as important members of the organization (i.e., an inclusive climate; Shore et al., 2011), employee engagement, trust, satisfaction, commitment, and retention improve (Brimhall et al., 2014; Shore et al., 2011). Yet despite the positive outcomes of creating an inclusive workplace and theoretical propositions of how leaders may engender inclusion (Boekhorst, 2014; Randel et al., 2018), little empirical work has been done to better understand exactly how nonprofit leaders can foster an inclusive organizational climate. Thus, the current study examined how leader engagement, that is, a leader’s ability to actively engage all organizational members in critical decision making (Nembhard & Edmondson, 2006), may foster a climate for inclusion and positive organizational outcomes, such as a climate for innovation, job satisfaction, and perceived quality of care, in a diverse nonprofit hospital.
Theoretical Background and Hypotheses
Shared employee perceptions of the work environment (i.e., organizational climate; Reichers & Schneider, 1990) influence how individuals relate to and connect with one another, and ultimately how well the organization functions (Glisson et al., 2008; Reichers & Schneider, 1990). Evidence suggests that positive organizational climates are key factors for improving nonprofit employee job satisfaction (Brimhall et al., 2014; Glisson et al., 2008; Y. H. Huang et al., 2016), attitudes and behaviors about their work (Brimhall et al., 2016; Hwang & Hopkins, 2012), and retention (Beidas et al., 2016; Glisson et al., 2008). More recently, scholars have examined the effects of inclusion as a particular climate that may be valuable for improving the functioning of diverse nonprofit organizational groups (Mor Barak et al., 2016).
Climate for Inclusion
Optimal distinctiveness theory (Brewer, 1991) can be used to help explain why inclusion may be particularly important for the functioning of diverse nonprofit organizations. According to optimal distinctiveness theory, individuals want to be recognized for their unique personal attributes (Shore et al., 2011) and that these personal characteristics are regarded as positive differences among the group. In addition, individuals want a sense of commonality and similarity among group members (i.e., a sense of belonging; Brewer, 1991). People aim for a balance between feelings of belonging among group members and recognition of their unique talents and attributes they bring to the organization (i.e., a sense of uniqueness; Brewer, 1991). When group members perceive that they are valued for who they are (uniqueness) and that they are important members of the organization who share some commonality with other members (belonging), trust and acceptance of one another is increased (Shore et al., 2011). When acceptance increases, so do feelings of inclusion (Brimhall et al., 2017).
Although the literature on climate for inclusion is relatively new (Shore et al., 2011), it is becoming an area of interest across the globe (Shore, Cleveland, & Sanchez, 2018). A recent review of the inclusion literature found 17 quantitative empirical studies outside of the United States and 28 US-based studies demonstrating the value of inclusion in producing positive workplace outcomes in both for-profit and nonprofit organizations. One study by Hwang and Hopkins (2012) found workplace inclusion to be a key factor for increasing employee commitment and retention in 23 different countries. An inclusive climate has been associated with improved self-esteem (Vakalahi, 2012), increased job satisfaction (Acquavita, Pittman, Gibbons, & Castellanos-Brown, 2009), commitment (Cho & Mor Barak, 2008), and retention (Buttner, Lowe, & Billings-Harris, 2012). When organizational members feel included, there is improvement in staff attitudes (e.g., job satisfaction; Brimhall et al., 2014) and subsequent work outcomes (Mor Barak et al., 2016). In essence, perceptions of inclusion have been directly associated with favorable nonprofit employee attitudes, such as increased job satisfaction (Bortree & Waters, 2008), and these favorable attitudes have been associated with improved organizational outcomes, such as enhanced performance (Mitchell et al., 2015) and quality improvement efforts (Carmeli, Reiter-Palmon, & Ziv, 2010).
Inclusion may also encourage innovation. Employees’ shared perceptions of the work environment in terms of encouraging organizational members to share and generate new ideas with one another are critical to fostering a climate for innovation (Anderson & West, 1998). Based on the learning organization perspective, workplaces with learning climates encourage organizational members to share ideas with one another, welcome individuality, and ensure that mistakes are not penalized and instead viewed as learning opportunities (Gardiner & Whiting, 1997). Learning organizations are characterized as positive and supportive work environments that promote increased employee trust and empowerment that lead to increased job satisfaction and idea sharing among employees (Dekoulou & Trivellas, 2015; Pantouvakis & Mpogiatzidis, 2013). Perceptions of inclusion have been linked to increased trust among organizational members (Downey, Werff, Thomas, & Plaut, 2015), which in turn has been linked to an increased willingness of organizational members to share and collaborate on new ideas, a critical component of innovation (H. S. Lee & Hong, 2014; Sankowska, 2013).
Innovation in nonprofit health care organizations is critical to improving quality of care because it fosters the development of new ideas relevant to patient care (e.g., new methods or solutions to problems, diagnostic testing, and organizational procedures or processes) that can lead to improved quality of services (Duarte, Goodson, & Dougherty, 2014; Page, 2014). When employees feel valued and appreciated for who they are and that they are important members of the organization (a climate for inclusion; Mor Barak et al., 2016), they may be more willing to speak up and share ideas with one another (a climate for innovation; Anderson & West, 1998). That may ultimately improve how they feel about their jobs (i.e., job satisfaction) and the quality of care offered to clients. When employees are encouraged to share ideas with one another, this increases employee job satisfaction and engagement (Dekoulou & Trivellas, 2015; Pantouvakis & Mpogiatzidis, 2013), both of which are essential elements in improving quality of services (Page, 2014). When climate for inclusion and innovation work together, this may be an ideal combination for improving employee job satisfaction and quality of care.
Leader Engagement
A vast amount of research has demonstrated the connection between leadership and innovation and improved quality and effectiveness of human services (Apekey, McSorely, Tilling, & Siriwardena, 2011; Cazzaniga & Fischer, 2015; Duarte et al., 2014; Kajamaa, 2015; Labitzke, 2015); however, more research is needed to explore how nonprofit leadership can increase innovation and ultimately improve quality of care (Apekey et al., 2011; Cazzaniga & Fischer, 2015; Dixon-Woods, McNicol, & Martin, 2012; Kajamaa, 2015; Labitzke, 2015). More specifically, a leader’s ability to actively engage all members of the organization in decision making may be crucial to fostering an inclusive environment that leads to increased innovation, which may then improve job satisfaction and the quality and effectiveness of nonprofit services. The motivational model of participative leadership argues that when employees are given opportunities to participate in decision making, this fosters higher levels of psychological empowerment that leads to increased employee engagement and improved work performance (X. Huang, Iun, Liu, & Gong, 2010). When leaders engage others in critical decision making, this communicates value for the input of others and increases employees’ feelings of self-worth, motivation, and engagement (X. Huang et al., 2010).
Although limited empirical evidence has connected any form of leadership to creating an inclusive workplace (Boekhorst, 2014; Brimhall et al., 2014; Cottrill, Lopez, & Hoffman, 2014), Nembhard and Edmondson (2006) found that when leaders engage others in decision making or seek the input from all members of the organization, staff participation and engagement in quality improvement efforts increased. Nembhard and Edmondson (2006) defined leader inclusiveness and engagement behaviors as the “words and deeds by a leader or leaders that indicate an invitation and appreciation for others’ contribution” (p. 947). A leader’s ability to encourage the participation of all organizational members and express value for the unique perspectives given aligns with the theoretical foundation for creating a climate for inclusion (Shore et al., 2011).
In addition to fostering inclusion, leader engagement behaviors may also encourage innovation. Evidence has supported leadership (Apekey et al., 2011; Dixon-Woods et al., 2012) and innovation (Cazzaniga & Fischer, 2015; Duarte et al., 2014) as essential elements in the development and maintenance of high-quality care and suggests that leadership can directly influence staff innovation (Aarons & Sommerfeld, 2012; Chen, Farh, Campbell-Bush, Wu, & Wu, 2013). A leader’s ability to encourage organizational members to share perspectives and seek out new ways of solving problems has been linked to increased innovation in nonprofit organizational contexts (Aarons & Sommerfeld, 2012; Weng, Huang, Chen, & Chang, 2015). The exchange-based model for participative leadership posits that when leaders treat their employees as valuable members of the organization, by seeking feedback in decision making and expressing value for the contributions of others, this promotes trust (X. Huang et al., 2010) and the willingness of organizational members to share and collaborate on new ideas (a critical component of innovation; Anderson & West, 1998).
Leadership has been shown to positively influence work outcomes through its influence on organizational climate (i.e., the leadership-to-performance relationship; Aarons & Sommerfeld, 2012; Reichers & Schneider, 1990; Zohar & Hofmann, 2012). A recent review and meta-analysis of the leadership-to-performance relationship suggests affective events theory (Weiss & Cropanzano, 1996) as a helpful framework for understanding how leaders influence performance outcomes through organizational climate (Ng, 2017). Affective events theory posits that leaders, through behaviors and actions, can influence employee attitudes and affect, which then influence performance outcomes (Ng, 2017; Weiss & Cropanzano, 1996). The functionalist perspective argues that leaders are in a position to shape the work environment, and it is through influencing climate that leaders ultimately affect performance (Ostroff, Kinicki, & Tamkins, 2003; Sarros, Cooper, & Santora, 2008; Schein, 1992; Schneider, Goldstein, & Smith, 1995). For example, leaders expressing appreciation for others’ contributions (i.e., leader engagement) may be seen as a positive work event that makes one feel valued in the work environment (i.e., climate for inclusion), which may encourage employees to speak up and share their ideas (i.e., climate for innovation), thereby influencing how one feels about his or her job (i.e., job satisfaction) and ultimately performance (i.e., quality of care).
Although evidence has been scarce in the nonprofit health care sector, leader engagement behaviors have been associated with creating a safe and encouraging environment for staff members to share ideas with one another, which was then positively associated with engagement in creative tasks, performance, and quality improvement efforts (Carmeli et al., 2010; Nembhard & Edmondson, 2006). Thus, the current study posited that leader engagement will be positively associated with creating both an inclusive and an innovative workplace and that inclusion will be associated with innovation, which then might influence staff attitudes in terms of increased job satisfaction and ultimately quality of services.
Figure 1 presents the conceptual multilevel model. Examining both the direct and indirect effects of leader engagement holds promise for uncovering how nonprofit leaders may improve employee job satisfaction and quality of care through creating inclusive and innovative workplaces. This is particularly important for nonprofit leaders and managers striving to improve work climates that promote increased employee satisfaction and performance.
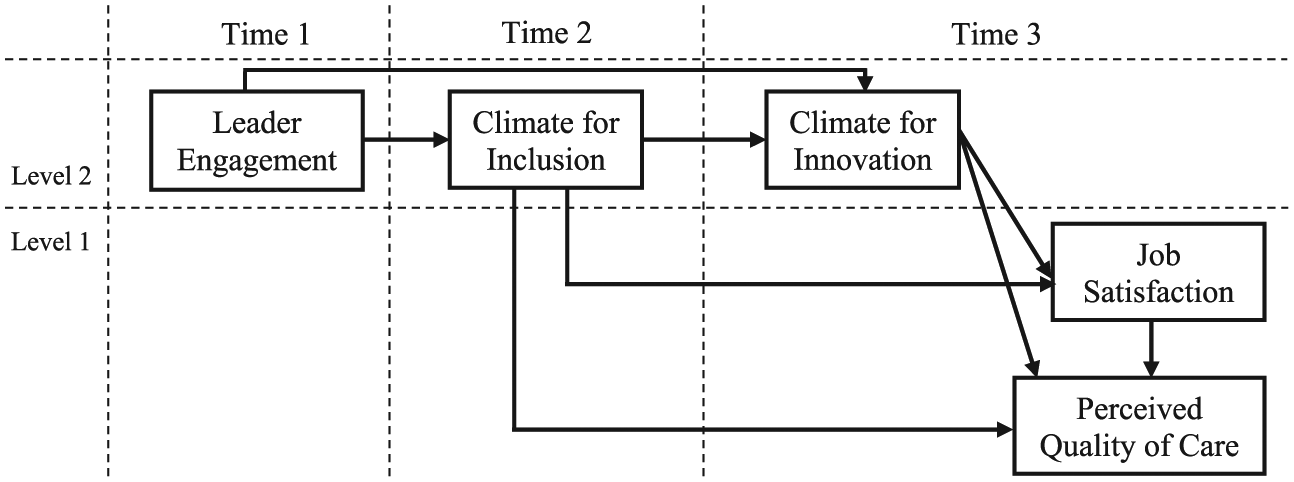
Multilevel conceptual model.
Method
Participants
Participants were recruited at three points in 6-month intervals beginning in 2015 from a diverse nonprofit hospital department located in the western region of the United States. This hospital, founded over 100 years ago, is located in a large inner-city and primarily serves children and families from low-income and diverse racial and ethnic minority backgrounds. At Time 1, 277 employees (of 300 current employees) agreed to participate in the initial demographic survey (92% response rate) and 213 (71% response rate) agreed to participate in the main survey. At Time 2, of 330 possible participants (there was an increase in potential participants due to hiring), 292 agreed to participate in the demographic survey (88% response rate) and 245 in the main survey (74%). At Time 3, 259 participants (of 330 current employees) agreed to participate in the demographic survey (78% response rate) and 239 (72%) in the main survey. This department featured 23 separate work groups. To protect confidentiality, two work groups were removed from the analysis due to having fewer than five participating group members (group sizes ranged from 5 to 25). This resulted in 21 within-department work groups. The average within-group responses for each time point were as follows: Time 1 (M = 10.16, SD = 6.58), Time 2 (M = 11.45, SD = 6.96), and Time 3 (M = 12.15, SD = 6.76).
Procedures
To promote accurate and unbiased responses, each construct was measured using different scales and embedded in the surveys under separate foci (i.e., psychological separation; Podsakoff, MacKenzie, Lee, & Podsakoff, 2003; Podsakoff & Organ, 1986). In addition, control variables were measured on a separate initial survey and main constructs were measured at different points in 6-month intervals (i.e., temporal separation; Podsakoff et al., 2003; Podsakoff & Organ, 1986). The primary investigator emailed surveys to all current department employees at each time point. Participants created their own unique study ID codes that were used to connect all questionnaires. No personally identifying questions were asked on any of the surveys. After completing the questionnaires (approximately 121 items), participants received a US$15 Amazon.com gift card at Time 1, a US$20 Amazon.com gift card at Time 2, and a US$25 Amazon.com gift card at Time 3. Prior to data collection, this study was reviewed and approved by the participating nonprofit organization’s and university’s institutional review boards.
Measures
All demographic and work-related questions (i.e., gender, race and ethnicity, age, education, job position, job tenure, work group, and job location) were collected at each time point. Inclusion, innovation, job satisfaction, and perceived quality of care were measured on Likert-type scales ranging from 1 (strongly disagree) to 6 (strongly agree). Response options for leader engagement ranged from 1 (not at all) to 5 (to a very great extent) on a Likert-type scale (see the appendix for all construct items).
Leader engagement
Three items developed by Nembhard and Edmondson (2006) represented leader engagement behaviors. After receiving feedback from study participants that the reverse-scored item for leader engagement was difficult to interpret, this item was slightly revised to eliminate reverse-scored wording. The overall Cronbach’s alpha was .93 (Time 1).
Climate for inclusion
Perceptions of work group inclusion were measured using subscales (work group [three items], supervisor [three items], and social informal [three items]) from the Mor Barak Inclusion-Exclusion Scale (Mor Barak, 2014). The phrase “my department” was added to each question for clarity regarding the level of analysis for each question. After receiving feedback from study participants that the reverse-scored items were difficult to interpret, three items were slightly revised to eliminate reverse-scored items. Reliability for inclusion at Time 2 was .93.
Climate for innovation
Innovation was measured using Anderson and West’s (1998) 8-item innovation scale. The phrase “my department” was added to each question for clarity regarding the level of analysis for each question. Cronbach’s alpha for the innovation scale at Time 3 was .97.
Job satisfaction
Quinn and Staines’s (1979) four-item work satisfaction scale was used to measure job satisfaction. Cronbach’s alpha for job satisfaction at Time 3 was .92.
Perceived quality of care
S. M. Lee, Lee, and Kang’s (2011) three-item service quality scale was used to measure perceived quality of care. Reliability at Time 3 of these items was .91.
Data Analysis
Approximately 94% (n = 201) of the values were present for leader engagement at Time 1, 97% (n = 238) for inclusion at Time 2, and 95% (n = 227) for innovation and 90% for both job satisfaction (n = 216) and perceived quality of health care services (n = 215) at Time 3. Data can be reasonably considered missing at random and full information maximum likelihood estimation methods used if missingness in the outcome variable does not depend on the outcome itself (Rubin, 1996). The logistic regression model for testing missing data patterns yielded null results, suggesting that scores regarding perceived quality of care were not missing due to perceptions of quality (or any other variable examined). Logistic regression analyses were also conducted to see whether variables in the model significantly influenced whether participants decided to return and participate at subsequent time points. Findings yielded null results, suggesting that participation at different time points was unrelated to any of the variables in the study. Based on the results of missing data analyses, full information maximum likelihood was used to handle missing data.
No issues of multicollinearity were present for study variables (variance inflation factor [VIF] = 2; O’Brien, 2007). To examine the study hypotheses, a multilevel path analysis with bootstrap methods was conducted in Mplus 8 statistical software (Shrout & Bolger, 2002). Using bias-corrected estimates based on 10,000 bootstrap samples is the method of choice for indirect effects (Efron & Tibshirani, 1993; MacKinnon, Lockwood, & Williams, 2004). Leader engagement was measured at Time 1, inclusion at Time 2, and innovation, job satisfaction, and perceived quality of care at Time 3. Demographic variables were measured at the individual level and used as control variables. Leader engagement, inclusion, and innovation were measured at the group level, whereas job satisfaction and perceived quality of care were measured at the individual level. Intraclass correlation coefficients (ICCs) and average within-group agreement correlations were examined to ensure that the data supported group-level aggregation (Brown & Hauenstein, 2005; Shrout & Fleiss, 1979). Model fit was evaluated using the chi-square (χ2) misfit statistic, comparative fit index (CFI), Tucker–Lewis index (TLI), and the root mean square error of approximation (RMSEA; Hayduk, Cummings, Boadu, Pazderka-Robinson, & Boulianne, 2007; Hu & Bentler, 1999).
Results
Sample
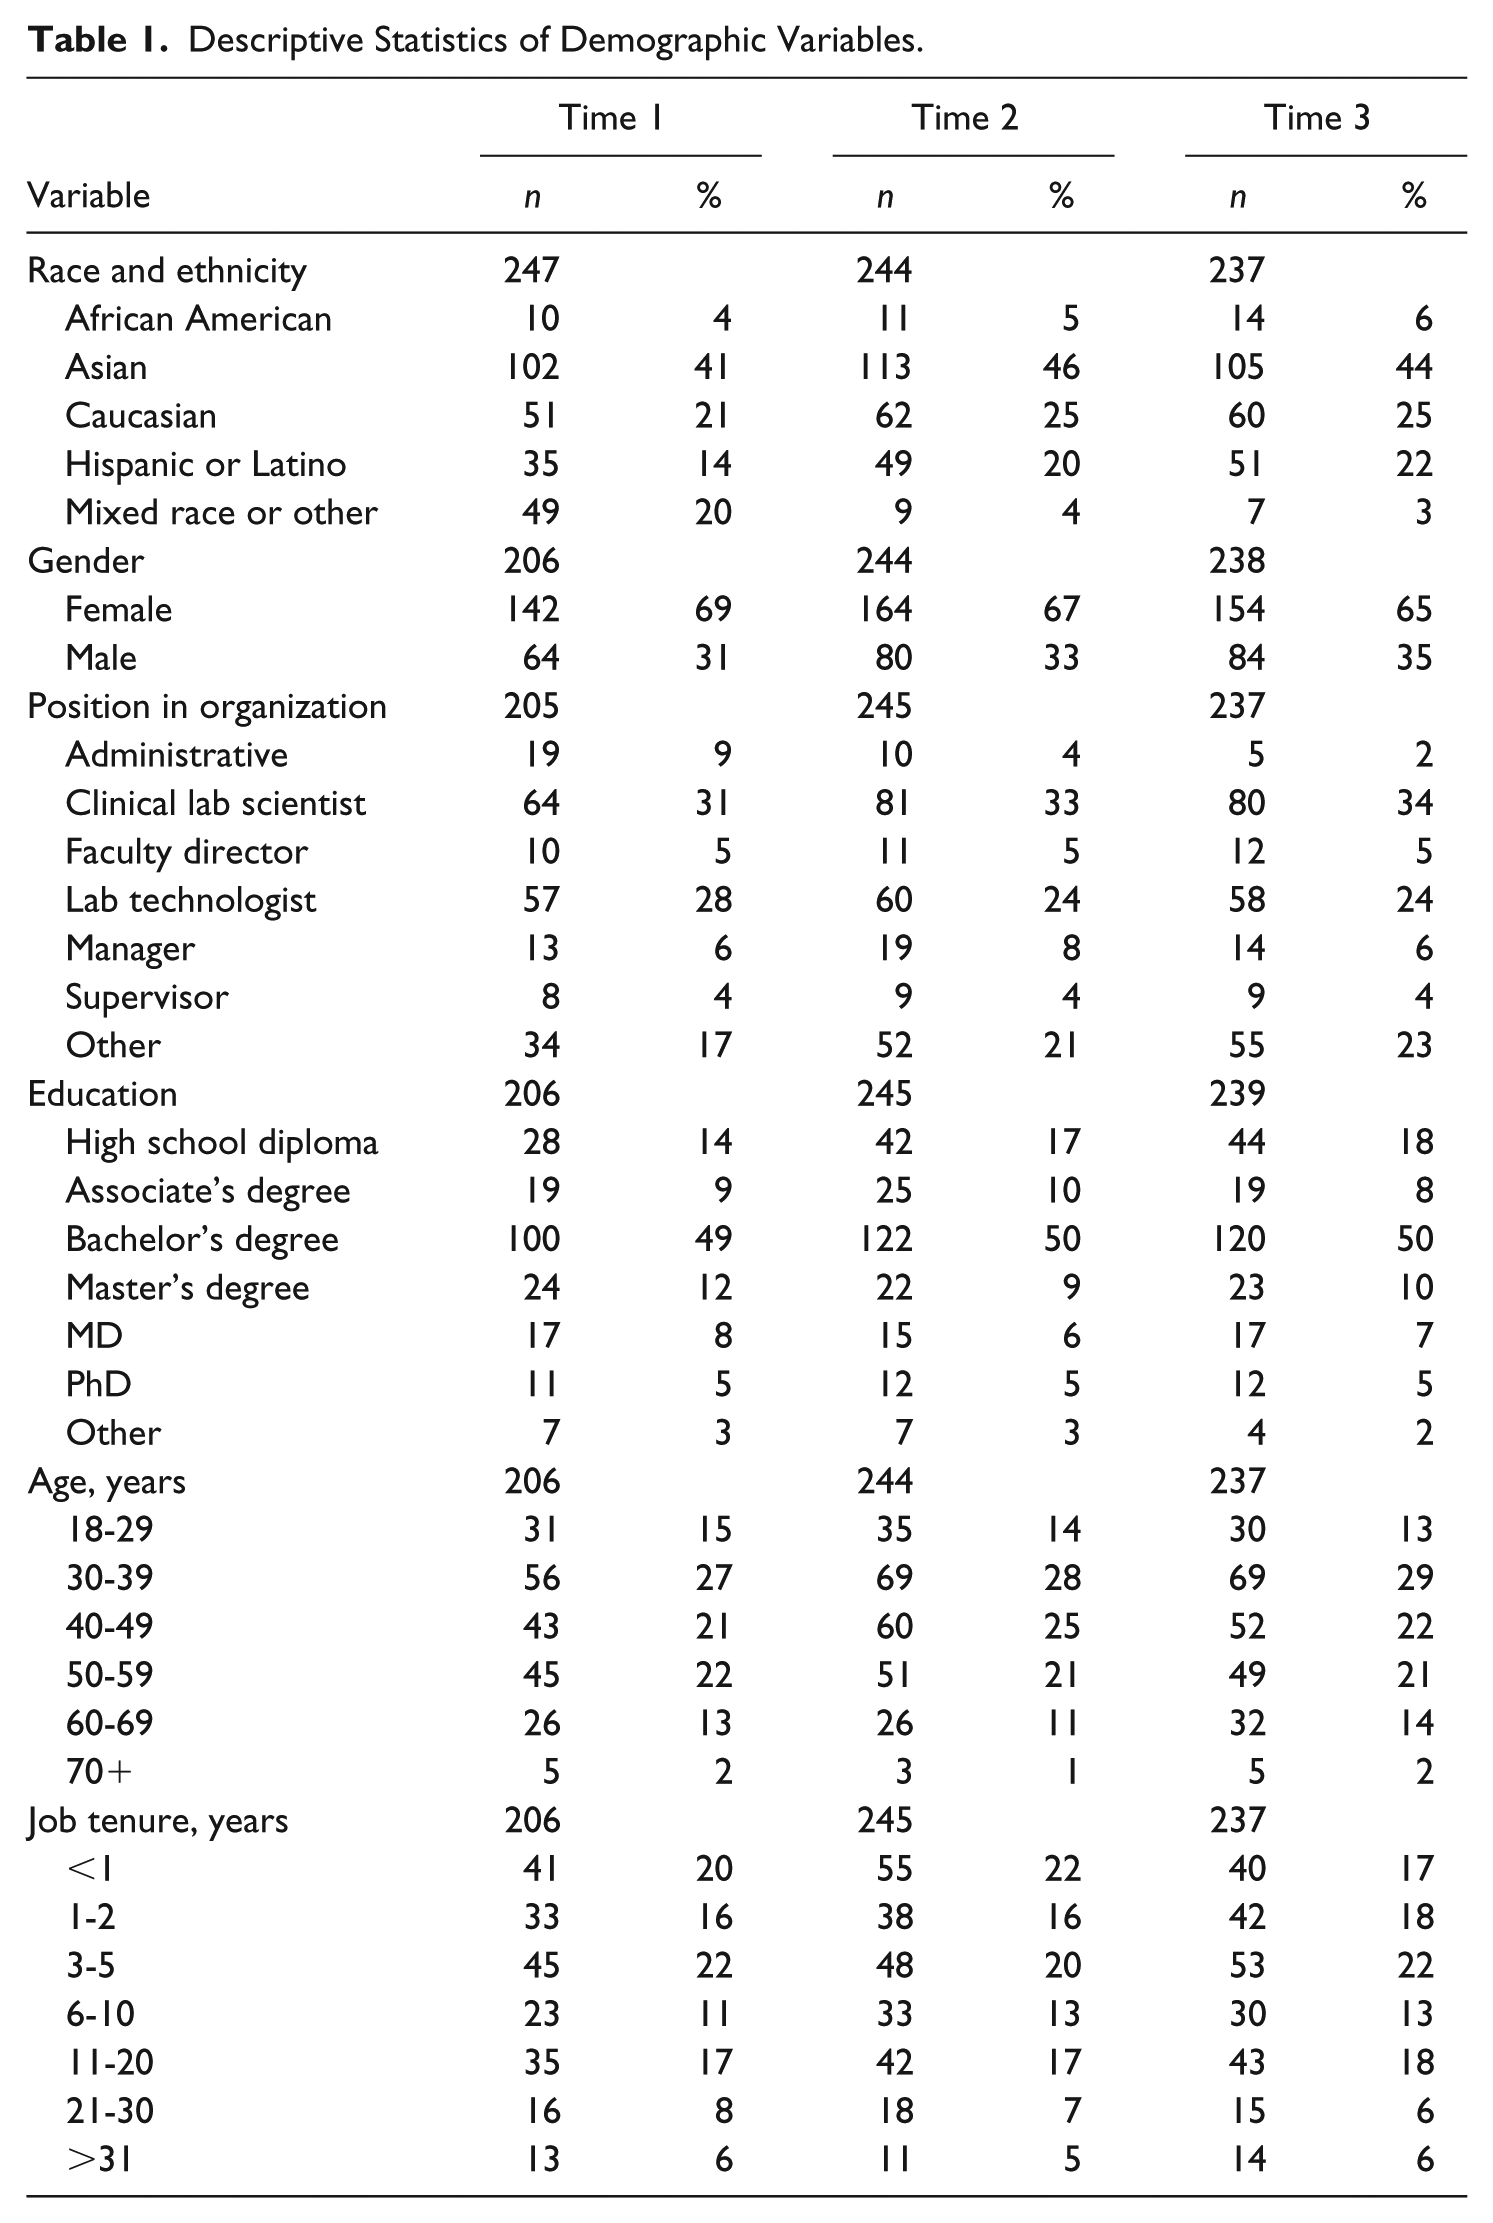
Table 1 presents the demographic descriptive statistics at Time 1, Time 2, and Time 3. The sample was ethnically diverse, with the largest category of participants at each time point self-reporting as Asian (41%-46%). Approximately 65% to 69% of participants were female. In terms of age, the largest category among all time points was participants between the ages of 30 and 39 years (27%-29%). Approximately half of the participants in the sample had a bachelor’s degree (49%-50%). The largest category in terms of job positions was clinical lab scientists (31%-34%). For job tenure, 20% to 22% of participants had worked between 3 and 5 years. Means, standard deviations, and correlations of study variables are presented in Table 2.
Descriptive Statistics of Demographic Variables.
Descriptive Statistics and Correlations of Study Variables.
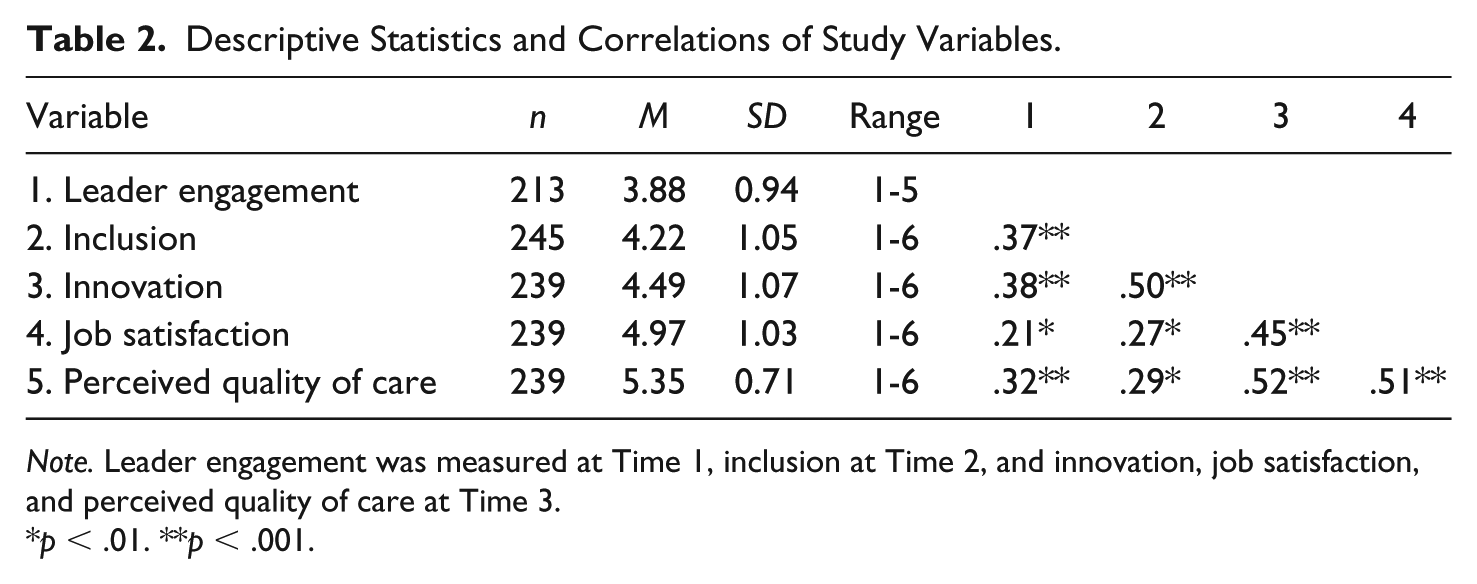
Note. Leader engagement was measured at Time 1, inclusion at Time 2, and innovation, job satisfaction, and perceived quality of care at Time 3.
p < .01. **p < .001.
Aggregation Analysis and Model Fit
ICCs for leader engagement at Time 1, inclusion at Time 2, and innovation at Time 3 indicate the appropriateness of considering these variables at the group level (Bliese, 2000; Kenny & Judd, 1996). For leader engagement, significant differences existed between work groups, indicating that 14% of the variance in perceptions of leadership was explained between groups (ICC = .14, p < .05, 95% confidence interval [CI] = [.04, .33]). In terms of inclusion, 11% of the variance was explained between groups (ICC = .11, p < .05, 95% CI = [.03, .27]), whereas 13% of the variance in innovation was explained between groups (ICC = .13, p < .05, 95% CI = [.04, .31]). Average within-group correlations indicated that the climate strength (or agreement) was .58 for leader engagement, .58 for inclusion, and .61 for innovation (values closer to 1 indicate perfect agreement or a strong climate; Brown & Hauenstein, 2005). Model fit statistics for the multilevel path model suggested an appropriate fit to the data (χ2 = 23.402, df = 17, p = .14; CFI = .96; TLI = .94; RMSEA = .04, 90% CI = [.00, .08]).
Direct Effects
Figure 2 shows the standardized direct associations of the multilevel model. After controlling for gender, age, race and ethnicity, job position, job tenure, and education, positive direct effects were found between leader engagement at Time 1 and climate for inclusion at Time 2 (β = .30, SE = .07, t = 4.64, p < .001) and between leader engagement at Time 1 and climate for innovation (β = .20, SE = .09, t = 2.25, p < .05) and perceived quality of care (β = .17, SE = .08, t = 2.03, p < .05) at Time 3. A significant direct effect existed between climate for inclusion at Time 2 and climate for innovation at Time 3 (β = .41, SE = .07, t = 6.05, p < .001). Innovation at Time 3 was significantly associated with job satisfaction at Time 3 (β = .42, SE = .07, t = 5.85, p < .001), and job satisfaction (β = .40, SE = .08, t = 5.20, p < .001) and innovation (β = .30, SE = .07, t = 4.05, p < .001) were significantly associated with perceived quality of care. Last, when inclusion was examined directly with employee job satisfaction and perceived quality of care, results were significant, and when leader engagement and innovation were included in the model, the results became nonsignificant.
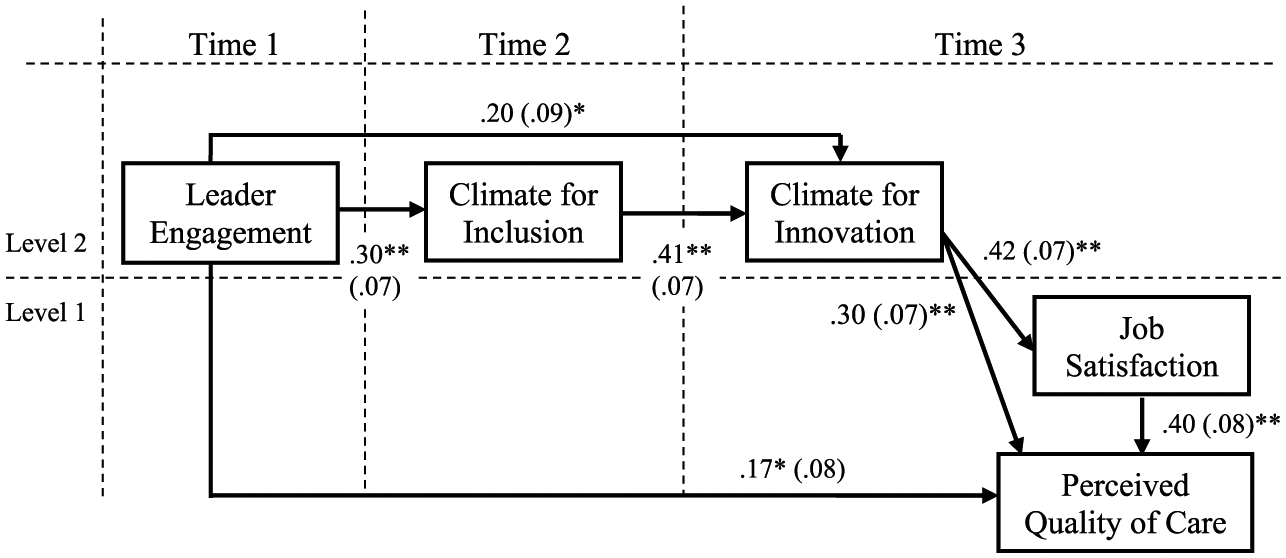
Direct effects.
Indirect Effects
Table 3 presents the standardized indirect associations. Leader engagement at Time 1 was positively associated with climate for innovation at Time 3 through its influence on climate for inclusion at Time 2 (β = .12, SE = .04, t = 2.91, p < .001). Similarly, leader engagement positively influenced job satisfaction (β = .05, SE = .02, t = 2.60, p < .01) and perceived quality of care (β = .04, SE = .02, t = 2.35, p < .01) through increased inclusion and innovation. A significant indirect effect existed between inclusion and perceived quality of care through innovation (β = .12, SE = .04, t = 3.44, p < .001). In addition, a positive significant indirect effect emerged between innovation and perceived quality of care through job satisfaction (β = .17, SE = .05, t = 3.48, p < .001). Last, the indirect relationship between inclusion and perceived quality of care through job satisfaction was significant when not accounting for leader engagement and innovation and became nonsignificant once leader engagement and innovation were accounted for in the model.
Indirect Effects.
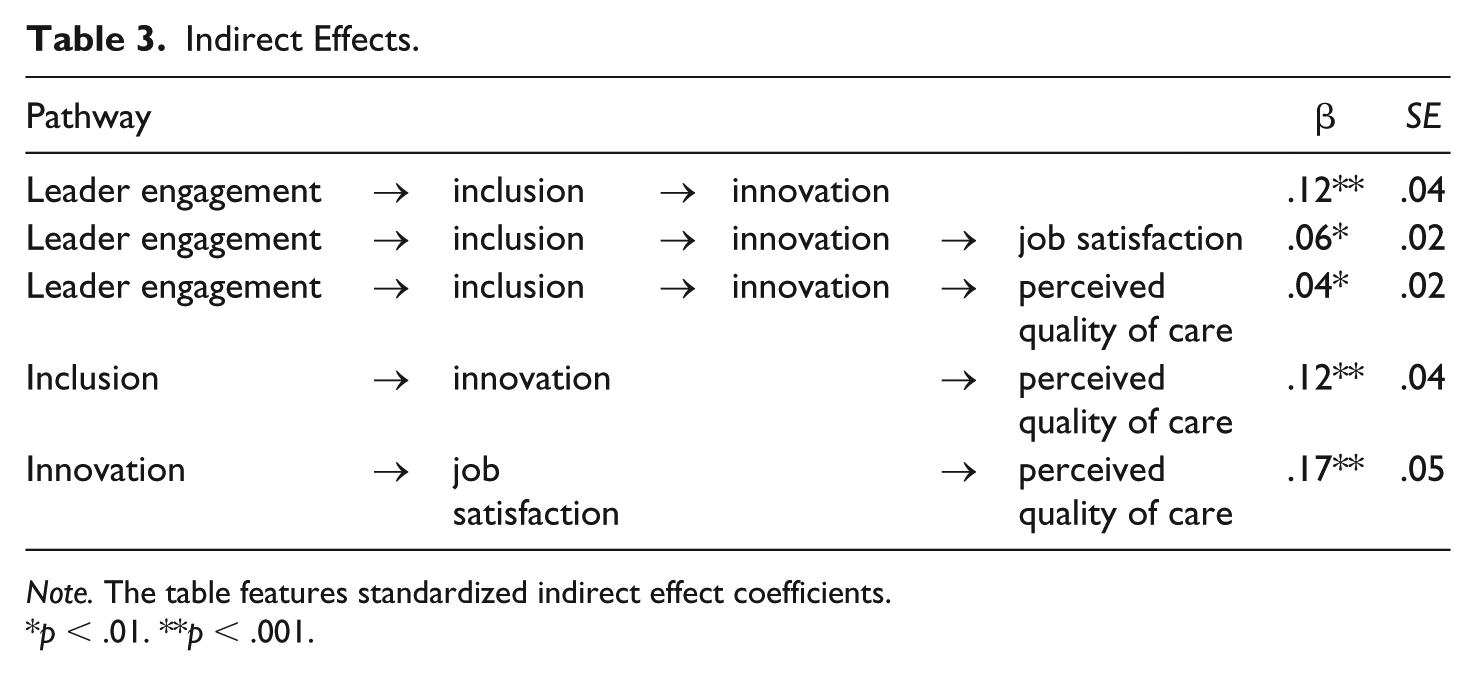
Note. The table features standardized indirect effect coefficients.
p < .01. **p < .001.
Discussion
Given that nonprofit organizations struggle with high turnover rates (Lee, 2016) and that high turnover rates can negatively affect organizational functioning and performance (Gazley, 2009; Johnson, 2009; Lee, 2016), the current study sought to examine ways nonprofit leaders can increase employee job satisfaction and ultimately perceived quality of care in a diverse nonprofit health care organization. Based on data from the United States, this study revealed unique pathways by which nonprofit leaders can influence employee job satisfaction and perceived service quality through climates for inclusion and innovation. When examining the indirect effects, there was a significant association between leader engagement and innovation through increasing climate for inclusion. Innovation fully mediated the relationship between inclusion and perceived quality of care, as evidenced by the direct effect between inclusion and quality of care being significant when not accounting for innovation, and becoming nonsignificant once innovation was accounted for in the model with the indirect effect between inclusion and quality of care being significant through innovation. Last, findings indicate inclusion and innovation as key mediators between leadership and performance outcomes (i.e., job satisfaction and perceived quality of care). Interestingly, job satisfaction mediated the relationship between inclusion and quality of care when leader engagement and innovation were not accounted for in the model. Once leader engagement and innovation were added to the model, job satisfaction was no longer a significant mediator between inclusion and perceived quality of care. This suggests that increasing quality of care is likely due to the influences of leader engagement, inclusion, and innovation, rather than through job satisfaction.
The implications of these findings have applicability across national settings and for effective management of nonprofit organizations internationally. Striving to find ways nonprofit leaders can increase employee job satisfaction and service quality is not likely to be limited to the United States (Bastida, Marimon, & Carreras, 2018; Choi, Goh, Adam, & Tan, 2016; Yıldız & Şimşek, 2016). The general model of leadership influencing performance outcomes, such as job satisfaction and service quality, through various mediating variables is supported in national and international contexts (Wipulanusat, Panuwatwanich, & Stewart, 2018; Yıldız & Şimşek, 2016) and in a variety of public and nonprofit sectors (Edú-Valsania, Moriano, & Molero, 2016; Wipulanusat et al., 2018).
Separately, evidence exists for the value of inclusion and innovation in a variety of contexts. For example, researchers in the United Kingdom found climate for inclusion reduced workplace discrimination and bullying in diverse government civil service organizations (Andrews & Ashworth, 2014). In Germany, among service, trade, production, finance, and insurance organizations, inclusive workplace practices were related to favorable perceptions of diversity climate and ultimately improved company performance and retention (Böehm, Kunze, & Bruch, 2014). Among Canadian financial institutions inclusion was found to increase employees’ organizational citizenship behavior (i.e., the willingness to donate time or energy to support the organization; Tremblay, 2017). In addition, leadership quality was found to improve job satisfaction and reduce intentions to leave through increasing perceptions of inclusion among public child welfare workers in the United States (Brimhall et al., 2014). Regarding innovation, Spanish communities of Madrid found higher levels of authentic leadership to be related to favorable perceptions of climate for innovation, which then lead to increased knowledge sharing behaviors among employees in health, education, public assistance, and human service organizations (Edú-Valsania et al., 2016). Employees in public service positions in Australia indicated that leadership influenced a culture of innovation, which then influenced employee satisfaction (Wipulanusat et al., 2018). Service employees in the Kingdom of Bahrain suggested that leadership was associated with employee knowledge sharing (characteristic of a climate for innovation; Anderson & West, 1998), which was then associated with product innovation (Birasnav, Albufalasa, & Bader, 2013). Last, transformational leadership was found to increase climate for innovation, which then positively influenced employee attitudes toward evidence-based practices among nonprofit mental health workers in the United States (Aarons & Sommerfeld, 2012).
Although research supports inclusion and innovation as beneficial work climates, limited empirical work has examined how inclusion and innovation may work together to influence the leadership-to-performance relationship. Thus, the unique contribution of the current study highlights how leader engagement, a particular leadership approach in the nonprofit sector, can positively increase employee job satisfaction and perceived service quality by fostering both a climate for inclusion and a climate for innovation. When leaders engage others in critical decision making, ensuring that all employees are valued regardless of job position (i.e., leader engagement; Nembhard & Edmondson, 2006), this helps people feel valued as important members of the group (climate for inclusion; Mor Barak et al., 2016; Shore et al., 2011), which then encourages people to feel more comfortable speaking up and sharing their perspectives with others (climate for innovation; Anderson & West, 1998; Carmeli et al., 2010), thereby increasing employee job satisfaction and perceived quality of care.
Limitations
Some of the limitations to consider involve the generalizability of the sample. Although nonprofit health care organizations in the United States may share similar characteristics to other nonprofit organizations, they likely differ quite remarkably from health care organizations internationally. In addition, perceived quality of care was measured, rather than more objective measures of quality. Furthermore, participants responded to all constructs using the same method, self-report. To examine the potential of common method bias, a single-method common factor approach was explored that tested a one-factor model relative to the hypothesized model (Podsakoff et al., 2003). The one-factor model yielded a poor fit to the data (CLI = .51, TLI = .39, RMSEA = .10, 90% CI = [.09, .12], standardized root mean square residual [SRMR] = .10), minimizing the probability of common method bias (Podsakoff et al., 2003; Podsakoff & Organ, 1986). Future research may use multiple source methods to confirm these results found using self-report data (Spector, 2006).
Implications and Conclusions
Nonprofit leaders striving to increase employee job satisfaction and service quality can do so in several ways. Leaders who seek the input of organizational members from all job positions and encourage everyone, regardless of educational background or job responsibilities, to take initiative and participate in work-related processes (Nembhard & Edmondson, 2006) are more likely to increase feelings of inclusion. The most effective nonprofit organizations draw on and benefit from the experience and expertise of all members in the workplace, including front-line service providers (Glisson, 2015). A leader who expresses equal value and appreciation for the opinions of others (Nembhard & Edmondson, 2006) fosters feelings of acceptance for unique perspectives and a sense of belonging as important members of the group. This suggests that nonprofit leaders and managers who engage others in critical organizational processes can help foster an inclusive climate that leads to increased innovation, employee job satisfaction, and the quality of services in nonprofit organizations.
Footnotes
Appendix
Leader engagement (Nembhard & Edmondson, 2006):
Climate for inclusion (Mor Barak, 2014):
Climate for innovation (Anderson & West, 1998):
Job satisfaction (Quinn & Staines, 1979):
Perceived quality of care (S. M. Lee, Lee, & Kang, 2011):
Acknowledgements
Thanks are due to the participants for sharing their perspectives and their involvement in this study. Gratitude is also given to Dr. John McArdle for his quantitative guidance.
Declaration of Conflicting Interests
The author(s) declared no potential conflicts of interest with respect to the research, authorship, and/or publication of this article.
Funding
The author(s) disclosed receipt of the following financial support for the research, authorship, and/or publication of this article: This study was supported by the U.S. Department of Health and Human Services Agency for Healthcare Research and Quality (Grant No. 1R36HS024650-01), the University of Southern California Suzanne Dworak-Peck School of Social Work, and the University of Southern California Management, Organizations and Policy Transformation Research Cluster.
