
Abstract
This research quantifies for the first time in the literature how strong the direct and indirect relationships are between satisfaction, trust, and commitment and giving intention versus giving behavior. We constructed a unique data set of over 17,000 donors from five large charities. We applied the latest mediation framework for categorical variables from consumer behavior. We found that at a group level, most of the direct and indirect effects that exist between satisfaction, trust, commitment, and giving intention also exist between these factors and giving behavior, but the effect sizes are between 3 to 8 times larger in modeling giving intentions than in modeling giving behavior. When giving intention and giving behavior are matched at an individual level, all group-level findings are replicated. In addition, we found 27% of the donors with no intention to give, actually gave. Theoretical, empirical, methodological, and practical implications are discussed.
Introduction
Local, national, and international nonprofits work to solve some of the most significant social problems facing our global society today (e.g., to end poverty and hunger, to protect the planet, and to foster peace; United Nations, 2015). Fundraisers in these organizations need to secure sufficient income to support these missions in an increasingly tough economic and policy environment (Craver, 2014). One possible way for the academy to help is by identifying ways that a higher percentage of donors might be retained and by quantifying the effectiveness of these approaches to support the requisite investment decisions.
This is important because fundraisers’ hands are increasingly tied in how many new donors they can recruit and how. The cost of new donor acquisition continues to rise and in some jurisdictions burgeoning levels of regulation are making it increasingly difficult to use traditional media to solicit new supporters (Sargeant & Shang, 2017). Even where individuals can be recruited, the latest rules on Data Protection in Europe, for example, have pushed many charities toward an “opt-in” model for receiving subsequent communication. Many, new donors will inevitably fail to recognize that they do need to opt in and more supporters will be lost as a consequence (Fluskey, 2016).
Fundraisers, hence, have little choice, but to focus on retaining their existing donors. Ample evidence suggests that such a focus is long overdue. In the United States, for example, 70% of newly acquired donors will not renew their support into a second year, and subsequent year retention is also weak with nonprofits experiencing 30% to 40% attrition (Fundraising Effectiveness Project, 2016; Sargeant & Jay, 2014). In the United Kingdom, the current mean length of a donor relationship is 4.2 years, with the picture gradually worsening. Donors recruited in 2010 stayed for significantly longer (on average) than donors recruited subsequently (Lawson, 2016). So, what can the academic community do to help fundraisers and the social missions they serve?
A large literature in for-profit marketing (e.g., Larivière et al., 2016; Morgan & Hunt, 1994; Reichheld, 2000) suggests that if organizations can increase customer satisfaction, trust, and commitment, then they can increase customer loyalty, customer cooperation, and other profit-related indicators. Similarly, the nonprofit marketing literature (Sargeant, 2001; Sargeant & Lee, 2004; Sargeant & Woodliffe, 2007; Shabbir, Palihawadana, & Thwaites, 2007) suggests that if fundraisers can increase donors’ satisfaction, trust, and commitment, then they can raise more money. The literature is replete with recommendations on how best to do this and the effect sizes promised by these studies are substantial. Why then has this knowledge not helped fundraisers reduce donor attrition? Two possibilities may exist.
First, too many factors might have been shown to correlate with behavioral intentions. Fundraisers may feel overwhelmed when deciding which one(s) to focus on given their budget, time, and human resources constraints. Second, most existing studies examine the effects of these factors on behavioral intentions (in the nonprofit context: giving intentions, for example, Naskrent & Siebelt, 2011; Sargeant & Woodliffe, 2007) not the actual behaviors themselves. 1 As a result, even among the best prioritized factors demonstrated in academic research, fundraisers cannot have the confidence they perhaps should have in making the case for the requisite investment.
Developing better evidence can, hence, have significant economic impact if the data can focus attention on the most effective factors and their likely impact on giving behavior. In this research, we worked with five national U.K. charities gathering giving intention data from surveys and downloading actual donation data from their databases to investigate how satisfaction, trust, and commitment can increase donor intention to give to a charity, and how these three concepts can also affect actual donation behavior.
We develop theory in satisfaction, trust, and commitment by suggesting conceptually causal priorities (e.g., meditation structures) between them. We empirically test this theoretical structure on both behavioral intention and behavior. In addition, we introduce the latest mediation analysis framework on categorical outcome variables from marketing (Hayes, 2018; Iacobucci, 2012). To elaborate, we make the theoretical contribution of constructing the mediation structure of satisfaction, trust, and commitment as they relate to giving. We believe this pushes the development of theory from Stage 1 (i.e., contextualizing the definition of these concepts from other fields into the nonprofit context) and Stage 2 (i.e., testing their effects in isolation or as equally important causal agents) to Stage 3 (i.e., prioritizing them into a coherent causal structure). This is important because it is possible that some of these factors (e.g., satisfaction and trust) may be causes (e.g., independent variables in mediation analysis), whereas others (e.g., commitment) may be intermediary processes (e.g., mediating variables) in driving behavioral changes (e.g., outcome variables). So, when all else is equal, operational priority should be given to the causes. Failing to take this into account, as we will discuss later, may harm fundraising operations.
Empirically testing the mediation structure of satisfaction, trust, and commitment is important. What is more important, however, is to construct a unique data set that allows us to compare how these relationships differ between behavioral intention and actual behavior. We believe this is the first time in the field of nonprofit research that these comparisons have been made and, hence, they are our most important empirical contribution. If we find that the meditation structure is identical for behavioral intentions and actual behaviors, then we have the highest confidence in the generalizability of our theory. If we find that the meditation structures are broadly the same, but the relationships are much weaker in behaviors than in intentions, then we should be motivated to find stronger determinants of behavioral change. If we find that the meditation structure cannot explain certain discrepancies between intention and behavior, then a new future avenue of inquiry can be opened. In any one of these scenarios, it is important, we think, for nonprofit researchers to be exposed to the empirical evidence available through this study because different trajectories for theory development can be designed accordingly.
Finally, we make a methodological contribution by introducing the latest mediation analysis framework on categorical outcome variables from marketing (Hayes, 2018; Iacobucci, 2012) into nonprofit research. We believe this application has the potential to enhance the cross-fertilization between the field of nonprofit research and the fields of consumer psychology and marketing. This technique was termed “the final frontier” in mediation analysis when it was first published in 2012 by a marketing researcher (Iacobucci, 2012). Such analyses allow meditation investigations of categorical outcomes, something that although important, has historically lagged behind in its development in comparison with the study of continuous variables. In many nonprofit scenarios, categorical outcome variables are of essential importance. For example, if a donor continues their association with a nonprofit or continues to give (which is measured as a binary variable), the net revenue will almost always be higher than any increase in the amount of that gift (which is measured as a continuous variable). Retention, not upgrading gift value, is the primary practical concern. Developing theories and empirically testing them on these variables are, hence, important.
We believe these conceptual, empirical, and methodological contributions are not only important for fundraising, but for nonprofit research in general. Theoretically, satisfaction, trust, and commitment drive behaviors other than giving. Empirically, categorical behaviors may be the only outcome variables meaningful to monitor performance (e.g., whether people volunteer or attend a particular event, take action in a particular campaign, join an organization’s social media group or sign up to receive a bequest brochure; Sargeant & Woodliffe, 2007). Equipping nonprofit researchers and practitioners alike with this theoretical, empirical, and methodological development, we think, may be valuable.
We will begin by defining our key terms and justifying our hypotheses; we will then explain our findings and clarify their theoretical importance.
Hypotheses Generation
Satisfaction, trust, and commitment are widely researched concepts in the commercial (Gruen, Summers, & Acito, 2000; Hosmer, 1995; Morgan & Hunt, 1994; Oliver, 2010) and nonprofit sectors (Sargeant & Lee, 2004; Sargeant & Shang, 2017), although the conceptualization and function of these three concepts are distinct from each other (Geyskens, Steenkamp, & Kumar, 1999).
In the nonprofit context, satisfaction captures how donors feel about the way they are treated as a donor (Sargeant & Jay, 2004; Sargeant & Shang, 2017). The more pleasant their level of fulfillment is from their interaction with an organization, the more satisfied they are (Oliver, 2010). Trust taps into how much donors trust charities to do what is right and to use their donated funds appropriately (Sargeant & Lee, 2004). The more they are willing to rely “upon a voluntarily accepted duty on the part of another person, group or firm to recognize and protect the rights and interests of all others engaged in a joint endeavour or economic exchange,” the more they trust them (Hosmer, 1995; p. 393). Commitment captures donors’ passion to see the mission of the organization succeed and their personal commitment to that mission that creates that attachment (Sargeant & Shang, 2017). The stronger their enduring desire to develop and maintain a stable relationship with the charity, the more committed they are (Anderson & Weitz, 1992; Gundlach, Achrol, & Mentzer, 1995; Moorman, Zaltman, & Despande, 1992; Morgan & Hunt, 1994).
Direct Effects of Satisfaction, Trust, and Commitment on Behavioral Intention and Behavior
Satisfaction, trust, and commitment have been found to directly change behavioral intentions in the commercial world (for recent examples on satisfaction increasing repurchase intentions see Aksoy, 2013; Anderson & Mittal, 2000; Larivière, 2008; on trust increasing intention to repurchase or spread good word of mouth see Aydin and Özer, 2005; on commitment increasing stickiness between a customer and a company see Gustafsson, Johnson, & Roos, 2005). The same is true in the nonprofit context: satisfaction (Bennett, 2009; Bennett & Barkensjo, 2005), trust (Skarmeas & Shabbir, 2011), and commitment (Burnett, 2002; Kelly, 2001; Nathan, 2009; Nudd, 1991; Sargeant & Woodliffe, 2007) increase future intentions to continue to give. There is, therefore, nothing new in our first hypothesis:
However, this hypothesis is worth testing in this article because we want to know if the reason why these factors have been found to be powerful in driving behavioral intention is because they have been tested primarily on behavioral intentions, but not behaviors (Gruen et al., 2000) or if these factors genuinely cause actual behavioral changes in the way theorists have previously inferred.
That is satisfaction leads to behavioral change because people have the tendency to seek more pleasant experiences that are like what they have experienced in the past. This is because they believe the same pleasure will be repeated in the future (Geyskens et al., 1999). Trust leads to behavioral change because people have the inherent need to do moral good and uphold their duty as good citizens in a good society. If they can trust a partner to uphold the same moral duty on their behalf, they are more likely to engage in interactions with them again (Hosmer, 1995). Finally, commitment leads to behavioral change because when people feel passionate about achieving a goal, they would give even more of themselves to that cause (not just their money; Mowday, Porter, & Steers, 1982). All these mechanisms suggest that people do not simply repeat their past behavior in the future, rather, they choose to repeat those that have given them a high sense of satisfaction, trust, and commitment. If all these mechanisms are valid and they influence behavioral intentions and behavior to the same degree, then we would expect that
We should even expect to see both H1a and H1b supported when past behavior is controlled for, because it is not what happened in the past that matters, but how people experienced it. If, however, only some of these mechanisms are valid, or if their influence on behavior is much weaker than previous research suggests, then we would expect to see some of the relationships hypothesized in H1b to be insignificant or show a much smaller effect size than in H1a.
Satisfaction may not shape behavior to the same degree as it shapes intention because of intervening contingencies. These contingencies were shown to influence behavior more so than they influence intention (Seiders, Voss, Grewal, and Godfrey, 2005). Trust, as a feeling, fades over time and this was shown to diminish its effect on behavior more so than its effect on intention (Palmatier, Jarvis, Bechkoff, & Kardes, 2009). Finally, the presence of uncertainty was shown to reduce the effect of commitment on behavior more so than its effect on intention (Chandrashekaran, McNeilly, Russ, & Marinova, 2000). This suggests that we may see that
Indirect Effects of Satisfaction and Trust through Commitment on Behavioral Intention and Behavior
Extant research indicates that in addition to the direct effects that satisfaction and trust may have, satisfaction and trust may both generate higher commitment and then create additional change in consumption intention (i.e., indirect effects; Bansal, Irving, & Taylor, 2004). This is because when people are satisfied with the services they are provided with (Sung & Choi, 2010) or when people feel they can trust the organization to do the right thing (Kingshott & Pecotich, 2007), they become more committed to the relationship they have with an organization or a brand, and their passion for them grows making them more likely to purchase again (Davis-Sramek, Droge, Mentzer, & Myers, 2009). The same may be true in charitable giving settings (e.g., Camarero & Garrido, 2011). This suggests that a positive indirect effect exists of both satisfaction and trust through commitment on giving intention. These significant indirect effects are termed mediation effects (Hayes, 2018). We, hence, hypothesize that
As before, if the same mechanisms as explained above are as valid and as strong in behaviors as they are in intention, we would expect to see H3b confirmed to the same degree as H3a.
But otherwise,
Research suggests that how strongly satisfaction, trust, and commitment can influence behavior is determined by the type of influence strategies that people are subject to (e.g., how solicitations are made, whether a sales person is present) and the effectiveness of these strategies (Geyskens et al., 1999). Because these strategies are more often present when real behavior takes place than when intention is estimated, H4 is possible.
Data Set Construction
We worked with five large charities in the United Kingdom for over a year. At the beginning of the year, we emailed donors from these organizations on their behalf. We invited donors to participate in a 10-min survey through Qualtrics. We measured donors’ satisfaction, trust, and commitment and their giving intention (i.e., intention to continue to give in the coming year). We then waited for 12 months and gathered data on whether and how much the donor actually gave.
A total of 541,512 eligible individuals were contacted. We received and matched to actual giving behavior 17,373 usable responses, representing a response rate of 3.21%. This is representative of the typical response rates that these charities receive from similar surveys. These donors were 38% male, 53% married, and with the mean age of 54.4 years (SD = 15.08). This is comparable with the donor populations reported to be engaged with charities in the United Kingdom (Charities Aid Foundation, 2015).
Dependent Variables
Continue-to-Give Intention
In the survey, participants were asked to rate on a 7-point scale (1 = not at all likely, 7 = extremely likely) “how likely you are to continue supporting X charity in the coming year.” This variable was entered into the analysis as a median split binary variable to mimic the binary nature of the actual behavior (i.e., those who are more likely than median to give and those who are less likely than median to give). 2
Continue-to-Give Behavior
This was a binary variable (continue-to-give = 1, did-not-continue-to-give = 0) indicating whether participants had donated money to the charity in the 12 months following the administration of the survey.
Independent and Process Variables
Satisfaction, trust, and commitment were measured using 7-point scales (1 = strongly disagree, 7 = strongly agree). These scales were taken from Sargeant (2001) and Sargeant and Jay (2004). Multiple items were used to measure each construct. Five items were used to measure satisfaction (α = .82; I am always thanked appropriately for any gift to [Charity]; Overall, I am very satisfied with how [Charity] treats me as a supporter; [Charity]’s fundraising communications are always appropriate in style and tone; I feel [Charity] understands why I offer my support; [Charity]’s communications always meet my needs for information). Four items were used to measure trust (α = .88; I trust [Charity] to deliver the outcomes it promises for [beneficiaries]; [Charity] can be counted on to use donated funds appropriately; [Charity] can always be counted on to do what is right; [Charity] can always be trusted). Three items were used to measure commitment (α = .81; I care passionately about the work of [Charity]; The relationship I have with [Charity] is something I am very committed to; [Charity] is working to achieve a goal that I care passionately about). Scores from each item were, hence, averaged to form the satisfaction, trust, and commitment score for each donor.
Table 1 presents the complete list of descriptive statistics for all variables.
Descriptive Statistics of All Variables.

Control Variables
Consistent with prior research, we controlled for past giving and total giving as proxies of recency, frequency, and level of giving (Fader, Hardie, & Shang, 2010; Sleesman & Conlon, 2016). We controlled for demographic variables as proxies for income (e.g., Lerner et al., 2001; and Soobader, LeClere, Hadden, & Maury, 2001). We also controlled for the difference in number of gifts made in the previous year as an indication of whether the fundraising practice might have changed in the 12-month period we studied. 3
Past Giving
Whether participants had donated in the previous 5 years (2015-2011) was entered as five binary variables (each pertaining to 1 year) denoting whether participants had given. This information was provided by the five charities where “1” is coded to show that a donor actually gave a monetary donation in that year, and a “0” is coded to show that the donor did not give to the focal charity in that year. This is an important control as authors like Schlegelmilch, Love, and Diamantopoulos (1997) found that more frequent donors had a stronger sense of relationship with the charity than less frequent donors.
Total Amount Donated
The total amount donated by each donor to the charity up to the point of the survey was included as a control. The average total donation made per donor prior to the survey was £355.75 (SD = £1,692.14).
The Difference in Number of Gifts
The number of times donors gave to the charity in 2015 was subtracted from the number of times they gave in 2016. This controls for overall fluctuations in giving behavior experienced by the charity in the interval of survey completion and the collection of behavioral data 12 months after the survey.
Demographics
Participants were also asked to indicate their age (a continuous variable), gender (1 = male, 2 = female), and marital status (recoded as binary, 1 = not married, 2 = married).
In addition, we controlled for the charities they gave to (four dummy coded variables) as we know these organizations have different patterns of communications with their donors. This is again consistent with prior research (e.g., Aquino & Reed, 2002).
Individually Matched Behavioral Intention and Behavior
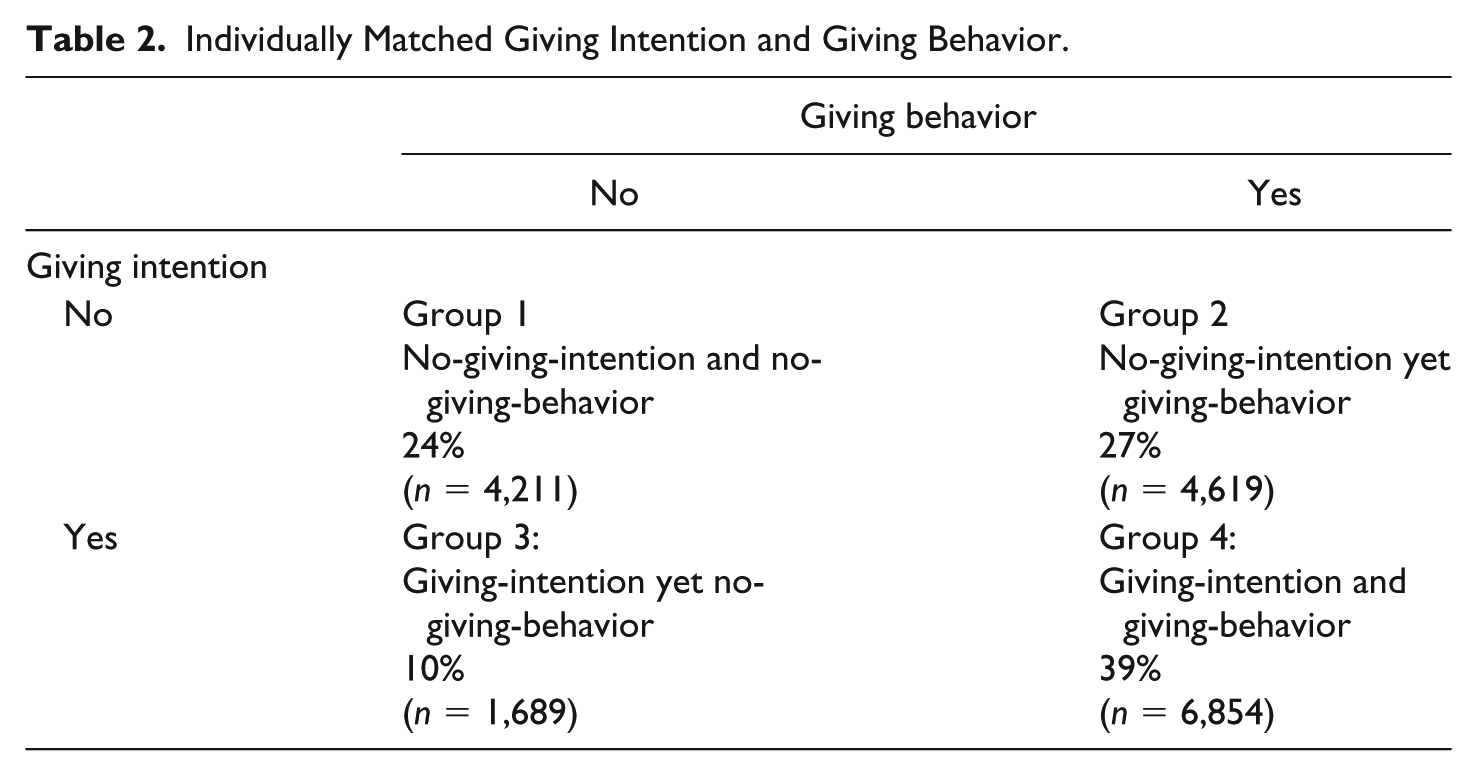
Continue-to-give intention and continue-to-give behavior are also matched at an individual level. Table 2 shows that 24% of donors (n = 4,211) had no intention to give with no giving demonstrated (Group 1 = no-giving-intention and no-giving-behavior), 27% of donors had no intention to give, but did give (n = 4,619; Group 2 = no-giving-intention yet giving-behavior), 10% of donors intended to give, but did not actually demonstrate giving (n = 1,689; Group 3 = giving-intention yet no-giving-behavior), and 39% of donors intended to give and actually gave (n = 6,854; Group 4 = giving-intention and giving-behavior). While there was a correlation between what people said they would do and what they actually did (r = .29, p < .01), 37% of people did not act how they “intended” to. We consider the possible reasons that some donors had no intention to give, but did give in the discussion.
Individually Matched Giving Intention and Giving Behavior.
Results
Mediation Analysis on Continue-to-Give Intention and Continue-to-Give Behavior at a Group Level
We analyzed the data using STATA 14.0. We first tested our hypotheses at a group level, that is, where people’s giving intention and giving behavior were analyzed as two separate dependent variables. The hypothesized model can be seen in Figure 1.

The hypothesized mediation model.
The results are shown in Table 3. There is no multicollinearity between satisfaction, trust, and commitment (tolerance = 0.47, VIF [variance inflation factor] = 2.11). All the coefficients reported in this article are standardized (Z). This is to allow the calculation of indirect effects for categorical dependent variables—the methodological innovation introduced by Iacobucci (2012) and to allow for effect size comparisons between models (Haslam & McGarty, 2003).
Standardized Coefficients for the Mediation Analysis on Continue-to-Give Intention and Continue-to-Give Behavior at a Group Level.

p < .1. **p < .05. ***p < .01.
Direct effects of satisfaction, trust, and commitment
The direct effects of satisfaction on continue-to-give intention (β = 11.069, p < .01) and continue-to-give behavior (β = 2.997, p < .01) are significant. The direct effect that a one standard deviation increase of satisfaction has on continue-to-give intention is 3.7 times higher than the same effect it has on continue-to-give behavior. The Wald test (e.g., Allison, 1999; Kodde & Palm, 1986; Liao, 2004; StataCorp, 2017) shows that the predictive effects of satisfaction differ significantly between continue-to-give behavior and continue-to-give intention, χ2(1) = 19.47, p < .001.
The direct effect of trust is significant on continue-to-give intention (β = 7.799,p < .01), but not on continue-to-give behavior (β = .859, p = .39). The predictive effects of trust differ significantly between continue-to-give behavior and continue-to-give intention, χ2(1) = 17.75, p < .001.
The effect of commitment is significant on continue-to-give intention (β = 30.979, p < .01) and continue-to-give behavior (β = 3.871, p < .01). The direct effect that a one standard deviation increase of commitment has on continue-to-give intention is 8.0 times higher than the same effect it has on continue-to-give behavior, χ2(1) = 272.48, p < .001. These results together confirm H1a and H2 and partially confirm H1b.
Indirect effects of satisfaction and trust through commitment
There is a significant effect of satisfaction (β = 50.680, p < .01) and trust (β = 42.387, p < .01) on commitment. The indirect effects of satisfaction (β = 26.428, p < .01) and trust (β = 25.007,p < .01) on continue-to-give intention through commitment are the products of the effect of satisfaction and trust on commitment and the effect of commitment on continue-to-give intention. The indirect effects of satisfaction (β = 3.859, p < .01) and trust (β = 3.853, p < .01) on continue-to-give behavior through commitment are the products of the effect of satisfaction and trust on commitment and the effect of commitment on continue-to-give behavior. The indirect effects of a one standard deviation increase of satisfaction and trust on continue-to-give intention are both approximately 6.5 times bigger than the indirect effects of satisfaction and trust on continue-to-give behavior, satisfaction: χ2(1) = 246.95, p < .001; trust: χ2(1) = 237.15, p < .001. These results together confirm H3a, H3b, and H4.
Mediation Analysis on Continue-to-Give Intention and Continue-to-Give Behavior at an Individual Level
We then tested our hypotheses at an individual level using a multinomial logit. The results are shown in Table 4.
Standardized Coefficients for the Mediation Analysis on Continue-to-Give Intention and Continue-to-Give Behavior at an Individual Level (i.e., Where People’s Giving Intention and Giving Behavior Were Matched Into a Categorical Variable Ranging From Group 1 to Group 4).
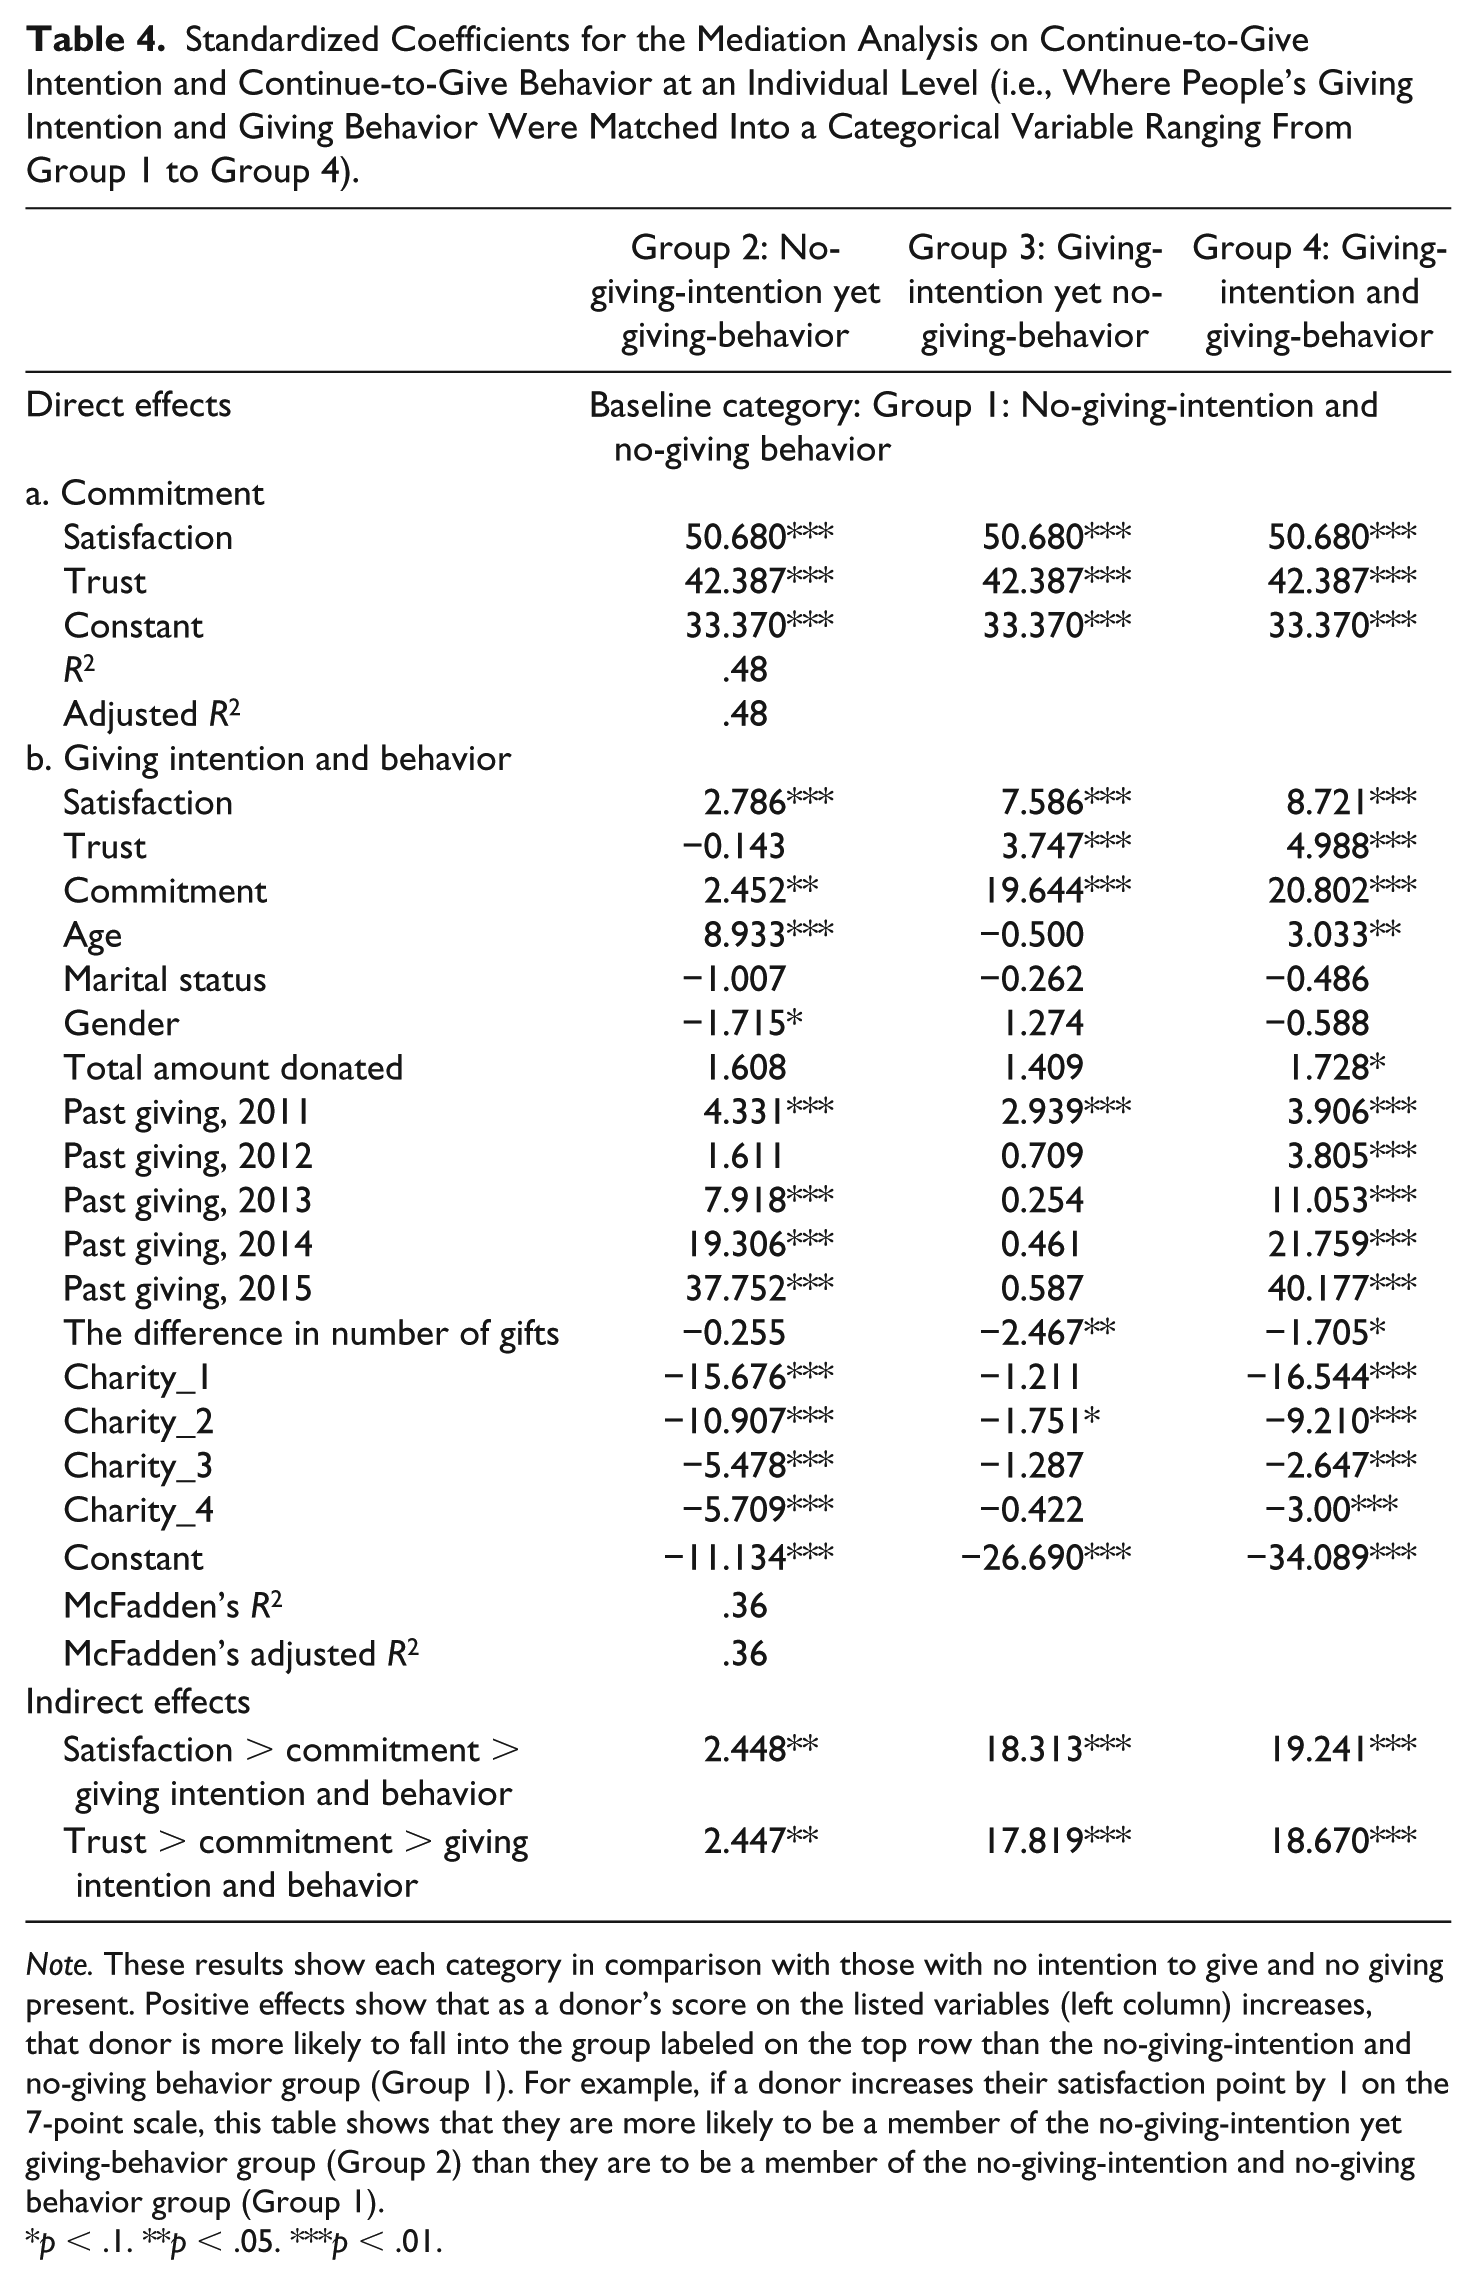
Note. These results show each category in comparison with those with no intention to give and no giving present. Positive effects show that as a donor’s score on the listed variables (left column) increases, that donor is more likely to fall into the group labeled on the top row than the no-giving-intention and no-giving behavior group (Group 1). For example, if a donor increases their satisfaction point by 1 on the 7-point scale, this table shows that they are more likely to be a member of the no-giving-intention yet giving-behavior group (Group 2) than they are to be a member of the no-giving-intention and no-giving behavior group (Group 1).
p < .1. **p < .05. ***p < .01.
Direct effects of satisfaction, trust, and commitment
The direct effects of satisfaction were significant when comparing Group 2 (no-giving-intention yet giving-behavior;β = 2.786, p < .01), Group 3 (giving-intention yet no-giving-behavior; β = 7.586,p < .01), and Group 4 (giving-intention and giving-behavior; β = 8.721, p < .01) with the baseline category, Group 1 (no-giving-intention and no-giving behavior).
The direct effect that a one standard deviation increase of satisfaction has on continue-to-give intention is about 3 times higher than the same effect it has on continue-to-give behavior. The direct effect of satisfaction in Group 2 (no-giving-intention yet giving-behavior) is significantly different from those on Group 3 (giving-intention yet no-giving-behavior; χ2(1) = 25.15, p < .001) and Group 4 (giving-intention and giving-behavior; χ2(1) = 73.77, p < .001). The direct effects of satisfaction on Groups 3 and 4 do not differ from each other, χ2(1) < .01, p = .976.
The direct effect of trust was nonsignificant when comparing Group 2 (no-giving-intention yet giving-behavior; β = −.143, p = .886) with the baseline category, Group 1 (no-giving-intention and no-giving behavior). The direct effects of trust were significant when comparing Group 3 (giving-intention yet no-giving-behavior; β = 3.747, p < .01) and Group 4 (giving-intention and giving-behavior; β = 4.988, p < .01) to the same baseline category.
The direct effect of trust in Group 2 (no-giving-intention yet giving-behavior) is significantly different from those in Group 3 (giving-intention yet no-giving-behavior; χ2(1) = 12.86, p < .001) and Group 4 (giving-intention and giving-behavior; χ2(1) = 48.65, p < .001. The direct effects of trust on Groups 3 and 4 do not differ from each other, χ2(1) = .32, p = .569.
The effects of commitment were significant when comparing Group 2 (no-giving-intention yet giving-behavior; β = 2.452, p < .05), Group 3 (giving-intention yet no-giving-behavior; β = 19.644, p < .01), and Group 4 (giving-intention and giving-behavior; β = 20.802, p < .01) with the baseline category, Group1 (no-giving-intention and no-giving behavior).
The effect that a one standard deviation increase of commitment has on continue-to-give intention is about 8 times higher than the same effect it has on continue-to-give behavior. The effect of commitment on Group 2 (no-giving-intention yet giving-behavior) is significantly different from those on Group 3 (giving-intention yet no-giving-behavior; χ2(1) = 273.51, p < .001) and Group 4 (giving-intention and giving-behavior; χ2(1) = 613.42, p < .001. The effects of commitment on Groups 3 and 4 do not differ from each other, χ2(1) = 2.06, p = .151. These results replicate the findings from the group-level analysis. They confirm H1a and H2 and partially confirm H1b.
Indirect effects of satisfaction and trust through commitment
The indirect effects of satisfaction and trust through commitment are similarly significant. There is a significant indirect effect of satisfaction on whether people are in Group 2 (no-giving-intention yet giving-behavior; β = 2.448, p < .05), Group 3 (giving-intention yet no-giving-behavior; β = 18.313, p < .01), or Group 4 (giving-intention and giving-behavior; β = 19.241, p < .01). Similarly, there is a significant indirect effect of trust on whether people are in Group 2 (no-giving-intention yet giving-behavior; β = 2.447, p < .05), Group 3 (giving-intention yet no-giving-behavior; β = 17.819, p < .01), or Group 4 (giving-intention and giving-behavior; β = 18.670, p < .01).
The indirect effects of a one standard deviation increase of satisfaction or trust on continue-to-give intention (i.e., intended to give, but no giving present, or intended to give with giving present) are approximately 7.5 and 7.8 times higher than the indirect effect of satisfaction and trust on continue-to-give behavior.
The indirect effect of satisfaction through commitment on Group 2 (no-giving-intention yet giving-behavior) was significantly different from the same effects on Group 3 (giving-intention yet no-giving-behavior; χ2(1) = 247.19, p < .001) and Group 4 (giving-intention and giving-behavior; χ2(1) = 495.16, p < .001). The indirect effects of satisfaction on Groups 3 and 4 do not differ from each other, χ2(1) = 2.06, p = .151.
The indirect effect of trust through commitment on Group 2 (no-giving-intention yet giving-behavior) was significantly different from the same effects in Group 3 (giving-intention yet no-giving-behavior; χ2(1) = 237.37, p < .001) and Group 4 (giving-intention and giving-behavior; χ2(1) = 457.29, p < .001). The indirect effects of trust on Groups 3 and 4 do not differ from each other, χ2(1) = 2.06, p = .151. These results replicate the findings from the group-level analysis. These results together confirm H3a, H3b, and H4.
Conclusion
The results of our study confirmed that satisfaction, trust, and commitment all have positive direct effects on giving intention (full confirmation of H1a). Only satisfaction and commitment, but not trust, have positive direct effects on giving behavior (partial confirmation of H1b). The direct effect of trust is only significant in behavioral intentions, but not behavior and the positive direct effects of satisfaction and commitment on giving intention are between 3 and 8 times larger than on giving behavior (confirmation of H2). The indirect effects of satisfaction and trust are significant on both behavioral intention (full confirmation of H3a) and behavior (full confirmation of H3b). They are both about 6.5 times larger in giving intention than in giving behavior (confirmation of H4).
In addition, the previous recorded giving behavior of these individuals is considerably more predictive of behavior than behavioral intentions. Most surprising of all, and unexpectedly, we also found that 27% of our sample (n = 4,619) who did not think they were likely to give when answering the survey, decided to give anyway.
Taking these results together, we draw the following practical, theoretical, and empirical conclusions. Based on the direct effects on behavioral intention alone, it may seem that commitment should be the operational priority for practitioners. This is because the average score for satisfaction (M = 5.3), trust (M = 5.6), and commitment (M = 5.5) are about the same, but the effect size of commitment is 3 times higher than satisfaction, 4 times higher than trust, and almost 3 times higher than the strongest past behavior predictor. The same results would have been reached if a regular regression had been used to analyze the data based on a theoretical model where satisfaction, trust, and commitment are of the same causal function.
But when taking into account indirect effects and grounding the tests in behavior, a rather different theoretical picture and, hence, practical prescription emerges. Instead of commitment, past behavior becomes the strongest predictor. It is about 14 times stronger. Commitment is not much more important than satisfaction (1.3 times). In addition to a significant direct effect, satisfaction also has an indirect effect that can influence behavior. It is no longer a simple decision to increase satisfaction or commitment for their own sake, but to increase satisfaction to trigger the ripple effect that it has on behavior through commitment. When that is taken into account, satisfaction is 1.8 times more important than commitment.
What these conclusions suggest is that our theoretical understanding about what drives behavior (not just behavioral intention) needs to be developed much better. Presently, how satisfied, trusting, and committed donors feel seems to predict what they intend to do much better than what they actually do, while what people actually did in the past better predicts what they actually will do in the future. What this suggests is that the sector’s overreliance on factors driving intentions may have led to the potential neglect of other psychological processes that may also have the potential to drive behavior (i.e., supplementing the impact of previous giving).
None of the existing theoretical frameworks can explain why 27% of donors who did not intend to give then decided to give! It is possible that people consider the action of answering surveys themselves a voluntary action to help the charity, so they felt like they had “done their bit” and so did not have to do more. But when a donation solicitation later arrives at their door step and the memory of filling out the survey has faded, their satisfaction, trust, and commitment compel them to give again. It is also possible that a wide range of variables could affect whether a donor who did not intend to give at survey then gave at renewal. For example, a family member could have reminded them to give (Andreoni, Brown, & Rischall, 2003), they could have attended an event hosted by the nonprofit (Sargeant & Day, 2018), or they could have been influenced by the presence of other donors (Shang, Reed, & Croson, 2008). New theories need to be developed to account for this surprise finding and how any new factors might predict behavioral intentions versus behavior differently depending on the environmental context of the situation (Sargeant & Shang, 2017).
The understanding of satisfaction, trust, and commitment on intentions and behavior is not only relevant to researchers interested in giving. Researchers interested in a range of charitable actions can also benefit from it. For example, people can also follow charities on twitter, share charity news on Facebook, invite family and friends to charity fundraising events, volunteer their time, and so on. There are also other monetary actions that this research does not investigate, such as signing up to make a first donation, switching from one-time giving to monthly giving and remembering a charity in a will. Future research to investigate the impact of satisfaction, trust, and commitment in these additional and diverse contexts would be helpful.
We must also express a number of caveats that relate to our work. First, we acknowledge that the response rate to our survey was low (although in excess of current norms). Although we work with five different nonprofits and the demographics of our respondents are comparable with the U.K. national statistics, we cannot claim that our sample was in any way representative of the population as a whole. Second, we acknowledge that our sample of donors, although large in quantity, are not the most affluent givers. The mean total amount donated in our sample was £355.75. We, therefore, do not address so called mid-level or major gift contexts. Further studies exploring the factors that influence actual behaviors by these different groups would be warranted.
Finally, we acknowledge that our research is cross-sectional in nature. Although the mediation analysis framework enables its users to draw process-based conclusions (Hayes, 2018), more robust laboratory, field and longitudinal experimental methods can be used to further validate any causal nature of the relationships that we explored.
Footnotes
Declaration of Conflicting Interests
The author(s) declared no potential conflicts of interest with respect to the research, authorship, and/or publication of this article.
Funding
The author(s) received no financial support for the research, authorship, and/or publication of this article.