
Abstract
This article investigates the impact of hospital profit status on quality of care as measured by risk-adjusted, 30-day, inpatient readmission rates gathered by the Centers for Medicare and Medicaid Services. It also evaluates the association between inpatient readmission rates and market concentration, measured by the Herfindahl–Hirschman Index, and various hospital characteristics. It concludes that nonprofit (NP) hospitals have a statistically significant negative association with readmission rates because they can focus on their mission without intense pressure to make a profit. We find no significant association between quality of care and hospital market competitiveness nor any statistically significant evidence to reject the exogeneity assumption of NP status.
Introduction
In a high-cost and ever-changing regulatory environment, hospitals seek strategies to remain economically viable. A primary choice concerns tax status. Nonprofit (NP) and for-profit (FP) hospitals compete in the same markets but face different questions. Tax-exempt NP hospitals’ community benefit—specifically, charity care—is scrutinized, while FP hospitals are questioned about their concern for patients’ well-being. Some NP hospitals convert to FP status to improve access to outside financing and increase profitable services (Joynt, Orav, & Jha, 2014; Sloan, Ostermann, & Conover, 2003). Poorly performing FP hospitals may change to NP status or government ownership (Sloan, Ostermann, et al., 2003), especially in markets with large indigent populations, to increase tax benefits and gain new fund-raising avenues.
Which status provides better care? The academic literature has debated the question for decades. Some suggest that ownership status makes no meaningful difference (Malani, Philipson, & David, 2003; Sloan, 1998). A literature review (Eggleston, Shen, Lau, Schmid, & Chan, 2008) found that quality depends on not ownership but institutional context, including time, market, and region. Others argue that FP and NP organizational behavior differs significantly (Frank & Salkever, 1994; Hirth, 1999). The comprehensive review by Schlesinger and Gray (2006) found that market conditions, services, and external constraints differentially influence NP and FP behavior.
The vast majority of research comparing NP and FP hospital performance has focused on ownership conversions or individual procedures with mixed results (Sloan, Picone, Taylor, & Chou, 2001). One study associated conversion to FP status with improved financial performance and no change in quality of care (Joynt et al., 2014), but conversion was likely motivated by financial distress and subpar performance (Mark, 1999; Sloan, 2002). In their 1984-1991 study, McClellan and Staiger (2000) suggested that NP hospitals treat elderly Medicare patients with heart disease slightly better than FP hospitals do, and the difference in average mortality rates appears to be increasing. However, another study of elderly Medicare beneficiaries hospitalized for new heart attacks from 1985 to 1996 (Kessler & McClellan, 2002) found that, while patient health outcomes were virtually the same everywhere, hospital expenditures were approximately 2.4% lower in nonrural areas with both FP and NP hospitals. Dubrovinsky and Winter (2015) found preliminary evidence that quality varies more in FP hospitals than across NPs. Ben-Ner, Hamann, and Ren (2018) found that consumers using ownership status in their search for nursing homes chose FPs with increased likelihood; customers with better education were more likely to choose NPs over FPs; consumers who searched more in-depth and found information about nursing home lobbies less important for selection chose NPs with greater likelihood. Clearly, the impact of hospital status on performance remains uncertain.
The health care industry is in constant flux, with new laws, technologies, challenges, and frequent ownership conversions. We set out to determine the impact of ownership and other characteristics using current data to analyze the overall quality of care at a broad set of hospitals nationwide. Our study is rare in empirically investigating the still theoretically unclear effects of NP status based on readmission rate as a quality-of-care measure supported by Hansmann’s (1987) well-known contract-failure theory and the literature (e.g., Dharmarajan & Krumholz, 2017; Krumholz et al., 2017). Given the potential for unobserved state heterogeneity and reverse causality, we treat NP status as endogenous, then test for endogeneity using intuitive instrumental variables (IVs). We developed our study design, including independent, dependent, and control variables, and analysis in consultation with such health care professionals as Emergency Department (ED) and inpatient-unit physicians, notably extending recent studies (e.g., Birmingham & Oglesby, 2018).
Our study poses two main questions. First, does NP status 1 have a statistically significant impact on care quality? Here, we also investigate whether competition among hospitals and various hospital characteristics, such as the number of physicians or designation as a trauma center, have an impact. Second, is a hospital’s NP status endogenously determined?
Background
In the hospital industry, organizations can adopt one of two opposing tax statuses: FP or NP. Neither is viewed without bias. Hyman (1998) cited exploitation, diversion, and lack of community benefit as primary concerns about FP hospitals. Naturally, they are less likely than their NP counterparts to engage in low or negative-margin services, including charity care, education, and research (Ferris & Graddy, 1999; Sloan, 1998). Without considering the benefits they derive and the benefits to society from their tax payments, they are often criticized for diverting significant resources to nonpatient services, such as administration or marketing (Woolhandler, Himmelstein, & Lewontin, 1993). Critics allege that FP hospitals exploit their constituents by inducing demand, charging higher average prices, and “skimming the cream” off the marketplace by locating in affluent areas, offering only more profitable services, and/or selecting easier-to-treat patients (Barro, Huckman, & Kessler, 2006; Hyman, 1998; Norton & Staiger, 1994).
Meanwhile, NP hospitals are often viewed as less advanced and efficient than FPs. They are criticized for excess spending, profit generation, and inadequate community benefit. Note that NP hospitals may generate profits as long as they are not distributed to their owners (Hansmann, 1996).
Several factors complicate assessment of the relationship between hospital status and quality of care. Patients cannot provide reliable feedback on hospital quality because they are typically uninformed about treatment costs, efficacy, alternatives, and possible outcomes if they reject or purchase the treatment from another provider. Instead, the hospital sector must rely on efficient contracting and monitoring (Steinberg & Gray, 1993). To minimize conflicts between owners and managers, the FP model often employs ownership and profit incentives. While managers benefit directly from driving innovation, leading to a more efficient and profitable operation, the effect on care is uncertain. As NP hospitals disallow profit distribution to owners and scrutinize unusual management compensation, managers may shirk their duties or accrue nonpecuniary benefits.
From a stakeholder’s perspective, comparing the performance of various hospitals to make educated investment or purchase decisions is extremely difficult (Sloan et al., 2001; Steinberg & Gray, 1993). The public often perceives NP hospitals as less likely to exploit their power over patients (Arrow, 1963), and some believe that NP status improves care. Chesteen, Helgheim, Randall, and Wardell (2005) measured process quality in terms of organizational leadership, patient focus, staff focus, and knowledge management, and found it higher at NP nursing homes, although the input quality (case mix) was low. Similarly, Noe and Forgione (2014) found quality of care better at NP than FP hospices in terms of total cost per patient and mix of worker skills.
Ibrahim, Nathan, Thumma, and Dimick (2017) conducted a retrospective review of 5,122,240 Medicare beneficiaries and found that from 2008 to 2014, readmission rates declined for those who had targeted (total hip or knee replacements) or nontargeted (colectomy, lung resection, abdominal aortic aneurysm repair, coronary artery bypass graft, aortic valve replacement, mitral valve repair) procedures. For both, the reduction rate was most prominent after announcement of the Hospital Readmissions Reduction Program (HRRP) between 2010 and 2012. Hospitals that improved their readmission rate most were likely to be NP. However, Birmingham and Oglesby (2018) found HRRP equally effective at not-for-profit and proprietary hospitals, although they note that not-for-profit hospitals had lower 30-day readmission rates than proprietary hospitals in 2010 and 2012. Their bivariate summary analysis had no controls for case mix.
Joynt and Jha (2011) analyzed national claims data for Medicare patients with heart failure and found that between 2006 and 2007, those discharged from public hospitals (27.9%) had higher readmission rates than those discharged from NP hospitals (25.7%) (p < .001). Similarly, Tsai, Joynt, Orav, Gawande, and Jha (2013) analyzed data on Medicare patients discharged from 3,004 U.S. hospitals in 2009 and 2010 after one of six major surgeries (coronary artery bypass grafting [CABG], pulmonary lobectomy, endovascular and open repair of abdominal aortic aneurysm, colectomy, and hip replacement) and found that NP hospital readmission rates were more likely below the median (66.3% vs. 63.6% for FPs, p = .04). They found significant associations between readmission rates and hospital characteristics, including ownership, but like Birmingham and Oglesby (2018), their analysis omitted confounding factors, such as illness severity, and disregarded clinical significance. Our study, based on a large panel dataset, evaluates the association between readmission rates and market concentration using hospital financial and political variables and testing for endogeneity.
Moreover, our research builds on the well-established contract-failure theory. Hansmann (1987) argued that NPs typically arise when consumers feel unable to evaluate the quantity or quality of the service a firm provides due to the service itself or the circumstances of purchase or use. Sometimes, an FP firm has both the incentive and opportunity to take advantage of customers by providing less than was promised and paid for. NP leaders have less incentive to exploit because they cannot benefit personally. NPs have a survival advantage over FPs when the value of consumer confidence outweighs such inefficiencies as limited access to capital and poor incentives for cost minimization.
In analyzing the factors that differentiate FP and NP status in terms of output quality, Hansmann’s theory is particularly relevant to the current state of the hospital industry. Steinberg and Gray (1993) supported the theory’s relevance based on a somewhat dated relationship dynamic between physicians and hospitals. Our extensive discussions with medical professionals, such as physicians in charge of EDs, ED residents, and inpatient-unit physicians, validate our dependent, independent, and control variables.
Our argument is threefold. First, care delivery and quality result from factors that extend beyond physicians. Quality-of-care metrics, such as readmission rates, reflect the combined effect of various actors, including physicians, hospital staff, and hospital protocols. Any service difference between NPs and FPs must also be attributed to hospital designation and mission.
Second, when physicians refer patients for additional or specialized services, many factors come into play: the availability of such services at the referral center, the center’s level of expertise, its proximity to patients’ residences, patients’ access to a personal and family support system, and their insurance type and network. Patients covered by major Preferred Provider Organizations (PPOs) are likely to have a much larger pool of referral options than those covered by Health Maintenance Organization (HMOs). In many cases, referrals are redirected to another center than the one originally requested by the insurance company or its surrogate.
Third, information technology allows patients instantaneous access to reviews of medical centers and detailed information on the procedures they perform, so referral decisions can be collaborative. With a significant role played by factors beyond their control, the notion that physicians alone make and monitor health care decisions (Hansmann, 1987) is dated and confirms the applicability of contract-failure theory to NP hospitals. Essentially, an NP’s nondistribution constraint (NDC) offers patients special protection.
Hirth (1999) created a formal model that analyzes NP impact in markets with asymmetric information, where competition may come from both FPs and firms that obtain NP status to exploit their perceived trustworthiness. Focusing on NDC enforcement, he shows that under most of the conditions studied, NPs credibly signal quality, not only by providing high-quality services but by a spillover effect that improves quality in the FP sector. However, a combination of weak NDC enforcement and insufficient subsidies of NPs could result in a rise in NPs in disguise, leading to an equilibrium condition in which the overall quality is not improved by NPs. In summary, though past empirical evidence is mixed, theory largely predicts that NP status will positively affect hospital care. To the extent that readmission rate captures quality of care, we hypothesize the following:
As decisions about NP or FP status depend on state-specific characteristics, some of which are unobserved (e.g., attitude toward the inpatient care market, tax laws, regulations, availability of government donations and contracts), we cannot rule out the possibility that hospital status correlates with the error without testing for endogeneity (Goddeeris & Weisbrod, 1998). Another concern is the potential for reverse causality between our left-hand variables and some covariates. Simply put, NP status may be an endogenous variable, resulting in biased estimates of its effects on quality of care measured by readmission rates. Therefore, we hypothesize the following:
In quantifying hospital sector’s effect on care, we must account for other factors, such as competition among hospitals in a given market. According to Teisberg, Porter, and Brown (1994), . . . competition compels companies to deliver increasing value to customers. The fundamental driver of this continuous quality improvement and cost reduction is innovation . . . The United States can achieve universal access and lower costs without sacrificing quality, but only by allowing competition to work at all levels of the health care system. (pp. 131-132)
A company can outperform rivals if it can establish and preserve a difference (Porter, 1996), either by delivering greater value or creating comparable value at lower cost or both. Thus, the extent of competition among hospitals in a given market can be a strong indicator of care quality.
Empirical evidence on the effects of competition is mixed, in part because measures of quality and competition vary. The specific characteristics of the markets surveyed could also influence measurement. For example, in the English system, after reforms expanded patient choice and encouraged hospitals to compete within a fixed-price market, quality, measured as lower mortality rates, improved (Cooper et al., 2011). Other studies in various hospital settings found that competition lowered mortality rates and treatment costs and improved management performance (Bloom, Propper, Seiler, & Reenen, 2015; Kessler & McClellan, 2000; Rivers & Fotter, 2004; Robinson & Miller, 2014).
However, applying methods similar to Kessler and McClellan’s (2000), Gowrisankaran and Town (2003) found that competition affects patients differentially. As hospital competition increased, risk-adjusted mortality rates decreased for HMO patients and increased for Medicare patients. Mukamel, Zwanziger, and Bamezai (2002) found that increased competition in California from 1982 to 1989 increased risk-adjusted mortality rates.
These mixed results are consistent with a broad survey of econometric studies related to competition, primarily in the hospital sector (Gaynor & Town, 2012). While studies of Medicare patients indicated that competition has a positive impact on quality, in markets where firms set prices, some showed a positive impact, others the opposite, which is particularly confusing for the U.S. market with both regulated (Medicare and Medicaid) and market pricing. Here, we contend that as an outcome measure, readmission rate captures both the observable and unobservable aspects of quality.
Again seeking guidance from theory, we find that economic models primarily indicate that competition will improve quality 3 in markets with regulated prices, with quality increasing as prices increase (Gaynor, 2006). Under regulated prices, hospitals choose and compete for a level of quality that increases as long as prices exceed marginal costs. However, when prices are market-determined, the effects on overall welfare are uncertain, and relative impact on price and quality depends upon the demand elasticities for each. We make two basic assumptions. First, prices must exceed marginal costs. Assuming that demand does not respond to price, which is reasonable because health insurance largely insulates patients from prices, then competition will lead hospitals to optimize quality (Gaynor & Town, 2012).
Second, the extent of the Medicare/Medicaid market has an effect. According to 2009 statistics, hospitals covered by Medicare treat 40.9% of patients, and Medicaid accounts for 17.2% (Becker’s Hospital Review, 2016). Given the large proportion of hospital patients treated under a price-regulated structure, overall quality of care should increase unless it decreases steeply for non-Medicare/Medicaid patients. Kessler and McClellan (2000) and Gaynor (2006) found that quality of care for Medicaid beneficiaries increased with competition.
Data
We collected data on many variables from an array of sources: first, the American Hospital Association (AHA), which conducts an annual, nationwide survey of hospitals and validates the responses to produce the most reliable data available; second, the annual Centers for Medicare and Medicaid Services (CMS) Hospital Cost Report, which details Medicare-certified facility characteristics and use, costs, and charges, and includes balance-sheet and income-statement information from audited external financial reports. Cost-report values are controlled by Medicare-compliance audits and used by CMS and lawmakers to adjust and control payment rates and program costs. Third, to evaluate political influence, we collected data from the National Governors Association (NGA) for 2009, 2011, and 2013.
Data related to our response variable (inpatient readmission rate) first became available in 2009, and the AHA began providing hospital-level operational data after 2013. In the online appendix, Table A.1 lists all primary sources and related variables, and Table A.2 categorizes and describes them.
Dependent Variables
Following the literature, we use the risk-adjusted, 30-day, unplanned, readmission rate reported by CMS as a proxy for quality of care (Agency for Healthcare Research and Quality [AHRQ], 2015; CMS, 2015; Ding, 2014). It estimates the number of patients who were first discharged, then rehospitalized within 30 days for a related condition, whether medical, surgical, gynecological, neurological, cardiovascular, or cardiorespiratory. The rate is risk-adjusted to account for differences in patient characteristics that might increase the likelihood of readmission, including age, gender, medical history, and comorbidities.
Readmission rates are a critical measure of performance because higher rates can indicate missed opportunities to coordinate care and have a significant impact on the economy and health care costs, accounting for billions of dollars in annual Medicare spending (Medicare Payment Advisory Commission [MedPac], 2007). In response, the 2010 Patient Protection and Affordable Care Act (PPACA) introduced HRRP 4 to control costs. It levies financial penalties on hospitals with high readmission rates (Desai & Stevenson, 2012). In the United Kingdom, the National Centre for Health Outcomes Development (NCHOD; 2008) has published readmission rates for specific diseases to improve hospital quality since 1998.
The measure’s validity is a subject of considerable debate (e.g., Benbassat & Taragin, 2000; Brown & Bold, 2015; Clarke, 2004; Fischer et al., 2014; Joynt & Jha, 2011). The methods used to compute readmission have raised concerns about root-cause attribution, arbitrary time windows, and controversial inclusions and exclusions (McIlvennan, Eapen, & Allen, 2015). Note that some of these problems have been corrected in the risk-adjusted measure CMS uses. For example, Clarke (2004) questioned patient factors, such as comorbidity levels, and distinguishing between planned and unplanned readmissions, both of which the current 30-day readmission rate considers.
Another common theme recognizes that some readmissions are preventable. In a literature review, Benbassat and Taragin (2000) pointed out that between 9% and 48% of all readmissions are due to substandard care and cited randomized prospective trials showing that patient education, predischarge assessment, and domiciliary aftercare can prevent 12% to 75%. As this review predates the improvements in readmission measures (e.g., risk adjustment), current estimates may be higher. Tsai et al. (2013) found a modest but consistent statistically significant relationship between readmission rates and best practice measures, especially procedure volume and mortality, across all surgical procedures as reflected by Hospital Quality Alliance surgical score. They support policies that use surgical-readmission rates to grade and pay hospitals.
Krumholz et al. (2017) suggested that hospital quality contributes to lower readmission rates, independent of patient factors. Dharmarajan and Krumholz (2017) clarified the correlation between readmission rates and 30-day postdischarge mortality in a reply to comments on a previous study. They found that hospitals with declining readmission rates were more likely to have declining mortality rates across procedures. Their results help to validate the risk-adjusted readmission rate as a measure of quality by demonstrating its correlation with a second quality-of-care measure. In sum, we believe that readmission rate is an acceptable quality-of-care measure.
Independent Variables
To analyze the effect of ownership status on quality of care, we created an indicator variable based on whether or not the hospital is a registered NP. The Internal Revenue Service (IRS) assigns NP status under Internal Revenue Code (IRC) Section 501; the most common classification is 501(c)(3). NP organizations are exempt from income taxes but disallowed from distributing earnings to owners, so they are more likely to reinvest excess revenue in the organization. They are often exempt from property taxes and allowed to raise tax-deductible donations and offer tax-exempt bonds. As of 2015, the NP sector represented approximately 5.4% of U.S. gross domestic product, with hospitals accounting for about half of the sector’s revenues and expenses (McKeever, 2015).
We also investigate whether level of competition affects a hospital’s operational and financial performance and quality of care (Kessler & McClellan, 2000; Teisberg et al., 1994). Competition drives continuous improvements in care and cost reductions, which provide value to customers and society through improved outcomes. We measure competition in the hospital industry using the Herfindahl–Hirschman Index (HHI). We first define the market region for each hospital using Bing Maps to measure a 15-mile driving distance for urban and 20 miles for rural facilities. Using driving distance rather than radius is a novel approach that more accurately measures both direct competition and the cost to patients of switching hospitals. HHI is commonly calculated as,

where n is the number of firms in the market as defined by driving distance, and

Unlike the traditional HHI, which has a variable lower limit, this normalized index takes a value between 0 and 1, where the higher value represents less competition (greater concentration). This approach permits consistent comparison where the number of hospitals varies across regions and a more exact measure as we focus on the market concentration of individual NP hospitals (see Hirsch & Schumacher, 2005; Owen, Ryan, & Weatherston, 2007). The HHI measure establishes overall market concentration, while our normalized HHI captures the relative equivalence (or imbalance) in market share distribution. It determines a hospital’s market share based on its proportion of total licensed beds. We use inpatient volume to confirm the robustness of the results.
Control Variables
We control for several facets of hospital performance that might lower readmission rates. For example, we expect readmission rates to correlate negatively with Accreditation Council for Graduate Medical Education (ACGME) Resident Training Approval; hospitals with approved programs are more likely to follow stringent protocols and have higher overall quality. Likewise, we expect hospitals that offer magnetic resonance imaging (MRI) to have lower readmission rates because MRIs allow more accurate diagnosis and treatment. We also expect a negative correlation with higher staffing levels as measured by the number of full-time physicians, nurses, residents, and ED physicians. A large proportion of inpatient volume comes from the ED (Paul & Lin, 2012), and more staff enables patients to stay longer for more thorough testing and treatment to determine if and when they should be admitted (Paul & Lin, 2012; Relias, 2008). By the same rationale, we expect ED admissions and designation as a trauma center and/or an acute care hospital to correlate negatively with readmissions. Trauma and acute cases are generally not recurrent, thus less likely to lead to readmission than chronic cases.
Last, we control for number of beds, which may correlate positively with readmission based on the financial incentive to fill them or negatively because hospital size, as captured by the volume of patients served (for which number of beds is a good proxy), is associated with high-quality care. Specifically, learning-by-doing can explain the difference between hospitals’ risk-adjusted outcomes (Gowrisankaran, Ho, & Town, 2006). We test which of these effects prevail and discuss their impact under the “Results” section.
IVs
To test whether a hospital’s NP status is endogenously determined, we include IVs in our random effect (RE) and fixed effect (FE) models: the hospital’s financial performance as measured by return on assets (ROA) and the political party of the state’s governor, both likely to influence a hospital’s status but not its readmission rate.
To our knowledge, no single dataset includes all of the variables our analysis needed, so we collected information from a variety of sources (Table A.1 of the online appendix) and amassed a sample of 18,905 hospital-level observations, pooling data from 2009, 2011, and 2013. We lost 7,818 due to missing information on readmission rate (3,587), MRI service and trauma designation (2,905), and ROA (1,326), for a final sample of 11,087 observations. No noticeable bias resulted from the lost observations.
Econometric Specifications
This study explores the relationship between inpatient readmission rate and (a) hospital profit status and (b) competition (HHI-based number of beds). Our analysis starts with exogenously measured hospital status but later tests endogeneity. We developed all our models in close contact with experienced health care professionals and control for variables that measure key hospital characteristics. To address unobserved hospital heterogeneity, such as expectations regarding its own market power, we exploit the panel setting of our data. Our model of interest is expressed as,

where HospRead
it
measures the inpatient readmission rate at a given hospital i in time period t;
Assuming no correlation between
A hospital’s decision to adopt NP or FP status may depend on state-specific characteristics that may or may not have been observed. Without testing, we cannot exclude the possibility that the selected status correlates with the error term in Equations 1 and 2. Furthermore, reverse causality may arise between left-hand variables and some covariates. For example, increased investment of hospital resources in care delivery and services may improve patient health outcomes and reduce medical errors, leading to savings (Andel, Davidow, Hollander, & Moreno, 2012) that may support additional investment in quality care. Thus, a hospital’s profit status may be an endogenous variable, and our estimates of NP effects biased.
To address this question, we use two instruments: 3-year lagged terms of hospital financial performance and the state governor’s political party. We test the endogeneity of NP status in the panel setting by an RE/FE specification, where,


In the RE model, where NP status is the only endogenous variable, we estimate a generalized two-stage least squares (G2SLS) model, first regressing NP status on exogenous variables Xit and IVs. 5 We then regress HospRead on NP status estimated from Stage 1 and Xit, assuming no relation between the covariates and the unobserved heterogeneity. Theoretically, to identify the model, we have to include at least one IV for each endogenous variable. Here, we use hospital financial performance and governor’s political party with 3-year lags 6 as our IVs and statistically test their validity. Finally, we use a Durbin–Wu (Hausman-type) test to determine if any empirical evidence suggests that the NP status indicator should be treated as an endogenous variable. Below we explain our choice of IVs and why they are likely to influence hospital status but not inpatient readmissions.
Financial Performance
Financial performance measures include a hospital’s total margin, operating margin, ROA, cash flow, and return on investment (Collum, 2013). We selected ROA. Defined as net income divided by total assets, it is a ratio of output to input and provides a measure of financial efficiency. Liu, Jervis, Younis, and Forgione (2011) showed that it is negatively related to hospital financial distress and subsequent failure. Hospitals that use their assets poorly tend to have low output measures, resulting in a low ROA. Cash flow from operations diminishes, affecting the ability to hire and retain good medical personnel; acquire and maintain the latest medical technology, equipment, and facilities; and deliver on the mission. Hospitals with a high ROA will be more effective in each of these areas. FP hospitals strive to improve their financial performance, which may deter them from providing charity care (Ferris & Graddy, 1999), while NP hospitals must provide community benefits and may be less pressured by the bottom line. Thus, financial standing may be closely related to hospital profit status.
The factors that drive a status change are also relevant. A Congressional Budget Office (2006) report states, “Although nonprofit hospitals must provide community benefits to receive tax exemptions, there is little consensus on what constitutes a community benefit or how to measure such benefits,” which “include the provision of uncompensated care, . . . services to Medicaid patients, and . . . certain specialized services . . . identified as generally unprofitable.” Poorly performing NP hospitals may convert to FP status to avoid the burden and expense of providing community benefits and uncompensated care. Joynt et al. (2014) suggested that hospitals that convert to FP status perform better financially afterward, and Sloan, Ostermann, et al. (2003) found that chronically low profit margins and high debt-to-asset ratios precede conversion to FP status. In contrast, conversions from FP status follow a quick decline in margins. Ramamonjiarivelo et al. (2015) found that public hospitals, which play a community role similar to NPs’, are more likely to privatize under financial distress. Privatization is thought to reduce the cost to government entities of continuously funding hospitals operating at a loss, while keeping them open and preserving community access to care.
Poor financial performance, measured by operating margins in the previous year, largely motivates change from FP to NP or government ownership (Sloan, Ostermann, et al., 2003). Deterioration is usually sudden, especially in markets with a low percentage of privately insured patients, and thought to signal that a hospital should be sold. A change to NP status relieves the hospital from paying, not only income tax, which is less relevant as it is presumably not paying taxes on losses, but also property taxes. It can also issue tax-exempt bonds and raise tax-deductible donations. A hospital that is struggling financially or serving a significant indigent population may benefit from conversion to NP status.
Finally, let us consider the direct relationship between ROA and readmission rates. While the literature contends that high-quality care leads to improved financial performance (e.g., Weech-Maldonado, Neff, & Mor, 2003), we use a 3-year lagged ROA as our IV, so a relationship between financial performance and a measure of quality will not affect our modeling specifications. Furthermore, financial results have no direct positive or negative bearing, because low readmission rates merely reflect the proper use of services, structures, and policies.
Governor’s Political Party
Given the distinct missions of NP and FP hospitals, neither should dominate the market; a mix yields substantial private and social benefits (Marsteller, Bovberg, & Nichols, 1998). Nearby FP hospitals might induce NP hospitals to refrain from nonprice competition in terms of expensive technologies and amenities, while NP hospitals might prevent FPs from reducing their quality of care to cut costs. Governments can monitor local market conditions through community benefits assessments and other data collection to ensure the optimal mix and possibly influence the status of new hospitals and conversions. Opponents of conversion to FP status claim that FP hospitals provide fewer unprofitable services, such as care for the uninsured, medical teaching, and research, and are less accountable to the community than NPs (Claxton, Feder, Shactman, & Altman, 1997; Gray, 1991, 1997b). Proponents argue that any community losses are offset by financially strengthened institutions, increase in tax revenues, and freeing money for other charitable purposes. They support hospital owners in overserved markets who claim credit for shutting down redundant hospitals that NP boards were unwilling to close (Gray, 1997a).
Similarly, a change from NP to FP status takes assets and resources out of community control and privatizes them (Butler, 1997). NP hospitals receive substantial subsidies from federal, state, and local governments on the theory that they benefit their communities. Thus, state political leadership might take steps to prevent conversions motivated purely by financial considerations. For example, in the early 1990s, regulators voiced concerns that investor-owned hospital chains were acquiring NP hospitals at prices below market value. In response, between 1997 and 1998, 24 states and the District of Columbia passed legislation regulating the sale and conversion of NP hospitals (Leone, Van Horn, & Wedig, 2005). Consequently, the governor’s political affiliation could influence the number of NP and FP hospitals and hospital conversions and mergers in the state. Democratic leadership would probably be averse to NP-to-FP conversions (e.g., Robinson, 2003) and Republican leadership favors them (e.g., Shepherd, 2009; Stone, 1999).
This discussion also provides support for the identification assumption because these instruments have only an indirect effect on inpatient readmission rate through their relationship with hospital profit status.
Results
This article studies the impact on quality of care of (a) a hospital’s profit status as measured by inpatient readmission rate and (b) competition. NP status is treated as an endogenous variable to prevent estimation bias. Financial performance (ROA, lagged by 3 years) and politics (state governor’s party) are treated as IVs. Results derive from our preferred exogenous FE model (Table 1, column 2). Table A.3 of the online appendix presents summary statistics.
Effect of NP Status on Inpatient Readmission Rate.
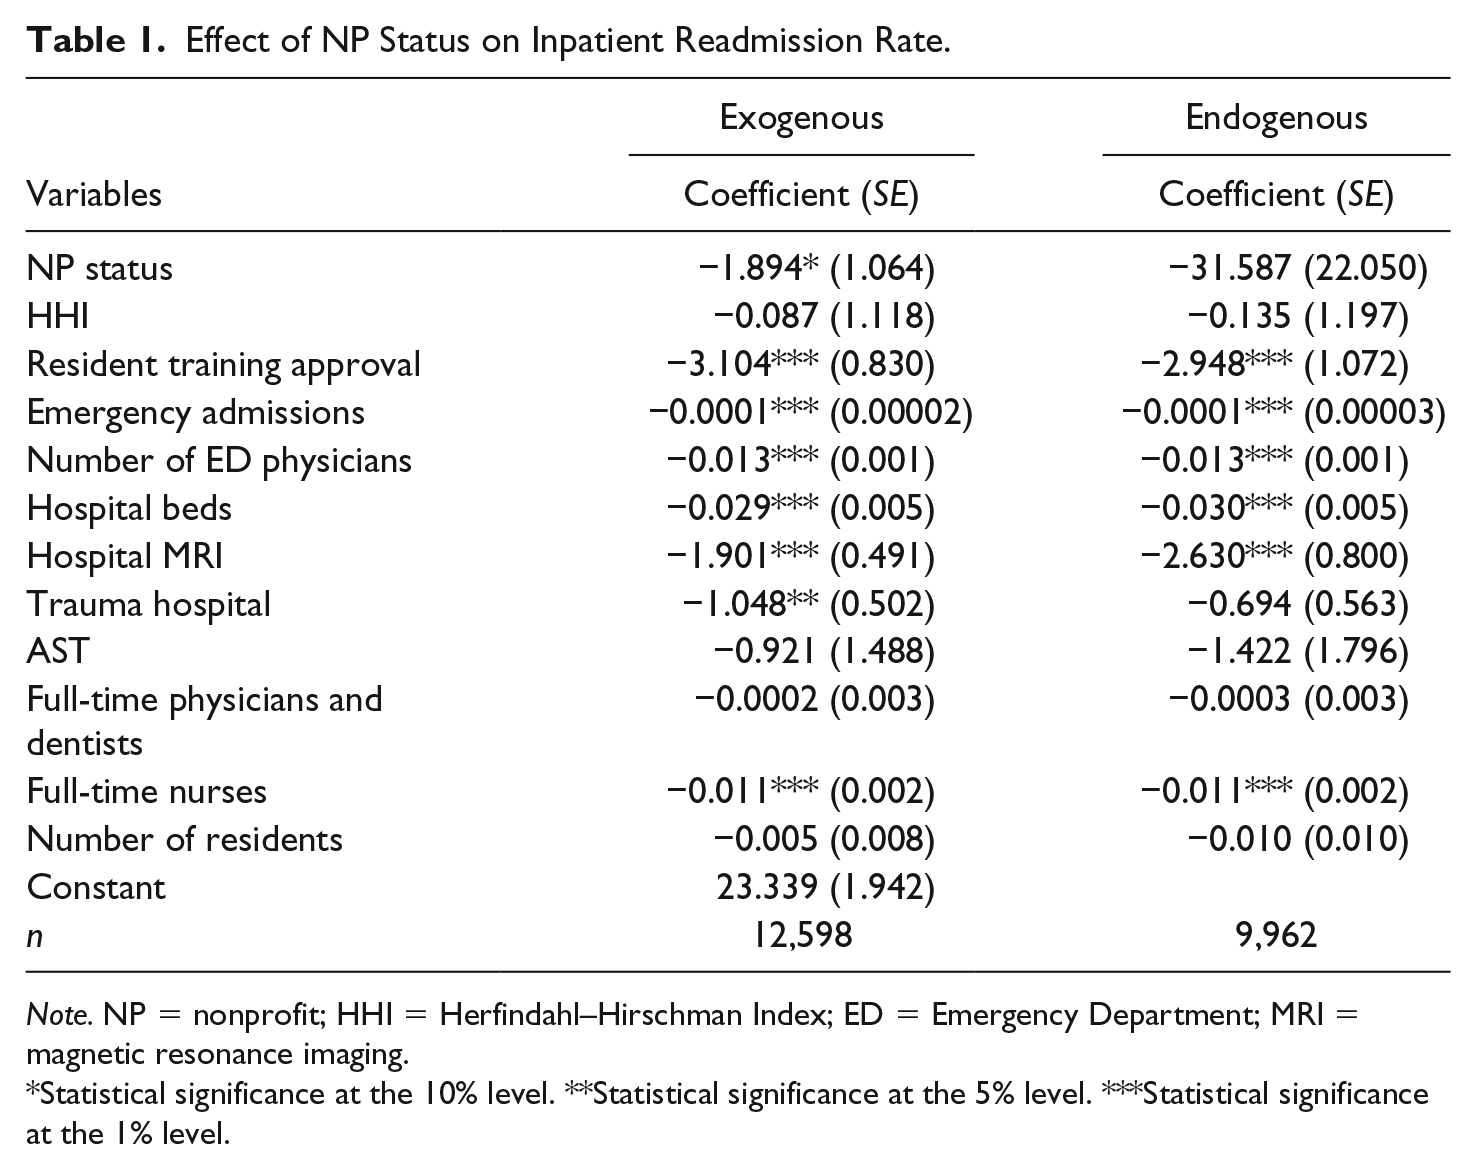
Note. NP = nonprofit; HHI = Herfindahl–Hirschman Index; ED = Emergency Department; MRI = magnetic resonance imaging.
Statistical significance at the 10% level. **Statistical significance at the 5% level. ***Statistical significance at the 1% level.
A few notes about the models and results: First, the Breusch–Pagan test comparing the RE and ordinary least squares (OLS) models provides some evidence of unobserved heterogeneity among hospitals (p < .01); second, a Hausman-type test comparing the RE and FE models indicates that the RE is inconsistent or misspecified (p < .01)—hence, an FE model is more appropriate; and finally, we observe no significant difference between models in the direction or magnitude of the estimated coefficients associated with variables that have a statistically significant impact on inpatient readmission rates.
Last, we discuss our findings that pertain to hospital characteristics 12 :
We find that inpatient readmission rates are significantly lower (p = .000) at hospitals with an ACGME-approved residency training program than at hospitals without it. Training hospitals may be less likely to discharge patients unless the care team agrees they are stable; DRG codes do not dictate length of stay. Our variable does not capture other residency programs, so we also consider the number of residents, but it is not associated with lower readmission rates.
The volume of emergency admissions has a statistically significant (p = .000) negative impact on inpatient readmission rate. Note that patients can be admitted to a hospital directly to receive a computed tomography (CT) scan or other similar screening. Direct admits need prior approval from the insurance provider. As the patient’s condition might worsen during the subsequent delay, this increases the likelihood of readmission. Testing and diagnosis are performed after the patient is admitted, resulting in longer average stays, which may pressure the health care staff and administration to discharge some who might benefit from additional monitoring and treatment, resulting in higher readmission rates. In contrast, EDs can conduct all required testing without waiting for approvals and without DRG constraints because they are often reimbursed on a fee-for-service basis, not DRG codes. Accurate diagnosis is more likely, 13 and the inpatient team can initiate treatment immediately, if the ED has not already done so. ED patients are more likely to be adequately treated and discharged within the “average” time frame of the related DRG codes.
The number of ED physicians has a statistically significant (p = .000) negative impact on inpatient readmission rate. Although physician-to-patient ratio determines the exact impact, increased staffing allows patients to stay for more thorough testing and treatment and more accurate determination of whether and when they should be admitted. Paul and Lin (2012) showed that adding one physician to the ED can significantly reduce overcrowding to positively affect care (Norouzzadeh et al., 2014).
The number of full-time registered nurses has a statistically significant (p = .000) negative impact on inpatient readmission rate. This result is logical and intuitive considering nurses’ crucial influence on patient care.
The number of hospital beds has a statistically significant (p = .000) positive impact on inpatient readmission rate. Given our discussion of the opposing effects of beds, we investigated which one holds and its economic impact on readmission rate. As the number of beds increases by 100 (representing a small hospital), the readmission rate increases 2.9%, which is statistically and economically significant. Patients once admitted to a hospital may later seek readmission through its ED. The pressure to keep beds occupied may lead to unnecessary readmissions, increasing the overall rate. Ozcan’s (1996) analysis of a sample of acute care hospitals in 319 U.S. metropolitan areas attributed 3% of health care costs to inefficiencies created by excess capacity. This problem provides one justification for certificate-of-need laws, which regulate the number of beds available to an optimal level.
Hospitals with MRI services have significantly (p = .000) lower readmission rates than those without. MRI scans are more sensitive and specific in detecting abnormalities at earlier stages than CT scans or ultrasound, improving patient diagnoses. Their availability likely results in prompt, appropriate treatment, reducing the need for readmission.
Hospitals with a trauma designation have significantly (p = .037) lower readmission rates than those without. Trauma centers increase the likelihood that ED visits are related to trauma, and treatment tends to be successfully completed during the initial admission. By extension, the higher the proportion of trauma patients relative to patients with chronic conditions, the lower the hospital’s overall readmission rate.
Conclusion
Using AHA and CMS data, we investigated the impact of hospital profit status on quality of care as measured by inpatient readmission rate. We also evaluated any association between readmission rate and market concentration, as measured by the HHI. Our findings are valuable to managers, grantors, investors, and other stakeholders in sustainable hospital performance and quality of care.
Our main finding is that NP status has a statistically significant negative impact on readmission rate. First, NP hospitals can focus on mission, while FPs experience intense pressure to maximize profits. Second, such factors as ACGME-approved training, number of ED physicians, and MRI services significantly affect a hospital’s readmission rates (see Note 9). We do not find statistically significant evidence that the competitiveness of the market in which the hospital operates significantly affects quality of care nor to reject the exogeneity assumption of a hospital’s NP status.
Our findings provide guidance to public policymakers in determining the legislative framework that will help NP hospitals provide community benefits and the impact of hospital conversions from NP to FP and vice versa. Our study also contributes to the literature evaluating conversions’ benefits to society (Goddeeris & Weisbrod, 1998). Specifically, because FP hospitals have a well-established financial performance edge, and our study establishes NPs’ edge in quality of care, we believe that a mix of FP and NP hospitals may improve market performance.
Supplemental Material
APPENDIX – Supplemental material for Does Hospital Status Affect Performance?
Supplemental material, APPENDIX for Does Hospital Status Affect Performance? by Jomon A. Paul, Benedikt Quosigk and Leo MacDonald in Nonprofit and Voluntary Sector Quarterly
Footnotes
Declaration of Conflicting Interests
The author(s) declared no potential conflicts of interest with respect to the research, authorship, and/or publication of this article.
Funding
The author(s) received no financial support for the research, authorship, and/or publication of this article.
Supplemental Material
Supplemental material for this article is available online.
Notes
Author Biographies
References
Supplementary Material
Please find the following supplemental material available below.
For Open Access articles published under a Creative Commons License, all supplemental material carries the same license as the article it is associated with.
For non-Open Access articles published, all supplemental material carries a non-exclusive license, and permission requests for re-use of supplemental material or any part of supplemental material shall be sent directly to the copyright owner as specified in the copyright notice associated with the article.