
Abstract
The nonprofit starvation cycle raises a fundamental question about the impact of overhead spending on nonprofit program outcomes and organizational effectiveness. We test this relationship using data on the U.S. nonprofit arts and cultural subsector from 2008 to 2018. Contrary to the conventional wisdom that lower overhead is better, the results of different model specifications consistently show an optimal level of overhead captured by an inverted U-shaped relationship between the overhead cost ratio and program outcomes. Increased spending on overhead can improve program outcomes up to the optimal point. Beyond this point, further spending on overhead can yield negative returns. The study contributes to correcting the unrealistic expectations surrounding overhead costs and argues for investing more in building sustainable nonprofit capacity. We discuss the implications of our findings for nonprofit charity monitors, donors, scholars, and other stakeholders concerned about nonprofit accountability and effectiveness.
Keywords
The nonprofit sector suffers from a widespread debilitating phenomenon of underfunding organizational infrastructure, called the starvation cycle. First noted in the Nonprofit Overhead Cost Project (Wing & Hager, 2004) and discussed later at length by Gregory and Howard (2009), the cycle describes what happens when a “self-reinforcing feedback loop” of unrealistic donor expectations, competitive pressures, and misleading reporting plagues nonprofit organizations (Lecy & Searing, 2014). The cycle starts with donors’ long-held unrealistic expectation that lower overhead is better. The desirability of leaner organizations in the donor market puts pressure on nonprofits to reduce their overhead spending. Seeking a competitive advantage, nonprofits underreport how much they spend on overhead, further feeding donors’ skewed expectations. When these three forces meet, they create a cycle that slowly but steadily starves nonprofits and erodes their organizational infrastructure (Figure 1). Inherent in the cycle is the argument that overhead helps nonprofits build robust infrastructure critical for their productive capacity and organizational effectiveness. Persistent underinvestment in staff skills and training, financial and information technology systems, and fundraising, among other essential overheads, supposedly weakens nonprofits’ ability to serve their beneficiaries and achieve their missions.
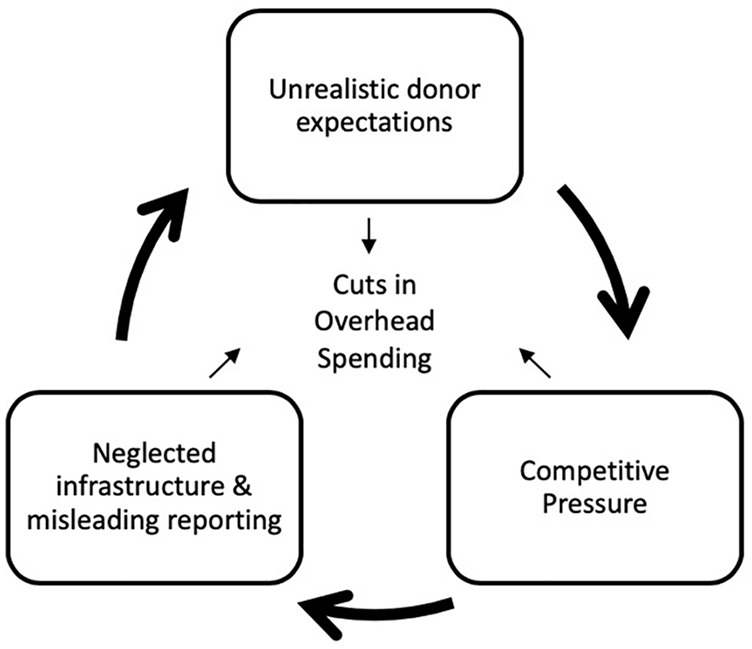
The nonprofit starvation cycle.
Despite the warning signals from the cycle and relentless emphasis of scholars and practitioners on the role of overhead in enhancing nonprofit effectiveness, empirical evidence that validates the anecdotal link between overhead spending and nonprofit program outcomes is limited. Prior studies have primarily focused on the relationship between overhead expenses and charitable contributions, confirming, with very few exceptions, a negative impact (e.g., Jacobs & Marudas, 2009; Trussel & Parsons, 2007). Case studies based on interviews with nonprofit managers and analyses of IRS Forms 990 have established the empirical basis for the relationship between overhead and organizational effectiveness (e.g., Wing & Hager, 2004). However, their findings have limited generalizability and do not rule out rival explanations (e.g., financial conditions and reputation). To our knowledge, Marwell and Calabrese (2014) made the first attempt to examine this relationship quantitatively. They conducted a difference in means test (t test) of 27 child welfare nonprofits and found that organizations with higher overhead rates have better safety and well-being performance. However, as they acknowledge, their finding is limited because the t test also does not rule out the effects of factors other than overhead spending on performance. Relatedly, Kim (2016) tested the linear impact of administrative spending on program outcomes but found no significant association between the two variables.
In this study, we examine the yet unanswered question of whether overhead spending affects nonprofit program outcomes. Instead of a linear relationship, we argue that overhead has a curvilinear (inverted U-shaped) impact on outcomes. We derived this hypothesis by drawing on two competing perspectives among organizational theorists about the role of overhead in performance. While agency theorists explain why donors may perceive overhead as wasteful and a diversion of funds from programs, other organizational theorists emphasize that funding overhead is crucial for capacity-building efforts. This debate hints at the existence of an optimal point of overhead that provides a balance between deprivation and wasteful spending (Bowman, 2006). We test this hypothesis using a panel data set of U.S. arts and cultural nonprofits from 2008 to 2018. The findings confirm the inverted U-shaped relationship between overhead spending and program outcomes and are robust to alternative model specifications. As overhead spending increases, program outcomes improve until reaching the optimal point, when they begin to decline.
This study validates the claim central to the starvation cycle that underfunding overhead hurts nonprofits’ ability to deliver program services and achieve their missions. It also adds evidence that overfunding overhead leads to negative returns in program outcomes. The findings contribute to the growing literature on nonprofit financial management and extend theoretical understanding of the importance of overhead in building nonprofit capacity as well as the agency problems from accumulating overhead funds. They also have implications in decreasing the reliance on the overhead cost ratio as an indicator of efficiency, both in research and practice.
The Rise of Overhead Cost Ratio
Overhead costs, also called indirect costs, are expenses related to activities that undergird an organization’s programs but cannot be directly linked to them. According to the Financial Accounting Standards Board (2021), these expenses include management and general costs such as executive salaries, accounting fees, marketing expenses, fundraising costs, and membership development costs. The proportion of overhead expenses out of total expenses or total revenue provides the overhead cost ratio (Bowman, 2006).
Financial ratios have gained currency as a result of several factors, including the professionalization of the nonprofit sector and the consequent adoption of new management practices, accounting systems, performance metrics (Salamon, 2012), the proliferation of easily accessible financial information (Frumkin, 2002), and the growing pressures on nonprofits to justify their spending (Liket & Maas, 2015). The rise of charity monitors such as GuideStar, Charity Navigator, and the Better Business Bureau (BBB) has also influenced the widespread use of financial ratios. After a series of highly publicized scandals, these groups have picked up on the public demand for greater accountability and created profiles that compare nonprofits relying exclusively on financial information (Liket & Maas, 2015; Wing & Hager, 2004). Charity monitor guidelines have promoted the acceptance of certain financial efficiency levels by spelling out the spending percentages nonprofits are expected to maintain. For example, Charity Navigator recommends that nonprofit organizations not spend more than 25% of their budget on overhead (Charity Navigator, n.d.). In many cases, grant requirements also explicitly state a certain level of financial efficiency to which a nonprofit will be held accountable, further promoting the dependence on financial ratios (Wing & Hager, 2004).
The overhead cost ratio has been increasingly used as a de facto proxy for nonprofit efficiency and comparative effectiveness (Ashley & Van Slyke, 2012; Lecy & Searing, 2014). In the absence of meaningful tools to evaluate effectiveness, donors have relied on the overhead cost ratio to identify and compare nonprofits that make the most efficient use of resources. A lower overhead has been considered an indicator of higher organizational efficiency. Consequently, donors have utilized the ratio to hold nonprofits accountable as stewards for their contributions.
Scholars and practitioners have lamented the undue reliance on the ratio contending that a low overhead does not imply organizational efficiency or effectiveness (Bowman, 2006; Coupet & Berrett, 2019; Hager & Greenlee, 2004). A nonprofit with higher overhead could be more effective than a nonprofit with lower overhead (Crutchfield & Grant, 2008). As Mitchell and Calabrese (2019) argue, the overhead cost ratio lacks the predictive and construct validity that justifies using it as a proxy for organizational efficiency and effectiveness. However, experimental evidence shows that donors strongly favor nonprofits with a low overhead ratio regardless of their effectiveness in achieving their missions (Metzger & Günther, 2019). This conventional view has made donors overhead averse, reducing their donations to nonprofits with high overhead (Jacobs & Marudas, 2009; Posnett & Sandler, 1989; Qu & Daniel, 2021; Tian et al., 2020; Weisbrod & Dominguez, 1986).
Is Less or More Overhead Better? Theory and Evidence
The increasing reliance on the overhead cost ratio has raised a fundamental question about the potential impact of overhead on nonprofit program outcomes and organizational effectiveness (Gregory & Howard, 2009; Kim, 2016; Marwell & Calabrese, 2014; Wing & Hager, 2004). To answer this question, it is necessary to revisit two competing perspectives among organizational theorists about whether higher or lower overhead is better. On one side are those who argue that increased overhead spending improves organizational effectiveness and overall performance (Cyert & March, 1963; Pfeffer & Salancik, 1978; Thompson, 1967) through its crucial role in building nonprofit capacity (De Vita & Twombly, 2001; Light, 2004). A high overhead, they contend, enhances nonprofit adaptive capacity by providing a cushion in cases of financial distress that allows nonprofits to cut spending on administrative expenses before scaling back their program services (Tuckman & Chang, 1991). Overhead spending also contributes to strengthening the leadership capacity needed to provide direction, promote an organization’s mission, secure grants and donations, and attract customers (Millesen et al., 2010). Evidence shows that offering competitive executive salaries draws professional and highly skilled personnel, an investment that yields positive outcomes for nonprofits (Crutchfield & Grant, 2008; Pallotta, 2008). Unable to pay such salaries, nonprofits make do with less qualified hires or volunteers, limiting their ability to develop strong leadership conducive to success.
In addition to its role in building adaptive and leadership capacity, overhead augments nonprofit management (e.g., staff development and training) and technical capacity (e.g., information technology, financial and risk management, performance measurement, and evaluation; Millesen et al., 2010). Providing training and development opportunities decreases staff turnover and sustains the commitment and engagement necessary for effective service delivery (Wing & Hager, 2004). Similarly, investing in information technology enhances mission-related impact and organizational performance (Hackler & Saxton, 2007). Without reliable performance tracking systems, nonprofits face challenges identifying the specific action that leads to their desired outcomes. This presents a predicament for nonprofits as donors are unwilling to fund the tracking systems needed to produce the outcome data they want to see before granting support (Gregory & Howard, 2009). Fundraising, like advertising, helps organizations disseminate information about nonprofits and their missions, broadening their outreach and attracting more service users (Trussel & Parsons, 2007).
Prior studies confirm that lowering overhead hurts financial capacity (Chikoto & Neely, 2014), increases financial vulnerability (Park & Matkin, 2020; Trussel, 2002), and reduces environmental resilience (Mitchell, 2016). Additional research shows that underinvestment in overhead inhibits organizational learning (Ebrahim, 2005) and diminishes nonprofit utility (Burkart et al., 2018). The strong emphasis on low overhead can also push nonprofits to misreport their actual spending (Froelich et al., 2000), consequently feeding the starvation cycle.
On the other side of the debate are agency theorists who warn that high overhead can be a symptom of agency problems that create inefficiency and hurt performance (Fama, 1980; Jensen & Meckling, 1976). Agency theorists view an organization as a set of contractual relationships that aim to align the diverging interests of principals and agents (Jensen & Meckling, 1976). In a context of information asymmetry where donors are less informed about how funds are managed, nonprofit managers, acting as agents, may exploit resources for their self-interest and spend more than what is required for the efficient production of services (Krishnan et al., 2006). Managers may engage in shirking, take implicit compensation, or divert resources from programs to activities peripheral to the mission, creating agency losses for their organizations (Krishnan et al., 2006). Without effective monitoring, the risk of incurring agency losses increases (Krishnan et al., 2006). Indeed, some nonprofits have made the headlines for allegations of mismanaging financial resources by paying large amounts of money for corporate solicitors, taking either multiple salaries or consultation fees, or signing fundraising contracts with family members or friends (Hundley & Haggart, 2017). For example, the Wounded Warrior Project, a charity for wounded veterans, was scrutinized by the media in 2016 for lavishly spending millions of dollars a year on conferences and other travel-related expenses (Philipps, 2016). Given this view, a low overhead could provide a monitoring mechanism for donors and other stakeholders to ensure that their contributions are devoted to programs that maximize social impact.
We argue that neither view completely captures the nature of the relationship between overhead spending and program outcomes. If overhead is essential for nonprofit capacity and organizational effectiveness, one can assume that “the more overhead, the better.” However, the assumption of a linear relationship between overhead spending and outcomes does not align with agency theory. From an economic efficiency perspective, there must be a limit beyond which further increases in overhead may negatively influence outcomes. We propose that overhead spending has an optimal level between the two extremes of underfunding or overfunding overhead (Figure 2). Increased overhead spending can improve nonprofits’ program outcomes up to the optimal point. Beyond this point, spending on overhead can have negative returns on program outcomes.
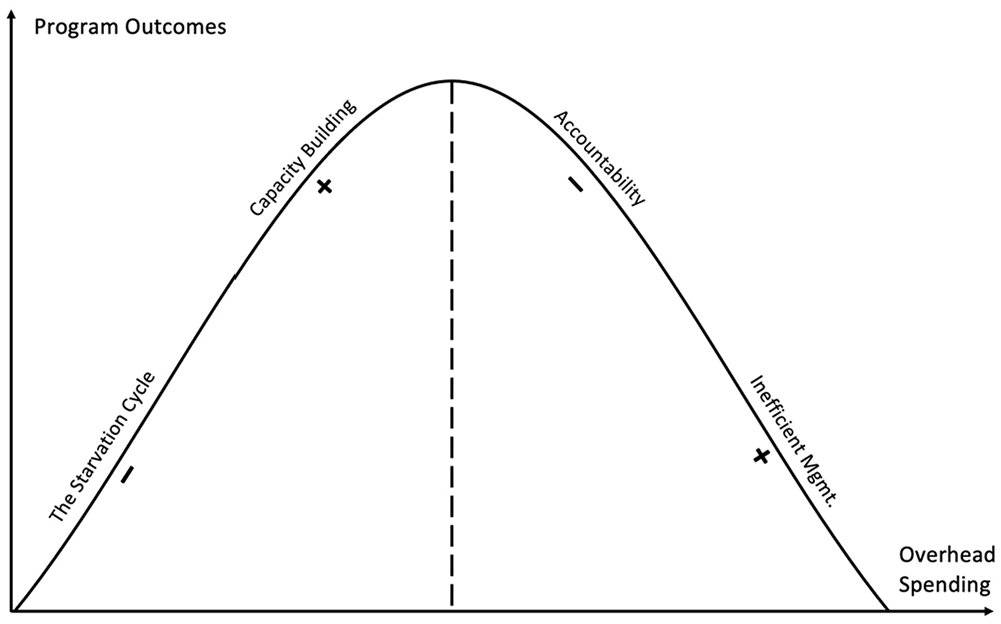
Curvilinear relationship between overhead spending and program outcomes.
Arts and Cultural Nonprofits
The U.S. arts and cultural subsector is ranked third in reliance on private donations, which comprise 44% of its total income (McKeever et al., 2016). The high dependence on private contributions makes arts nonprofits susceptible to donor pressures to cut overhead and, inevitably, trigger the starvation cycle. Evidence shows that the average overhead ratio in the arts and cultural subsector declined from around 35% in the late 1980s to slightly above 25% in 2007 (Lecy & Searing, 2014), falling ten percentage points in that 20-year period. The pressures are further exacerbated by arts nonprofits’ competition for limited resources with other nonprofits that offer more essential services such as health and education and for-profit firms that provide similar services. Giving USA Foundation (2019) shows that only 5% of philanthropic contributions go to arts and cultural nonprofits.
Just like other types of nonprofits, arts organizations need to spend on overhead to deliver quality services. Organized venues, refined decoration, well-trained staff, to name a few, are necessary for art appreciation, all of which require investment in overhead. Free programs, such as workshops, classes, lectures, and arts-based outreach, also need administrative support to ensure a quality experience for attendees. Moreover, marketing strategies are crucial to the success and sustainability of arts nonprofits. To attract more attendees, they must stay up to date with the ever-changing expectations of current and potential patrons of different ages, genders, and ethnicities. They must also develop strategies to engage new audiences while maintaining regular attendees’ loyalty (Bernstein, 2014). In sum, limited overhead spending could compromise art-goers’ experience and hinder the development potential of organizations, both of which lead to a decline in attendance.
Data and Measurement
DataArts
This study draws on longitudinal data (2008-2018) from DataArts (formerly the Cultural Data Project), an online survey that provides detailed financial, programmatic, and demographic information on U.S. arts and cultural nonprofits. The data set currently covers 13 states and the District of Columbia. 1 DataArts offers more detailed financial and programmatic information than IRS Form 990 data, which allows for examining the relationship between overhead spending and program outcomes.
Kim and Charles (2016) empirically confirmed the reliability of the data set and its usefulness in examining questions related to nonprofit organizational characteristics and outcomes, provided that researchers are cognizant of its limited representativeness. The richness and reliability of the data set have encouraged nonprofit researchers to use it to study various aspects of nonprofit financial and programmatic performance (Liu and Kim, 2021), charitable giving (Krawczyk et al., 2017), entrepreneurship (Alexiou et al., 2020), innovation (Ranucci & Lee, 2019), among others.
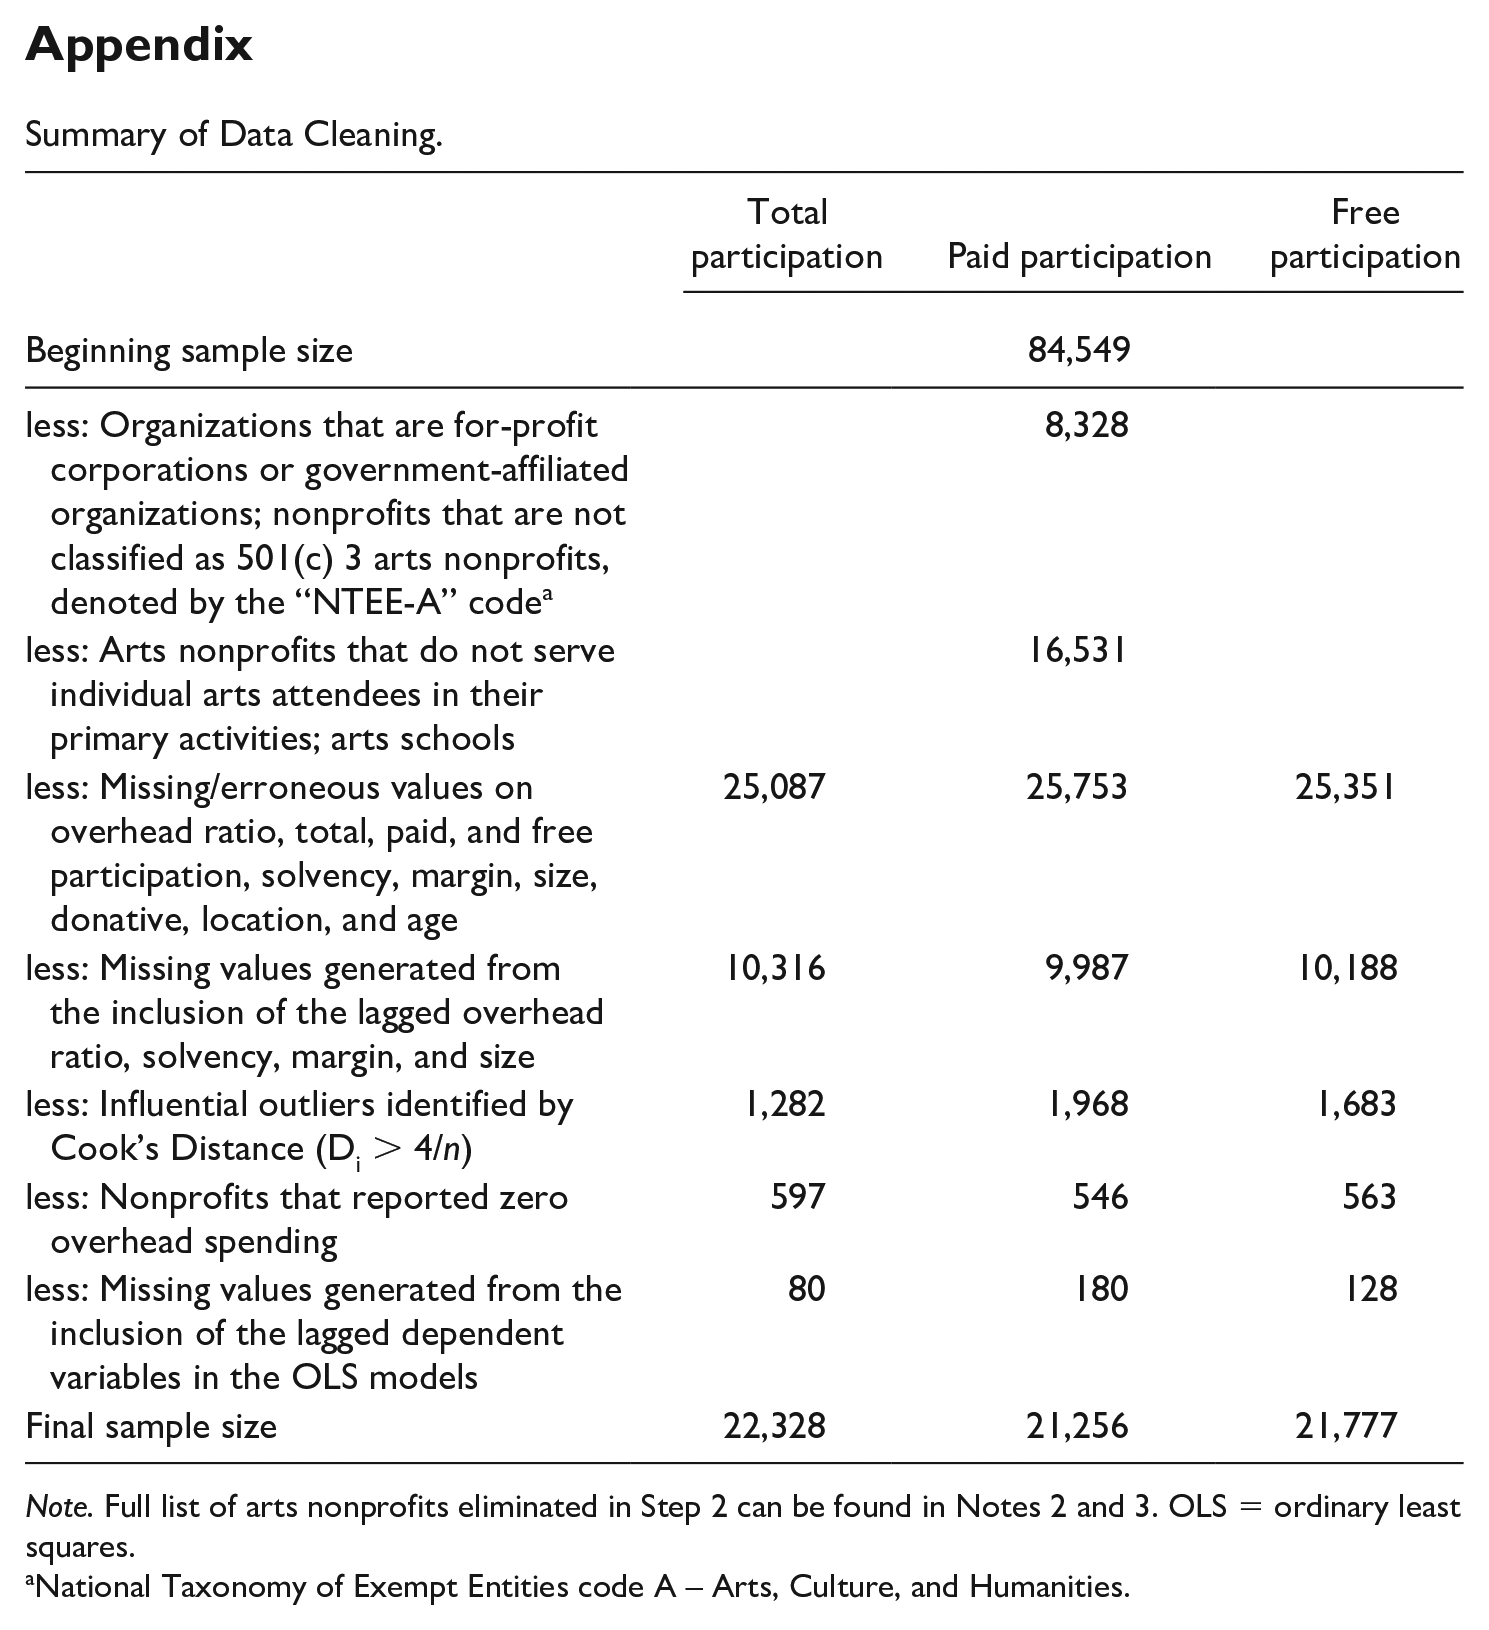
We take several steps to improve the data and measurement. To enhance the validity of our dependent variable, we restrict our sample to arts nonprofits that produce shows, exhibitions, and other cultural activities and primarily serve individual arts attendees. As a result, we exclude all the arts nonprofits that do not directly serve arts attendees in their primary activities 2 and art schools. 3
To minimize the effect of influential observations and outliers (Tinkelman & Neely, 2011), we employ an influence diagnostic known as Cook’s Distance. 4 A recent simulation analysis compared four commonly used approaches to address influential observations and found that Cook’s Distance is more efficient than winsorization and truncation (Leone et al., 2019). Cook’s Distance generates an index for all observations in a model based on how influential the observation is to the regression result (Montgomery et al., 2012). We drop all influential observations with a value that exceeds the recommended cutoff point 4/n, where n is the number of observations in the regression (Leone et al., 2019). We also eliminate all observations with zero overhead expenses because these data are often considered unrealistic and unreliable (Lu & Zhao, 2019).
The final sample sizes for total, paid, and free participation models are 22,328, 21,256, and 21,777, respectively. The slight final sample difference can mainly be attributed to Cook’s Distance identifying and eliminating different influential observations in the three models. A step-by-step data cleaning process can be found in the appendix.
Dependent Variables
We use in-person attendance as a measure of outcome. In the absence of comprehensive, systematic, and generally accepted tools to evaluate nonprofit effectiveness, we take advantage of the program information in the data set and use the number of attendees to measure outcomes. Researchers have increasingly employed this measure in evaluation and policy studies as a socially focused outcome that indicates individuals’ engagement in programs and services and strongly correlates with longer-term social outcomes (Dougherty, 2018). Similarly, several nonprofit studies, as well as arts management studies, have used the number of attendees as a valid measure of program outcomes and organizational effectiveness (Carman, 2010; Charles & Kim, 2016; Kim, 2016; Turbide & Laurin, 2009; White & Simas, 2008).
Given the nature and competitive dynamics in the arts subsector, attendance also reflects the quality of arts programs (Kim, 2016; Radbourne et al., 2010) and serves as a necessary intermediate outcome that facilitates the achievement of arts nonprofits’ missions (Urban Institute, n.d.). Without people attending their programs, arts organizations cannot realize the sector’s overarching goals of increasing the knowledge and appreciation of arts and culture and enriching people’s life experiences (see Figure 3). Whereas maximizing attendance may not be a priority for some arts nonprofits considering the heterogeneity of the sector and the diversity of missions, it still contributes to the sector’s ultimate goals of promoting understanding, strengthening social bonds, and enhancing the sense of community.

Outcomes sequence chart.
In this study, we test the effect of the overhead cost ratio on program outcomes in three different ways: total, paid, and free participation. Although a sizable portion of overhead expenses benefits both paid and free programs, the two types are likely to demand program-specific support. For instance, to maximize revenue, organizations are likely to allocate more resources toward marketing for paid programs. Therefore, we differentiate between paid and free program attendees to see whether they require different levels of overhead spending. We use the natural logarithm of attendance to make it more comparable across organizations.
Independent Variables
The primary independent variable is the overhead cost ratio. It is the sum of administrative and fundraising expenses divided by the total expenses. We calculate the ratio using expenses, instead of revenues, in the denominator to be consistent with charity monitor calculations. More importantly, having expenses in the denominator mitigates volatility as large donations can drive up nonprofits’ revenues (Bowman, 2006). To capture the hypothesized curvilinear relationship, we add the squared term of the overhead cost ratio in the model.
Control Variables
The empirical models control for various organizational characteristics, including financial indicators, revenue structure (donative/commercial), size (log transformation of total assets), age (years of operation), location, type, and fiscal year. We control for nonprofits’ financial performance because we expect that better financial conditions in the previous year lead to more program spending, ultimately improving attendance. We measure nonprofits’ long-term and short-term financial performance using solvency and operating margin, respectively. Solvency evaluates an organization’s ability to stay in business, that is, to repay its debts when they become due. It is calculated as the total net assets divided by total revenue (Tuckman & Chang, 1991). Operating margin is the short-term financial measure, which is defined as the net profit divided by unrestricted operating revenue. It measures how much return a nonprofit generates through its routine activities (Finkler et al., 2016).
In addition, we control for revenue structure as previous studies indicate that government and foundation grants tend to underfund overhead (Ecer et al., 2017; Gregory & Howard, 2009), and individual donors are more likely to give to nonprofits with lower overhead ratios (Gneezy et al., 2014). Relying predominantly on these income sources can compromise nonprofits’ program outcomes. Following Hansmann’s (1980) dichotomy of “donative” and “commercial” nonprofits, we add a binary variable, donative, to identify nonprofits that generate more than 50% of their revenues from donations and grants. We also control for organizational size and age as larger and older nonprofits are likely to attract more attendees.
Finally, we control for location and organization type. The demand for arts services may vary across different geographical regions. Urban and suburban areas may have a greater demand for arts than rural areas. To capture the difference, we use the survey item that asks arts nonprofits, “from where do you draw your primary audience?” as a proxy for location because an organization is likely to draw its audience base from where it is located. Similarly, attendance is likely to vary among arts nonprofits depending on service capacity and intended audience. To distinguish between these types, we use the National Standard for Arts Information Exchange (the Standard). The Standard was developed in the 1980s to facilitate data collection for arts activities in the United States and ensure the comparability of data collected (National Assembly of State Arts Agencies, 2015). We adopt the classification that categorizes arts organizations based on the primary area of work. We collapsed the 15 categories into four broad groups: multidisciplinary, visual arts, performing arts, and other. Detailed grouping information is summarized in Table 1.
Summary of All Variables.
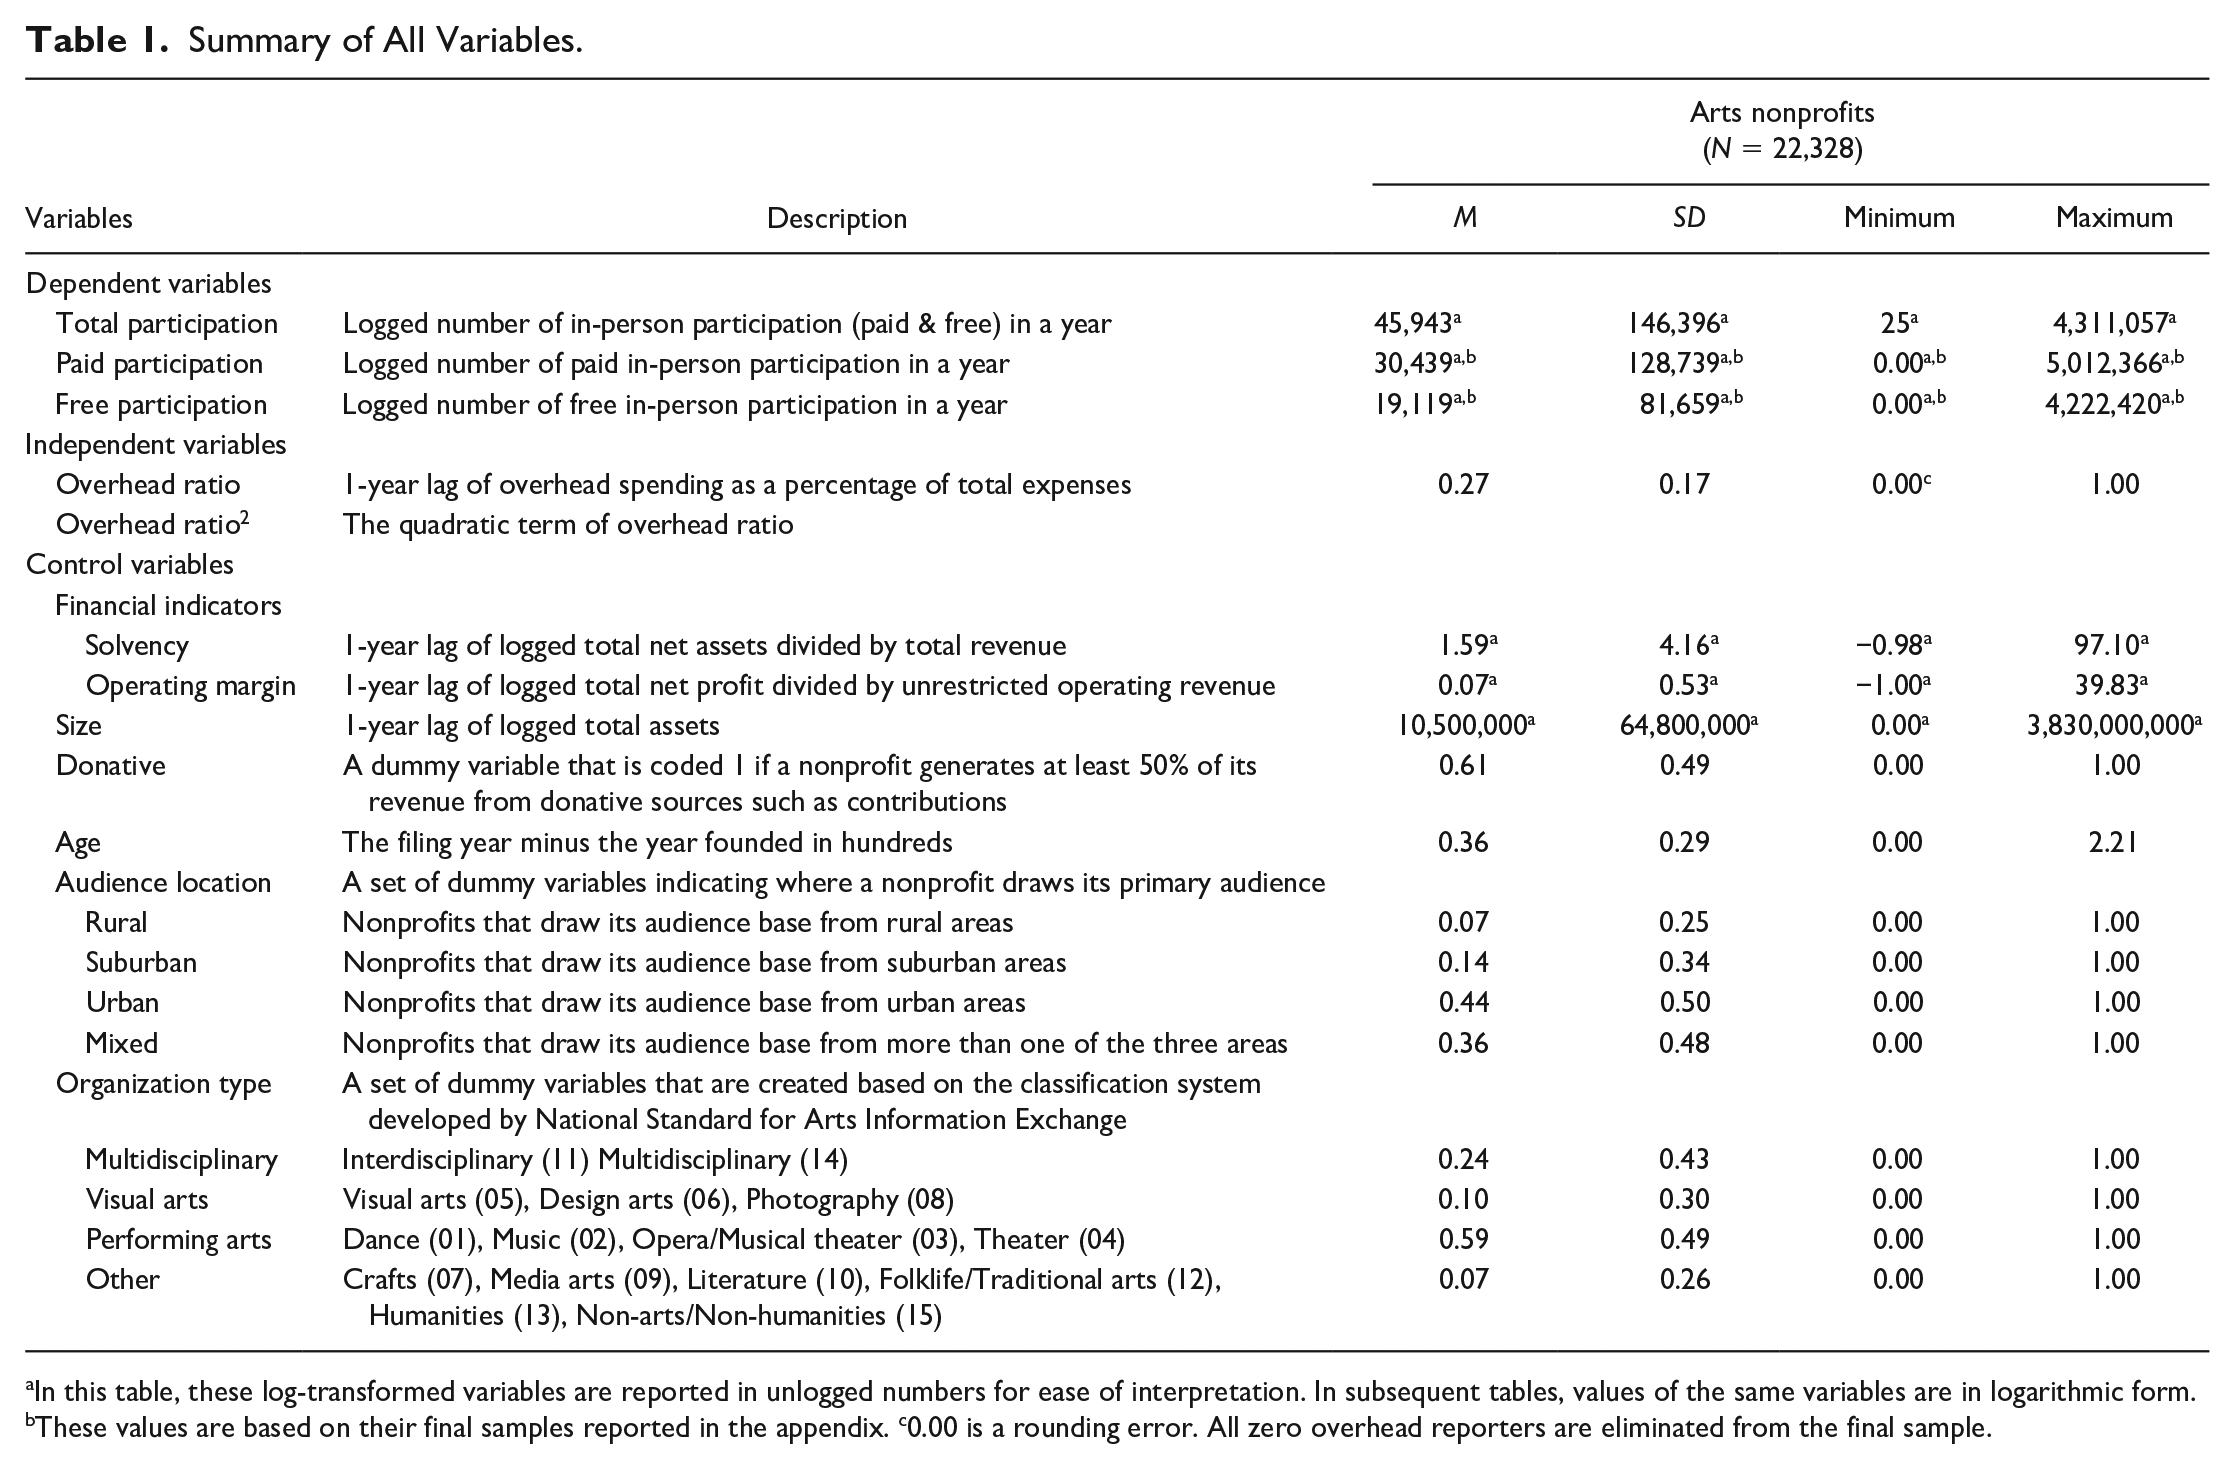
In this table, these log-transformed variables are reported in unlogged numbers for ease of interpretation. In subsequent tables, values of the same variables are in logarithmic form. bThese values are based on their final samples reported in the appendix. c0.00 is a rounding error. All zero overhead reporters are eliminated from the final sample.
Findings
Descriptive Findings
We present summary statistics in Table 1, including variable definitions, means, standard deviations, minimums, and maximums. All dollar values used to calculate financial-related variables are converted by the Consumer Price Index (CPI) to 2016 dollars. A typical organization in the sample serves 45,943 attendees per year, spends 27% of its total expenses on overhead, possesses about US$10 million assets, and has been in operation for 36 years. These nonprofits are generally solvent, demonstrating their ability to meet long-term financial obligations. The operating margin shows that an average nonprofit in the sample generates only ¢7 profit for every US$1 of unrestricted operating revenue earned. Of all the nonprofits in the sample, 61% are donative (i.e., they derive more than 50% of their total revenue from contributions and grants), 44% of them serve urban populations, and 14% and 7% draw their primary audiences from suburban and rural areas, respectively. The rest attract audiences from a mix of geographical areas. More than half (59%) of the sample are performing arts nonprofits, 24% are arts nonprofits that produce interdisciplinary or multidisciplinary arts. Visual arts and other arts nonprofits, such as folk art, are also well-represented, with 17% of the sample collectively embodying these two types. Table 2 provides the correlations between variables. Without introducing controls, the overhead cost ratio is negatively and significantly correlated with total and paid participation and has no association with free participation. The table also confirms that collinearity is not a concern for our empirical models.
Correlation Matrix.
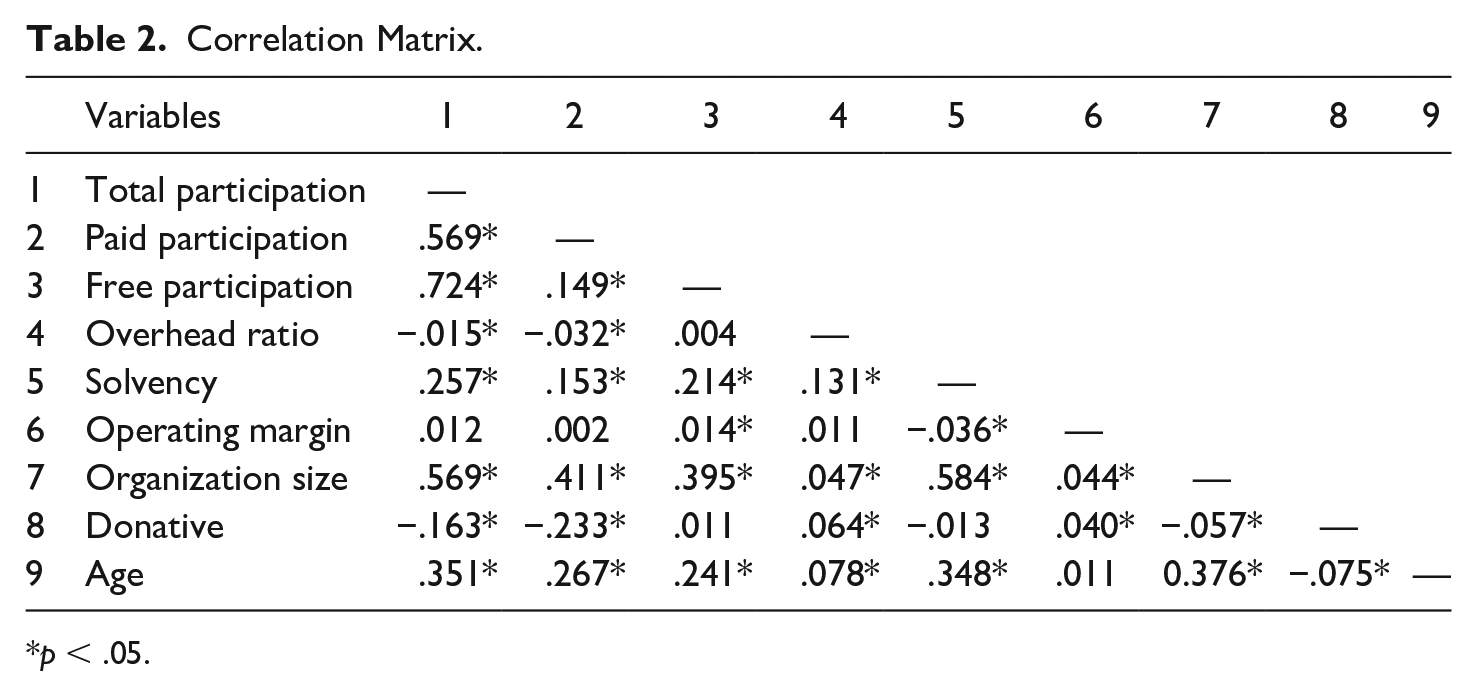
p < .05.
Regression Results
We conduct two sets of regression analyses—pooled ordinary least squares (OLS) with lagged dependent variable and fixed-effects (FE)—to explore the effect of overhead spending on arts nonprofits’ program outcomes, measured by in-person attendance with three specifications—total, paid, and free participation. To address endogeneity, we incorporate 1-year lagged values of all regressors in both models, except for dichotomous variables and age (Kennedy, 2008).
We first estimate the coefficients using pooled OLS and report the results in Table 3. We add the lagged dependent variable to account for potential autocorrelation (Wilkins, 2018), where the current year’s attendance can be partially determined by the past year’s due to customer loyalty and reputation. As shown in Table 3, all three model specifications have positive coefficients on the overhead cost ratio and negative coefficients on the quadratic terms, indicating an inverted U-shaped relationship between the overhead cost ratio and program outcomes. All these variables are statistically significant at the 99% confidence level. Specifically, when overhead spending is less than 34.6%—that is, –0.350/(2 × –0.505)—of total expenses, we find that increases in the overhead cost ratio improve program outcomes. However, when the share of overhead spending is larger than 34.6%, the relationship is reversed, that is, further spending on overhead worsens program outcomes. Similarly, the optimal points for paid and free participation are 42.6%—that is, –0.552/(2 × –0.647)—and 33.4%—that is, –0.474/(2 × –0.711), respectively. The table also reports beta coefficients, which allow for comparing each regressor’s relative strength. Unsurprisingly, both the overhead cost ratio and its squared term have a weaker impact on program outcomes than the lagged dependent variable and size; meanwhile, their effects are either on par with or slightly weaker than the financial indicators and age.
OLS Regression Results (2008-2018).

Note. Year dummies are included in each regression. OLS = ordinary least squares.
p < .1. **p < .05. ***p < .01.
Considering that the pooled OLS ignores unobserved organization-level heteroskedasticity, we employ FE to control time-invariant organization-specific characteristics, including inconsistent overhead allocation and reporting practices across organizations (Mitchell, 2017). We conduct a Hausman test, which also suggests that FE is more appropriate than random-effects. We drop three controls previously included in the OLS models—the lagged dependent variable and two time-invariant controls (i.e., location and organization type)—from the FE models. Including a lagged dependent variable in FE models leads to biased coefficients, especially in short panels (Kennedy, 2008; Nickell, 1981). A Monte Carlo simulation further reveals that the estimates remain seriously biased even when T = 30 (Judson & Owen, 1999). Location and organization type are omitted because FE models control for all time-invariant characteristics. We present the FE results in Table 4.
Fixed-Effects Regression Results (2008-2018).
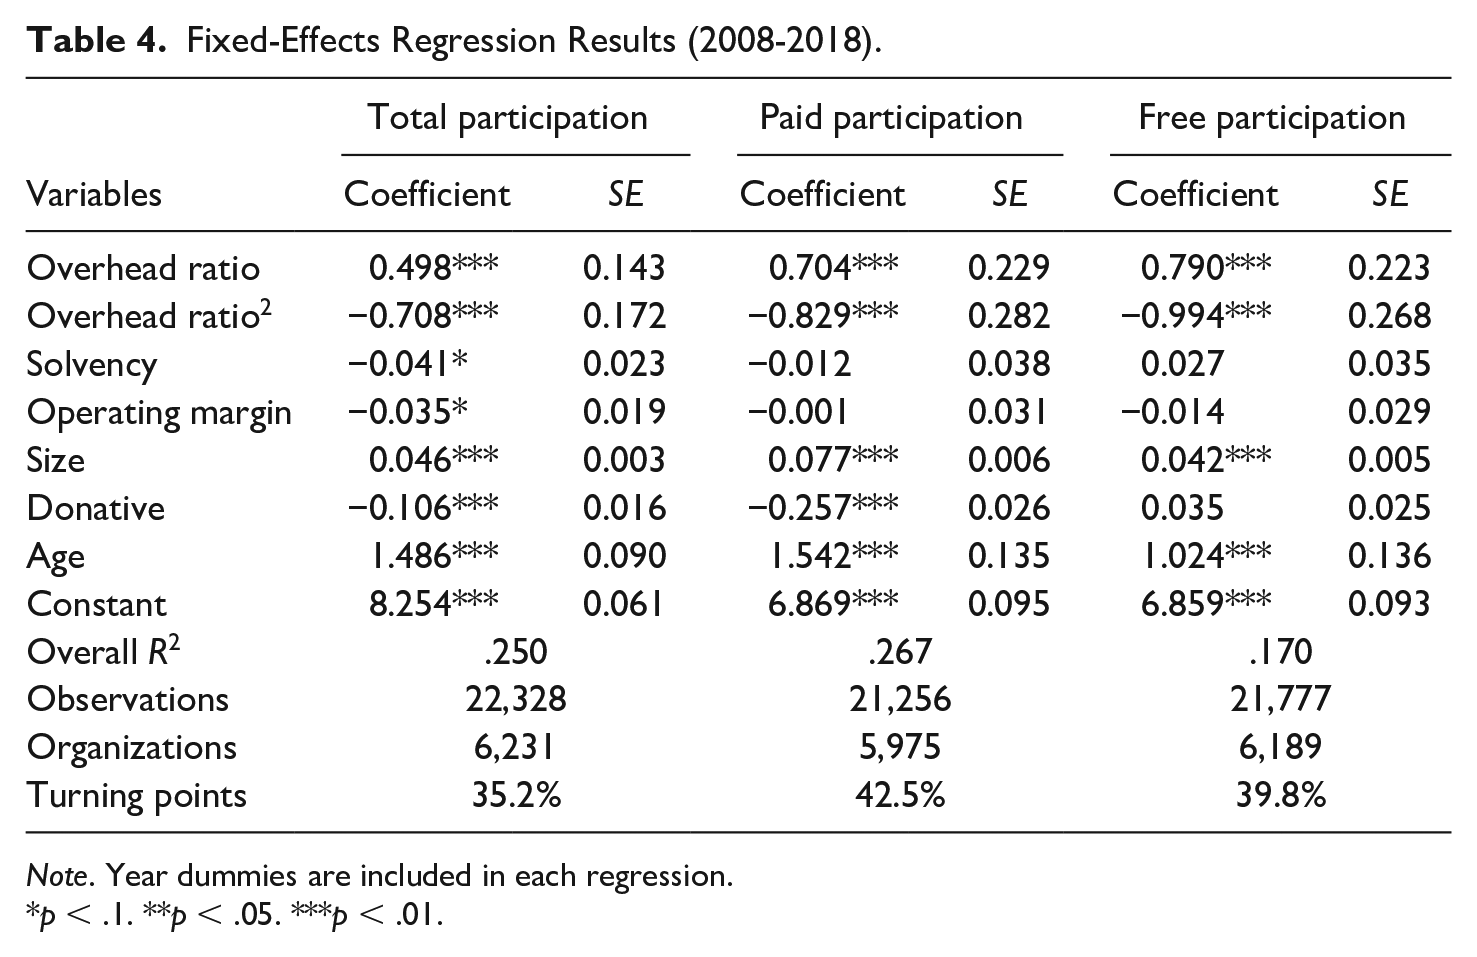
Note. Year dummies are included in each regression.
p < .1. **p < .05. ***p < .01.
Consistent with the OLS findings, the FE models also suggest an inverted U-shaped relationship, supporting our hypothesis. In terms of the total participation, spending up to 35.2%—that is, –0.498/(2 × –0.708)—of total expenses on overhead can help organizations enhance program outcomes. Nonetheless, going beyond this point diminishes the number of attendees. The optimal points for paid and free participation are 42.5%—that is, –0.704/(2 × –0.829) and 39.8%—that is, –0.790/(2 × –0.994), respectively. The different optimal points imply that different programs require different levels of overhead support. Paid programs require the highest overhead to achieve optimal program outcomes, perhaps because of the need for more advertisement and professional support.
To capture the importance of the optimal points, we estimate program outcomes (by total attendance) at the optimum (35.2%), the minimum (≈0.0%), the maximum (100%), and 5% below and above the optimum (30.2% or 40.2%). We then compare the difference in program outcomes between each of these benchmarks and the optimum. The results show that compared with nonprofits that invest the optimal level of overhead (35.2%), organizations that spend 5% less or more than the optimal point witness a slight decline in program outcomes (0.2%). In contrast, the minimum and maximum overhead spenders suffer a much substantial decrease in program outcomes (8.8% and 29.8%, respectively). Taken together, these findings indicate that when organizations spend slightly lower or higher than the optimal points, their program outcomes will not be affected substantially, perhaps because different nonprofits require different levels of overhead spending depending on their missions and nature of programs. However, when overhead spending is extremely low or high, an organization’s program outcomes would be severely compromised, consistent with the theoretical arguments presented in this study (see Figure 2).
Finally, to check the reliability of our results, we conduct two additional analyses. The successive models in Table 5 indicate that our findings do not change with or without control variables. Table 6 examines the disaggregated impact of overhead (i.e., administrative ratio and fundraising ratio) on program outcomes. Overall, the results are qualitatively similar. With a few exceptions, most coefficients on the linear term are positive and statistically significant, and the coefficients on the quadratic term are negative and statistically significant, confirming the inverted U-shaped relationship between administrative/fundraising ratios and program outcomes.
Summary Results of Successive Models.
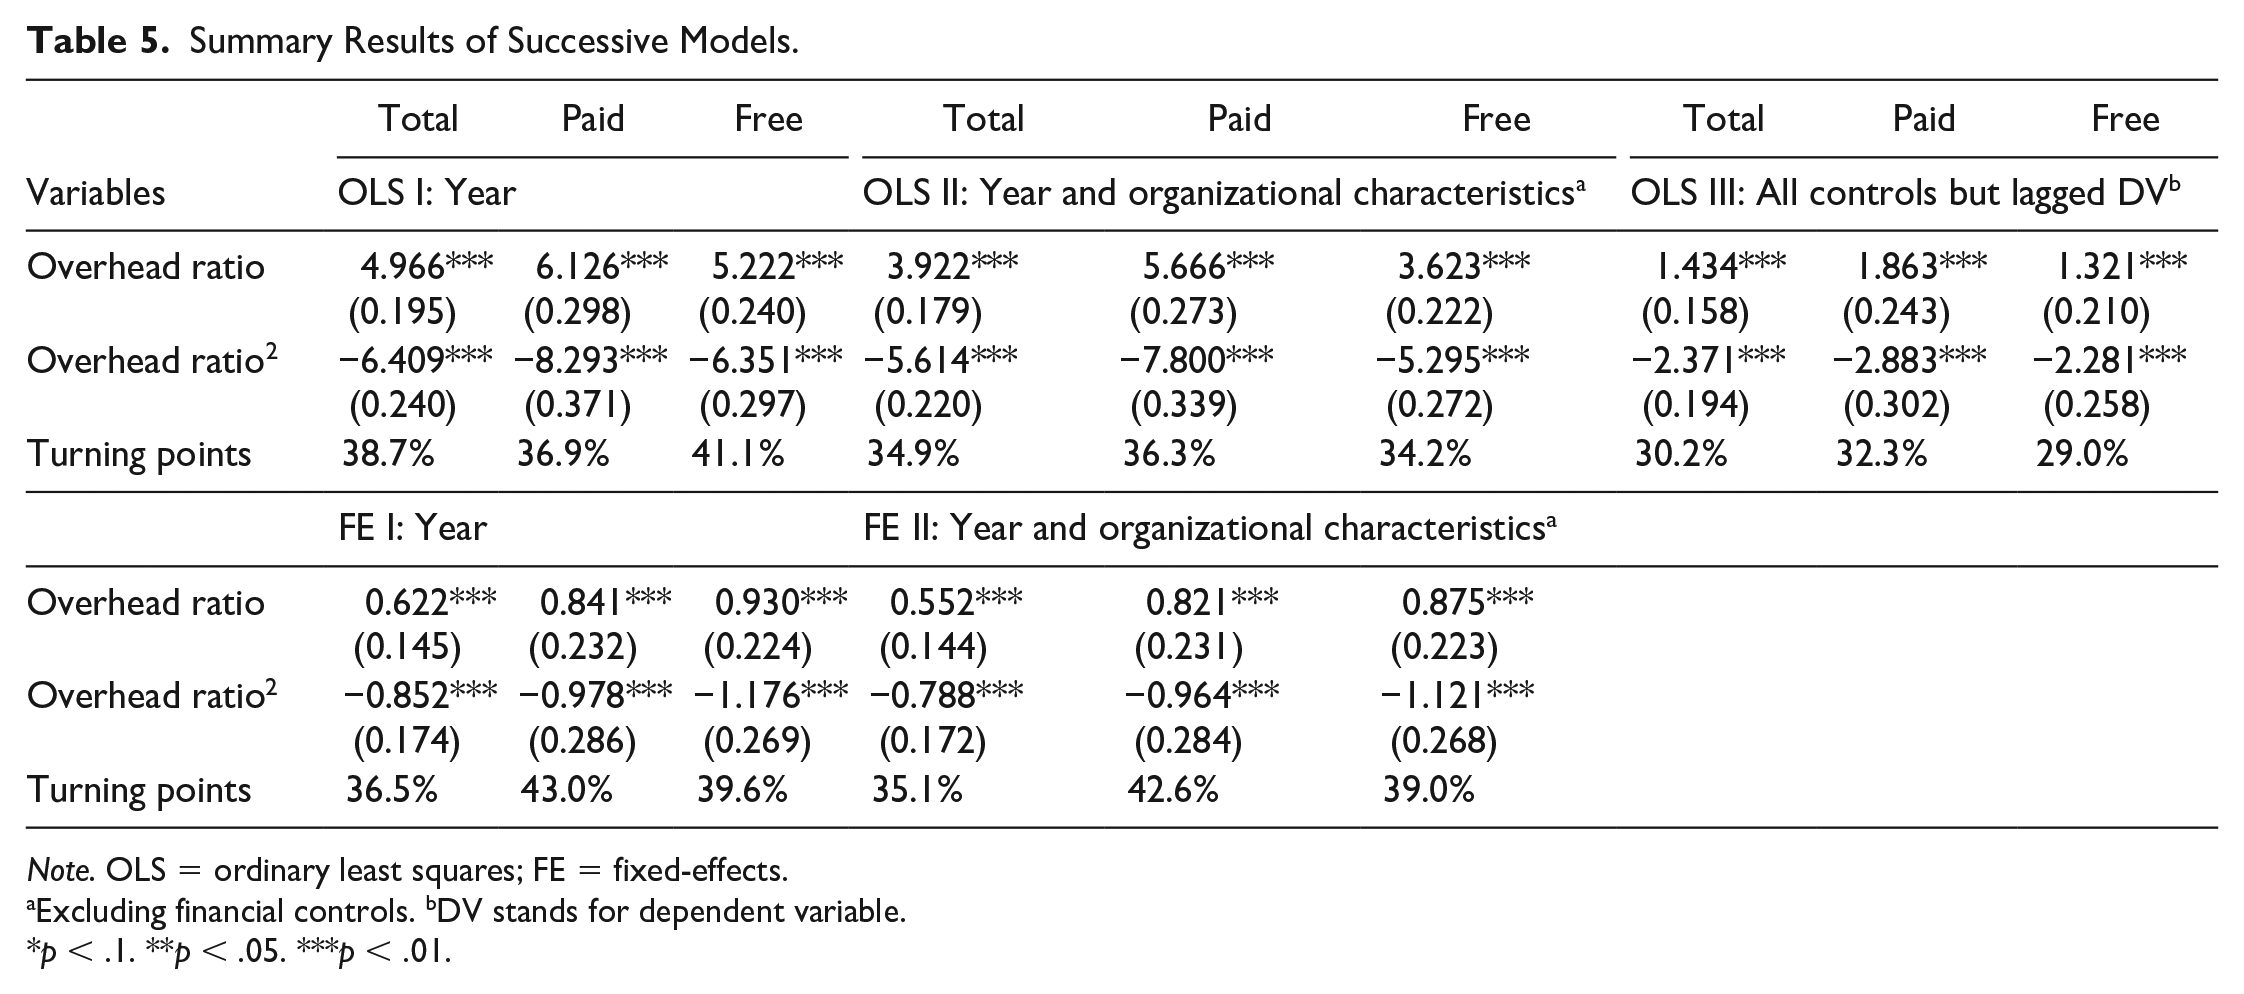
Note. OLS = ordinary least squares; FE = fixed-effects.
Excluding financial controls. bDV stands for dependent variable.
p < .1. **p < .05. ***p < .01.
Summary Results of Disaggregated Models.
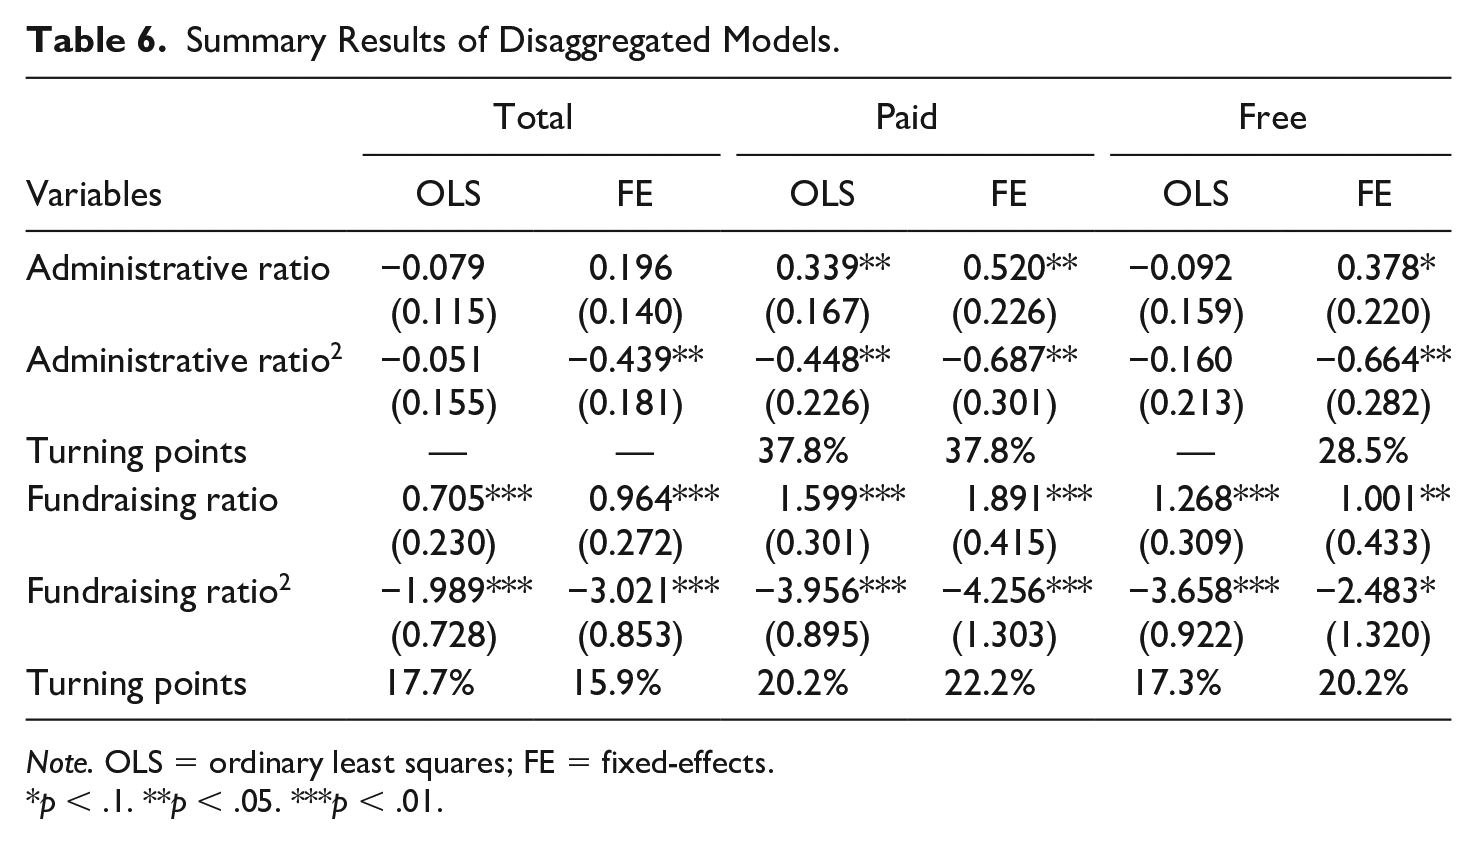
Note. OLS = ordinary least squares; FE = fixed-effects.
p < .1. **p < .05. ***p < .01.
Discussion and Conclusion
Reliance on the overhead cost ratio has become a significant topic of debate in nonprofit scholarship and practice for its potential impact on organizational outcomes and effectiveness. One view suggests that the ratio acts as a safeguard against inefficiency and ensures prioritization of program spending, pressuring nonprofits to decrease overhead to maximize outcomes. A countervailing view emphasizes the crucial role of overhead in building organizational capacity and improving nonprofit effectiveness. This study examines the relationship between the overhead cost ratio and nonprofit outcomes and provides compelling evidence for an inverted U-shaped relationship between the two variables, indicating that both views are valid—to a certain extent. Increased overhead spending helps improve nonprofit program outcomes, but program outcomes suffer if the spending exceeds the optimal level.
The findings add several new insights into the nonprofit financial management literature. First, the robust evidence for an inverted U-shaped relationship confirms that overhead has an optimal level, a point of departure from previous studies that hypothesized a linear relationship. While “the more, the merrier” may be a plausible argument, it is at odds with the economic efficiency perspective that suggests a limit beyond which further increases in overhead yield negative returns.
Second, the findings help reconcile the debate about the appropriate level of overhead spending by providing a middle ground that considers the capacity-building needs of nonprofits and donors’ efficiency and accountability concerns. Too little overhead is inimical to outcomes because it deprives nonprofits of resources critical for their capacity-building needs, thereby hurting their performance and long-term success. Equally, too much overhead is detrimental to outcomes because it breeds inefficiency and opens the door for resource exploitation and other agency problems. Specifically, the findings show that compared with organizations that invest optimal overhead levels, the minimum and maximum overhead spenders suffer from considerable attendance loss. Overall, the results suggest that it is necessary to rethink the relationship between overhead spending and outcomes and the underlying theoretical arguments discussed in the literature. Rather than taking a normative stance on overhead and viewing it as uniformly good or bad, the findings redirect the discussion to a more appropriate question: What amount of overhead is optimal to achieve desirable outcomes?
Third, the findings build on studies that confirm the existence of the starvation cycle (Lecy & Searing, 2014; Schubert & Boenigk, 2019) and add evidence supporting the cycle’s central argument that underinvesting in overhead hurts nonprofit capacity and effectiveness. The left tail of the inverted U-curve in Figure 2 shows that the overhead cost ratio and program outcomes are positively correlated. In other words, before reaching the optimal point, cutting overhead would inevitably compromise program outcomes.
The findings have important practical implications. Overall, we suggest a departure from the widely accepted conventional wisdom of low overhead. Where charity monitors typically recommend that the overhead cost ratio does not exceed 25% and the average ratio in our sample is 27%, the optimal points we found are substantially higher than these levels (total, paid, free attendance ≈ 35%, 43%, and 40%, respectively). The higher optimal points uncover a deficit in the existing overhead spending in the arts subsector, placing emphasis on the need to invest more in the capacity-building efforts for arts nonprofits.
However, these optimal points are not meant to be interpreted literally as our goal is not to recommend a new benchmark for overhead spending. The optimal points are likely to vary depending on several factors. For instance, our findings indicate that paid programs demand higher overhead spending than free programs to reach optimal outcomes. Other factors, such as subsector and growth stage, are all expected to influence the optimal levels of overhead spending (Chikoto & Neely, 2014). Instead, the purpose of the optimal points is to challenge the unrealistic expectations surrounding overhead spending and join the undergoing efforts of nonprofit leaders, scholars, and charity monitors to end the overhead myth and focus donor attention on results.
Emphasis on overhead diverts the attention away from more informative data on charitable outcomes and hinders organizations from achieving impact (Newman et al., 2019). We encourage donors to move away from the “one ratio suits all” expectation to supplying the overhead levels necessary for the success, growth, and sustainability of nonprofit organizations. This step requires nonprofit managers to explain to donors the role of overhead in supporting the achievement of their missions, consistent with prior study findings that transparency reduces overhead aversion (Qu & Daniel, 2021; Tian et al., 2020). We also urge charity monitors to reduce the reliance on the overhead cost ratio and explore more meaningful performance metrics. The ratio can communicate useful information but only along with other performance and impact metrics and collectively with other important factors such as leadership, governance, and transparency. Similarly, we recommend that nonprofit scholars exercise caution in using the overhead cost ratio to measure efficiency and, if utilized, fully acknowledge its limitations.
We take our advice and acknowledge several limitations of this study. We tried to the extent possible to enhance our dependent variable’s validity by excluding irrelevant nonprofits (see the appendix). However, some caveats remain worthy of discussion. Program outcomes are multidimensional, and attendance only captures one critical dimension. For a more comprehensive picture, program outcomes should include three modes: arts creation or performance, arts engagement through media, and attendance at other broader types of activities (Novak-Leonard & Brown, 2011). In-person attendance may not capture program outcomes fully for all organizations as large arts nonprofits are continuously experimenting with new ways to engage arts enthusiasts, such as through online programs. Nonetheless, these organizations represent a very small fraction of arts nonprofits and do not pose a serious threat to our measure’s validity.
We recognize that some overhead spending, such as major infrastructure upgrades and fundraising events, may generate long-term or deferred benefits. Due to the relatively short panel, our analysis examines only the single-period effect. However, we suspect that such multiperiod effects will not compromise our findings, considering that major infrastructure upgrades do not occur very often, and nonprofits’ ability to attract long-term benefits through fundraising events is limited.
Given the theoretical discussion, we expect that the curvilinear relationship between the overhead cost ratio and program outcomes will hold in other nonprofit subsectors. However, caution should be exercised in generalizing our findings for three reasons. First, overhead allocation may differ across subsectors. Second, nonprofit arts organizations usually incur a higher-than-average overhead cost ratio, partially due to unique overhead expenses (Lecy & Searing, 2014). For instance, both performing arts and visual arts organizations demand marketing expenses to maximize program outcomes. According to Theater Facts 2019, between 2015 and 2019, participating theaters’ marketing expenses to ticket revenue ratio averaged 0.29, meaning that 29 cents of marketing expenses are needed to bring in a dollar of ticket revenue (Fonner et al., 2020). Also, performing arts nonprofits usually spend more on travel costs, and museums often incur higher building security costs. Third, our sample does not include all arts nonprofits, and participating organizations are generally larger and older than typical arts nonprofits registered with the Internal Revenue Service (IRS). 5 As a result, this study’s optimal points might not be readily applicable to other subsectors.
Notwithstanding these limitations, our study covers a distinct gap in the literature and provides valuable insights that apply to the whole sector. More research is needed to verify our expectations and identify the optimal points in other nonprofit subsectors. Future studies may also focus on disentangling the short- and long-term effects of administrative and fundraising expenses on program outcomes, a challenging yet much-needed scholarship.
Footnotes
Appendix
Summary of Data Cleaning.
| Beginning sample size | Total participation | Paid participation | Free participation |
|---|---|---|---|
| 84,549 | |||
| less: Organizations that are for-profit corporations or government-affiliated organizations; nonprofits that are not classified as 501(c) 3 arts nonprofits, denoted by the “NTEE-A” code a | 8,328 | ||
| less: Arts nonprofits that do not serve individual arts attendees in their primary activities; arts schools | 16,531 | ||
| less: Missing/erroneous values on overhead ratio, total, paid, and free participation, solvency, margin, size, donative, location, and age | 25,087 | 25,753 | 25,351 |
| less: Missing values generated from the inclusion of the lagged overhead ratio, solvency, margin, and size | 10,316 | 9,987 | 10,188 |
| less: Influential outliers identified by Cook’s Distance (Di > 4/n) | 1,282 | 1,968 | 1,683 |
| less: Nonprofits that reported zero overhead spending | 597 | 546 | 563 |
| less: Missing values generated from the inclusion of the lagged dependent variables in the OLS models | 80 | 180 | 128 |
| Final sample size | 22,328 | 21,256 | 21,777 |
Note. Full list of arts nonprofits eliminated in Step 2 can be found in Notes 2 and 3. OLS = ordinary least squares.
National Taxonomy of Exempt Entities code A – Arts, Culture, and Humanities.
Acknowledgements
We extend our gratitude to professors in the Andrew Young School of Policy Studies at Georgia State University who gave us valuable comments on this article: Benedict Jimenez, Gregory B. Lewis, Ross Rubenstein, and John C. Thomas. We also thank the editor and three anonymous reviewers at Nonprofit and Voluntary Sector Quarterly for their insightful and constructive feedback.
Declaration of Conflicting Interests
The author(s) declared no potential conflicts of interest with respect to the research, authorship, and/or publication of this article.
Funding
The author(s) received no financial support for the research, authorship, and/or publication of this article.