
Abstract
This article proposes a multidimensional method for measuring and evaluating museum resilience holistically. The research highlights the lack of a framework for understanding the level of resilience in museums and the contribution of museums to resilience. To this end, a model is presented based on three enabling dimensions, namely, structure, people, and relationships. The model is applied to the museums of the Marche region’s “seismic crater” (Italy). Qualitative information and data drawn from the regional authority’s Museum Information System were evaluated using exploratory analysis techniques. On the basis of a cluster analysis, four categories of museums are identified according to their degree of resilience. The results suggest that human resources is an area that is commonly in need of upgrading. Nevertheless, the evidence on the heterogeneity of the clusters in terms of structure and relationships calls for a diversified approach to identifying priorities, investments, and public policies.
Introduction
Over the past 20 years, there has been a rise in, and spread of, “resilience talk” in social sciences (Hall, 2018). Scholars have labeled “resilience” as a buzzword (Martin & Sunley, 2015), speculating whether it could be considered a boundary object (Brand & Jax, 2007), a unifying concept (Thorén, 2014), a bridging concept, or just a dead end (Davoudi, 2012). Other studies have identified different generations of research on the matter, defining resilience first as the adaptability of the individual, second as positive adjustment, and then as transformative change; finally, the fourth generation has investigated equitable resilience “for engaging with equity in resilience practice” (Zabaniotou, 2020, p. 118).
In this context, this research focuses on museum management, providing a holistic framework for measuring and evaluating museum resilience, especially in fragile areas, such as inland areas exposed to earthquakes and other natural disasters. First, in the context of a theoretical framework that is still somewhat blurred and tangled, we discuss the main definitions of resilience provided by social sciences, focusing on the rise of an evolutionary approach based on adaptability and transformability, reconfiguration, and reorganization. By adopting this perspective, the research explores the path toward normative resilience to understand how to implement, manage, and improve organizational resilience. The literature review also investigates how the scientific debate has tackled museum resilience, pointing out the lack of a holistic framework for understanding the level of resilience in non-profit institutions such as museums and the possible contribution of museums to resilience.
Starting with this research gap, the second part of the article proposes a multidimensional model for measuring museum resilience and applies it to the museums of the Marche region’s “seismic crater” (Italy), a vast, hilly, and mountainous area affected by the devastating earthquakes that struck Central Italy between August 2016 and January 2017. The seismic activity in Central Italy during the period August 2016–February 2017 was particularly intense, with a maximum Richter magnitude of 6.5. In the history of Italian earthquakes, only that of Irpinia in 1980 was of higher intensity (magnitude equal to 6.8). The severity of the devastation caused by the series of seismic events was immediately evident. Overall, more than 30,000 people were affected. In terms of economic losses, it was one of the largest economic disasters ever recorded in Italian history, preceded only by the Irpinia earthquake in 1980 and the Emilia Romagna earthquake in 2012.
Previous research has highlighted a huge concentration of cultural and natural resources in this area, particularly of small local museums in addition to what is known as “diffuse museum,” that is, the array of cultural heritage found in villages, abbeys, and parish churches (NSSAM, 2017). The wealth of culture and tourism-related bottom-up experiences launched after the earthquakes and their high degree of inclusiveness have also emerged as signs of the territory’s social capital, self-organizing capacity, and resilience (Cerquetti & Cutrini, 2020; Pezzi & Punziano, 2017).
Agreeing with these premises, we analyzed the self-evaluation forms completed by the local museums of the 87 municipalities in the “seismic crater.” The research starts from the assumption that the availability of adequate physical structures, qualified personnel, and effective networks is a crucial factor in the resilience of the museum system and, consequently, its contribution to social and economic recovery. Drawing on information included on the evaluation forms of 122 local museums, their resources, performance, and processes were examined to assess the system’s resistance and recoverability. Taking into account the results of the literature review on museum resilience, the analysis focused on the following enabling dimensions as determinants of resilience: (a) equipment and facilities (structure), (b) human resources (people), and (c) participation in networks and cooperation with the local context (relationships). A specific set of variables was identified for each dimension. Then, on the basis of a cluster analysis, four categories of museums were identified according to their degree/level of resilience, along with suitable interventions for managing and improving their capacity to deal with future shocks. Attention is also given to museum networks as tools that could help individual museums achieve more effective results that would otherwise be unattainable (Cerquetti, 2019; Pencarelli & Splendiani, 2011).
Theoretical Framework
Resilience as an Interdisciplinary Concept
Although there is no universally agreed definition of regional economic resilience, three main types can be identified in the scientific literature: (a) resilience as “bounce back” from shocks, in relation to the speed and extent of recovery (engineering resilience); (b) resilience as a system’s “ability to absorb” shocks or the size of shock that can be tolerated before moving to a new state/form (ecological resilience); and (c) resilience as “positive adaptability” in anticipation of, or response to, shocks, that is, the capacity of a system to “bounce forward” or maintain core performance despite shocks, by adapting its structure, functions, and organization (evolutionary resilience; Martin & Sunley, 2015; Scuttari & Corradini, 2018). Combining these different definitions, Martin and Sunley (2015) defined regional economic resilience as the capacity of a regional or local economy to withstand or recover from market, competitive and environmental shocks to its developmental growth path, if necessary by undergoing adaptive changes to its economic structures and its social and institutional arrangements, so as to maintain or restore its previous developmental path, or transit to a new sustainable path characterised by a fuller and more productive use of its physical, human and environmental resources. (pp. 14-15)
This definition classifies resilience as a dynamic and continuous process, a combination of resistance and recoverability (Martin et al., 2016). In the evolutionary approach, there is a clear tendency to refute the engineering equilibrium concept of resilience, defined as the ability of a region to move back to a steady state. Instead, the attention is devoted to the long-term ability of regions to reconfigure their socio-economic and institutional structures to define and sustain new growth paths. Resilient regions are capable of overcoming the trade-off between adaptation and adaptability through a loosely coherent institutional structure (Boschma, 2015). Reconfiguration and reorganization are central to the definition of resilience as a relational concept where the context matters (Pratt, 2017).
Sharing this evolutionary perspective, resilience could be linked to adaptability and transformability (Folke et al., 2010; Oliva & Lazzeretti, 2017). In addition, normative resilience could be studied as the totality of strategies, actions, and procedures that can sustain regional economic resilience. From this point of view, resilience can be implemented, managed, and improved. Notably, it is important to have a deep understanding of the historical dynamics that shape this system and its structure, so as to properly support public planning. On one hand, public authorities have to support communities, regardless of whether they are resilient, by managing problems and providing resources and adequate solutions (Shaw, 2012); on the other hand, given that socio-ecological systems are dynamic, “having a broad overview of system change through time can reveal system drivers, the effects of interventions, past disturbances and responses” (Resilience Alliance, 2007, p. 22).
When focusing on cultural resources (Cooke & Lazzeretti, 2018; Lazzeretti & Cooke, 2017), their ability to contribute to local development and recovery depends on the resilience of their systemic organization. In that regard, recent studies have highlighted certain weaknesses in the cultural sector that could hinder resilience. Resilience is often “outsourced to flexible or freelance workers who bear the costs and risk of uncertainty” (Pratt, 2017, p. 136). Specifically, smaller institutions are disproportionally affected by public sector funding cuts and the practice of lowering labor costs by the employment of volunteers and interns (Pratt, 2017). This kind of problem strongly affects the heritage sector and has also emerged as one of the worst economic effects of the coronavirus disease 2019 (COVID-19) pandemic (Khan et al., 2021).
Finally, if we consider cultural heritage to be a resource that can contribute to sustainable development, organizational resilience emerges as a crucial issue. It means that cultural organizations such as museums can only contribute to regional and community resilience if they are organizationally resilient. According to this perspective, they should develop resilience thinking “to raise awareness of emerging change processes and develop strategies that actively promote resilience building” (Zacher, 2018, p. 55; see also, Berbés-Blázquez & Scott, 2017). In this context, an increasing number of studies on organizational resilience has focused on the role of social capital, investigating both “human resources” (Lengnick-Hall & Beck, 2005, 2009; Lengnick-Hall et al., 2011; Powley, 2009) and “relationships” (Aldrich, 2012; Buzzanell, 2018; Doerfel et al., 2013; Ford & Stephens, 2018; Houston, 2014; Kim et al., 2021; Stephens et al., 2013). In particular, the literature on community resilience suggests that openness and social capital networks foster “adaptive resilience” after a natural disaster (e.g., Adger et al., 2005; Aldrich, 2012, among others).
Resilience Within the Museum Context
The notion of resilience is so connected to sustainability that we can argue that resilience is necessary, even if not sufficient, for sustainability or, better, that “without resilience, sustainability cannot be realised” (Espiner et al., 2017, p. 1390). According to Lew et al. (2016), if sustainability emphasizes conservation, resilience emphasizes adaptation to change.
The close link between these two concepts is particularly palpable in the heritage and museum sector, where sustainability and resilience can be seen as two sides of the same coin. As argued by Adams (2010), “museums are inextricably linked to sustainability principles,” given the need to maintain collections in perpetuity to serve both current and future generations (p. 11). If sustainability is intrinsically and implicitly part of each museum’s mission, resilience is the means to achieve it. However, its application to the museum sector is quite recent in the scientific debate, accelerated by the economic crisis and climate change, which have highlighted the fragility and vulnerability of cultural heritage and the need “to react quickly to evolving environments” (Perzolla et al., 2018). On one hand, some scholars have been analyzing the reaction of museums and other non-profit institutions to the recession and the resulting fiscal pressures, pointing out that they maintained their financial footing and even “expanded their activities, serving more people, and particularly more vulnerable people” (Lessans Geller et al., 2010, p. 133). To cope with the economic downturn, museums intensified their fundraising efforts and tried more creative fundraising approaches (Camarero & Garrido, 2008; Hughes & Luksetich, 2004). Although many organizations had to tighten their belts, they were also spurred to be more entrepreneurial, for example, by improving or expanding marketing efforts, joining advocacy coalitions with other organizations, and starting or increasing facility rental programs. On the other hand, climate change has come to the fore as one of the greatest challenges that museums have to face, and not only by adopting green and sustainable building practices (Sharanya et al., 2018). As institutions able “to invent a new future for themselves and their communities” (Janes & Grattan, 2019, p. 98), they are called on to mitigate climate change through coalitions and networks, conferences, environmentally responsible constructions, and activist projects. More specifically, it is emerging that their role is not just about science, ideology, or politics but also about social justice.
In this context, the relationship between museums and resilience is twofold. Museums can be studied both as resilient organizations, which start and implement actions to be more resilient (resilience in museums), and also as resilient agents, by virtue of their contribution to the resilience of communities (museums for resilience). In other words, resilience can be both a property embodied by the museum system or an effect of its action.
When analyzing resilience in museums, scholars have mainly focused on actions to ensure cultural heritage preservation, such as earthquake prevention (Cerri & Collotti, 2019) or disaster risk management (DRM), “including preparedness and risk mitigation, emergency response and post-disaster resilient recovery” (Minguez Garcia, 2020, p. 38). Current approaches have highlighted the role of international knowledge-exchange initiatives and of collaboration models for the adoption of preventive conservation procedures. Perzolla et al. (2018), for example, proposed “proactive collaborative conservation” (ProCoCo), a model involving external stakeholders actively collaborating with conservators and conservation sciences.
On the contrary, research on museums for resilience has focused on the transformative power of museums (Drubay & Singhal, 2020) by analyzing activities and programs aimed at developing resilience literacy in local communities and the various stakeholders. Regarding climate change, science centers and museums are now becoming hubs for community-based participatory research programs, solution-focused approaches, and project-based learning. These strategies help “participants to identify and develop their own ideas, sense of agency, and self-efficacy” (Krester & Chandler, 2020, p. 53), and affect the “audience’s awareness, engagement, attitude, and behaviours related to climate change and resilience” (Hoffman, 2020, p. 32). Art museums can promote resilience, too. The collaboration between medical educators and art museum educators provides several examples of how resilience can be fostered through art (Orr et al., 2019; Williams & Zimmermann, 2020). Finally, when talking about museums as resilient agents, we should also consider the inclusion of resilience in museum content or resilience as a museum object, such as in the case of museums of resilience that “research, study and educate in self-reliance and inventiveness” (Harrington et al., 2018, p. 158; see also, Fennel, 2012, 2015).
Although the two categories described here represent two different approaches to resilience, they are connected and interdependent in that, the more resilient a museum is, the more it can promote resilience. On the contrary, if a museum fosters resilience culture and community empowerment, local stakeholders are more aware of the value of museums and inclined to support actions to prevent damage to cultural heritage and ensure its survival for future generations.
It takes innovation in museum management for this virtuous cycle to be triggered. As recently stated for the case of libraries, basic regulatory and technical compliance and adequate equipment and facilities are prerequisites, but they should go hand in hand with investment in human capital and adaptive organizational models (Tkalec & Krstić, 2019). More specifically, we can draw three enabling dimensions from previous research on museums (Perzolla et al., 2018; Tkalec & Krstić, 2019):
Structures, that is, museum facilities and equipment, including the availability of security and safety systems, risk planning tools, and preventive conservation procedures;
People, that is, human resources and their preparedness, namely, adequacy in number, qualification, and training;
Relationships, or participation in networks for knowledge exchange and collaboration at different levels (Figure 1).

The interdependence between being resilient and fostering resilience, and enabling factors.
In conclusion, we can consider a museum to be a complex socio-technical system. Its adaptability to environmental changes and its evolution are rooted in practice and knowledge and have to be continually nurtured through adequate equipment, human resources, and collaborations.
As already argued, research in cultural heritage and museum management has analyzed different components of museum resilience, focusing separately on preventive conservation models, on reactions to the financial crisis, and on activities to foster community resilience. However, a systemic approach to museum resilience is still lacking. What is needed is a holistic framework that brings together the enabling dimensions identified in Figure 1 for measuring and evaluating museum resilience and, thus, for ensuring the continuity of museum activity and its contribution to the resilience of its environment.
Data and Methodology
As suggested by the literature review, if cultural heritage is a resource, then the cultural heritage system’s ability to contribute to local resilience depends on its own resilience. The approach presented in the previous sections also supports the idea that a museum’s ability to bounce back, absorb shocks, and/or bounce forward depends on ordinary measures and activities to prevent damage and cope better with future shocks. Focusing on the museums of the Marche region’s “seismic crater” (Italy), we propose a multidimensional method and a set of variables to measure the resilience of the museum system as a whole and understand the main weaknesses they should overcome to contribute to social and economic recovery. We use different descriptive statistics methods, such as explorative techniques and visual data methods, for profiling museums in terms of resilience.
Data Collection
Information was drawn from the Museum Information System, a permanent and dynamic tool set up by the Marche regional authority in 2011, in accordance with Regional Law 4/2010 (Article 20). The database monitors the museums’ conditions and performance, gathering information from self-evaluation forms addressing the eight areas identified in the Ministerial Decree of May 10, 2001: (a) legal status, (b) financial status, (c) structures, (d) staff, (e) safety and security, (f) management and care of collections, (g) relations with the public and visitor services, and (h) relations with the territory. The architecture of the information system and the structure of the self-assessment form were defined after a study of other experiences already in place in other administrative regions (e.g., Lombardy, Emilia Romagna, and Tuscany) and adopting a specific software to manage the system. The first online self-assessment campaign took place in 2007 and was updated every 2 years until 2019. 1 In 2017, the form was updated to record information about damage caused by the earthquake. The last online self-assessment campaign was launched in 2019 and concluded in 2020. The process was delayed because of the COVID-19 pandemic, and fewer museums were able to participate in the campaign. For this reason, we decided to analyze data collected until 2017, including the first survey after the 2016–2017 earthquakes. 2
On the whole, in 2017, 245 museums in the Marche region participated in the self-assessment process: 38 museums completed the new form, 186 the old one, and 21 completed both. 3 Our analysis spanned all 122 museums located in the Marche region’s “seismic crater,” although some did not update the form in 2017 (Table 1, Figure 2).
Museums in the Marche Region’s “Seismic Crater” Participating in the Self-Assessment Process (Last Update).

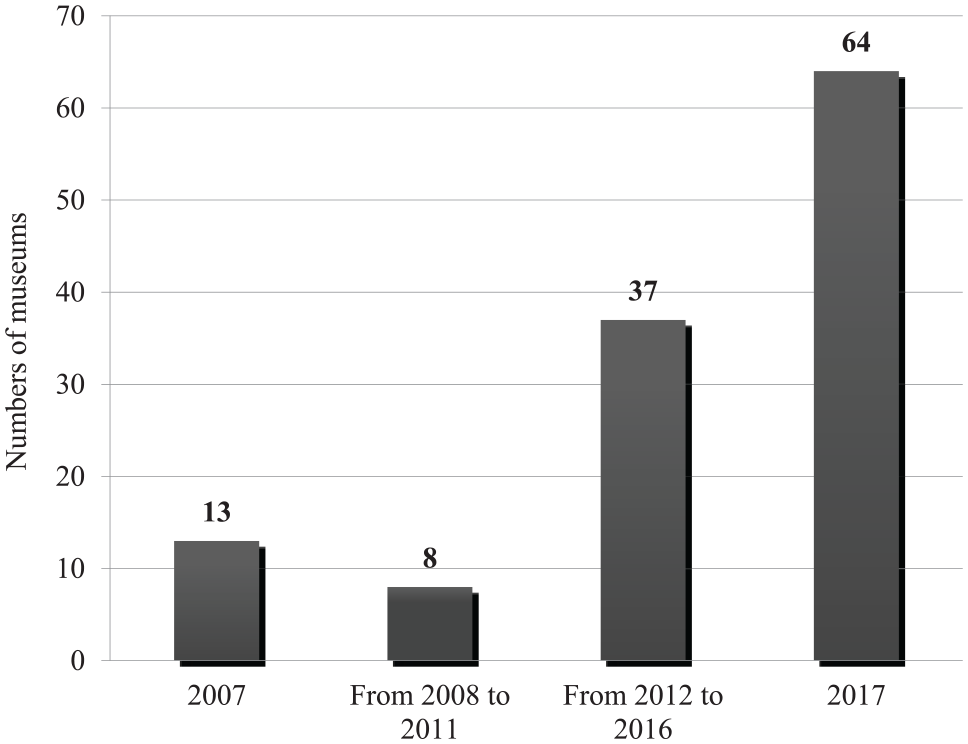
Update of the evaluation form.
Considering the enabling dimensions drawn from previous research on resilience, we identified three interconnected pillars as determinants of museum resilience: equipment and facilities (structure), human resources (people), and networks and collaboration with the local context (relationships). We selected a specific set of variables or enabling factors for each dimension (Seville, 2018).
When focusing on equipment and facilities, we selected information on conservation systems (e.g., inventory, storerooms, preservation of materials, lighting, heating and air conditioning systems, security systems, and risk assessment). The analysis of human resources focused on the availability of sufficient, suitably qualified personnel. Finally, the third pillar investigated participation in networks and other relationships with the local context in terms of communication and collaboration with local institutions, schools, and so on. (Figure 3).

Determinants of museum resilience.
Encoding the Questionnaire and Cluster Analysis
In cluster analysis or clustering attempts to determine the natural groupings (or clusters) of individual observations (objects), objects are classified into different groups, or more precisely, a data set is partitioned into subsets (clusters) in such a way that the data in each subset are similar in terms of certain distance measurements. Central to all the cluster analysis goals is the notion of the degree of similarity (or dissimilarity) there is between the individual patterns being clustered.
In this study, we classified museums into four groups, based on relevant attributes, so that they can receive a mix of suitable interventions to help them improve their capacity to deal with future shocks.
We performed data transformation and variable selection before clustering.
Data transformations (such as standardization of variables) and the variables selected for use in clustering can greatly affect the groupings that are discovered (Anderberg, 1973; Everitt et al., 2011; Gordon, 1999; Späth, 1980). With this caveat in mind, the selection of variables was driven by the approach presented in the previous section. In other words, of the information available on the self-assessment form, we restricted our cluster analysis to variables and questions that were better suited to establishing the existence of the enabling dimensions identified in Figure 1.
Table A1 shows the list of 23 variables considered in our cluster analysis and the encoding utilized.
The individual observations are given in the form of variables (V1 . . . V23) containing elements that describe objects or events in numerical form. The feature vector (V) for each museum is constructed by encoding the answers to the questionnaire numerically. Furthermore, we explain our encoding technique used to transform the answers into numerical variables. Table A1 illustrates the techniques used for this purpose.
The simple questions with a “Yes/No” answer associated with dichotomic variables, namely, V2, V3, V7, V9, V11, V12, V13, V14, V17, V20, V21, and V22, can have a value of 1 (if the answer is “Yes”) or 0 (if the answer is “No”).
In multiple-choice questions, where the answers could be in several categories, such as questions associated with V4, V5, V6, V10, V15, V16, and V18, the total number of the selected categories was cumulated and normalized between 0 and 1.
In questions involving ordinal variables (V8 and V19), we also normalized the outcome so that a real number between 0 and 1 represents the answer and is used as an input variable in the cluster analysis.
As for the numeric variable related to the number of museum visitors (V23), we computed the average value of visitors to each museum involved in the survey at time t (year in which the form was completed) and the 2 years before that.
Finally, we also standardized the year in which the self-assessment form was completed (V0), from 0 to 1, starting from a numerical variable (with values 1 for 2001 and 17 for 2017). We obtained a variable scaled from 0 to 1 and used Value 1 only for those museums with the most updated self-assessment form to be completed.
The standardization of variables on the same scale is a data transformation suggested in the literature for cluster analysis. In this case, all the variables included in the cluster analysis are normalized between 0 and 1.
We used a partition-clustering method for museums using the k-means command in Stata.
K-means clustering is an iterative procedure that partitions the data into k groups or clusters. We specified the number of clusters to be created as four. Thus, the procedure begins with four initial group centers. Observations are assigned to the group with the closest center. The mean of the observations assigned to each of the groups is computed and the process is repeated. These steps continue until no observations change groups from the previous iteration. As for the distance measure, we use the Euclidian distance of V1, V2, V3, . . . V18 to create four groups.
Then we use data visualization techniques to depict the identified clusters in terms of the relevant dimensions (structure, people, and relationships). For each of the relevant enabling domains, we computed a simple mean for enabling components (10 for structure, 3 for people, and 4 for relationships). We normalized the average value in the 0 to 1 interval to facilitate comparison both across and within the clusters. In the next section, we present the boxplot 4 to highlight some of the basic characteristics of the statistical distribution of museums within each cluster.
Research Results and Discussion
The cluster analysis allowed us to classify the sample of museums into four groups, according to the three enabling dimensions which, on the basis of the proposed framework, are expected to contribute to museum resilience.
The first cluster consists of 25 museums, the second cluster comprises 31 museums, the third and the fourth clubs include 29 museums each.
The different degrees of resilience of the clusters can be categorized, according to their characteristics, as “Incipient resilience” (Cluster 1), “Developing resilience” (Cluster 2), “Advanced resilience” (Cluster 3), and “Mature resilience” (Cluster 4), from a low level of resilience to a high level of resilience.
As we will explain in the following, the first three clusters comprise small museums, whereas the largest museums located in the area’s major urban centers typically belong to the “Mature resilience” group.
Table 2 presents basic information on the museums’ groups concerning the update of the self-assessment, the average number of visitors, the availability of on-site and online services such as opening hours, service charter, educational services, and online information. The self-assessment forms were usually updated for all the clusters. The main result is that only the museums in the “Mature resilience” category typically had a variety of services and recorded the highest visitor averages during the observation period. Interestingly, the “Developing resilience” group has a higher than average value for the service charter and on-site services.
General Information and Services.

Note. The table shows the clusters’ average values for standardized variables.
Figure 4 provides an overview of the four clusters according to the normalized numerical variable, capturing each of the three relevant pillars of museum resilience. It shows us that our classification can, in fact, be seen as successive stages in a virtuous organizational development.

Boxplot: Grouping of museums and enabling domains—Structure, people, and relationships.
For example, museums in “Advanced resilience” and “Mature resilience” clusters usually have better equipment, facilities, and conservation systems. Moreover, the higher values in the third pillar suggest that the three groups depicted on the right-hand side of the boxplot are significantly more embedded in the local context, in terms of communication and collaboration with local institutions, compared with the “Incipient resilience” cluster. Instead, in all clusters, we find that human resources is an area that could be improved. Thus, there is room for significant upgrading in terms of both the suitability and the qualifications of personnel.
To further characterize the clusters, we consider the average values of the variables included in our cluster analysis.
Table 3 provides details of the average values for 17 enabling factors—grouped into the three relevant dimensions—for each cluster. It is worth noting that, as we move from the first cluster to the fourth cluster, there is generally a higher degree of safety and security, and a deepening of the relationships with other museums and cultural institutions that can improve innovation and empowerment in the entire museum system.
Equipment and Facilities, Human Resources, and Networks.
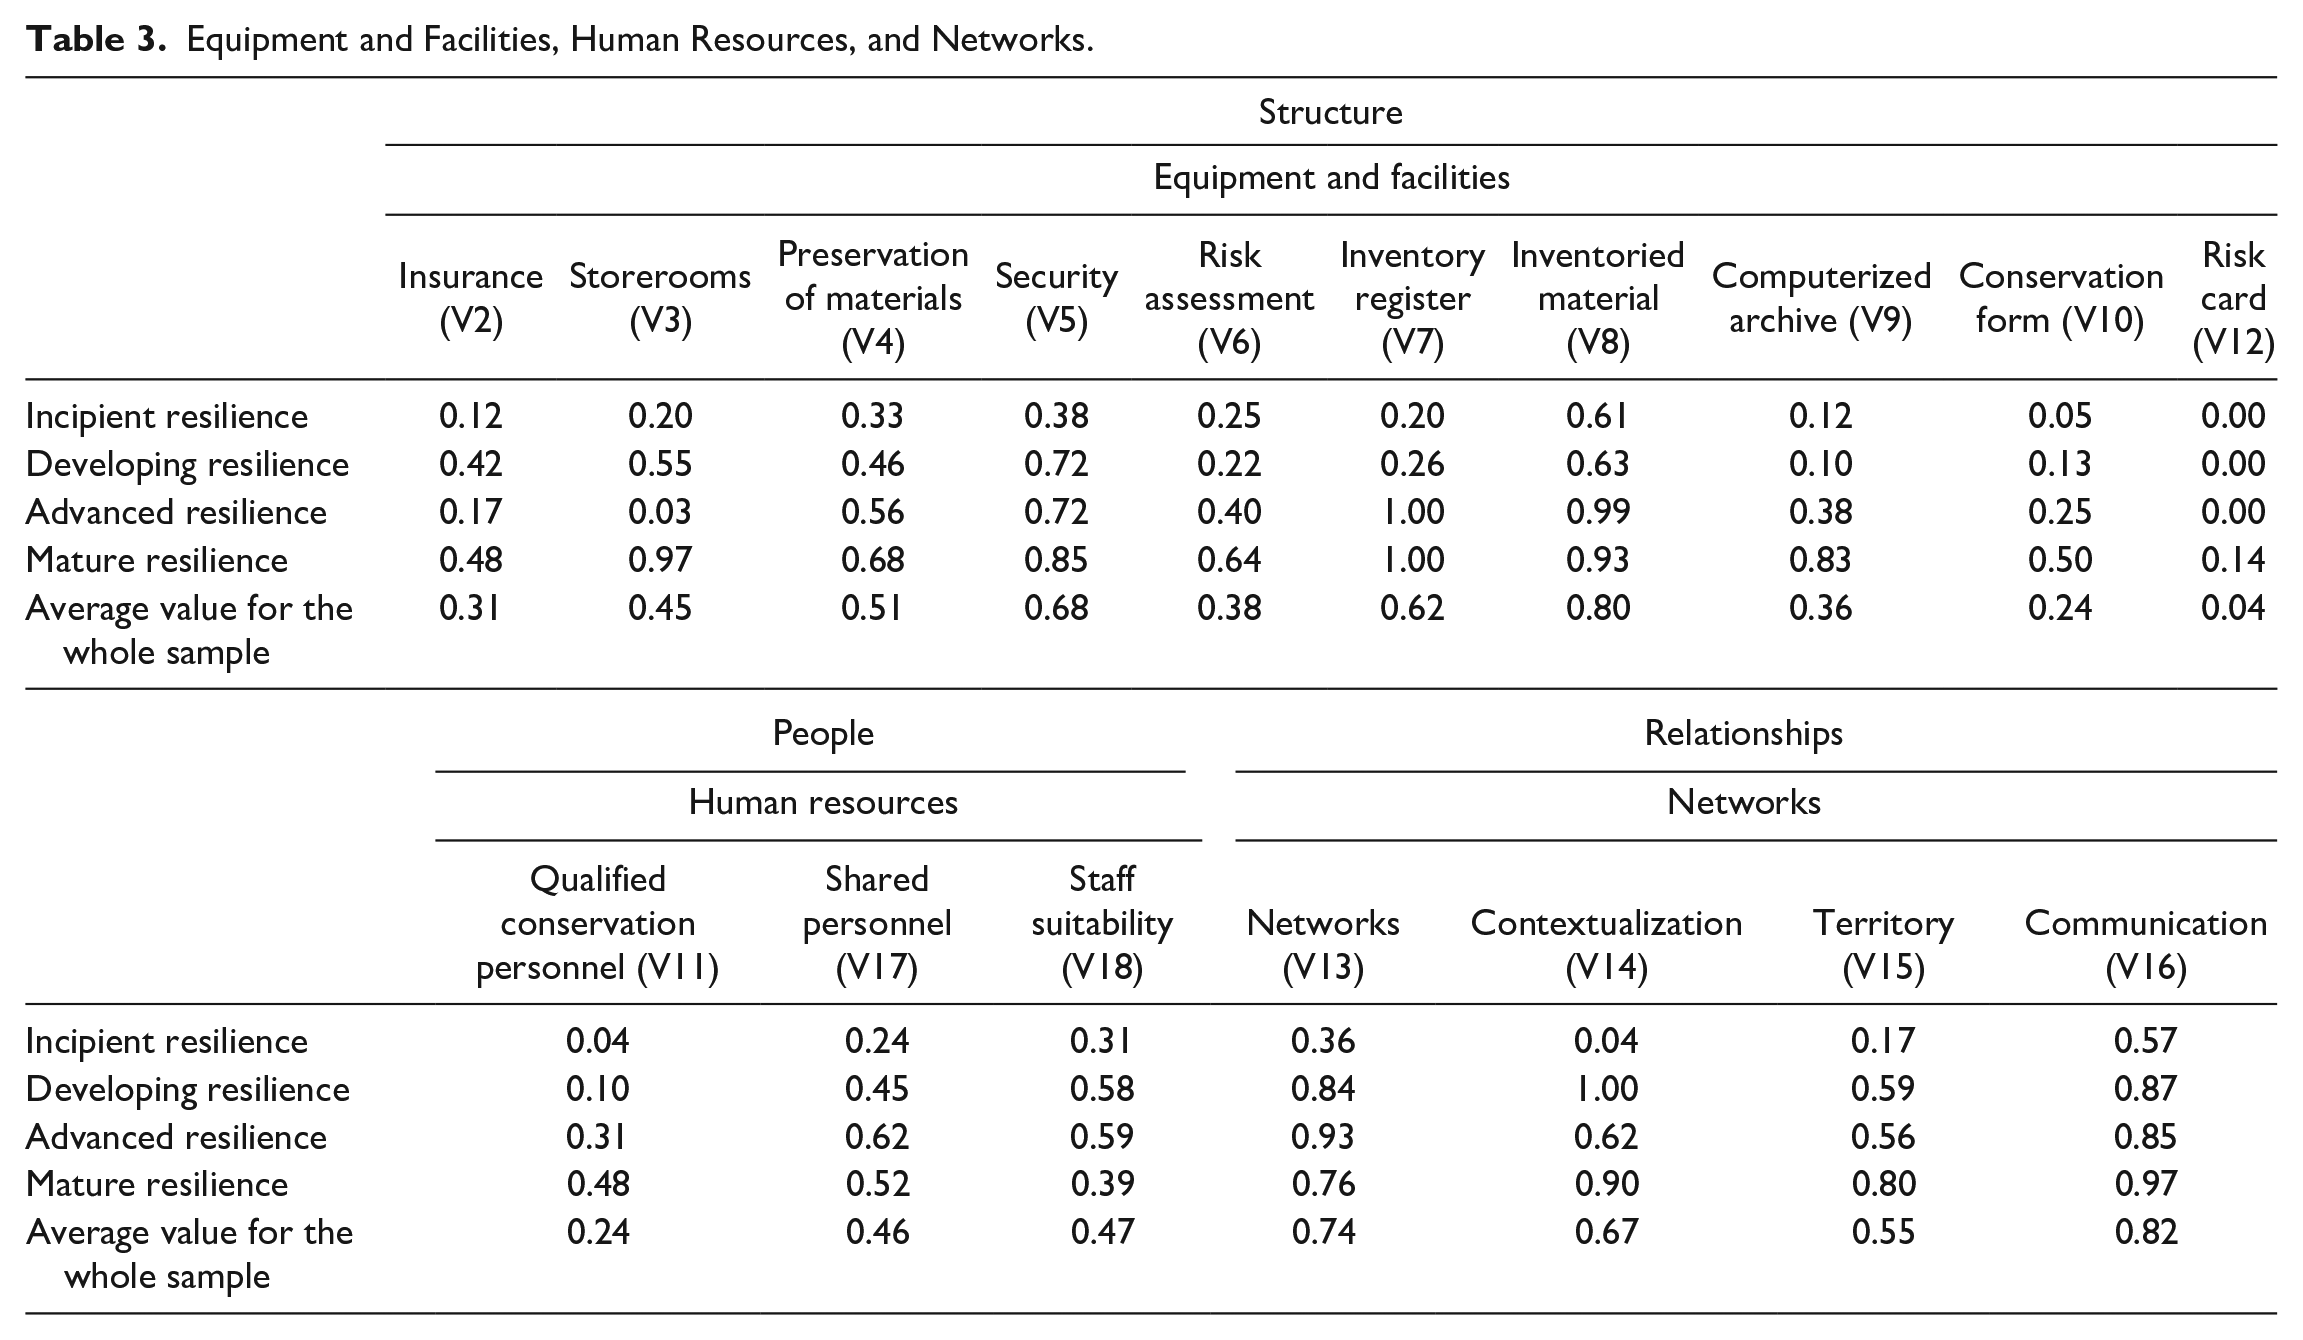
The first two clusters usually have below-average values. The third and fourth clusters, on the contrary, present above-average rating in values for almost all variables.
We can summarize the main characteristics, strengths, and weaknesses of the clusters as follows.
Incipient Resilience
The cluster comprises small museums, usually located in small villages, in mountain and rural areas. Significant weaknesses (average <0.3) are found in most of the dimensions, such as services; human resources, especially in terms of qualified conservation staff (0.04); and in the field of safety and security, namely, collection insurance (0.12), storerooms (0.20), risk assessment (0.25), computerized archive (0.12), conservation form (0.05), and risk card (0). These results point to difficulties in ensuring the conservation of cultural heritage preserved in museums.
This cluster shows not only a low “resilience in museums” but also a low potential for fostering community resilience. In fact, several enabling factors in the area of networks and relationships could be improved significantly, especially in their capacity for contextualizing collections (0.04) and their relationships with the surrounding territory (0.17).
Notwithstanding the need for upgrading these main areas, the analysis suggests that self-assessment forms are usually updated, and the cluster’s performance is decent in terms of opening days (0.57), inventory (0.61), and external communication (0.57).
Developing Resilience
The cluster comprises small museums, usually located in small towns or villages in mountain and rural areas. Compared with the previous cluster, these museums are in areas that have experienced tourist development during the past decade. It is worth noting that this cluster includes most of the museums with a specific focus on local traditions and artisanal activities related to other idiosyncratic resources or aspects of historical heritage in the territory. These characteristics explain their higher positioning in terms of “Relationships with the territory” comparable to the more advanced clusters (Figure 4). In particular, it is worth noting that all 31 respondents in this group state that the museum’s communication tools contextualize collections within the territory (Table 3). External communication is also developed (0.87). In addition, museums in this group generally belong to networks (0.84).
Security (0.72), storerooms (0.55), and insurance (0.42) are above the sample average. Nevertheless, this group shows several major weaknesses in terms of preservation of material (0.46), inventory (0.26), risk assessment (0.22), conservation form (0.13), computerized archive (0.10), and risk card (0).
While respondents contend that there are sufficient numbers of staff, they also signal criticalities in terms of the qualifications of their human resources. This result is evidenced by an average presence of suitably qualified personnel (0.10), which is significantly below the average for the entire sample.
By combining the information on the higher average number of opening days, compared with the other proximate clusters, the availability of services, especially on-site services, the number of visitors, and strong links with the territory, we can infer that museums in this cluster are good candidates for being “museums for resilience.” Nevertheless, they should improve their level of “resilience in museums.”
Advanced Resilience
This cluster is the most heterogeneous and records above-average values for almost all the enabling variables. The only evident weaknesses that are significantly below average are in insurance (0.17) and storerooms (0.03). Compared with the preservation of materials, security systems, and risk assessment, these factors are optional and belong to improvement objectives. The contextualization of collections is slightly below average (0.62).
All the museums included in this cluster have an inventory register (1); also, inventoried material is present in almost all the organizations (0.99). They also recorded above-average values for enabling factors related to human resources: qualified personnel (0.31), shared personnel (0.62), and staff adequacy (0.59).
In this case, even if the museums in this group are resilient both in terms of safety and security, and in terms of human resources, we can see that they promote resilience to a lesser degree than the previous group. Areas for improvement include on-site and online services, service cards, and opening hours, where this cluster underperforms compared with the sample average.
Mature Resilience
The “Mature resilience” group mostly consists of the largest museums located in the major urban centers in the crater (Macerata, Tolentino, Ascoli Piceno, and Fabriano). Values are significantly above average for several enabling factors related to structure and relationships.
The cluster achieves high performances, with several enabling factors reaching values above 0.8, such as storerooms, security, inventories, computerized archive, communication, links with the territory, contextualization of collections, online services, and opening days.
Notwithstanding the widespread availability of equipment, facilities, services, and relationships, our explorative analysis suggests that the endowment of human resources is highly heterogeneous within the cluster (Figure 4). In addition, staff suitability is a significant weakness, with a value below average (0.39).
In short, the museums in this cluster can easily be associated with the two notions of “resilient organisations” and “resilient agents.”
To summarize, our explorative analysis suggests that there is room for skills upgrading or re-skilling in all the clusters. Moreover, apart from the characterization of the polar cases of incipient and mature clusters that are intuitive, the two intermediate clusters show a different positioning in terms of resilience because of the different presence of enabling factors related to structure and relationships, respectively. The museums included in the “Developing resilience” cluster are more developed in terms of relationships and networks, while presenting various criticalities related to physical equipment and facilities. Conversely, the museums in the “Advanced resilience” group have good safety and security facilities, but underperform, compared with the former in several networking and relationship aspects, particularly on the contextualization of collections within the territory.
Hence, some specific actions in the enabling domains—with different priorities in the different clusters depending on specific needs—may be required to trigger the virtuous cycle highlighted in Figure 3 that is fundamental for long-term sustainability.
Conclusion
Starting from a theoretical model based on three enabling factors, we proposed a method to characterize museums in terms of resilience, especially in areas affected by natural disasters. In this respect, it is worth reminding that our attention on relationships is based on the related literature where a variety of social capital networks have been recognized as important drivers of “adaptive resilience” for the recovery from natural disasters (see Adger et al., 2005; Aldrich, 2012 among others).
The cluster analysis allowed us to classify the sample of museums into four groups: Incipient, Developing, Advanced, and Mature resilience. Moving from the first cluster to the fourth cluster, a higher degree of safety and security and deeper relationships with other local institutions are found, while human resources is an area that could be improved in all clusters. The research confirms the weaknesses of cultural organizations (Pratt, 2017), suggesting there is room for significant upgrading in terms of both the suitability and the qualifications of personnel.
The analysis reveals several weaknesses in the museum system of the “seismic crater,” despite the potentialities of the investigated area related to the presence of a diffuse cultural heritage (NSSAM, 2017). Particularly notable is the small number of museums in the fourth cluster (“Mature resilience”) and a lack of adequate conservation systems and human resources in the majority of the museums. The museum system as a whole has proven to be an unstable system of short-term, precarious employment contracts and wide use of “free labour” (i.e., interns and volunteers). The research also suggests that any resilience that is emerging and developing should be fostered and maintained by setting up effective networks.
In terms of public policy and managerial implications, we share the view that idiosyncratic/specific cultural resources are an essential requisite for promoting sustainable local development in inland areas and could play a key role in counteracting demographic decline and relaunching the local economy (UVAL, 2014). However, to be effective, implementation needs to be supported by public policy and actions (Bellandi & Santini, 2017). Moreover, any intervention should be preceded by an accurate analysis of initiatives carried out in the past, their impact, strengths, and weaknesses, with the aim of avoiding the same errors.
A cluster analysis was performed as an exploratory data analysis technique. Clustering methods are intended largely for generating rather than testing hypotheses. Hence, this work should be considered as a first step toward defining a hypothesis to be tested in the data, such as the impact of museum resilience on regional and community resilience. These developments are left for future research. The model presented in this article can be applied and repeated in other contexts. It can contribute to understanding the specific priorities and the areas of improvement that are urgently needed in each situation and group of museums.
The main limitation of our research is that it focuses on the analysis of the enabling components of museum resilience, taking data from a regional authority’s Museum Information System. This approach is not sufficient to understand museum resilience capacity “as a unique blend of cognitive, behavioural, and contextual properties” that could increase museums’ ability to understand their “situation and to develop customized responses that reflect that understanding” (Lengnick-Hall & Beck, 2005, p. 750). Further research should adopt qualitative methods to investigate how museums access and/or mobilize resources embedded and available in social relationships (Doerfel et al., 2013), and establish interorganizational networks that become a social infrastructure for community resilience (Kim et al., 2021). Moreover, it would be important to investigate whether and to what extent the urban structure, particularly the distance to main cities, might influence the relationship between museums and resilience, both in terms of “resilience in museums” and “museums for resilience.”
Footnotes
Appendix
List of Variables and Encoding of Questionnaire for the Cluster Analysis.

| Dimensions | Variables/enabling factors | Questions (yes, no) |
|---|---|---|
| General information | Year (V0) | Year in which the form was completed |
| Update of self-assessment form (V1) | Is the self-assessment form updated to the last survey? (0; 1) | |
| Opening (V19) | Total number of opening days: (1, . . ., 6) | |
| 1. <50 | ||
| 2. 51–119 | ||
| 3. 120–150 | ||
| 4. 151–200 | ||
| 5. 201–250 | ||
| 6. >250 | ||
| Number of visitors (V23) | Average number of visitors in the past 3 years | |
| Structure | Insurance (V2) | Are the museum’s collections insured? (1; 0) |
| Storerooms (V3) | Does the museum have storerooms? (1; 0) | |
| Preservation of materials (V4) | 1. Ability to preserve materials from damage (1; 0) | |
| 2. Functional lighting for storage and reading (1; 0) | ||
| 3. Exhibition halls equipped with instruments for T, U Lux (1; 0) | ||
| 4. Heating systems (1; 0) | ||
| 5. Moisture installations/dehumidification (1; 0) | ||
| 6. Air-conditioning systems (1; 0) | ||
| Security (V5) | 1. Does the museum conform to the requirements of Legislative Decree 81/08 (as amended)? (1; 0) | |
| 2. Is there a person in charge of prevention and protection at the museum? (1; 0) | ||
| 3. Does the museum have all the certifications (e.g., approval, testing) for its installations (Ministerial Decree 37/08)? (1; 0) | ||
| 4. Does the museum have certifications relating to fire regulations? (1; 0) | ||
| Risk assessment (V6) | 1. Environmental risk assessment (1; 0) | |
| 2. Structural risk assessment (1; 0) | ||
| 3. Safety-in-use assessment (large inflows or catastrophic events) (1; 0) | ||
| Inventory register (V7) | Does the museum have an inventory register? (1; 0) | |
| Inventoried materials (V8) | Inventoried materials (1, 2, and 3) (1: < 80%; 2: > = 80%; and 3: = totally) | |
| Computerized archive (V9)Conservation form (V10) | Does the museum have a computerized archive? (1; 0)1. Completion of the material conservation sheet (1; 0)2. Periodic updating of the conservation form (1; 0)3. Planning of conservation and/or restoration interventions (1; 0)4. Control procedures (1; 0) | |
| Risk card (V12) | Does the museum prepare a “risk card” for materials and works that cannot be moved? (1; 0) | |
| People | Qualified conservation personnel (V11) | Does the museum have suitably qualified personnel for conservation operations? (1; 0) |
| Shared personnel (V17) | Does the museum share personnel? (1; 0) | |
| Staff suitability (V18) | Is the staff suitable for the following: | |
| 1. The functions needed for the size of the museum? (1; 0) | ||
| 2. Duties related to the characteristics of the assets? (1; 0) | ||
| 3. Duties related to the museum’s functions? (1; 0) | ||
| Relationships | Networks (V13) | Is the museum part of museum hubs, networks, or systems? (1; 0) |
| Contextualization (V14) | Do the museum’s communication tools contextualize collections within the territory? (1; 0) | |
| Territory (V15) | 1. Tourist-cultural routes in the reference territory (1; 0) | |
| 2. Decentralized information systems in the territory (e.g., signage) (1; 0) | ||
| 3. Relations with schools in the area (1; 0) | ||
| 4. Relations with other cultural institutions in the area (1; 0) | ||
| 5. The museum carries out cultural activities in the territory (1; 0) | ||
| 6. Dissemination activities promoting the territory (1; 0) | ||
| Communication (V16) | 1. Is the museum included in tourist information circuits? (1; 0) | |
| 2. Does the museum have information materials about other cultural offerings in the territory? (1; 0) | ||
| 3. Does the museum have brochures, information leaflets? (1; 0) | ||
| Services | Service charter (V20) | Does the museum have a service charter? (1; 0) |
| Services (V21) | The museum provides the following services: | |
| 1. Ticket office (1; 0) | ||
| 2. Sale of information material (1; 0) | ||
| 3. Educational services (1; 0) | ||
| 4. Guided tours (1; 0) | ||
| Online services (V22) | Does the museum have online services? (1;0) |
Declaration of Conflicting Interests
The author(s) declared no potential conflicts of interest with respect to the research, authorship, and/or publication of this article.
Funding
The author(s) received no financial support for the research, authorship, and/or publication of this article.