



Abstract
The theory of the nonprofit institutional form developed by Henry Hansmann emphasizes the importance of organizational trustworthiness in a sector defined by hard-to-measure outputs. This body of theory effectually rationalizes a normative approach to nonprofit financial management focused on maintaining organizational trustworthiness through fiscal probity signaling. Such signals include measurable indicators of overhead minimization, fiscal leanness, revenue diversification, and debt avoidance, among others. Appropriate signaling behavior may increase organizational trustworthiness as intended, but the effects on mission impact are not well understood. Thus, this article assesses how adherence to common fiscal probity norms affects mission impact, using total spending as a proxy. Based on a panel of donative public charities spanning 1982 to 2019, analysis suggests that norm-adhering nonprofits sacrifice about half of their mission impact over a 10-year period compared with norm-busting nonprofits. This forgone mission impact is the hidden cost of trustworthiness.
Prior research has called for a fundamental reexamination of widely held norms or conventional wisdom of nonprofit financial management as a growing body of empirical research has called many long-standing assumptions into question (Mitchell & Calabrese, 2019). Traditionally, nonprofits are expected to adhere to specific financial management norms to appear trustworthy in the eyes of donors and other stakeholders. Trustworthiness is essential for nonprofits because, according to contract failure theory, nonprofit activities, outputs, outcomes, and impacts are assumed to be too difficult or costly to observe or measure (Hansmann, 1980; Weisbrod, 1988). In lieu of such evidence, nonprofits must demonstrate trustworthiness by signaling fiscal probity. Fiscal probity is indicated by the degree to which a nonprofit conforms to specific financial thresholds and benchmarks relative to their peers (Mitchell & Calabrese, 2019). However, prior research has proposed that common financial management practices undertaken to enhance organizational trustworthiness may harm nonprofits in other areas. Mitchell (2018), for example, argues that some normative financial management practices intended to improve trustworthiness may reduce mission impact, while some instrumental management practices intended to maximize mission impact may reduce trustworthiness.
This article examines empirically whether normative nonprofit financial management practices essential for signaling fiscal probity and trustworthiness are negatively associated with mission impact. Because mission impact data are unavailable, total spending is employed as a proxy. The analysis suggests that norm-adhering nonprofits sacrifice about half of their mission impact over a 10-year period compared with norm-busting nonprofits. This forgone mission impact is the hidden cost of trustworthiness.
The next section develops the theory as to why signaling trustworthiness might affect the financial and therefore the mission performance of nonprofits, elaborating upon the concept of fiscal probity signaling and describing its significance for nonprofits, or more specifically, for donative public charities. This is followed by a section describing the Form 990 data from 1982 through 2019 and the empirical approach used to test how norm-busting may influence total spending by nonprofits. The subsequent section describes and illustrates the empirical results. The penultimate section discusses the general patterns observed in the analysis, and the conclusion offers some final remarks and suggestions for future research.
Theory
Mitchell and Calabrese (2019, 2020) take as their starting point the established and largely accepted theory—so-called contract failure theory—initially developed by Hansmann (1980, 1981) and later elaborated upon by Weisbrod (1986, 1988) and others that one reason the nonprofit sector exists is to produce outputs for which performance information is effectually unavailable. 1 According to this theory, the so-called nondistribution constraint, which prohibits private inurement, renders nonprofits more trustworthy than businesses, the latter of which face incentives to sacrifice output or quality for increased profits (Hansmann, 1980). Although the inability of nonprofit managers, leaders, and board members to personally profit may lead to increased trust in nonprofit organizations, it also introduces an efficiency problem because nonprofit practitioners no longer have strong financial incentives for maximizing performance. In addition, because donors lack performance information, they are unable to induce efficiency by rewarding performance or systematically preferring higher performing organizations. Donors donate and receive “warm glow” benefits from their contributions not because they obtain verification of output production, but because a nonprofit’s perceived trustworthiness warrants a presumption of successful performance (Mitchell and Calabrese, 2020). 2 Because fiscal probity signals indicative of trustworthiness are observable, but mission performance data are not, the former are arguably more important for organizational survival than the latter. In theory, even low-performance nonprofits could survive indefinitely simply by signaling trustworthiness to the satisfaction of resource providers (Seibel, 1996). As a result, nonprofits may act on incentives to subordinate mission performance (which is theoretically unobservable) to probity signaling (which is routinely observed).
Because nonprofit outputs are thought to be too difficult, costly, or impossible to observe, nonprofits attract support not necessarily by providing credible information about mission performance but by maintaining trustworthiness through fiscal probity signaling. Mitchell and Calabrese (2019) argue that trustworthiness is maintained through conformance with accepted norms of fiscal propriety that may or may not be related to mission performance but are consistent with nonprofits acting as “stewards of expressive almsgiving” (p. 650). Yet the sector has changed over time as many stakeholders have become more data-driven, and outcome-oriented philanthropy, contracting arrangements, and pay-for-performance schemes have become more commonplace. Hence, nonprofits are increasingly asked about their mission performance and can rely less upon trustworthiness signals as a primary source of legitimacy. As a result, signaling norms appear to be changing as the informational environment in which nonprofits operate evolves (Mitchell, 2018). Nevertheless, the culture emphasizing fiscal probity norms and organizational trustworthiness still exists and remains relevant for understanding management incentives, decision-making behavior, and philanthropic giving. Indeed, a meta-analysis of studies examining the empirical relationship between trust and philanthropic giving found overall positive effects, with organizational and sectoral trust having the largest associations with giving (Chapman et al., 2021). Both theoretically and empirically, organizational trustworthiness remains an important characteristic for nonprofits.
Probity Signaling
Essentially, probity signaling demonstrates that a nonprofit is respecting the nondistribution constraint and is therefore trustworthy. Mitchell and Calabrese (2019) posit that nonprofit financial management norms emphasize minimizing overhead, diversifying revenues, remaining fiscally lean, and avoiding debt as means of demonstrating this critical trustworthiness. Minimizing overhead maximizes the program spending ratio or the percentage of money allocated directly to programs. The overhead ratio is a historically significant indicator of nonprofit trustworthiness. It has been widely interpreted as an indicator of waste, inefficiency, or contravention of donor intent—essentially a diversion of resources away from an organization’s charitable mission. In particular, online information intermediaries that evaluate nonprofits have long employed the overhead ratio as an explicit measure of nonprofit “inefficiency,” even as research has argued that overhead is not an efficiency measure theoretically or empirically (Coupet & Haynie, 2019). Nevertheless, donors exhibit a general aversion to overhead (Charles et al., 2020; Portillo & Stinn, 2018; Qu & Daniel, 2020), meaning that nonprofits face powerful financial incentives to conform to the norm. In addition, many nonprofit leaders have internalized this norm, with some conflating overhead minimization with organizational effectiveness itself (Mitchell, 2013). Parsons et al. (2017) find that nonprofit managers feel pressure to manage ratios reported to the public. Problematically, the increasing use of cost ratios such as overhead to evaluate nonprofits has led to a “nonprofit starvation cycle” (Gregory & Howard, 2009). To remain competitive, nonprofits vie to report lower overhead than their peers, but as many nonprofits compete within the same peer groups, peer group benchmarks decline and become increasingly unattainable. Scholars have surmised that excessive overhead minimization is likely harming the abilities of nonprofits to advance their missions (Lecy & Searing, 2015; Wing & Hager, 2004).
Revenue diversification is frequently advocated under the belief that adding more revenue streams improves the fiscal health of a nonprofit, increasing its survivability and thus its ability to provide charitable services further into the future (Chang & Tuckman, 1991). Normatively, nonprofits are generally expected to diversify their revenues to mitigate financial volatility (Carroll & Stater, 2009; Hung & Hager, 2018) and to generally avoid excessive risk. However, research has suggested that revenue concentration may be a strategic instrument for achieving faster growth (Chikoto & Neely, 2014; de los Mozos et al., 2016; Frumkin & Keating, 2011; Grønbjerg, 1992), greater administrative efficiency (Foster & Fine, 2007), and consequently, increased organizational impact over time. Research has also noted that types of diversification matter and that diversification is not necessarily a risk-reduction strategy per se (Mayer et al., 2014). Despite the potential benefits of revenue concentration for growth and efficiency, revenue diversification has largely been the suggested norm for nonprofits.
Being fiscally lean refers to not maintaining excessive reserves or earning excessive profits under the assumption that a nonprofit’s resources are better devoted to the immediate provision of charitable outputs (i.e., increased current spending, which would reduce profits). Nonprofits that have excessive financial reserves (often measured in terms of the length of time that a nonprofit could continue its spending without acquiring additional resources) or that appear to profit excessively may be regarded as hoarding resources, being insufficiently needy, or having commercial intent (Calabrese, 2011a). Nonprofits thus face pressures to minimize their reserves (Calabrese, 2013) and to spend rather than retain excess revenues, although doing so may result in significant inefficiencies (Mitchell, 2017). Nonprofit managers may also avoid reporting traditional reserves so that their organizations appear to be lean (Sloan et al., 2016). This behavior is incentivized by stakeholders who primarily evaluate nonprofits on spending (Parsons, 2003) rather than mission performance. Calabrese (2012) finds, for example, that nonprofits on average target low reported profits, presumably to appear more in need of additional donations. Moreover, in the health subsector, Leone and Van Horne (2005) find evidence that certain nonprofits manipulate reported financial results to appear less wealthy than they would otherwise, and Eldenburg et al. (2011) report that some nonprofits increase actual spending to minimize reported profits. Although sectoral norms favor fiscal leanness, some evidence suggests that greater reserve accumulation and profitability may be more prudent for some nonprofits. For example, Irvin and Furneaux (2021, p. 18) find that adhering to a conventional rule of thumb prescribing low levels of reserves (i.e., 3 months’ worth) is “sometimes grossly inadequate” to ensure stability for many Australian nonprofits, while Park et al. (2021) find that profitability and margin are associated with a reduced likelihood of organizational dissolution among U.S. nonprofits.
Avoiding debt is associated with spending resources on charitable output rather than diverting funds to repaying lenders. Research has shown that donors are averse to supporting highly indebted nonprofits (Calabrese & Grizzle, 2012; Yetman, 2007). In the traditional normative financial management paradigm, donor contributions are meant to fund current programs, not past programs or payments to commercial lenders. High levels of debt may also increase the perceived risks of insolvency and dissolution, contrary to conventional notions of risk-averse financial stewardship appropriate for nonprofits. Thus, the norm is that most nonprofits avoid borrowing. In 2017, for example, only one quarter of nonprofits reported any financial debt (Calabrese, 2020).
Despite this norm, borrowing might be advantageous to nonprofits. Short-term borrowing permits nonprofits to manage through timing differences between available and needed cash flow. Long-term borrowing is oftentimes less costly and faster to acquire than fundraising for capital needs; further, capital campaigns are generally unavailable to many nonprofits while borrowing in some form is available to most organizations (Calabrese, 2011b).
Although prevailing nonprofit financial management norms are presumably intended to improve nonprofit mission impact, there are compelling reasons to expect the opposite effect. This may be especially true over time as longer-term benefits of norm-busting may become more apparent. Thus, this article evaluates whether norm adherence negatively affects the mission performance of nonprofit organizations. In other words, adherence to norms that contribute to trustworthiness may stymie nonprofit financial performance over time, implying a negative effect on mission impact.
Such an understanding of norm-adherence versus norm-busting is necessarily relative. As potential donors scan the nonprofit marketplace, they may compare organizations to determine whether one appears to be more trustworthy than another, ceteris paribus. Knowing this, nonprofits may compete to exhibit greater trustworthiness compared with their peers: lower overhead, more diversification, more leanness, and less debt. Regardless of real or perceived competitive pressures, nonprofit managers may simply act on the basis of internalized norms or an unspoken desire to avoid potential disapprobation from stakeholders. Moreover, nonprofit financial management norms are explicitly codified in the rating systems of popular online information intermediaries such as Charity Navigator, CharityWatch, and the Better Business Bureau Wise Giving Alliance. These intermediaries set specific numerical values and ranges for acceptable overhead ratios and other fiscal probity indicators. Informal rules of thumb also help govern nonprofit financial management practices. For example, the so-called 80-10-10 rule instructs nonprofits to spend at least 80% of their budgets on programs, no more than 10% on fundraising, and no more than 10% on administration. The norm is obvious and unambiguous: minimize overhead.
Institutionalist theory posits that isomorphic processes often emerge when organizations operate in uncertain environments (DiMaggio & Powell, 1983). The informational problem that defines the nonprofit sector—the assumed unobservability of nonprofit outputs—provides a case of extreme uncertainty. With insufficient performance information available throughout the sector, individual nonprofits have little guidance about how to best advance their missions. When such uncertainty prevails, institutionalism predicts that organizations may react to coercive, memetic, and normative isomorphic pressures to maintain legitimacy. The resulting isomorphic processes may operate through a variety of mechanisms. For example, coercive isomorphism may operate through funder requirements and rating agency standards; memetic isomorphism may occur when nonprofits benchmark their financial ratios against their peers; and normative isomorphism may operate through educational curricula and the increasing professionalization of the nonprofit sector. DiMaggio and Powell (1983) are careful to emphasize that institutional isomorphism is not related to actual efficiency or effectiveness but simply represents a coping strategy for securing legitimacy under conditions of uncertainty. In practice, this suggests that nonprofits will attempt to secure legitimacy by conforming to sectoral financial norms regardless of the efficacy of doing so in terms of mission impact. In short, nonprofit theory, empirical research, and institutionalism all articulate compelling reasons why nonprofits might conform to nonprofit financial management norms even if the effects on mission impact are adverse.
Scope Condition: The Donative Public Charity
Although all nonprofits likely face pressures to signal fiscal probity to some degree, such pressures may not be felt equally across all types of nonprofit. Hansmann (1980, 1981) developed a typology of nonprofits based on how they secure their income and how they are controlled, producing four types—donative-mutual, donative-entrepreneurial, commercial-mutual, and commercial-entrepreneurial. He repeatedly emphasized that his so-called contract failure theory involving the nondistribution constraint and organizational trustworthiness was most applicable to the donative-entrepreneurial type. Indeed, in later years, he emphasized the incompleteness of his theory with respect to other types of nonprofit (Hansmann, 2003).
Donative nonprofits are the most likely type to be affected by the informational problems upon which contract failure theory is predicated. By contrast, nonprofits that primarily rely on government grants and contracts or service fees confront purchasers that are likely to be more informed than donative purchasers. For example, government funders often require recipients to regularly report output information, mitigating informational problems and diminishing the importance of fiscal probity signaling. In addition, purchasers who are themselves also service recipients are likewise in a superior—even if still imperfect—position to judge service quality. In any case, providers of donative income should be the least able to observe service quality, and it is for these purchasers that trustworthiness is most important, as has been supported empirically (e.g., Konrath & Handy, 2018). In short, it is specifically for donative nonprofits for which fiscal probity signaling should be most relevant and thus donative nonprofits —defined as registered public charities that receive a majority of their income from donations—are the focus of this study.
Data and Methods
Data for 1982 to 1983 and 1985 to 2012 are obtained from the Urban Institute’s National Center for Charitable Statistics (NCCS) database of Internal Revenue Service (IRS) Statistics of Income (SOI) annual data files. 3 The data describe financial information for 501(c)3 public charities based largely on the IRS Form 990. Each annual SOI file includes a census of larger organizations and a stratified random sample of smaller organizations based on a threshold of US$10 million in total assists prior to 2000 and a threshold of US$30 million in total assets through 2012 (NCCS, 2013).
Data for 2013 to 2019 are obtained from the IRS’s SOI Division and the NCCS’s database of IRS Business Master Files (BMF) for 501(c)3 public charities. The SOI and BMF data have been merged to replicate the information contained in the NCCS’s data files prior to 2013, which include data from both the IRS’s SOI and BMF files. SOI data for these years represent a larger universe of digital filers rather than the complex sample designs used in previous years.
The annual data files have been combined into a single master dataset panelized by Employer Identification Number (EIN) and year, creating an unbalanced panel representing primarily larger organizations. 4 Table 1 displays both the total number of observations by year (N) and the total number of observations actually included in at least one model estimation by year (n).
Data by Year.
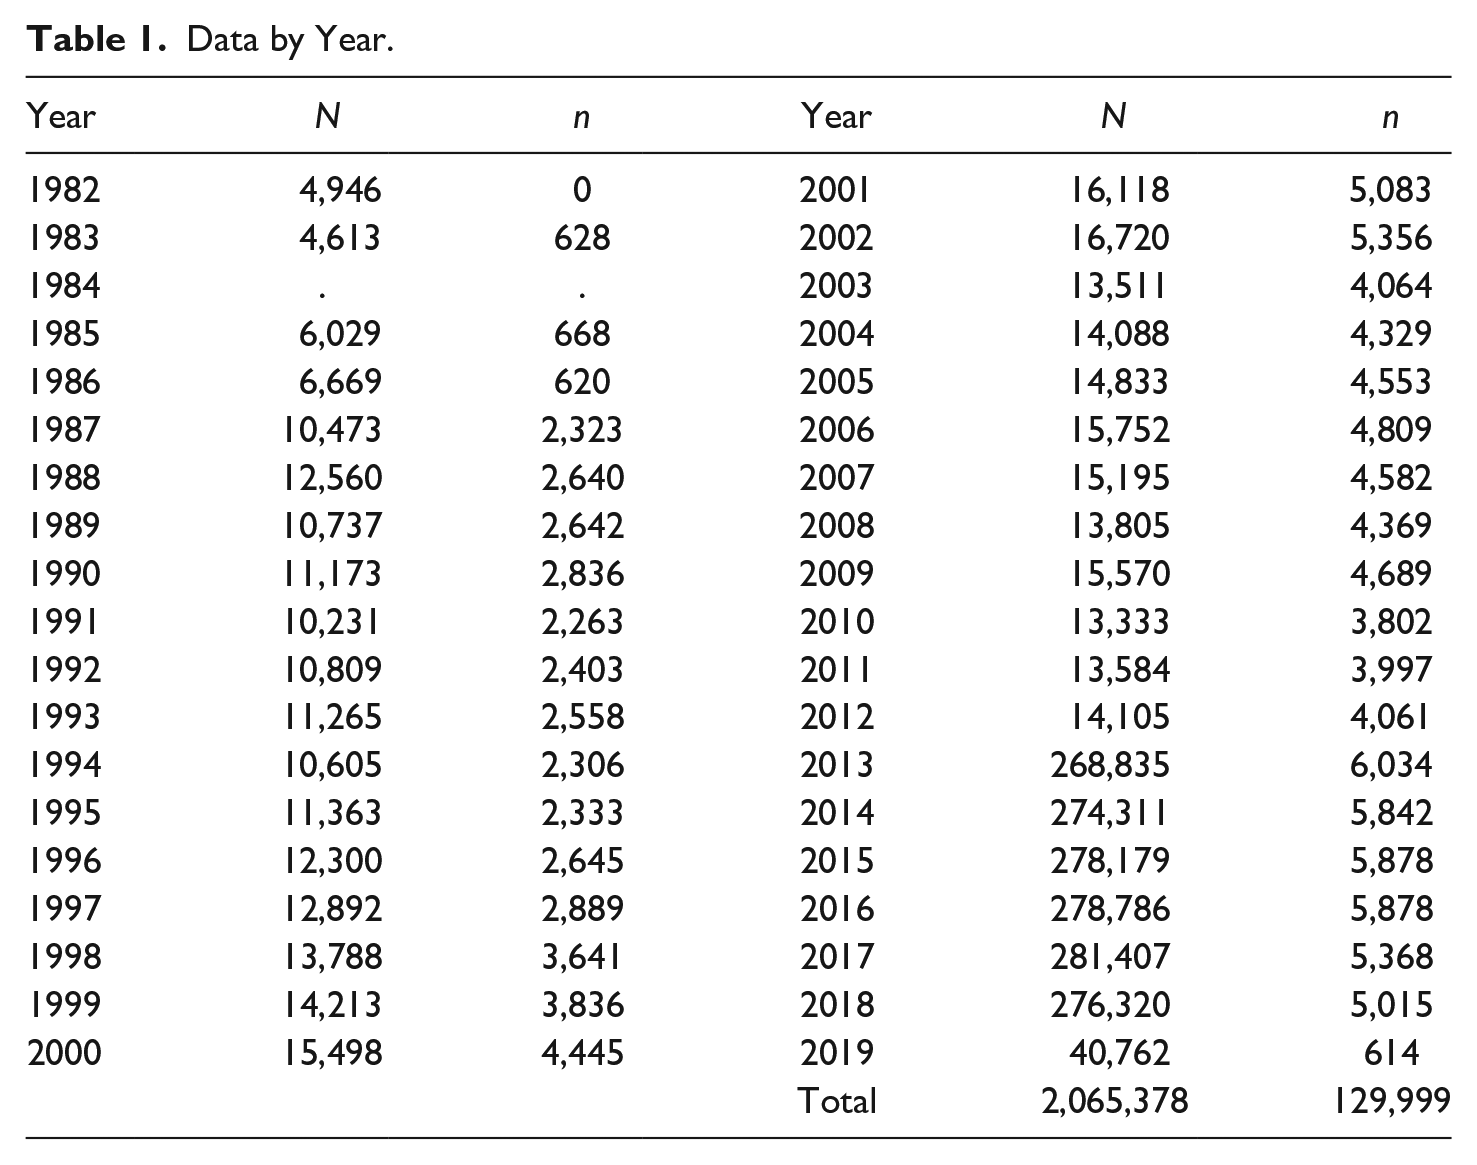
During data processing, the total number of observations is reduced by 10,719 to 2,065,378 by removing out-of-scope observations flagged by the NCCS. Another 1,144,291 observations are removed from model estimations for representing nondonative nonprofits (total contributions / total revenue ≤ 0.50) and thus falling outside of the scope of the relevant theory. Of the remaining 921,087 observations, another 791,088 observations are lost due to missing data in various model estimations, mostly as an artifact of including superfluous observations after 2012. In total, 129,999 observations are used in at least one model estimation.
The dependent variable in all models is the log of total expenses, which is assumed to be a logical prerequisite for, and a strong correlate of, an organization’s mission impact. 5 The independent variables in all models measure common norms of nonprofit financial management practices identified by Mitchell and Calabrese (2019) that are associated with perceived trustworthiness: minimizing overhead, diversifying revenues, being lean, and avoiding debt.
Each independent variable has been transformed into a binary indictor of norm-busting. To measure norm-busting, financial indicators representing common nonprofit financial management norms are dichotomized at the median value within the sector-year. 6 Sector is indicated using the National Taxonomy for Exempt Entities Major Group 12 classification scheme. Thus, an indicator value of zero indicates that an organization is adhering to a norm by being at or below the median level for its peer group, while a value of one indicates that an organization is violating a norm by being above the median level for its peer group. In addition to operationalizing norm-busting, dichotomization at the median helpfully eliminates problems introduced by extreme observations that commonly arise in Form 990 data. The independent variables are operationalized for the four norms as follows:
Minimizing Overhead
To measure norm-busting, the overhead ratio is decomposed into two components: the administrative expense ratio (management and general expenses / total expenses) and the fundraising expense ratio (fundraising expenses / total expenses). The variables are dichotomized at the median value within the sector-year to create binary indicators such that a value of one indicates norm-busting and a value of zero indicates norm-adherence.
Diversifying Revenues
Norm-busting, i.e., revenue concentration, is measured using a modified Herfindahl–Hirschman Index (HHI). The index components consist of six nonprofit revenue streams. These include private contributions, membership dues, government grants, program service revenues, total investment income, and other revenues. The HHI is modified to accommodate nonprofit revenue shares that may be negative, which may result in index values outside of the logical range. To correct this, total income is calculated as the sum of the absolute value of each index component. The index is then given by the standard formula, the sum of the square of each revenue source’s share of calculated total income. More formally,
Being Lean
Reserves are indicated by years of net assets (total net assets / total expenses) or the length of time that a nonprofit could maintain its current level of spending by drawing down its net assets without additional income—similar to the measure employed by Calabrese (2018). Profit is indicated by the profit ratio or total margin (change in net assets / total revenue) (Bowman et al., 2011; Charles, 2018). To measure norm-busting, these indicators are dichotomized at the median value within the sector-year. A value of zero indicates norm-adherence and a value of one indicates norm-busting.
Avoiding Debt
Borrowing is measured by the interest expense ratio (interest expense / total expenses). Prior research has found that this measure influences contributions while the debt ratio does not (Charles, 2018). To measure norm-busting, this indicator is dichotomized at the median value within the sector-year such that a value of zero indicates norm-adherence and a value of one indicates norm-busting. Table 2 provides a variable crosswalk defining each variable in terms of the corresponding lines from the Form 990, the primary data source.
Variables and Sources.

Table 3 provides the summary statistics for the relevant variables. Because we rely upon SOI data, total expenses are relatively high with an average of over US$19 million annually. Interestingly, the average administrative expense ratio and fundraising expense ratio sum to 20%, which roughly comports with the conventional rule of thumb or norm concerning overhead. The HHI suggests modest revenue diversification. 7 Years of net assets has an average of over 66 years. However, the data are highly skewed as evidenced by the large standard deviation; the median is just over 2 years. This skew is well known in the nonprofit sector. Similarly, the profit ratio (margin) is −7% and displays a slighter skew with a median of 6%. Finally, the interest expense ratio of 2% suggests low debt usage by nonprofits in the sample.
Summary Statistics.

Note. The summary statistics describe all cases that were used in at least one model estimation (see Table 4). The IRS SOI extracts do not include data on administrative expenses, fundraising expenses, or government grants after 2012. Thus, data on the administrative expense ratio, fundraising expense ratio, and the HHI are missing for those years. Cases for 2013 to 2019 are included in lagged models when the independent variables are available in years prior to 2013. The sample includes only donative nonprofits (public charities). All models employ the log of total expenses as the dependent variable. The administrative expense ratio, fundraising expense ratio, interest expense ratio, profit ratio, and years of net assets are all dichotomized at the median for the sector-year in all models. All financial variables are expressed in nominal terms. HHI = Herfindahl–Hirschman Index; IRS = Internal Revenue Service; SOI = Statistics of Income.
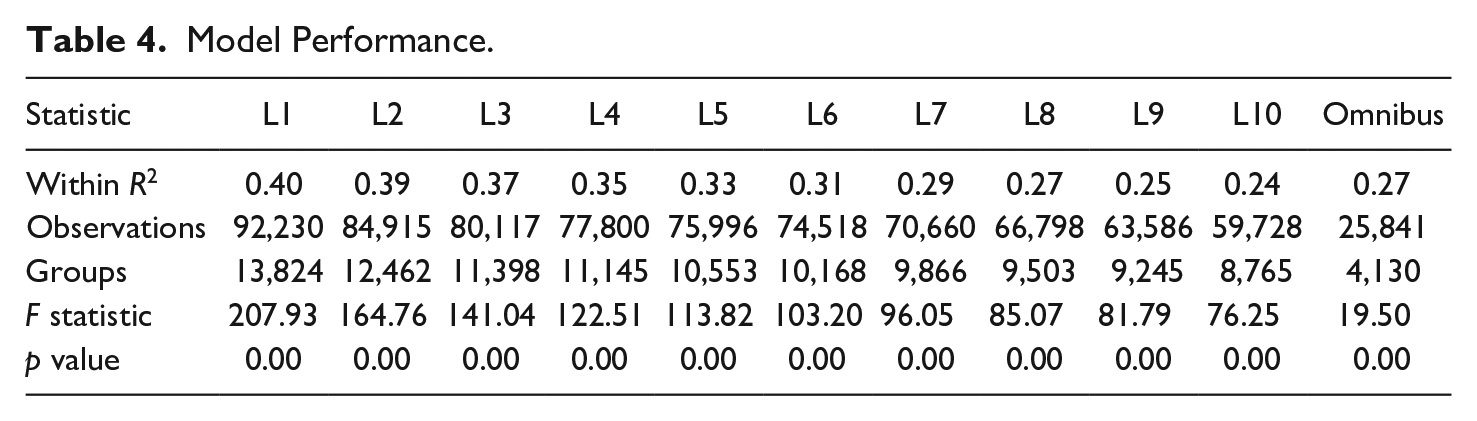
Eleven fixed-effects panel regression models with robust standard errors are estimated. Ten models lag all the independent variables from 1 to 10 years, respectively. The 11th model is an omnibus model that estimates the cumulative effect of norm-busting on total spending over a 10-year period.
Results
Table 4 displays model performance statistics for the 11 fixed-effects models. Figures 1 and 2 illustrate the effects of busting the overhead norm over a 10-year period. The effect of busting the administrative expense ratio norm begins strongly negative, rapidly diminishes over the first 5 years, and then becomes insignificantly different from zero by the nine-year mark. The cumulative effect on total spending over a 10-year period is about −12.88%. Spending a higher percentage on administration is associated with lower overall spending, possibly because donors remove future contributions. This is consistent with the general notion that donors consider overhead spending to be a wasteful diversion of resources from current program spending (e.g., Tinkelman, 2006) and comports with the literature on the largely negative association between overhead spending and donations. 8 However, busting the fundraising expense ratio norm has a consistently positive effect on total spending, with the effect gradually diminishing over time in a linear pattern. The cumulative effect over a 10-year period is about 15.13%. These results complement the work of Young and Steinberg (1995) who find that minimizing fundraising ratios leads to inefficient revenue generation, which in turn exerts negative effects on total spending.
Model Performance.
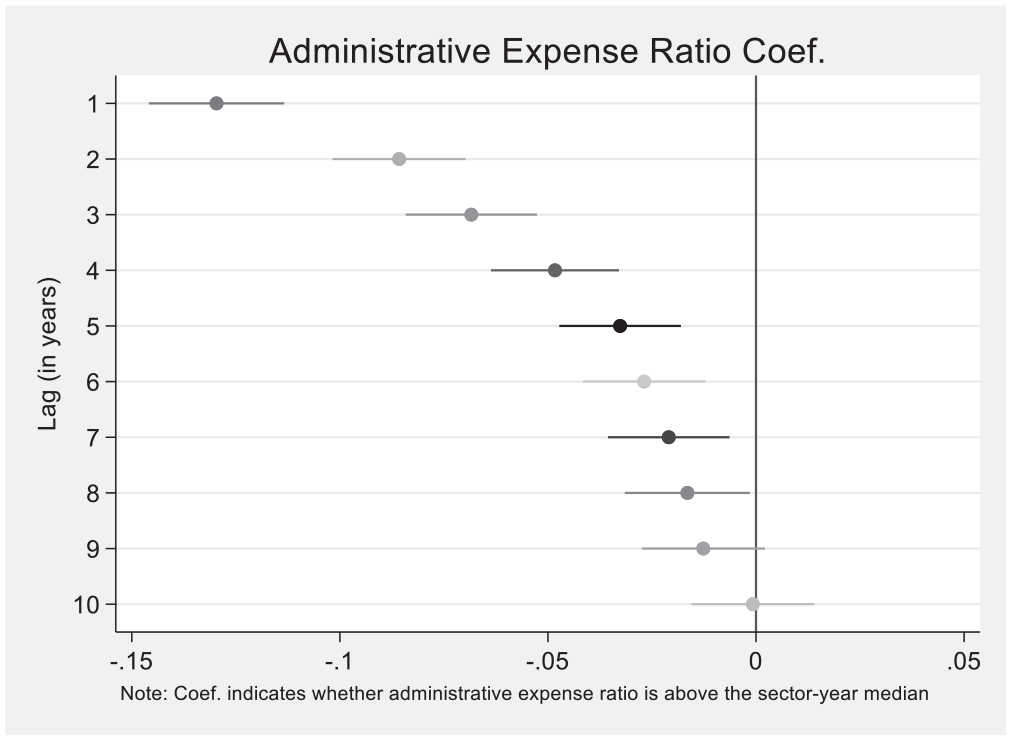
Administrative expense ratio effect by lag.
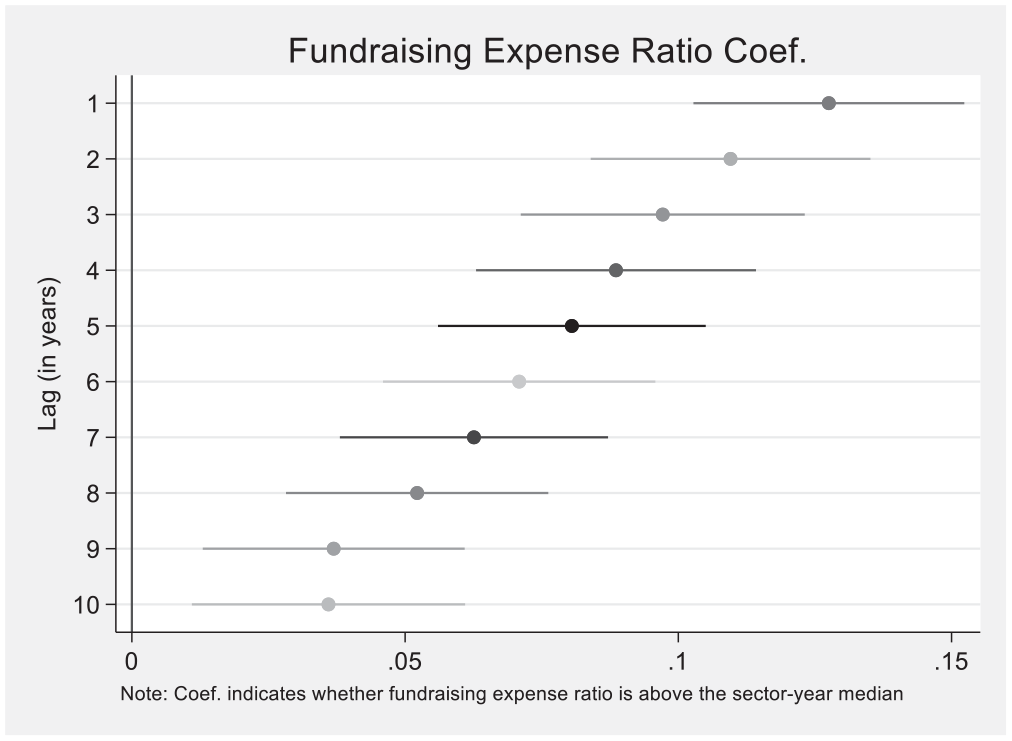
Fundraising expense ratio effect by lag.
Busting the revenue diversification norm with above-median revenue concentration contributes an increase of about 17.36% to total spending over a 10-year period. The effect is most strongly positive at Years four and six; see Figure 3. This agrees with the results established by Frumkin and Keating (2011) and Chikoto and Neely (2014) who find that revenue concentration is associated with revenue growth that exceeds that of more diversified revenue portfolios. These results lend credence to the notion that nonprofits that specialize and concentrate revenues may have growth advantages over those nonprofits that diversify.
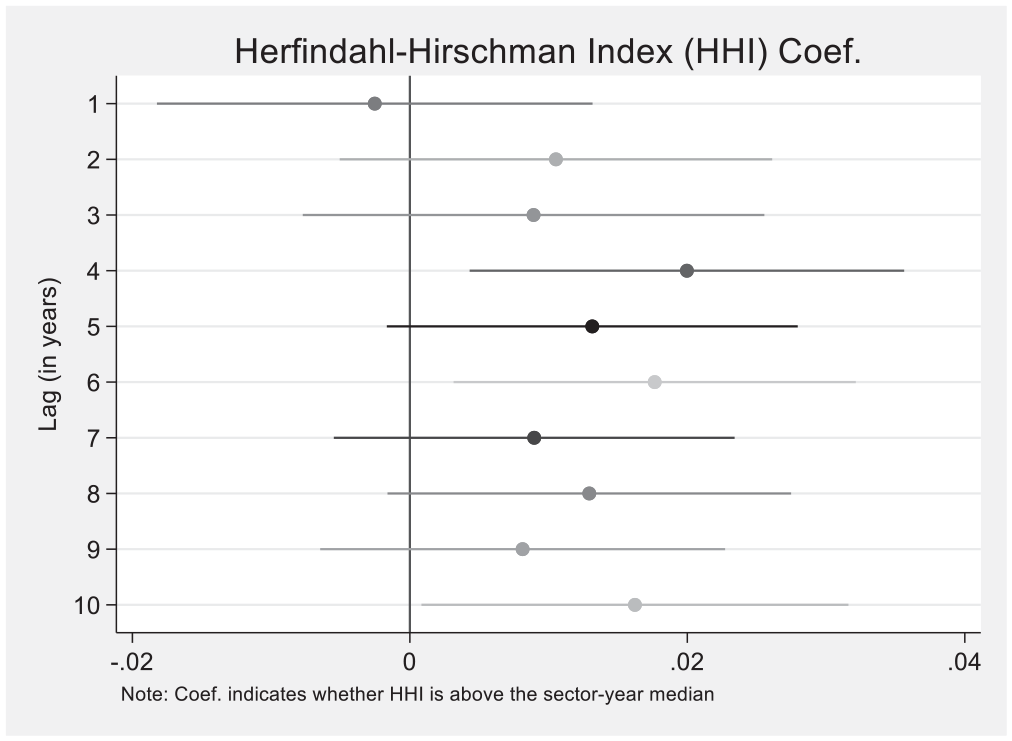
HHI (revenue concentration) effect by lag.
Figures 4 and 5 illustrate the effects of busting the fiscal leanness norm. Figure 4 shows the effects of maintaining above-median levels of reserves (years of net assets). Initially, the effect is strongly negative, but it rapidly becomes insignificantly different from 0 by Year 4. The cumulative effect on total spending is about −9.50%. These results suggest that although holding back some resources as reserves initially reduces spending (almost by definition because the nonprofit did not expend the money), the negative effects diminish to zero after a few years. The effects of busting the profit ratio norm are shown in Figure 5. At Year 1, the effect is negative (again, almost by definition), but then the effect becomes positive in subsequent years, peaking at about Year five. The cumulative contribution to total spending over a 10-year period is about 31.74%. Although there is an initial negative association with spending, this association is short-lived and quickly leads to spending growth. Retaining profits may allow nonprofits to invest in programs, expand service delivery, and grow organizational infrastructure.
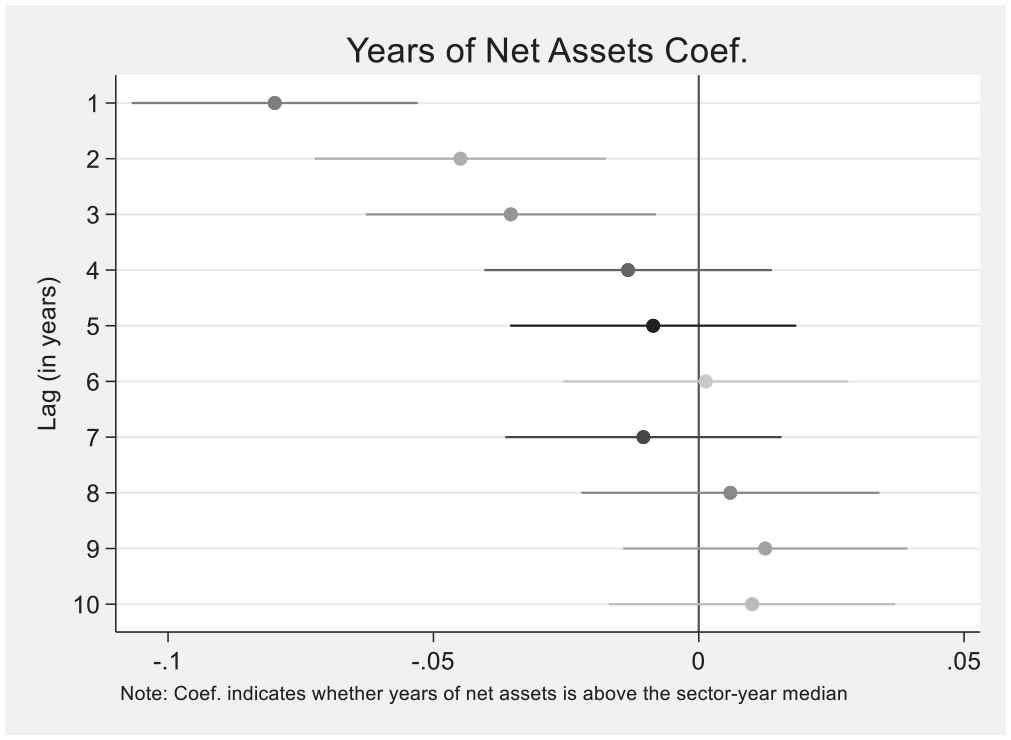
Years of net assets (reserves) effect by lag.
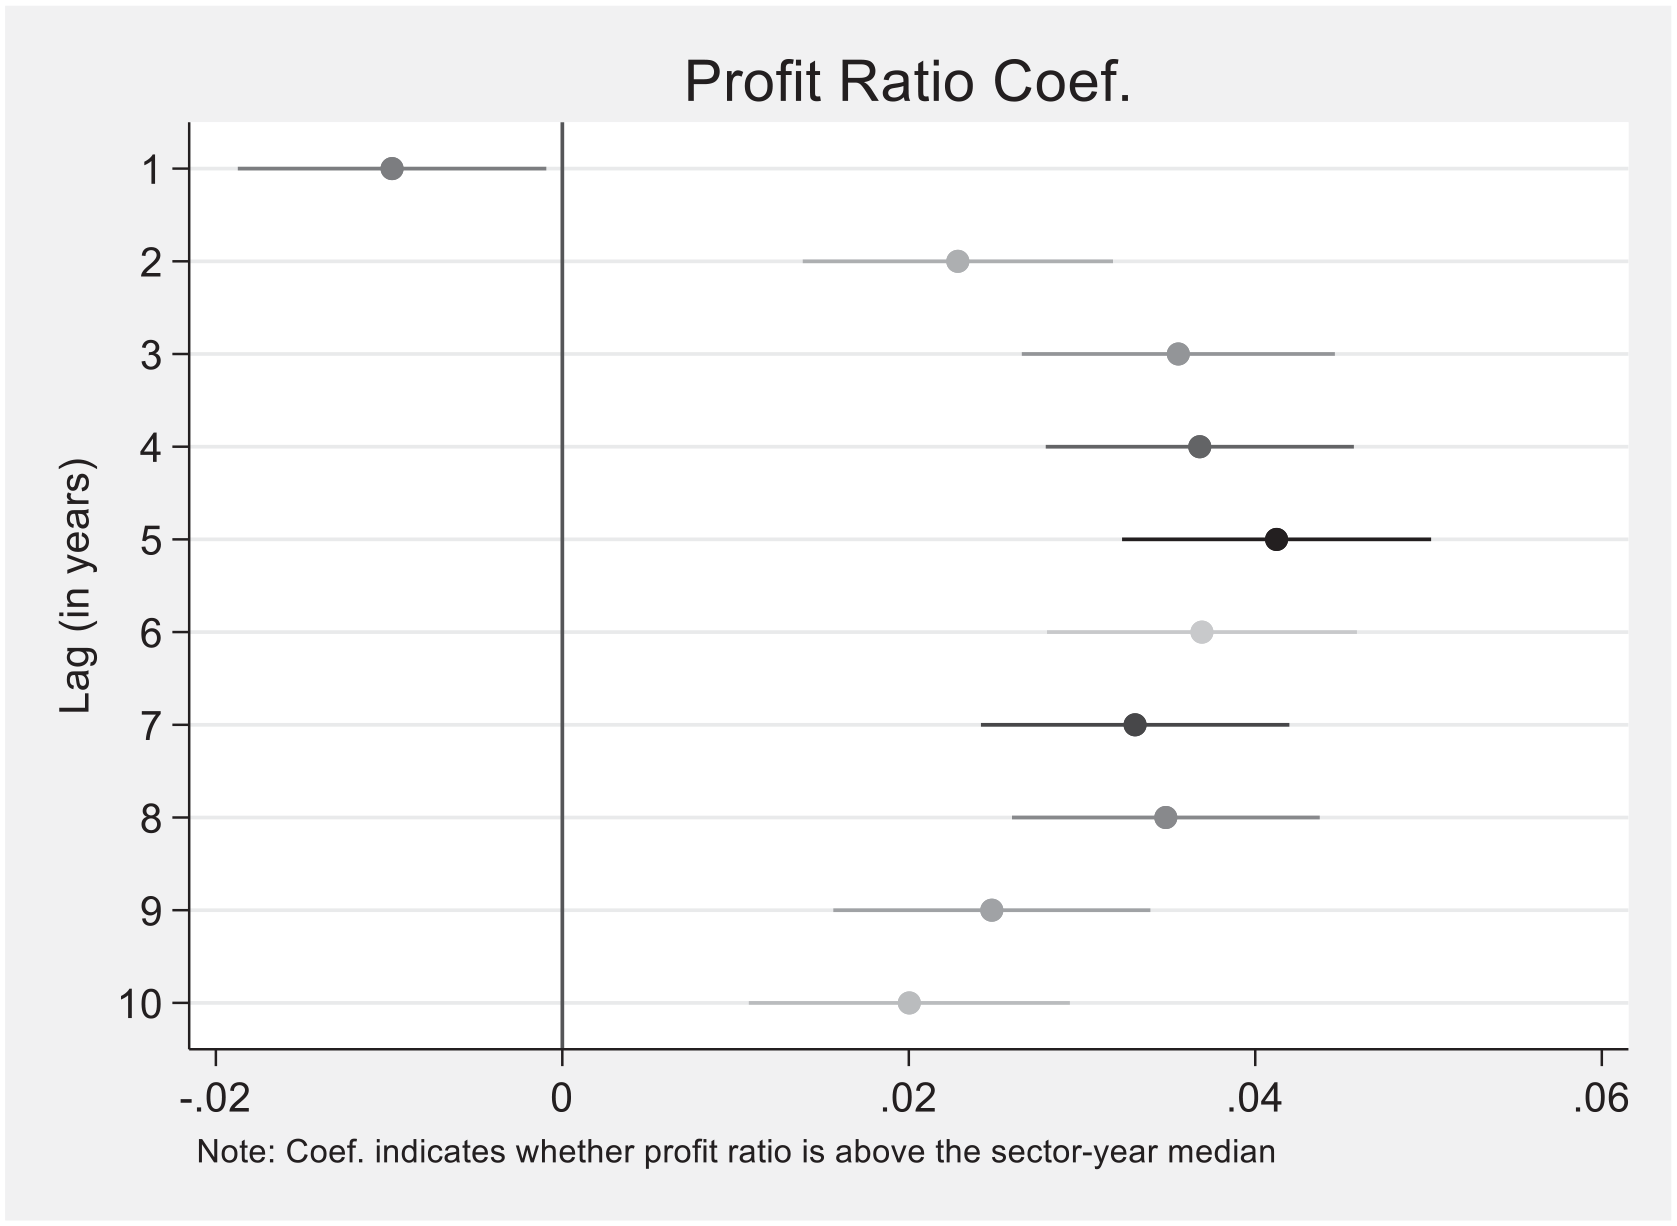
Profit ratio (total margin) effect by lag.
Busting the borrowing norm by incurring an above-median interest expense ratio contributes about 11.33% to total spending over a 10-year period. Figure 6 shows that the effect begins strongly positive and then gradually becomes insignificantly different from 0 by about the seven-year mark. Like reserves or fiscal slack, debt may have a negative connotation but may nevertheless lead to spending growth through the ability to devote money to new programs or additional capacities.
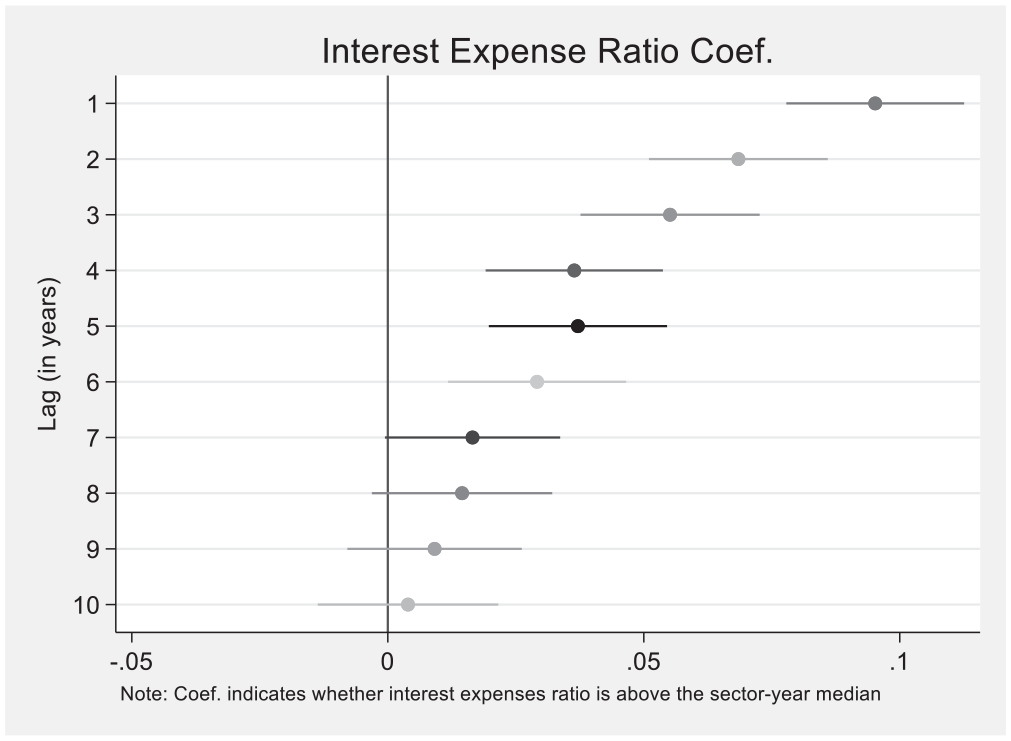
Interest expense ratio by lag.
In total, norm busting across all four domains—minimizing overhead, diversifying revenue, being lean, and avoiding debt—contributes about 53.19% to total spending over a 10-year period, as summarized in Table 5 (results by subsector are provided in the Appendix). 9 Put another way, nonprofits that conform to fiscal probity norms may be significantly constraining their spending growth over a 10-year period. Over time, norm-conformance may significantly reduce the resources that nonprofits have available to spend in the service of their missions.
Cumulative Effect of Norm-Busting.

Note. HHI = Herfindahl–Hirschman Index.
Discussion
Most effects of norm-busting exhibit recognizable temporal patterns. The norm violations with overall negative effects involve above-median administrative spending and years of net assets, but the negative effects diminish over time. For example, maintaining above-median levels of reserves (years of net assets) initially harms total spending, but these harms are quickly reduced to zero in later years.
A more striking pattern holds for the profit ratio. An initial negative effect is quickly overwhelmed by consistently positive effects in subsequent years.
Fundraising and borrowing effects exhibit a different kind of pattern, suggesting strong initial benefits that gradually diminish. It is notable, however, that the median level of borrowing in the sample is zero, which suggests that many nonprofits could potentially benefit from new strategic borrowing. Such borrowing might permit program expansion or investment in organizational infrastructure that improves mission impact. Although borrowing for operations or borrowing excessively may be problematic, nonprofits may have room to use debt more often for appropriate uses.
The effects of revenue concentration on future spending are more ambiguous, but the overall effect appears to be positive. The findings here are consistent with prior research that specialization rather than diversification may lead to superior growth and thus increased spending and impact. Nonprofits, therefore, might be encouraged to focus on appropriate revenue streams and to specialize when growth is a strategic objective. 10
In general, the patterns suggest that the temporal dimension to nonprofit financial management is highly relevant, if often overlooked (Mitchell & Schmitz, 2014). Nonprofits that implement strategies to increase mission impact through spending growth may risk harming their reputations for trustworthiness, but such strategies may pay off in the longer term in the form of increased cumulative spending and mission impact. Although the relationship between organizational trustworthiness and mission performance for any particular nonprofit is necessarily complex and contingent upon a variety of factors, analysis suggests that a tradeoff may exist for some organizations.
Taken together, organizations that violate the nonprofit financial management norms assessed in this research stand to potentially increase their cumulative spending by a factor of about half over a decade. For norm-adhering nonprofits, the forgone spending associated with norm conformance represents sacrificed impact. This forgone impact is the hidden cost of exhibiting trustworthiness.
Certainly, significant limitations to the analysis exist. The SOI data overrepresent larger nonprofits, while the sector is largely populated with smaller organizations. The results presented here should not be generalized to smaller organizations until this type of research can be extended with a more representative sample. Furthermore, the Form 990 data do not contain data on activities, outputs, outcomes, or impacts. As a result, total spending is used as a proxy measure, which may be only a very rough approximation. Finally, although the IRS processes the SOI data “to ensure their fitness for analytical and statistical purposes,” the quality and consistency of the underlying financial reporting by nonprofits should be interpreted with caution. 11
Conclusion
Hansmann’s (1980) theory of the institutional form of the nonprofit organization proposes that nonprofit mission performance is essentially unobservable. Thus, to attract resources, nonprofits must exhibit trustworthiness. This is achieved, in part, by signaling adherence to norms of fiscal propriety specific to the nonprofit sector. The most critical, visible, and accepted norms include the imperatives to minimize overhead, be fiscally lean, diversify revenues, and avoid debt (Mitchell, 2017; Mitchell & Calabrese, 2019). This normative financial management paradigm for nonprofits has been formally codified in the rating, ranking, and certification systems of numerous online information intermediaries. Such systems evaluate nonprofits based on the extent to which they conform to many of the financial norms employed in this research. Indeed, many nonprofits themselves brandish overhead pie charts and third-party “seals of approval” on their websites and in their promotional materials as means of engendering trust. Websites, textbooks, funding eligibility criteria, and informal rules of thumb often repeat or reinforce long-standing norms of nonprofit financial management. But despite the widespread popularity and longevity of this normative financial management paradigm, virtually no systematic empirical evidence has emerged suggesting resultant mission performance benefits for nonprofits and their intended program beneficiaries. Mitchell (2018) postulated that rigid adherence to normative financial management principles could, perhaps counterintuitively, reduce mission impact over time, citing numerous scenarios in which such norms might constrain the abilities of nonprofits to strategically maximize mission impact. This study provides the first empirical support that indeed, adherence to some common nonprofit financial management norms may potentially reduce nonprofit mission impact over time.
Future research could seek to replicate these findings with larger and more representative datasets, particularly datasets containing more smaller organizations. Although panelizing nonprofit SOI data is relatively common, such panels are somewhat idiosyncratic due to the complex sampling strategy used to obtain annual samples in many years. With digital Form 990 data becoming more widely available online, the opportunity for building more comprehensive data files is beginning to present itself. In addition, future research could operationalize nonprofit financial norms differently, include additional potential norms identified by other observers, and examine additional model specifications. Replication using different datasets and methods would help to better ascertain the robustness of the results. Such research might also examine the effects of norm adherence on other organizational outcomes such as organizational survival or demise. Finally, as nonprofit information becomes more readily available and many philanthropic organizations and information intermediaries, including Charity Navigator, move toward assessments of nonprofits informed by cost-effectiveness and mission impact information (Mitchell, 2020; Mitchell & Calabrese, 2020), scholars may soon be able to examine the effects of normative financial management practices on actual nonprofit mission performance. Indeed, if credible mission performance data were to ever become widely available, fiscal probity signaling would presumably become less important and the underlying nonprofit theory may need to be reevaluated.
Footnotes
Appendix
Effects of Norm Busting by Subsector.

| Statistic | Arts, culture, and humanities | Education | Health | Human services | Other |
|---|---|---|---|---|---|
| Within R2 | 0.28 | 0.48 | 0.17 | 0.30 | 0.29 |
| Observations | 3,100 | 4,849 | 3,591 | 6,234 | 7,958 |
| Groups | 505 | 779 | 654 | 1,102 | 1,069 |
| F statistic | 7.18 | 17.45 | 4.08 | 6.79 | 7.65 |
| p value | 0.00 | 0.00 | 0.00 | 0.00 | 0.00 |
| Effects | |||||
| Administrative expense ratio | −13.18% | −17.67% | 2.88% | −12.74% | −12.25% |
| Fundraising expense ratio | −1.25% | 14.39% | 28.86% | −2.68% | 26.42% |
| Revenue concentration (HHI) | 10.82% | 31.40% | 28.36% | 0.56% | 15.40% |
| Years of net assets | −13.02% | −36.24% | −7.77% | 14.14% | −23.20% |
| Profit ratio (total margin) | 19.10% | 51.90% | 41.36% | 28.88% | 27.61% |
| Interest expense ratio | 2.77% | 6.83% | 34.49% | 13.57% | 10.60% |
| Total effect | 5.24% | 50.61% | 128.18% | 41.73% | 44.58% |
Note. HHI = Herfindahl–Hirschman Index.
Acknowledgements
We thank the many individuals who have provided feedback on this research, including attendees of the annual conference of the Association for Research on Nonprofit Organizations and Voluntary Action in 2020 and 2021. We also thank to the attendees of the Seminar Series on Nonprofit Governance hosted by the Gupta Governance Institute Center for Nonprofit Governance at the LeBow College of Business, Drexel University, and the National Center on Nonprofit Enterprise in 2021. We are especially grateful to Teresa Harrison, Richard Steinberg, Dennis Young, and the anonymous reviewers of our manuscript.
Data Availability

Declaration of Conflicting Interests
The author(s) declared no potential conflicts of interest with respect to the research, authorship, and/or publication of this article.
Funding
The author(s) received no financial support for the research, authorship, and/or publication of this article.